Embed Size (px)
Citation preview
.(.3111511111311,..._c_l_a_s_s_r_o_o_m _________ )
ANOMALOUS RESULTS FROM PROCESS SIMULATORS
JAFAR SADEQ, HORACIO A. DUARTE, ROBERT w. SERTH
Texas A&M University-Kingsville • Kingsville, TX 78363
As part of a class assignment in a separations course, students ran an example problem in multicomponent distillation from Holland 's textbook['] on dif
ferent process simulators. Upon compaiison, the results from different simulators were found to differ greatly. Careful examination of both input and output data from the simulation programs revealed no apparent cause for the disparate results.
The simulation results were particularly striking because
• The major chemical species involved were common industrially important petrochemicals having similar molecular structures.
• The processing conditions were very mild, so that nearly ideal conditions should have prevailed in both vapor and liquid phases.
• The same thermodynamic package (SRK equation) was used in all cases.
• One of the simulators produced a solution in almost perfect agreement with Holland 's solution.
The purpose of this paper is to present the simulation results, to identify the cause of the disparity in these results, and to discuss the implications for separation computations.
46
Jafar Sadeq is a graduate student in chemical engineering at TAMUKingsville. He received his BSc degree in chemical engineering from Bangladesh University of Engineering and Technology. Before entering graduate school, he worked in the rubber and plastics division of Bata Shoe Company in Dhaka, Bangladesh. Horacio A. Duarte received his BS from the lnstituto Tecnologico de Durango (Mexico), his MS from ITESM (Mexico), and his PhD from Texas A&M University, all in chemical engineering. He has taught at TAMUKingsville for the past two years. Previously he was research associate at TAMU-College Station and taught at ITESM and lnstituto Tecnologico de Durango, Mexico. Robert W. Serth received his BS from the University of Rochester and his PhD from SUNY-Buffalo, both in chemical engineering. He obtained an MS in mathematics from the University of Arizona. He has taught at TAMU-Kingsville for the past eighteen years. Prior to that he taught at the University of Puerto Rico and was a senior research engineer with Monsanto.
© Copyright ChE Diuision of ASEE 1997
F
WI COLUMN -----D2
W2
COLUMN
Bl
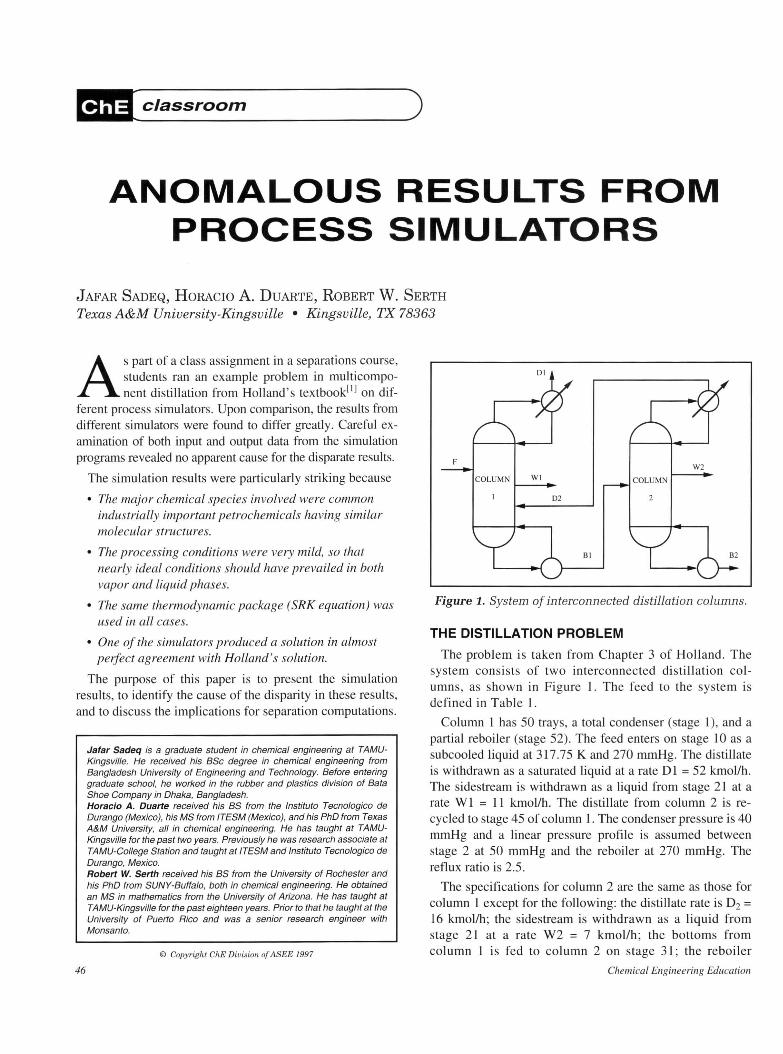
Figure 1. System of interconnected distillation columns.
THE DISTILLATION PROBLEM
The problem is taken from Chapter 3 of Holland. The system consists of two interconnected distillation columns, as shown in Figure 1. The feed to the sys tem is defined in Table 1.
Column 1 has 50 trays, a total condenser (stage 1), and a partial reboiler (stage 52). The feed enters on stage 10 as a subcooled liquid at 317.75 Kand 270 mmHg. The distillate is withdrawn as a saturated liqu id at a rate Dl = 52 kmol/h. The sidestream is withdrawn as a liquid from stage 21 at a rate Wl = 11 kmol/h. The di stillate from column 2 is recycled to stage 45 of column 1. The condenser pressure is 40 mmHg and a linear pressure profile is assumed between stage 2 at 50 mmHg and the reboiler at 270 mmHg. The reflux ratio is 2.5.
The specifications for column 2 are the same as those for column 1 except for the following: the disti llate rate is D2 = 16 kmol/h; the sidestream is withdrawn as a liquid from stage 21 at a rate W2 = 7 kmol/h; the bottoms from column 1 is fed to column 2 on stage 31; the reboiler
Chemical Engineering Education

The results ... demonstrate that errors in pure component parameters can have a surprisingly large effect on separation calculations for narrow-boiling mixtures . ... the values
of these parameters in the simulator data banks should be checked for possible errors when working with these mixtures.
pressure is 250 mmHg rather than 270 mmHg.
RESULTS FROM PROCESS SIMULATORS
The di stillation problem was run on Process (S imulation Sciences), Max (Aspen Technology), and Hysim (Hyprotech). To avoid confusion, "Process" will be referred to herein as "Simsci."
Table 2 compares the flow rates of the two major components in each product stream obtained from the simulators with those given by Holland. Note from Table l that ethylbenzene and styrene account for nearly 99% of the feed to the system. It can be seen that only Max produced results in agreement with Holland 's solution.; the other two simulators
TABLE 1 Feed Composition
Molar Flow
Co111po11e11t Rate (kmollh)
Toluene 0.80
Ethyl benzene 51.00
Styrene 47 .77
Isopropylbenzene 0.05
I-Methyl-3-ethylbenzene 0.01
a -Methylstyrene 0.13
N-Propylbenzene 0.20
TOTAL 99.96
TABLE2
produced results that differ greatly from each other as well as from Holland 's so lution .
The thermodynamic package used in all three process simu lators was the Soave-Redlich-Kwong (SRK) equation of state. Holland 's solution was based on ideal solution/ideal gas K-values, with vapor pressure data in the form of Antoine constants. Enthalpy data as well as Antoine constants were obtained from API Project 44_[Zl
EFFECT OF MINOR COMPONENTS
Because the minor components were present in such small quantities in the feed , it seemed unlikely that they could be the source of such large di screpancies. To verify thi s assumption, the distillation problem was rerun with only ethylbenzene and styrene in the feed. The results , given in Table 3, di splayed only minor differences from the solutions to the original problem.
EFFECT OF PHYSICAL PROPERTY DATA
Physical property data for the ethylbenzene-styrene system were retrieved from the data banks of the three simulators for comparison . None of the simulators contained binary interaction parameters for this system. Values of pure component parameters are shown in Table 4. With our version of HYSIM we were able to retrieve values of the acentric factor. As can be seen from Table 4, the data for ethyl benzene are in good agreement. For styrene, however, there are significant differences among the simulators, particularly in values of critical temperature and acentric factor.
To determine whether these differences were the cause of the anomalous results from the simulators, the values of Tc, Pc, and oo in Simsci were overriden with the Max values and vice-versa. The results ob-
TABLE3 TABLE4 Results From Results from Simulators Excluding Physical Constants from Different
Process Simulators Minor Components Simulators (Flow rates in kmol/h) (Flow rates in kmol/h)
Stream Stream Simsci Max Hysim
ID Compo11e11t Holland Max Simsci Hysim ID Compo11e11t Max Simsci Hysim a) Ethylbenzene
Bl Ethyl benzene 10.11 10.13 19.30 15.22 Bl Ethylbenzene 10.94 19.73 15.67 NBP, K 409.34 409.35 409.27 Bl Styrene 42.53 42.51 33.35 37.42
DI Ethyl benzene 40.95 41.00 34.05 37.47 DI Styrene 10.24 10.16 17.11 13.69
Bl Styrene 42.06 33.27 37.33 T,, K 617.09 617.20 617.09
DI Ethylbenzene 40.56 33.72 37.20 27055 DI Styrene 10.21 17.06 13.57 Pc,mmHg 2707 1 27047
WI Ethylbenzene 5.78 5.82 5.92 5.92 WI Ethylbenzene 5.82 5.92 5.89 (J) 0.304 0.303
WI Styrene 5.19 5.16 5.06 5.05 WI Styrene 5.18 5.08 5.11
B2 Eth y I benzene 3.02 2.90 8.55 5.63 B2 Ethylbenzene 3.23 8.82 5.89 b) Styrene B2 Styrene 26.60 26.76 21.10 24.03 B2 Styrene 26.77 21.18 24.11
BP, K 418.29 418.31 418.27 D2 Ethyl benzene 5.80 5.94 8. 19 7.6 1 D2 Styrene 10.20 10.06 7.81 8.39
D2 Ethylbenzene 6.32 8.30 7.76 T,, K 647. 15 636.00 647.54
D2 Styrene 9.68 7.70 8.24
W2 Ethyl benzene 1.29 1.29 2.56 1.99 W2 Ethylbenzene 1.39 2.60 2.06 Pc, mmHg 30020 28802 29986
W2 Strene 5.71 5.70 4.44 5.00 W2 Styrene 5.61 4.40 4.94 (J) 0.230 0.297
Winter 1997 47

tained with these modifications are shown in Tables 5 and 6. They demonstrate conclusively that the anomalous results were indeed due to differences in physical property data for styrene.
While resolving the cause of the differences among the three simulators, the above results raise a number of other questions:
• Why do the data bases contain such large differences in. physical properties for an important compound like styrene?
• How sensitive are the simulation results to individual differences in. each of the parameters, T0 P0 and OJ ?
• ls the observed sensitivity to differences in physical properties typical of separation problems in general, or is it due to some unique aspect of the ethylbenzene-styrene distillation ?
• To what extent are the observed results due to the choice of thermodynamic package?
• Which of the solutions, if any, is the correct solution to the distillation problem?
These issues are addressed in the remainder of this paper.
PHYSICAL PROPERTIES OF STYRENE
A readily available source (Reid, et al. {3J) lists the following properties for styrene:
• Vapor pressures (Antoine equation)
en( psat) = A - B !(T + C)
where
A = 16.0 193
B = 3328.57
C = -63.72
psat = vapor pressure in mmHg
T = temperature in K (305 K < T < 460 K)
• Critical temperature Tc= 647 K
• Critical pressure Pc= 29944 rnmHg
• Acentric fac tor OJ = 0.257
The critical temperature and pressure reported by Reid , et al., are in general agreement with the values used by Simsci and Hysim. , but their reported acentric factor is inconsistent with their reported vapor pressure and critical properties. An acentric factor consistent with the rest of their reported data is
OJ= 0.23, (w = - log 10 (P;at) - 1.0) Tr=0.7
which is also in good agreement with the value retrieved from the Simsci database.
Checking the computerized database of the Thermodynamics Research Center (TRC) at Texas A&M Universityl41 revealed that there are no measured values for the critical properties of styrene. Hence, all the values of Tc and Pc in the literature and the simulator databases are estimated. The lack of critical data is apparently due to the strong tendency of styrene to polymerize, especially at elevated temperatures_[5l (This is the reason for the vacuum distillation.) Since the acentric factor is determined from vapor pressure and critical point data, the large discrepancy in acentric factor values used by the different process simulators is understandable. 48
There is good agreement between the vapor pressure values of styrene reported by Reid, et al., and the ones reported by TRC in the temperature range of 305 K to 460 K-they agree within ±0.5%. Above 460 K, there are no reported vapor pressure measurements for styrene. Since 460 K corresponds to a reduced temperature greater than 0.7, the vapor pressure value used to determine the acentric factor should be accurate (no extrapolation of vapor pressure measurements involved). In this case, the sources of error in the calculation of OJ are the uncertai nty in the estimated value for the critical temperature and the error in the extrapolation of the experimental vapor
TABLES Comparison of Original Max Solution and
Simsci Solution with Max Parameters (Flow rates in kmol/h)
Stream Original So/utio11 Simsci Solution with ID Compo11e11t from Max Max T,, P,, OJ
Bl Ethylbenzene 10. 13 10.21 Bl Styrene 42.5 1 42.43
DI Ethyl benzene 41.00 41.00 DI Styrene 10.16 10.15
WI Ethyl benzene 5.82 5.82 WI Styrene 5.16 5.1 6
B2 Ethyl benzene 2.90 2.93 B2 Styrene 26.76 26.73
D2 Ethyl benzene 5.94 5.98 D2 Styrene 10.06 10.02
W2 Ethyl benzene 1.29 1.30 W2 Styrene 5.60 5.69
TABLE6 Comparison of Original Simsci solution and
Max solution with Simsci Parameters (Flow rates in kmol/h)
Stream Original Solution Max Solution with ID Compo11e11t from Simsci Simsci T,, P,, OJ
Bl Ethy !benzene 19.30 19.08 Bl Styrene 33.35 33.56
DI Eth y I benzene 34.05 34. 15 DI Styrene 17.11 17.0 1
WI Ethyl benzene 5.92 5.92 WI Styrene 5.06 5.06
B2 Ethyl benzene 8.55 8.41 B2 Styrene 21. 10 21.24
D2 Ethylbenzene 8. 19 8. 15 D2 Styrene 7.8 1 7.85
W2 Ethylbenzene 2.56 2.53 W2 Styrene 4.44 4.47
Chemical Engineering Education

TABLE7 Simulation Solutions with Simsci
Parameters and Two Different Critical Temperatures for Styrene
(Flow rates in kmol/h)
Stream Solutio11 with So/11tio11 with ID Compo11e11t T =647.JSK T = 636.0K
Bl Ethyl benzene 19.08 30.45 Bl Styrene 33.56 22. 19
DI Ethyl benzene 34.15 23.29 DI Styrene 17.01 27.87
WI Ethylbenzene 5.92 5.85 WI Styrene 5.06 5.12
B2 Ethyl benzene 8.41 17.75 B2 Styrene 21.24 11 .89
D2 Ethyl benzene 8. 15 8.59 D2 Styrene 7.85 7.41
W2 Ethyl benzene 2.53 4.11 W2 Styrene 4.47 2.89
TABLES Simulation Solutions with Simsci Parameters and Two
Different Critical Pressures for Styrene (Flow rates in kmol/h)
Stream So/11tio11 with So/11tio11 with ID Compo11e11t P, = 30020 mm Hg P, = 28802 mmHg
Bl Ethyl benzene 19.08 16.86 Bl Styrene 33.56 35.78
DI Ethyl benzene 34. 15 36.04 DI Styrene 17.0 1 15. 12
WI Ethyl benzene 5.92 5.96 WI Styrene 5.06 5.0 1
B2 Ethyl benzene 8.41 6.78 B2 Styrene 21.24 22.87
D2 Ethyl benzene 8. 15 7.86 D2 Styrene 7.85 8. 14
W2 Ethyl benzene 2.53 2.22 W2 Styrene 4.47 4.77
TABLE9 Simulation Solutions with Simsci
Parameters and Two Different Acentric Factors for Styrene (Flow rates in kmol/h)
Stream So/11tio11 with So/11tio11 with ID Compo11e11t co = 0.230 co = 0.297
Bl Ethyl benzene 19.08 !.3E-03 Bl Styrene 33.56 52.61
DI Ethyl benzene 34. 15 47.65 DI Styrene 17.01 3.5 1
WI Ethyl benzene 5.92 3.33 WI Styrene 5.06 7.60
B2 Ethyl benzene 8.41 3.9E-05 B2 Styrene 21.24 29.70
D2 Ethyl benzene 8.1 5 I.IE-3 D2 Styrene 7.85 15.95
W2 Ethyl benzene 2.53 1.42E-04 W2 Styrene 4.47 6.95
Winter 1997
pressure to obtain a value for the critical pressure .
A value of 418.3 K for the normal boiling point of styrene was used to estimate its critical temperature. Three different methods were used: Lydersen's method ,l6l Ambrose's method,l31 and the Joback modification of Lydersen's method_ l3l The estimated critica l temperatures were 635 K, 635 K, and 639K, respectively . The value of 635 K is in good agreement with that of Max (63 6 K ), but it does not agree with the Simsci and Hysim value (647 K).
The acentric fac tor for styrene was calculated using the vapor pressure equation from Reid , et al. , the vapor pressure data from TRC, and a critical temperature of 636 K. Critical pressure was obtained by extrapolation of the vapor pressure data to the critical temperature. The vapor pressure equation from Reid, et al. , produced a critical pressure value of 26983 mmHg and an acentric factor of 0 .26, whi le the vapor pressure equation from TRC yielded a critical pressure of 28043 mrnHg and an acentric factor of 0 .28. The differences are due to the error in the extrapolation of the vapor pressure to obtain the critical pressure. A difference in criti cal pressure of 3.8% produced a difference of 7% in the acentric factor. The critical pressure and acentri c factor obtai ned with the TRC vapor pressure eq uation are in relatively good agreement with the values used by Max cPc = 28802 mmHg and co = 0.297). Using a critical pressure of 28802 mmHg in the calcul ation of the acentric factor produced a value of w = 0 .30 with both sets of vapor pressure data .
To summarize, values of Tc, Pc, and co reported in the literature for styrene are in general agreement with the values in the Simsci and Hysim data banks. However, standard estimation procedures yield values that are consistent with those in the Max data bank.
SENSITIVITY OF SOLUTION TO CHANGES IN Tc, Pc, AND co
In order to determine the effect of each individual parameter on the solution, simulation runs were made using Simsci parameters except that for styrene, Max values were substituted for either Tc, Pc, or co. Results of these simulations (which were run using Max) are given in Tables 7, 8, and 9. As can be seen, each parameter had a significant effect on the solution , but Tc and co had the greatest impact. Interestingly, the effects of Tc and co are in opposite directions, so that the individual effects are greater than the combined effect of both parameters. The relative changes in parameter values for these runs were, from Table 4b, 1.7% for Tc, 4% for Pc, and 29% for co.
Additional runs were made in which the styrene acentric factor was varied from 0 .230 to 0.275 . Simsci val ues were used for all other parameters. The effect of co on the bottoms composition from column 1 is shown in Table 10. (The slight discrepancy between the data in Tables 9 and 10 is
TABLE 10 Effect of Styrene Accentric Factor on Separation
co % Styrene in Bl co % Styrene in Bl
0.230 62.83 0.265 83.28
0.245 70.60 0.270 87.36
0.250 75.50 0.275 9 1.50
0.260 79.81
49

due to the fact that the former were obtained from runs on Max and the latter from runs on Simsci.
The effects of the parameters on relative volatility in column 1 are shown in Table 11. (The values for column 2 were similar.) These data were generated using Max with various combinations of the Max and Simsci parameter values as indicated in Table 11 . The first two columns of the table give the volatility profiles obtained with all Simsci parameters and all Max parameters, respectively. The volatilities for the two cases are nearly identical at the bottom, but differ significantly over most of the column. Changing individual parameters dramatically alters the volatility as shown in the last four columns of the table. Within the ranges of parameters considered, the data display an apparent reversal in the volatilities of the two components (column 6) and an apparent azeotrope (column 4). Obviously, such differences in relative volatility will greatly affect the separation achieved in the simulations.
COMPARISON WITH OTHER BINARY SYSTEMS
Ethylbenzene and styrene constitute a narrow boiling system with a difference in normal boiling points of 9 K. Since the relative volatility is close to unity, differences in Kvalues due to differences in T 0 Pc, or w can have a large effect on the calculated solution.
By the same reasoning, smaller effects would be expected for systems with wider boiling ranges. Calculations were made for the toluene-styrene system (normal boiling point difference of 35 K) and the benzene-styrene system (normal boiling point difference of 65 K) for comparison with the ethylbenzene-styrene system. A modified system consisting of a single column with 20 internal trays, a total condenser and partial reboiler was used. Operating conditions were the same as in Column 1 of the original problem. Feed rate, sidedraw rate, and reflux ratio were unchanged. Feed entered on stage 8 (condenser= stage 1) as a subcooled liquid at 317 .75 Kand 270 mmHg. The bottoms flow rate was specified at 60 kg mole/h. Simulations were run on Simsci using Simsci parameters except for the styrene acentric factor, which was varied from 0.20 to 0.32. The results, shown in Table 12, confirm the expected trend with width of boiling range.
COMPARISON WITH OTHER THERMODYNAMIC PACKAGES
In order to determine the sensitivity of the results to the choice of thermodynamic routine, runs were made with a number of thermodynamic packages other than the SRK equation.
• Generalized Cubic Equations of State • The use of other cubic equations, such as Peng-Robinson, had very little effect on the results, as would be expected.
• Ideal Thermodynamic Package • The assumptions of
50
ideal gas behavior in the vapor phase and ideal solution behavior in the liquid phase should provide a good approximation for the system under consideration. As previously mentioned, Holland' s solution is based on these assumptions. The only property data needed to obtain a solution are then pure component vapor and liquid enthalpies and vapor pressures. (In Max, however, critical temperature is used to estimate latent heat of vaporization, which in turn is used to calculate liquid enthalpy.)
Solutions for the original seven-component system obtained using Max and Simsci are compared with Holland 's solution in Table 13. The three solutions are in reasonably good agreement. However, the Max solution still agrees significantly better with Holland' s results than does the Simsci solution .
• UNIFAC Thermodynamic Package • The UNIFAC thermodynamic package in Max uses the generalized RedlichK wong equation of state for the vapor phase and the UNIF AC group contribution method for liquid-phase activity coefficients. An activity coefficient method would normally not be used in the present application since the liquid phase behavior should be nearly ideal . However, its use permits the separation of vapor-phase and liquid-phase effects of Tc and Pc. Vapor fugacities are computed with the Redlich-
TABLE 11 Effect of Tc, Pc, and (J) on Relative Volatility (KEB/Kstyrene) in
Stage
13
26
39
52
Column 1 (S = Simsci value, M = Max value)
T, = S T, = M T, = S T, = M T, = S P, = S P, = M P, = S P, = M P,. =M (J) = s W=M w=M (J) = s w=M
1.17 1.42 1.79 0.95 1.85
I.I 9 1.38 1.69 0.98 1.76
1.20 1.36 1.67 0.998 1.7 I
1.20 1.34 1.64 1.01 1.68
1.32 1.34 1.61 1.02 1.65
TABLE 12 Effect of Acentric Factor in Systems with
Different Boiling Ranges (Flow rates in kmol/h)
T, = M P, = S (J) = s
0.91
0.94
0.96
0.97
0.97
% Styrene i11 Bottoms % Styrene i11 Bottoms % Styrene i11 Bottoms for Be11 ze11e-Styre11e for To/11ene-Styre11e for Ethylbenze11e-Styre11e
System System System (J) !J. Tb= 65 K !J.T, = 35 K !J.Tb = 9 K
0.20 73.92 72. 10 48.60
0.23 74.04 72.84 55 .20
0.26 74.14 73.26 61.20
0.28 74.1 9 73.47 64.40
0.32 74.28 73.81 69.60
Chemical Engineering Education

Kwong equation, which uses Tc and Pc, while the liquid phase calculations using UNIFAC do not involve Tc and Pc. (The Poynting correction factor involves critical parameters since the Rackett equation is used to calculate liquid density . However, this factor is essentiall y unity at conditions in the distillation system.)
Results obtained for the original sevencomponent system using Max with both Max and Simsci parameters are shown in Table 14. The two sets of values are nearly identical , demonstrating that effects of Tc and Pc in the simulations using the SRK equation are confined to the liquid phase in the present application. This result is logi-
TABLE 13 Comparison of Solutions Obtained Using
Ideal Thermodynamic Package (Flow rates in kmol/h)
Stream Major Max Simsci Holland's ID Component Solution Solution Solution
Bl Ethyl benzene 9.86 8.49 10. 11 Bl Styrene 42.78 44.15 42.53
DI Ethyl benzene 41.06 41.90 40.95 DI Styrene 10.10 9.26 10.24
WI Ethyl benzene 5.78 5.73 5.78 WI Styrene 5.19 5.24 5.19
B2 Ethyl benzene 2.9 1 2.35 3.02 B2 Styrene 26.75 27.30 26.62
D2 Ethyl benzene 5.70 5.07 5.80 D2 Styrene 10.30 10.92 10.20
W2 Ethyl benzene 1.25 1.06 1.29 W2 Styrene 5.73 5.92 5.71
TABLE 14 Comparison of Solutions Obtained Using
UNIFAC Thermodynamic Package in Max (Flow rates in kmol/h)
Stream Major Solution with Solution with ID Component Max Parameters Simsci Parameters
Bl Ethyl benzene 9.72 9.90 Bl Styrene 42.92 42.74
DI Ethylbenzene 41.05 41.03 DI Styrene 10.11 10.12
WI Ethy I benzene 5.76 5.78 WI Styrene 5.21 5.19
B2 Ethy I benzene 2.96 2.93 B2 Styrene 26.70 26.73
D2 Ethylbenzene 5.52 5.72 D2 Styrene 10.48 10.28
W2 Ethyl benzene 1.23 1.26 W2 Styrene 5.75 5.73
Winter 1997
cal since at the very low pressures in the distillation system, the vapor-phase fugacity coefficients should be close to unity and insensitive to errors in critical parameters.
WHICH SOLUTION IS CORRECT?
The results presented above suggest that of the original solutions generated by the three simulators, the solution generated by Max is the correct one. The reasons are:
• The critical data for styrene in the Max data bank are consistent with the Lydersen and Ambrose correlations, while those in the Simsci and Hysim data banks are not.
• The solutions generated by Max using the SRK equation of state and ideal thermodynamics are consistent, while those generated by Simsci ( and presumably Hysim as well) are not. Since both thermodynamic packages should be applicable to the distillation system, the solutions should be consistent.
• The solution generated by Max is consistent with Holland 's solution.
CONCLUSIONS
The results presented above demonstrate that errors in pure component parameters can have a surprisingly large effect on separation calculations for narrowboiling mixtures. Therefore, the values of these parameters in the simulator data banks should be checked for possible errors when working with these mixtures.
In the present case, comparison wi th published data would probably not have disclosed the problem since the published data for styrene critical properties agree with the Simsci and Hysim values. Nevertheless, this should be done. (In an unrelated application, for example, we found in this manner an error in a specific heat in a simulator data bank that caused an incorrect heat exchanger design.) In addition, the data should be checked for consistency with property estimation techniques; large discrepancies may indicate a problem with the data and should be cause for concern.
As recently pointed out by Kister, 171 there is a good deal more involved in process simulation than si mply typing in data and obtaining a converged solution. Students need to learn to subject the results obtained from simulators to the same kind of rigorous scrutiny as any other engineering calculation. Inclusion in the curriculum of examples such as the one presented here can help make thi s point more forcefully than any amount of cautionary lecturing by instructors.
REFERENCES 1. Holland, C.D. , Fundamentals of Multicomponent Distillation, McGraw-Hill, New
York, NY (1981)
2. Anonymous, Selected Values of Properties of Hydrocarbons and R elated Compounds, American Petroleum Institute Research Project 44, Thermodynamics Research Center, College Station, TX (1978)
3. Reid, R.C., J.M. Prausnitz, and B.E. Poling, The Properties of Gases and Liquids, 4th ed., McGraw-Hill , New York, NY (1987)
4. Anonymous, TRC Thermodynamic Tables, Hydrocarbons, Thermodynamics Research Center, The Texas A&M University System, College Station, TX (1995)
5. Noller, C.R., Chemistry of Organic Compounds, 2nd ed., W. B. Saunders Co., Philadelphia, PA (1958)
6. Reid, R.C ., T.K. Sherwood, and J .M. Prausnitz, The Properties of Gases and Liquids, 3rd ed., McGraw-Hill , New York, NY (1977)
7. Kister,, H.Z. "Troubleshoot Distillation Simulations," Chem. Eng. Prag., 91, 63, June (1995) 0
5/