Embed Size (px)
Citation preview

Jackson Blue Spring and Merritts Mill Pond Basin Management Action Plan
Division of Environmental Assessment and Restoration Water Quality Restoration Program
Florida Department of Environmental Protection
with participation from the Jackson Blue Spring Basin Stakeholders
June 2018
2600 Blair Stone Rd. Tallahassee, FL 32399
floridadep.gov
Jackson Blue Spring Basin Management Action Plan (BMAP), June 2018
Page 2 of 75
Acknowledgments
The Florida Department of Environmental Protection adopted the Jackson Blue Basin Management Action Plan by Secretarial Order as part of its statewide watershed management approach to restore and protect Florida's water quality. The plan was developed in coordination with stakeholders, identified below, with participation from affected local, regional, and state governmental interests; elected officials and citizens; and private interests.
Florida Department of Environmental Protection Noah Valenstein, Secretary
Table A-1. Jackson Blue Basin stakeholders Type of Entity Name
Responsible Stakeholders
Agricultural producers Jackson County Town of Malone Town of Bascom
Responsible Agencies
Florida Department of Agriculture and Consumer Services Florida Department of Environmental Protection
Florida Department of Health Florida Fish and Wildlife Conservation Commission
Northwest Florida Water Management District
Other Interested Stakeholders
Homeowners/Citizens Florida Farm Bureau Federation
Florida Onsite Wastewater Association Florida Springs Council Florida Springs Institute
Jackson County Soil and Water Conservation District University of Florida Institute of Food and Agricultural Sciences
Appendix A contains links to important sources referenced in this document. For additional information on the watershed management approach for the Jackson Blue Spring Basin, contact:
Terry Hansen, P.G., FCCM Professional Geologist Administrator Florida Department of Environmental Protection Water Quality Restoration Program, Watershed Planning and Coordination Section 2600 Blair Stone Road, Mail Station 3565 Tallahassee, FL 32399-2400 Email: [email protected] Phone: (850) 245–8561
Jackson Blue Spring Basin Management Action Plan (BMAP), June 2018
Page 3 of 75
Table of Contents
Acknowledgments .................................................................................................... 2
Table of Contents ..................................................................................................... 3
List of Figures ........................................................................................................... 5
List of Tables ............................................................................................................ 6
List of Acronyms and Abbreviations ..................................................................... 7
Executive Summary ................................................................................................. 9
Section 1 : Background .......................................................................................... 14 1.1 Legislation ...................................................................................................................14 1.2 Water Quality Standards and Total Maximum Daily Loads (TMDLs) ...............14 1.3 BMAP Requirements .................................................................................................15 1.4 BMAP Area ................................................................................................................15 1.5 Priority Focus Area (PFA) ........................................................................................15 1.6 Other Scientific and Historical Information ...........................................................18 1.7 Stakeholder Involvement...........................................................................................18 1.8 Description of BMPs Adopted by Rule ....................................................................19
Section 2 : Implementation to Achieve the TMDLs ........................................... 20 2.1 Allocation of Pollutant Loads ...................................................................................20 2.2 Prioritization of Management Strategies .................................................................25 2.3 Load Reduction Strategy ...........................................................................................26 2.4 OSTDS Management Strategies ...............................................................................27 2.5 UTF Management Strategies ....................................................................................29 2.6 STF Management Strategies .....................................................................................30 2.7 Agricultural Sources Management Strategies and Additional Reduction
Options ........................................................................................................................30 2.8 WWTF Management Strategies ...............................................................................33 2.9 Atmospheric Deposition Management Strategies ...................................................34 2.10 Future Growth Management Strategies ..................................................................35 2.11 Protection of Surface Water and Groundwater Resources through Land
Conservation ..............................................................................................................35 2.12 Commitment to Implementation ..............................................................................36
Section 3 : Monitoring and Reporting ................................................................. 37 3.1 Methods for Evaluating Progress .............................................................................37 3.2 Adaptive Management Measures .............................................................................37 3.3 Water Quality and Biological Monitoring ...............................................................38
Appendices .............................................................................................................. 44

Jackson Blue Spring Basin Management Action Plan (BMAP), June 2018
Page 4 of 75
Appendix A. Important Links ...........................................................................................44 Appendix B. Projects to Reduce Nitrogen Sources ..........................................................45 Appendix C. PFA Report ...................................................................................................50 Appendix D. OSTDS Remediation Plan ...........................................................................51 Appendix E. NSILT Report ...............................................................................................57 Appendix F. FDACS Information on BMPs ....................................................................61 Appendix G. Future Growth Strategies of Local Jurisdictions ......................................71
Jackson Blue Spring Basin Management Action Plan (BMAP), June 2018
Page 5 of 75
List of Figures
Figure ES- 1. Jackson Blue BMAP and PFA boundaries ..............................................................10 Figure 1. Jackson Blue BMAP and PFA boundaries .....................................................................16 Figure 2. Loading to groundwater by source in the BMAP area ...................................................24 Figure 3. OSTDS locations in the BMAP area ..............................................................................28 Figure 4. Groundwater and surface water stations sampled in the Jackson Blue BMAP area ......41 Figure D-1. OSTDS locations in the BMAP area ..........................................................................55 Figure F-1. Agricultural lands in the Jackson Blue Springshed and Merritts Mill Pond Basin ....64 Figure F- 2. BMP enrollment in the Jackson Blue Springshed and Merritts Mill Pond as of
December 31, 2018..................................................................................................67

Jackson Blue Spring Basin Management Action Plan (BMAP), June 2018
Page 6 of 75
List of Tables
Table A-1. Jackson Blue Basin stakeholders ...................................................................................2 Table ES-1. WWTF effluent standards ..........................................................................................12 Table 1. Restoration targets for Jackson Blue Spring and Merritts Mill Pond ..............................14 Table 2. BMPs and BMP manuals adopted by rule as of June 2017 .............................................19 Table 3. Estimated nitrogen load to groundwater by source in the BMAP area ...........................21 Table 4. Total reductions to meet the TMDLs ...............................................................................25 Table 5. Nitrogen reduction schedule (lb-N/yr) .............................................................................25 Table 6. Summary of potential credits for Jackson Blue Spring Basin projects to meet the
TMDLs ....................................................................................................................26 Table 7. Current project credits to reduce UTF loading to groundwater .......................................29 Table 8. Maximum UTF load reductions based on existing public education credit policies .......30 Table 9. Estimated acreages for additional agricultural projects and practices .............................32 Table 10. Potential for additional load reductions to groundwater ................................................32 Table 11. Wastewater effluent standards for the BMAP area .......................................................34 Table 12. Stakeholder conservation land purchases in the BMAP area ........................................35 Table 13. Core water quality indicators .........................................................................................39 Table 14. Supplemental water quality indicators and field parameters .........................................39 Table 15. Biological response measures for spring runs ...............................................................42 Table B-1. Stakeholder projects to reduce nitrogen sources ..........................................................46 Table D-1. Estimated reduction credits for OSTDS enhancement or sewer* ...............................53 Table E-1. Range of environmental attenuation of nitrogen from a detailed literature review .....59 Table F-1. Agricultural land use within the Jackson Blue Springshed and ...................................61 Table F-2 Fertilized crop lands within the Jackson Blue Springshed and .....................................62 Table F-3. Livestock lands within the Jackson Blue Springshed and............................................62 Table F-4. Agricultural acreage and BMP enrollment in the Jackson Blue Springshed and
Merritts Mill Pond Basin as of December 31, 2017 ................................................68 Table F-5. Beyond BMP implementation ......................................................................................70 Table G-1. Future growth strategies of Jackson County................................................................71

Jackson Blue Spring Basin Management Action Plan (BMAP), June 2018
Page 7 of 75
List of Acronyms and Abbreviations
AWT Advanced Wastewater Treatment ATU Aerobic Treatment Unit BAF Biochemical Attenuation Factor BMAP Basin Management Action Plan BMPs Best Management Practices CAFO Concentrated Animal Feeding Operation CASTNET Clean Air Status and Trends Network cfs Cubic Feet Per Second CMAQ Community Multiscale Air Quality CoA Census of Agriculture CRF Controlled Release Fertilizer DEP Florida Department of Environmental Protection DMR Discharge Monthly Report DO Dissolved Oxygen ELM Environmental Landscape Management F.A.C. Florida Administrative Code F.A.R. Florida Administrative Register FDACS Florida Department of Agriculture and Consumer Services FDOH Florida Department of Health FF Farm Fertilizer FGS Florida Geological Survey FLUCCS Florida Land Use Cover and Forms Classification System FOWA Florida Onsite Wastewater Association FSA Farm Service Agency FSAID Florida Statewide Agricultural Irrigation Demand F.S. Florida Statutes FY Fiscal Year FYN Florida Yards and Neighborhoods GIS Geographic Information System gpd Gallons Per Day HA Habitat Assessment IA Implementation Assurance IV Implementation Verification in/yr Inch Per Year lb-N/yr Pounds of Nitrogen Per Year LVS Linear Vegetation Survey LW Livestock Waste MFL Minimum Flow and Level mg/L Milligrams Per Liter N/A Not Applicable NADP National Atmospheric Deposition Program

Jackson Blue Spring Basin Management Action Plan (BMAP), June 2018
Page 8 of 75
NASS National Agricultural Statistics Service NELAC National Environmental Accreditation Conference NELAP National Environmental Accreditation Program NFWF National Fish and Wildlife Foundation NOI Notice of Intent NSF NSF International (formerly National Sanitation Foundation) NSILT Nitrogen Source Inventory Loading Tool NTN National Trends Network NWFWMD Northwest Florida Water Management District OAWP Office of Agricultural Water Policy (FDACS) OFS Outstanding Florida Spring OWF Outstanding Florida Water OSTDS Onsite Sewage Treatment and Disposal System PBTS Performance-based Treatment System PFA Priority Focus Area PNRS Passive Nitrogen Sedimentation System PSA Public Service Announcement QA/QC Quality Assurance/Quality Control RIB Rapid Infiltration Basin RPS Rapid Periphyton Survey SBIO DEP Statewide Biological Database SCI Stream Condition Index SOP Standard Operating Procedure SSURGO Soil Survey Geographic Database STF Sports Turfgrass Fertilizer STORET Florida Storage and Retrieval System SWFWMD Southwest Florida Water Management District SWIM Surface Water Improvement and Management TBD To Be Determined TDEP Total Atmospheric Deposition Model TMDL Total Maximum Daily Load TN Total Nitrogen TP Total Phosphorus TSS Total Suspended Solids UFA Upper Floridan Aquifer UF–IFAS University of Florida Institute of Food and Agricultural Sciences USDA U.S. Department of Agriculture UTF Urban Turfgrass Fertilizer WBID Waterbody Identification (Number) WIN Florida Watershed Information Network (Database) WMD Water Management District WWTF Wastewater Treatment Facility
Jackson Blue Spring Basin Management Action Plan (BMAP), June 2018
Page 9 of 75
Executive Summary
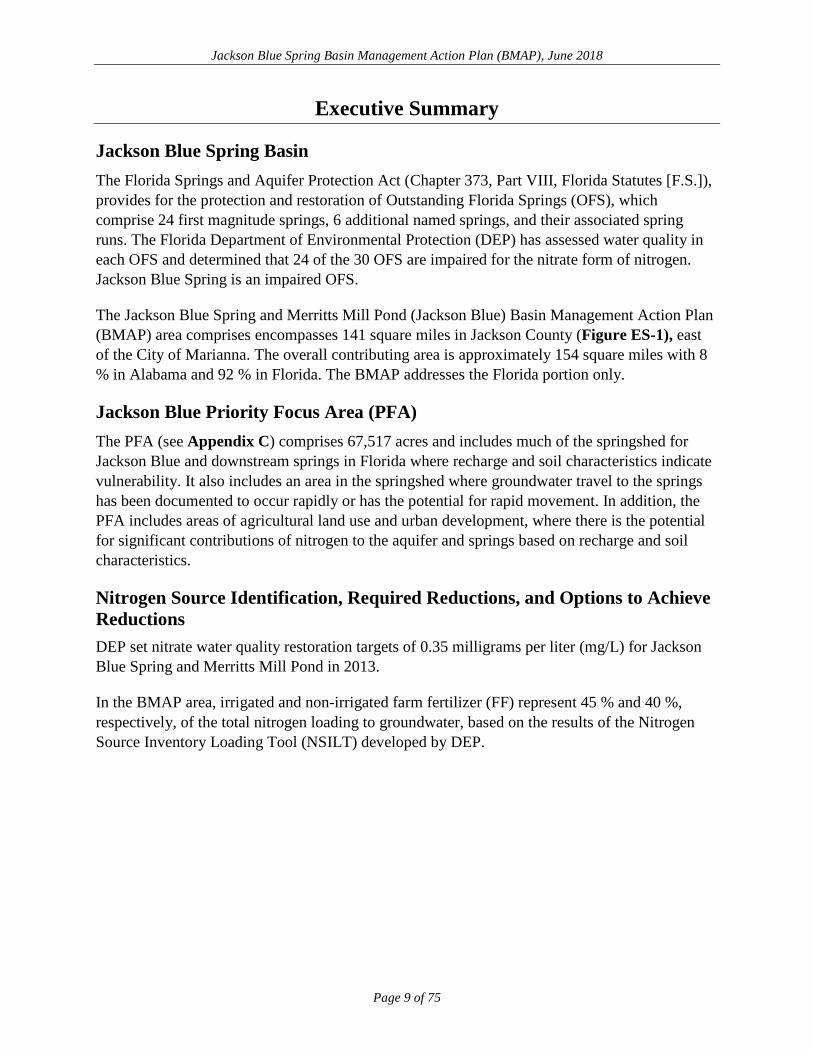
Jackson Blue Spring Basin The Florida Springs and Aquifer Protection Act (Chapter 373, Part VIII, Florida Statutes [F.S.]), provides for the protection and restoration of Outstanding Florida Springs (OFS), which comprise 24 first magnitude springs, 6 additional named springs, and their associated spring runs. The Florida Department of Environmental Protection (DEP) has assessed water quality in each OFS and determined that 24 of the 30 OFS are impaired for the nitrate form of nitrogen. Jackson Blue Spring is an impaired OFS.
The Jackson Blue Spring and Merritts Mill Pond (Jackson Blue) Basin Management Action Plan (BMAP) area comprises encompasses 141 square miles in Jackson County (Figure ES-1), east of the City of Marianna. The overall contributing area is approximately 154 square miles with 8 % in Alabama and 92 % in Florida. The BMAP addresses the Florida portion only.
Jackson Blue Priority Focus Area (PFA) The PFA (see Appendix C) comprises 67,517 acres and includes much of the springshed for Jackson Blue and downstream springs in Florida where recharge and soil characteristics indicate vulnerability. It also includes an area in the springshed where groundwater travel to the springs has been documented to occur rapidly or has the potential for rapid movement. In addition, the PFA includes areas of agricultural land use and urban development, where there is the potential for significant contributions of nitrogen to the aquifer and springs based on recharge and soil characteristics.
Nitrogen Source Identification, Required Reductions, and Options to Achieve Reductions DEP set nitrate water quality restoration targets of 0.35 milligrams per liter (mg/L) for Jackson Blue Spring and Merritts Mill Pond in 2013.
In the BMAP area, irrigated and non-irrigated farm fertilizer (FF) represent 45 % and 40 %, respectively, of the total nitrogen loading to groundwater, based on the results of the Nitrogen Source Inventory Loading Tool (NSILT) developed by DEP.

Jackson Blue Spring Basin Management Action Plan (BMAP), June 2018
Page 10 of 75
Figure ES- 1. Jackson Blue BMAP and PFA boundaries
Jackson Blue Spring Basin Management Action Plan (BMAP), June 2018
Page 11 of 75
The total load reduction required to meet the total maximum daily loads (TMDLs) at the spring vent is 651,982 pounds of nitrogen per year (lb-N/yr). To measure progress towards achieving the necessary load reduction, DEP has established the following milestones:
• Initial reduction of 195,595 lb-N/yr (30 %) within 5 years.
• An additional 325,991 lb-N/yr (50 %) within 10 years.
• The remaining 130,396 lb-N/yr (20 %) within 15 years.
• For a total of 651,982 lb-N/yr within 20 years.
The policies and submitted projects included within this BMAP are estimated to achieve a reduction of 170,695 to 421,064 lb-N/yr to groundwater. While reductions to groundwater will benefit the spring, it is uncertain to know with precision how those reductions will impact the necessary reductions at the spring. DEP will continue to monitor the spring to evaluate those reductions as projects are implemented against the required load reductions above. The BMAP is designed to achieve 80 % of the load reductions needed for the spring vent within 10 years of adoption and 100 % within 15 years. Projects are designed for nitrogen removal, but are expected to achieve phosphorus reductions as well. DEP will evaluate progress towards these milestones and will report to the Governor and Florida Legislature. DEP will adjust management strategies to ensure the target concentrations are achieved.
For the list of projects to improve water quality, see Appendix B. Possible load reductions include projects resulting from policies for owner-implemented best management practices (BMPs) for farm fertilizer (FF) and livestock waste (LW); and voluntary onsite sewage treatment and disposal system (OSTDS) conversions enhancements or conversions to sewer.
Successful BMAP implementation requires commitment, dedicated state funding, and follow-up. Stakeholders have expressed their intention to carry out the plan, monitor its effects, and continue to coordinate within and across jurisdictions to achieve nutrient reduction goals. As the TMDLs must be achieved within 20 years, DEP, water management districts (WMDs), Florida Department of Health (FDOH), and Florida Department of Agriculture and Consumer Services (FDACS) will implement management strategies using the annual Legacy Florida appropriation from the legislature of at least $50 million to reduce nitrogen in impaired OFS. DEP, working with the coordinating agencies, will continue to invest existing funds and explore other opportunities and potential funding sources for springs restoration efforts.
Restoration Approaches Load reduction to the aquifer is needed to achieve the load reductions requirements at the spring vent. To ensure that load reductions are achieved at the spring vent, the following restorations actions are being established. These actions are designed to reduce the amount of nutrients to the

Jackson Blue Spring Basin Management Action Plan (BMAP), June 2018
Page 12 of 75
aquifer, which will reduce the load at the vent and ultimately achieve the necessary reductions. Monitoring of the vent during implementation will be implemented to monitor progress.
• New OSTDS – Upon BMAP adoption, the OSTDS remediation plan prohibits new systems on lots of less than 1 acre within the PFAs, unless the system includes enhanced treatment of nitrogen as defined by the OSTDS remediation plan, or unless the OSTDS permit applicant demonstrates that sewer connections will be available within 5 years. The OSTDS remediation plan is incorporated as Appendix D.
• Wastewater Treatment Facilities (WWTFs) – Although there are no WWTFs currently in the BMAP area, for consistency with other springs-related BMAPs, the effluent standards listed in Table ES-1 will apply to future WWTFs in the BMAP area.
Table ES-1. WWTF effluent standards gpd = Gallons per day
95% of the Permitted Capacity Gallons per Day (gpd)
Nitrogen Concentration Limits for Rapid Infiltration Basins (RIBs) and Absorption Fields
(mg/L)
Nitrogen Concentration Limits for All Other Land Disposal Methods, Including Reuse
(mg/L) Greater than 100,000 3 3
20,000 to 100,000 3 6 Less than 20,000 6 6
• Urban Turfgrass Fertilizer (UTF) – UTF sources can receive up to 6 % credit for the DEP-approved suite of public education and source control ordinances. Sources have the option to collect and provide monitoring data to quantify reduction credits for additional measures.
• Sports Turfgrass Fertilizer (STF) – STF sources include golf courses and other sporting facilities. Golf courses can receive up to 10 % credit for implementing the Golf Course BMP Manual. Other sports fields can receive up to 6 % credit for managing their fertilizer applications to minimize transport to groundwater.
• FF – All FF sources are required to implement BMPs or perform monitoring to demonstrate compliance with the TMDL. A 15 % reduction to groundwater is estimated for owner-implemented BMPs. Additional credits could be achieved through better documentation of reductions achieved through BMP implementation or the implementation of additional agricultural projects and practices, such as precision irrigation, soil moisture probes, controlled release fertilizer, and cover crops.
• LW – All LW sources are required to implement BMPs or perform monitoring. A 10 % reduction to groundwater is estimated for owner-implemented BMPs.

Jackson Blue Spring Basin Management Action Plan (BMAP), June 2018
Page 13 of 75
Additional credits could be achieved through better documentation of reductions achieved through BMP implementation.
Jackson Blue Spring Basin Management Action Plan (BMAP), June 2018
Page 14 of 75
Section 1: Background
1.1 Legislation Chapter 373, Part VIII, Florida Statutes (F.S.), the Florida Springs and Aquifer Protection Act, provides for the protection and restoration of Outstanding Florida Springs (OFS), which comprise 24 first magnitude springs, 6 additional named springs, and their associated spring runs. The Florida Department of Environmental Protection (DEP) has assessed water quality in each OFS and determined that 24 of the 30 OFS are impaired for the nitrate form of nitrogen. Jackson Blue Spring is an impaired OFS. Development of the basin management action plan (BMAP) to meet the new requirements of the Florida Springs and Aquifer Protection Act for the Jackson Blue Basin was initiated in 2017.
1.2 Water Quality Standards and Total Maximum Daily Loads (TMDLs) A TMDL represents the maximum amount of a given pollutant that a waterbody can assimilate and still meet water quality criteria. Jackson Blue Spring and Merritts Mill Pond are Class III waterbodies with a designated use of recreation, propagation, and the maintenance of a healthy, well-balanced population of fish and wildlife. These waters are impaired by nitrate nitrogen, which in excess has been demonstrated to adversely affect flora or fauna through the excessive growth of algae. Excessive algal growth results in ecological imbalances in the springs and river and can produce human health problems, foul beaches, inhibit navigation, and reduce the aesthetic value of the resources.
Jackson Blue Spring forms the headwaters of the 270-acre Merritts Mill Pond, which forms the headwaters of Spring Creek, a tributary to the Chipola River (which is designated as an Outstanding Florida Water [OFW]). The Chipola River is the largest tributary in Florida to the Apalachicola River. Jackson Blue Spring and Merritts Mill Pond support a complex aquatic ecosystem and together are an important cultural and economic resource for the state.
In addition to Jackson Blue Spring, 7 named springs contribute to Merritts Mill Pond. Jackson Blue Spring contributes approximately 69 % of the total flow of Merritts Mill Pond (as measured at the pond outfall), the 7 minor springs contribute 14 %, and the remaining 17 % is from other unmeasured sources.
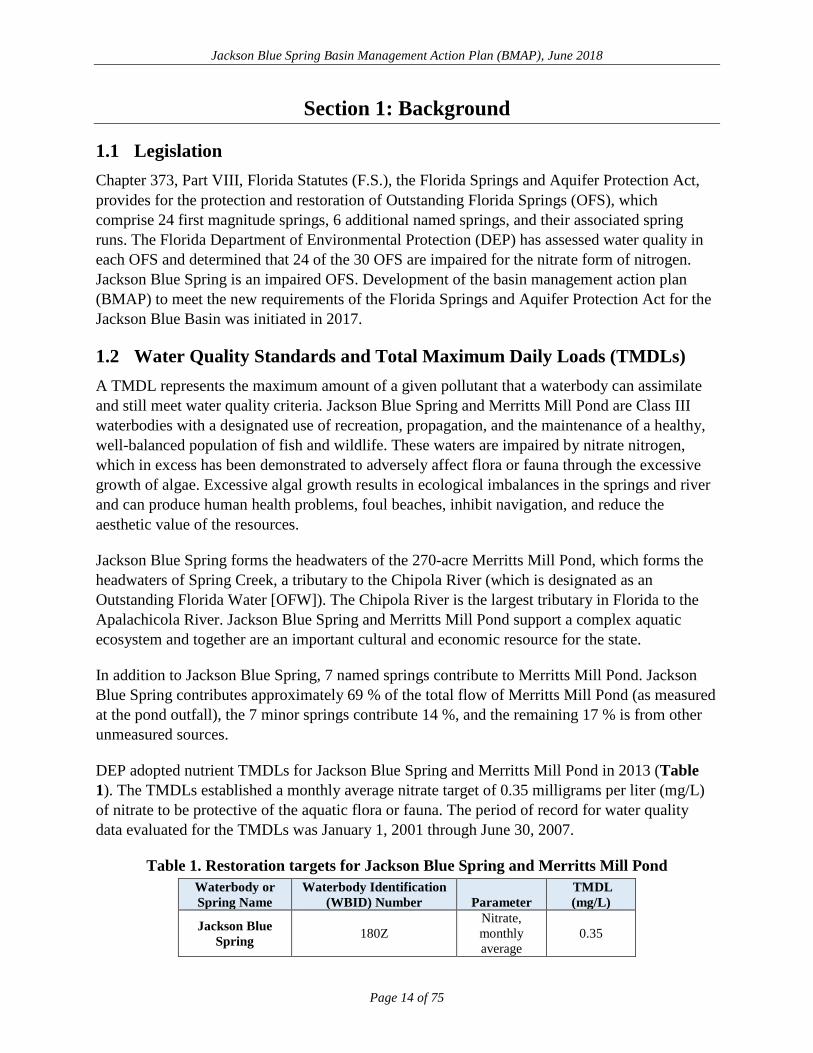
DEP adopted nutrient TMDLs for Jackson Blue Spring and Merritts Mill Pond in 2013 (Table 1). The TMDLs established a monthly average nitrate target of 0.35 milligrams per liter (mg/L) of nitrate to be protective of the aquatic flora or fauna. The period of record for water quality data evaluated for the TMDLs was January 1, 2001 through June 30, 2007.
Table 1. Restoration targets for Jackson Blue Spring and Merritts Mill Pond
Waterbody or Spring Name
Waterbody Identification (WBID) Number Parameter
TMDL (mg/L)
Jackson Blue Spring 180Z
Nitrate, monthly average
0.35
Jackson Blue Spring Basin Management Action Plan (BMAP), June 2018
Page 15 of 75
Waterbody or Spring Name
Waterbody Identification (WBID) Number Parameter
TMDL (mg/L)
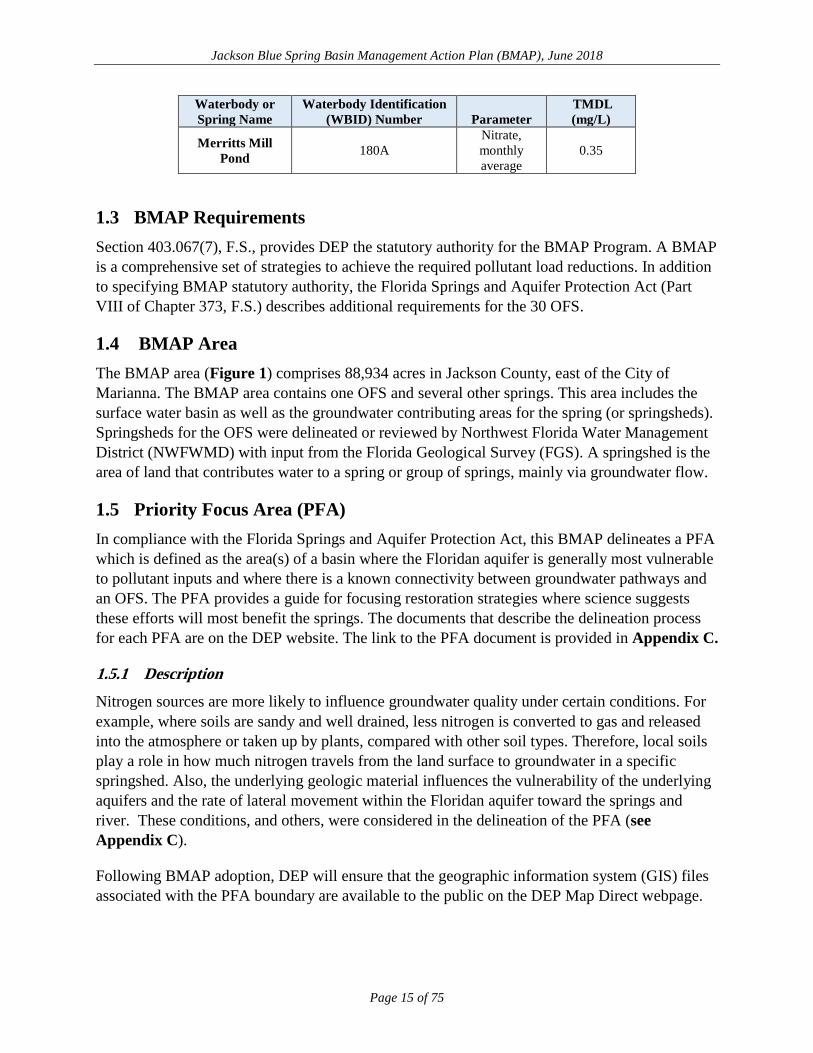
Merritts Mill Pond 180A
Nitrate, monthly average
0.35
1.3 BMAP Requirements Section 403.067(7), F.S., provides DEP the statutory authority for the BMAP Program. A BMAP is a comprehensive set of strategies to achieve the required pollutant load reductions. In addition to specifying BMAP statutory authority, the Florida Springs and Aquifer Protection Act (Part VIII of Chapter 373, F.S.) describes additional requirements for the 30 OFS.
1.4 BMAP Area The BMAP area (Figure 1) comprises 88,934 acres in Jackson County, east of the City of Marianna. The BMAP area contains one OFS and several other springs. This area includes the surface water basin as well as the groundwater contributing areas for the spring (or springsheds). Springsheds for the OFS were delineated or reviewed by Northwest Florida Water Management District (NWFWMD) with input from the Florida Geological Survey (FGS). A springshed is the area of land that contributes water to a spring or group of springs, mainly via groundwater flow.
1.5 Priority Focus Area (PFA) In compliance with the Florida Springs and Aquifer Protection Act, this BMAP delineates a PFA which is defined as the area(s) of a basin where the Floridan aquifer is generally most vulnerable to pollutant inputs and where there is a known connectivity between groundwater pathways and an OFS. The PFA provides a guide for focusing restoration strategies where science suggests these efforts will most benefit the springs. The documents that describe the delineation process for each PFA are on the DEP website. The link to the PFA document is provided in Appendix C.
1.5.1 Description Nitrogen sources are more likely to influence groundwater quality under certain conditions. For example, where soils are sandy and well drained, less nitrogen is converted to gas and released into the atmosphere or taken up by plants, compared with other soil types. Therefore, local soils play a role in how much nitrogen travels from the land surface to groundwater in a specific springshed. Also, the underlying geologic material influences the vulnerability of the underlying aquifers and the rate of lateral movement within the Floridan aquifer toward the springs and river. These conditions, and others, were considered in the delineation of the PFA (see Appendix C).
Following BMAP adoption, DEP will ensure that the geographic information system (GIS) files associated with the PFA boundary are available to the public on the DEP Map Direct webpage.

Jackson Blue Spring Basin Management Action Plan (BMAP), June 2018
Page 16 of 75
Figure 1. Jackson Blue BMAP and PFA boundaries

Jackson Blue Spring Basin Management Action Plan (BMAP), June 2018
Page 17 of 75
1.5.2 Additional Requirements In accordance with Section 373.811, F.S., the following activities are prohibited in the PFA in the Jackson Blue BMAP:
• New domestic wastewater disposal facilities, including rapid infiltration basins (RIBs), with permitted capacities of 100,000 gallons per day (gpd) or more, except for those facilities that meet an advanced wastewater treatment (AWT) standard of no more than 3 mg/L total nitrogen (TN) on an annual permitted basis.
• New onsite sewage treatment and disposal systems (OSTDS or septic systems, the terms are used interchangeably through this document) on lots of less than one acre inside the PFAs unless additional nitrogen treatment is provided, as specified in the OSTDS remediation plan (see Appendix D for details).
• New facilities for the disposal of hazardous waste.
• The land application of Class A or Class B domestic wastewater biosolids not in accordance with a DEP-approved nutrient management plan establishing the rate at which all biosolids, soil amendments, and sources of nutrients at the land application site can be applied to the land for crop production, while minimizing the amount of pollutants and nutrients discharged to groundwater or waters of the state.
• New agricultural operations that do not implement best management practices (BMPs), measures necessary to achieve pollution reduction levels established by DEP, or groundwater monitoring plans approved by a water management district or DEP.
1.5.2.1 Additional Requirements for Biosolids and Septage Application Sites In the PFA, the aquifer contributing to the spring is highly vulnerable to contamination by nitrogen sources and soils have a high to moderate tendency to leach applied nitrogen. DEP previously documented elevated nitrate concentrations in groundwater beneath septage application zones in spring areas. To assure that nitrogen losses to groundwater are minimized from permitted application of biosolids and septage in the PFA, the following requirements apply to newly-permitted application sites and existing application sites upon permit renewal.
All permitted biosolids application sites that are agricultural operations must be enrolled in the Florida Department of Agriculture and Consumer Services (FDACS) BMP Program or be within an agricultural operation enrolled in the FDACS BMP Program for the applicable crop type. Implementation of applicable BMPs will be verified by FDACS in accordance with Chapter 5M-1, Florida Administrative Code (F.A.C.). Permitted biosolids application sites that are new agricultural operations must also comply with Subsection 373.811(5), F.S. Biosolids application sites must be certified as viable agricultural operations by an acknowledged agricultural professional such as an agricultural consultant or agricultural extension agent. Effective nutrient
Jackson Blue Spring Basin Management Action Plan (BMAP), June 2018
Page 18 of 75
management practices must be ongoing at the application zones in the permit. Plant uptake and harvesting are vital components of the nutrient management plan to remove nitrogen and prevent it from leaching to groundwater. If DEP determines that the site is not a viable agricultural site implementing a nutrient management plan, corrective action will be required.
Groundwater monitoring for nitrate is required for all biosolids and septage land application sites in the PFA to assure compliance with nutrient management objectives in this BMAP. However, groundwater monitoring is not required if the site nutrient management plan limits biosolids application rates of TN with no adjustment for available nitrogen normally allowed by subsections 62-640.500(5) and (6), F.A.C. (e.g. for a recommended fertilizer rate of 160 pounds of nitrogen per acre, only 160 pounds of TN per acre shall be applied). For septage application, groundwater monitoring is not required if the site nutrient management plan limits application rates to 30,000 gallons per acre for sites accepting mixtures of septage and grease (food establishment sludge) or to 40,000 gallons per acre for sites accepting septage without grease. The permit renewal application will include a trend analysis for nitrate in groundwater monitoring wells during the previous permit cycle, and an evaluation of the potential for the facility to cause or contribute to exceedance of the TMDL.
1.6 Other Scientific and Historical Information In preparing this BMAP, DEP collected and evaluated credible scientific information on the effect of nutrients, particularly forms of nitrogen, on springs and springs systems. Some of the information collected is specific to the Jackson Blue Basin, while other references provided information on related knowledge for restoring springs, such as nitrogen-reducing technologies, the treatment performance of OSTDS, and runoff following fertilizer applications.
1.7 Stakeholder Involvement Stakeholder involvement is critical to develop, gain support for, and secure commitments in a BMAP. The BMAP process engages stakeholders and promotes coordination and collaboration to address the pollutant load reductions necessary to achieve the TMDLs. DEP invites stakeholders to participate in the BMAP development process and encourages public participation and consensus to the greatest practicable extent. Table A-1 lists the stakeholders who participated in the development of this BMAP.
During the development of the Jackson Blue BMAP, DEP held a series of meetings involving stakeholders and the general public. The purpose of these meetings was to consult with stakeholders to gather information, evaluate the best available science, develop an OSTDS remediation plan (including a public education plan), define management strategies and milestones, and establish monitoring requirements. All meetings were open to the public and noticed in the Florida Administrative Register (F.A.R.). Additionally, a public meeting on the current BMAP was held on March 28, 2018, and was noticed in the F.A.R. and in local newspapers.

Jackson Blue Spring Basin Management Action Plan (BMAP), June 2018
Page 19 of 75
Upon BMAP adoption, DEP intends to facilitate annual meetings with stakeholders to review progress towards achieving the TMDLs.
1.8 Description of BMPs Adopted by Rule Table 2 lists the adopted BMPs and BMP manuals relevant to this BMAP.
Table 2. BMPs and BMP manuals adopted by rule as of June 2017
Agency F.A.C.
Chapter Chapter Title FDACS Office of Agricultural
Water Policy (OAWP) 5M-6 Florida Container Nursery BMP Guide
FDACS OAWP 5M-8 BMPs for Florida Vegetable and Agronomic Crops FDACS OAWP 5M-9 BMPs for Florida Sod FDACS OAWP 5M-11 BMPs for Florida Cow/Calf Operations
FDACS OAWP 5M-12 Conservation Plans for Specified Agricultural Operations
FDACS OAWP 5M-13 BMPs for Florida Specialty Fruit and Nut Crop Operations
FDACS OAWP 5M-14 BMPs for Florida Equine Operations FDACS OAWP 5M-16 BMPs for Florida Citrus FDACS OAWP 5M-17 BMPs for Florida Dairies FDACS OAWP 5M-18 Florida Agriculture Wildlife BMPs FDACS OAWP 5M-19 BMPs for Florida Poultry
FDACS Division of Agricultural Environmental Services 5E-1 Fertilizer
FDACS Division of Aquaculture 5L-3 Aquaculture BMPs FDACS Florida Forest Service 5I-6 BMPs for Silviculture
FDACS Florida Forest Service 5I-8 Florida Forestry Wildlife BMPs for State Imperiled Species
DEP 62-330 Environmental Resource Permitting
Jackson Blue Spring Basin Management Action Plan (BMAP), June 2018
Page 20 of 75
Section 2: Implementation to Achieve the TMDLs
2.1 Allocation of Pollutant Loads DEP collected and evaluated credible scientific information on the effect of nutrients, particularly forms of nitrogen, on Jackson Blue Spring, described below.
2.1.1 Nutrients in the Springs and Spring Systems DEP developed the Nitrogen Source Inventory Loading Tool (NSILT) to provide information on the major sources of nitrogen in the groundwater contributing area for the OFS. In addition, this tool is used to estimate nitrogen loads to groundwater from these sources in the spring contributing area. The NSILT is a GIS- and spreadsheet-based tool that provides spatial estimates of the relative contribution of nitrogen from major nitrogen sources and accounts for the transport pathways and processes affecting the various forms of nitrogen as they move from the land surface through the soil and geologic strata.
The first major factor to consider in estimating the loading to groundwater in the NSILT is the attenuation of nitrogen as it moves from its source through the environment, before it reaches the Upper Floridan aquifer (UFA). The movement of nitrogen from the land surface to groundwater is controlled by biological and chemical processes that occur as part of the nitrogen cycle, as well as hydrogeological processes. Many of these processes attenuate (impede or remove) the amount of nitrogen transported to groundwater. An understanding of how water moves through the subsurface and the processes that transform the different forms of nitrogen is essential for estimating nitrogen loading to groundwater from various sources.
A second major factor to consider in estimating the loading to groundwater is the geologic features in the springshed and the related "recharge rate." Water movement between the shallow groundwater (surficial aquifer, where present) and the deeper aquifer (UFA) is slowed by a low permeability layer of clay, silt, and fine sand that retards the vertical movement of infiltrating water from the surface. The UFA occurs in limestone that can be prone to dissolving, and, over geologic time, the development of numerous karst features (sinkholes, caves, and conduits). These features allow water from the land surface to move directly and relatively rapidly into the aquifer and in some areas for groundwater in the aquifer to move rapidly to the springs.
Potential recharge rates from the surface to the UFA are affected by variations in the geologic materials and the presence of karst features. Within this region of Florida, there is insufficient data quantifying recharge; therefore, soil drainage is utilized as an indicator for recharge. This soil data is obtained from the National Cooperative Soil Survey Geographic Database (SSURGO) dataset and divided into three categories: well drained, moderately drained, and poorly drained. Since soil drainage will influence the rate at which water will infiltrate through the soil layer, DEP estimates more nitrogen would reach the aquifer annually in soil types with more drainage capacity given that all areas receive similar nitrogen inputs to the land surface. DEP estimated the recharge rate ranges associated with the soil data and grouped them into three rate categories, which were applied in the NSILT:

Jackson Blue Spring Basin Management Action Plan (BMAP), June 2018
Page 21 of 75
• Poorly Drained (1 to 5 inches per year [in/yr]).
• Moderately Drained (5 to 15 in/yr).
• Well Drained (15 in/yr or greater).
In the NSILT, DEP applied different attenuation factors to different types of sources, so that various biological, chemical, and hydrogeological effects could be estimated. The attenuation that was applied means that the amount of nitrogen leaving a source (such as a livestock operation or a newly fertilized yard) reduces the amount of nitrogen predicted to reach the aquifer. In the NSILT estimates, the attenuation rates ranged from 90 % (for atmospheric deposition) to 25 % (for wastewater disposal in a RIB). This means that, for these examples, only 10 % of nitrogen from atmospheric deposition is expected to reach the aquifer, while 75 % of nitrogen from a RIB is expected to reach groundwater, because the remainder is attenuated by various chemical and biological processes.
Phosphorus is naturally abundant in the geologic material underlying much of Florida and is often present in high concentrations in surface water and groundwater. Monitoring and evaluation of phosphorus and influences on the springs continues as the nitrate TMDLs are implemented.
2.1.2 Estimated Nitrogen Loads Table 3 lists the estimated nitrogen loads to groundwater by source. Note that urban stormwater loads are included in urban turfgrass fertilizer (UTF) estimates, while agricultural stormwater loads are included in farm fertilizer (FF) and livestock waste (LW) estimates. Nitrogen loading to surface water will be reduced through the activities and strategies for the sources identified in this chapter for groundwater loading.
Table 3. Estimated nitrogen load to groundwater by source in the BMAP area
Nitrogen Source
Estimated Total Nitrogen Load to Groundwater
(lb-N/yr) %
Contribution OSTDS 19,109 3
UTF and Sports Turfgrass Fertilizer (STF) 3,435 <1
Atmospheric Deposition 35,484 5 Irrigated FF 333,763 45
Non-Irrigated FF 292,158 40 LW 54,010 7
Total 737,959 100
2.1.3 Assumptions and Considerations The NSILT estimates are based on the following assumptions and considerations:
Jackson Blue Spring Basin Management Action Plan (BMAP), June 2018
Page 22 of 75
• NSILT Nitrogen Inputs – The methods used to estimate nitrogen inputs for each pollutant source were based on a detailed synthesis of information, including direct water quality measurements, census data, surveys, wastewater treatment facility (WWTF) permits, published scientific studies and reports, and information obtained in meetings with agricultural producers. For some pollutant source categories, nitrogen inputs were obtained using assumptions and extrapolations, and as a result, these inputs could be subject to further refinement if more detailed information becomes available.
• OSTDS Load Contribution – A per capita contribution to an OSTDS of 9.012 lb-N/yr was used to calculate loading from OSTDS. The average household contribution was estimated based on 2010 U.S. Census Bureau data on the average number of people per household for Jackson County of 2.86 persons.
• Nitrogen Attenuation Factors –To estimate the amount of nitrogen loading to the aquifer, DEP applied two nitrogen attenuation factors. Biological and chemical processes that occur as part of the nitrogen cycle, as well as hydrogeological processes, control the movement of nitrogen from the land surface to groundwater. Biochemical attenuation accounts for biochemical processes that convert or transform the different forms of nitrogen, while hydrogeological attenuation accounts for spatial variations that affect the rate of water infiltrating through geological media to recharge the UFA. Given the relatively large range of literature-reported values of biochemical nitrogen attenuation for each source category, DEP used an average biochemical attenuation factor for each source based on land use practices and hydrogeological conditions (i.e., recharge) in the contributing areas.
Other assumptions and considerations for BMAP implementation include the following:
• Unquantified Project Benefits – Nitrogen reductions for some of the projects and activities listed in this BMAP cannot currently be quantified. However, because of their positive impact, it is assumed that these actions will help reduce pollutant loads, and estimated loading reductions may be determined at a later date and assigned to these activities.
• Atmospheric Deposition – Atmospheric sources of nitrogen are local, national, and international. Atmospheric sources are generally of low nitrogen concentration compared with other sources and are further diminished through additional biological and chemical processes before they reach groundwater. Atmospheric deposition sources and trends will be reevaluated periodically.
• OSTDS Inventory and Loading Calculations – The total number of OSTDS in the basin is estimated based on local information and Florida Department of Health (FDOH) data. Future BMAPs and the associated OSTDS loading
Jackson Blue Spring Basin Management Action Plan (BMAP), June 2018
Page 23 of 75
calculations may be adjusted based on improved data on the number, location, and type (conventional and enhanced nitrogen reducing) of existing septic systems, and may include additional OSTDS installed since BMAP adoption.
• PFA – The PFA provides a guide for focusing strategies where science suggests efforts will best benefit the springs. The PFA boundary may be adjusted in the future if additional relevant information becomes available.
• Project Collection Period – The BMAP project collection period is limited to projects after a certain date, based on the data used to calculate the reductions needed. Reductions from older projects are already accounted for in the baseline loading. Projects completed in the springshed after July 1, 2007, were considered for inclusion in this BMAP.
• Legacy Sources – Land uses or management practices not currently active in the basin may still be affecting the nitrate concentration of the springs. The movement of water from the land surface through the soil column to the UFA and through the UFA to the spring system varies both spatially and temporally and is influenced by local soil and aquifer conditions. As a result, there may be a delay between when nitrogen input to the UFA occurs and when that load ultimately arrives at an OFS. The impact of this delay is not fully understood known.
• Implementation Schedule – BMAP implementation is a 20-year process. This plan defines nitrogen reduction milestones for 5-year (30 %), 10-year (50 %), and 15-year (20 %) implementation, so that the TMDLs will be met no later than the 20-year goal (see Section 2.1.6 for further details). Further, the total reductions and project credits may be adjusted under the adaptive management approach used for the BMAP. This approach requires regular follow-up to ensure that management strategies are carried out and that their incremental effects are assessed. This process acknowledges that there is some uncertainty associated with the outcomes of proposed management strategies and the estimated response of concentration at the springs. As more information is gathered and progress towards each 5-year milestone is reviewed, additional management strategies to achieve the TMDLs will be developed or existing strategies refined to better address the sources of nitrogen loading.
• Changes in Spring Flows – The role of this BMAP is specifically to promote the implementation of projects that reduce the nitrogen load to groundwater, while the minimum flows and levels (MFLs) established for specific springs address water flows and levels. To maximize efforts between the two programs, spring protection projects should provide both water quality and quantity benefits.

Jackson Blue Spring Basin Management Action Plan (BMAP), June 2018
Page 24 of 75
2.1.4 Loading by Source From the Jackson Blue NSILT estimates, the pie chart in Figure 2 depict the estimated percentage of nitrogen loading to groundwater by source in the BMAP area. Irrigated and non-irrigated FF are responsible for 85 % of the nitrogen sources in the BMAP area. Stormwater loading to groundwater is incorporated into the various source categories.
Figure 2. Loading to groundwater by source in the BMAP area
2.1.5 Loading Allocation The nitrogen source reductions are based on the measured nitrate loads at the spring vent, along with the TMDL target nitrate concentration. Table 4 lists the measured nitrate (as nitrogen) loads at the spring vent compared with the TMDL loading based on a target nitrate concentration of 0.35 mg/L. The difference between the spring vent loading and the TMDL loading estimate is the required reduction to meet the TMDLs. The total load that is required to be reduced in the

Jackson Blue Spring Basin Management Action Plan (BMAP), June 2018
Page 25 of 75
basin is being allocated to the entire basin and actions defined by the BMAP to reduce loading to the aquifer are needed to implement this allocated load.
Table 4. Total reductions to meet the TMDLs
Description Nitrogen Loads
(lb-N/yr) Notes Regarding Data Used
Total Load at Spring Vent 719,234
Upper 95% confidence interval - nitrate data and flow data from 2012 to 2017 (97.73 cubic feet per
second [cfs])
TMDL Load 67,252 TMDL target is 0.35 mg/L and using the same flow data from 2012 to 2017
Required Reduction 651,982
2.1.6 Description of 5-, 10-, and 15-year Milestones/Reduction Schedule The overall load reduction targets are 30 % of the total within 5 years, 80 % of the total within 10 years, and 100 % of the total within 15 years. DEP will evaluate progress towards these milestones and will report to the Governor and Florida Legislature. DEP will adjust management strategies that reduce loading to the aquifer to ensure the target concentrations are achieved.
Table 5 lists the estimated nitrogen reduction schedule, by milestone. Progress will be tracked yearly and adjustments made as needed. At the 5-year milestone, progress will be assessed and load reductions adjusted as necessary. Entities have flexibility in the types and locations of projects as long as they achieve the overall required load reductions. The monitoring of existing groundwater and springs sampling locations is essential. Section 2.3 describes detailed source reduction strategies.
Table 5. Nitrogen reduction schedule (lb-N/yr) 5-Year
Milestone (30 % of Total)
10-Year Milestone
(50 % of Total)
15-Year Milestone
(20 % of Total)
Total Nitrogen Reduction (100 %)
195,595 325,991 130,396 651,982
2.2 Prioritization of Management Strategies The management strategies listed in Appendix B are ranked with a priority of high, medium, or low. In 2016, the Florida Legislature amended the Watershed Restoration Act (Section 403.067, F.S.), creating additional requirements for all new or revised BMAPs. BMAPs must now include planning-level details for each listed project, along with their priority ranking.
Project status was selected as the most appropriate indicator of a project’s priority ranking based primarily on need for funding. Projects with a "completed" status were assigned a low priority. Projects classified as "underway" were assigned a medium priority because some resources have been allocated to these projects, but additional assistance may be needed for the project to be completed. High priority was assigned to projects listed with the project status "planned" as well
Jackson Blue Spring Basin Management Action Plan (BMAP), June 2018
Page 26 of 75
as certain "completed" projects that are ongoing each year (any project with one of these project types: "street sweeping," "catch basin inserts/inlet filter cleanout," "public education efforts," "fertilizer cessation," "fertilizer reduction," or "aquatic vegetation harvesting"), and select projects that are elevated because substantial, subsequent project(s) are reliant on their completion.
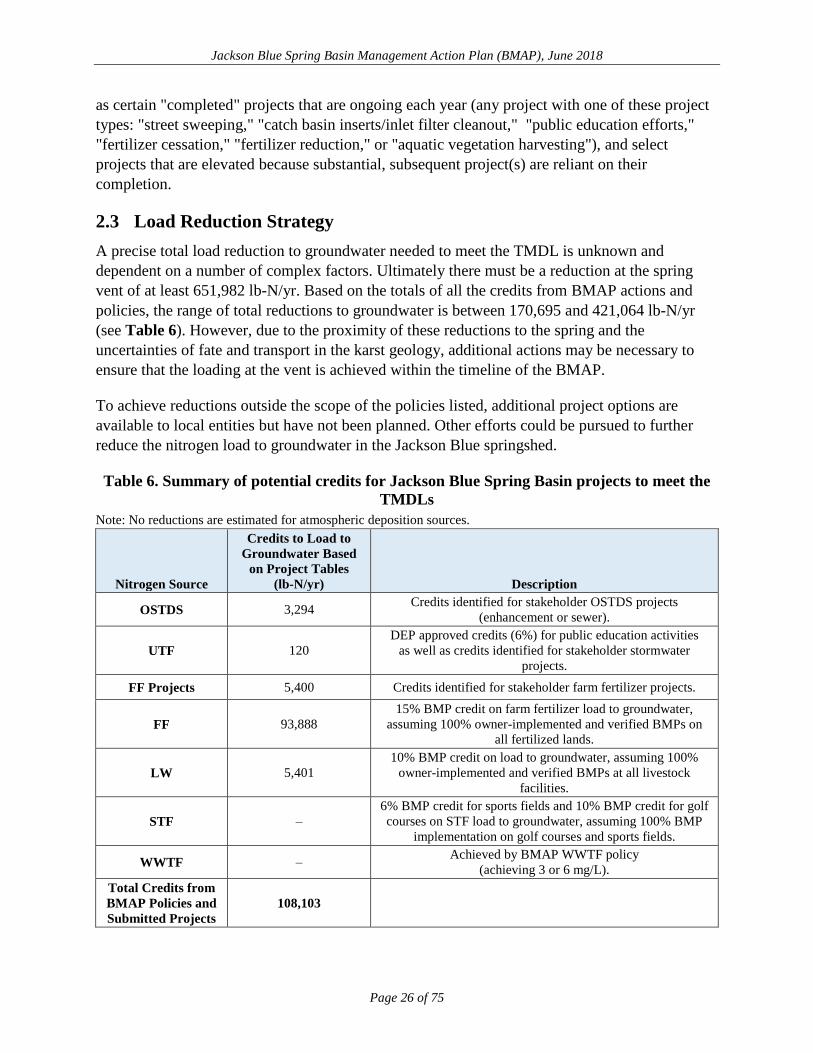
2.3 Load Reduction Strategy A precise total load reduction to groundwater needed to meet the TMDL is unknown and dependent on a number of complex factors. Ultimately there must be a reduction at the spring vent of at least 651,982 lb-N/yr. Based on the totals of all the credits from BMAP actions and policies, the range of total reductions to groundwater is between 170,695 and 421,064 lb-N/yr (see Table 6). However, due to the proximity of these reductions to the spring and the uncertainties of fate and transport in the karst geology, additional actions may be necessary to ensure that the loading at the vent is achieved within the timeline of the BMAP.
To achieve reductions outside the scope of the policies listed, additional project options are available to local entities but have not been planned. Other efforts could be pursued to further reduce the nitrogen load to groundwater in the Jackson Blue springshed.
Table 6. Summary of potential credits for Jackson Blue Spring Basin projects to meet the TMDLs
Note: No reductions are estimated for atmospheric deposition sources.
Nitrogen Source
Credits to Load to Groundwater Based
on Project Tables (lb-N/yr) Description
OSTDS 3,294 Credits identified for stakeholder OSTDS projects (enhancement or sewer).
UTF 120 DEP approved credits (6%) for public education activities
as well as credits identified for stakeholder stormwater projects.
FF Projects 5,400 Credits identified for stakeholder farm fertilizer projects.
FF 93,888 15% BMP credit on farm fertilizer load to groundwater,
assuming 100% owner-implemented and verified BMPs on all fertilized lands.
LW 5,401 10% BMP credit on load to groundwater, assuming 100%
owner-implemented and verified BMPs at all livestock facilities.
STF ‒ 6% BMP credit for sports fields and 10% BMP credit for golf courses on STF load to groundwater, assuming 100% BMP
implementation on golf courses and sports fields.
WWTF ‒ Achieved by BMAP WWTF policy (achieving 3 or 6 mg/L).
Total Credits from BMAP Policies and Submitted Projects
108,103

Jackson Blue Spring Basin Management Action Plan (BMAP), June 2018
Page 27 of 75
Nitrogen Source
Credits to Load to Groundwater Based
on Project Tables (lb-N/yr) Description
Additional Advanced
Agricultural Practices and Procedures
62,592- 312,961 Includes 10%-50% reduction from 100% of fertilized acres with a change in practice.
Total Credits 170,695 – 421,064 Load reduction to meet the TMDL at the spring vent is 651,982 lb-N/yr.
2.4 OSTDS Management Strategies Overall, there are currently an estimated 479 OSTDS in the PFA on lots less than one acre, based on FDOH estimates. This BMAP lists three specific projects (Appendix B) that reduce nitrogen loading from existing OSTDS on variably sized parcels by a total of 3,294 lb-N/yr. Figure 3 shows the locations of all OSTDS in the BMAP area, including the PFA.
In addition to the three listed projects, DEP assessed the overall OSTDS loading compared with other nitrogen sources in the PFA, as well as the relative loading in the wider BMAP area. Based on these assessments, DEP has determined that for the Jackson Blue BMAP area, OSTDS contribute less than 20 % of nonpoint source nitrogen pollution to the OFS. Per the Jackson Blue NSILT, septic systems contribute 3 % pollutant loading in the springshed areas and 3 % of the nitrogen loading in the PFA. Irrespective of the percent contribution, nitrogen loading from OSTDS contribute to the significant degradation of the groundwater, and DEP has determined that an OSTDS remediation plan is necessary to achieve the TMDLs and to limit the increase in nitrogen loads from future growth. Accordingly, the OSTDS remediation plan prohibits the installation of new conventional systems on lots less than 1 acre within the PFA. The OSTDS remediation plan is incorporated as Appendix D.

Jackson Blue Spring Basin Management Action Plan (BMAP), June 2018
Page 28 of 75
Figure 3. OSTDS locations in the BMAP area
Jackson Blue Spring Basin Management Action Plan (BMAP), June 2018
Page 29 of 75
2.5 UTF Management Strategies UTF consists of fertilizers applied to the turfgrass typically found in residential and urban areas (including residential lawns and public green spaces). It is applied by either the homeowner or a lawn service company on residential properties, while on nonresidential properties, it may be applied by contractors or maintenance staff.
2.5.1 Fertilizer Ordinance Adoption As required by the Florida Legislature, as described in Subsection 373.807(2), F.S., local governments with jurisdictional boundaries that include an OFS or any part of a springshed or the delineated PFA of an OFS, are required to develop, enact, and implement a fertilizer ordinance by July 1, 2017. The statutes require any ordinance to be based, at a minimum, on the DEP model ordinance for Florida-friendly fertilizer use on urban landscapes.
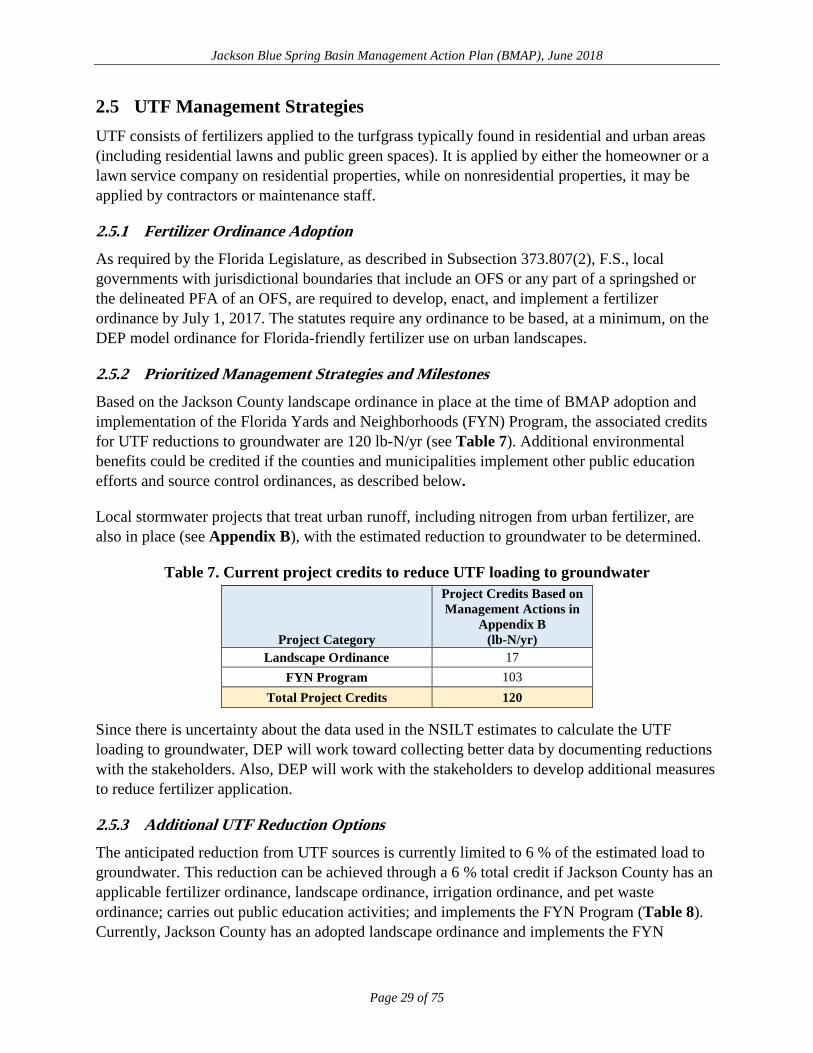
2.5.2 Prioritized Management Strategies and Milestones Based on the Jackson County landscape ordinance in place at the time of BMAP adoption and implementation of the Florida Yards and Neighborhoods (FYN) Program, the associated credits for UTF reductions to groundwater are 120 lb-N/yr (see Table 7). Additional environmental benefits could be credited if the counties and municipalities implement other public education efforts and source control ordinances, as described below.
Local stormwater projects that treat urban runoff, including nitrogen from urban fertilizer, are also in place (see Appendix B), with the estimated reduction to groundwater to be determined.
Table 7. Current project credits to reduce UTF loading to groundwater
Project Category
Project Credits Based on Management Actions in
Appendix B (lb-N/yr)
Landscape Ordinance 17 FYN Program 103
Total Project Credits 120 Since there is uncertainty about the data used in the NSILT estimates to calculate the UTF loading to groundwater, DEP will work toward collecting better data by documenting reductions with the stakeholders. Also, DEP will work with the stakeholders to develop additional measures to reduce fertilizer application.
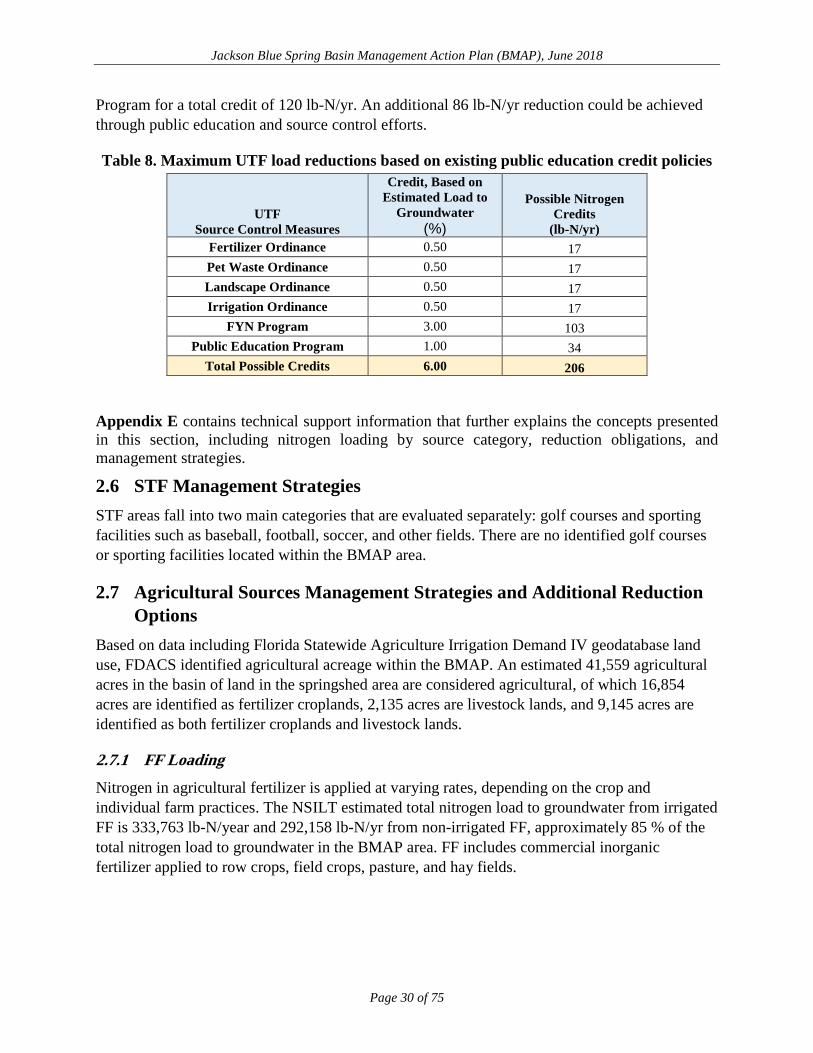
2.5.3 Additional UTF Reduction Options The anticipated reduction from UTF sources is currently limited to 6 % of the estimated load to groundwater. This reduction can be achieved through a 6 % total credit if Jackson County has an applicable fertilizer ordinance, landscape ordinance, irrigation ordinance, and pet waste ordinance; carries out public education activities; and implements the FYN Program (Table 8). Currently, Jackson County has an adopted landscape ordinance and implements the FYN
Jackson Blue Spring Basin Management Action Plan (BMAP), June 2018
Page 30 of 75
Program for a total credit of 120 lb-N/yr. An additional 86 lb-N/yr reduction could be achieved through public education and source control efforts.
Table 8. Maximum UTF load reductions based on existing public education credit policies
UTF Source Control Measures
Credit, Based on Estimated Load to
Groundwater (%)
Possible Nitrogen Credits
(lb-N/yr) Fertilizer Ordinance 0.50 17 Pet Waste Ordinance 0.50 17 Landscape Ordinance 0.50 17 Irrigation Ordinance 0.50 17
FYN Program 3.00 103 Public Education Program 1.00 34
Total Possible Credits 6.00 206
Appendix E contains technical support information that further explains the concepts presented in this section, including nitrogen loading by source category, reduction obligations, and management strategies.
2.6 STF Management Strategies STF areas fall into two main categories that are evaluated separately: golf courses and sporting facilities such as baseball, football, soccer, and other fields. There are no identified golf courses or sporting facilities located within the BMAP area.
2.7 Agricultural Sources Management Strategies and Additional Reduction Options
Based on data including Florida Statewide Agriculture Irrigation Demand IV geodatabase land use, FDACS identified agricultural acreage within the BMAP. An estimated 41,559 agricultural acres in the basin of land in the springshed area are considered agricultural, of which 16,854 acres are identified as fertilizer croplands, 2,135 acres are livestock lands, and 9,145 acres are identified as both fertilizer croplands and livestock lands.
2.7.1 FF Loading Nitrogen in agricultural fertilizer is applied at varying rates, depending on the crop and individual farm practices. The NSILT estimated total nitrogen load to groundwater from irrigated FF is 333,763 lb-N/year and 292,158 lb-N/yr from non-irrigated FF, approximately 85 % of the total nitrogen load to groundwater in the BMAP area. FF includes commercial inorganic fertilizer applied to row crops, field crops, pasture, and hay fields.

Jackson Blue Spring Basin Management Action Plan (BMAP), June 2018
Page 31 of 75
2.7.2 LW Loading Agricultural practices specific to LW management were obtained through meetings with University of Florida Institute of Food and Agricultural Sciences (UF-IFAS) extension staff, FDACS field representatives, agricultural producers, and stakeholders. The NSILT estimated total nitrogen load to groundwater from LW is 54,010 lb-N/year, or 7 % of the total nitrogen load to groundwater.
2.7.3 Prioritized Management Strategies and Milestones Subsection 403.067, F.S., requires agricultural nonpoint sources in a BMAP area either to implement the applicable FDACS-adopted BMPs, which provides a presumption of compliance with water quality standards, or conduct water quality monitoring prescribed by DEP or NWFWMD that demonstrates compliance with water quality standards. Further, based on the Florida Springs and Aquifer Protection Act, Subsection 373.811(5), F.S., prohibits any new agricultural operations within the PFA that do not implement applicable FDACS BMPs, measures necessary to achieve pollution reduction levels established by DEP, or groundwater monitoring plans approved by a water management district or DEP. Failure to implement BMPs or conduct monitoring that demonstrates compliance with pollutant reductions may result in enforcement action by DEP (s. 403.067(7)(b), F.S.).
FDACS will work with applicable producers within the BMAP area to implement BMPs. As of December 31, 2017, NOIs covered 36 % of the agricultural acreage in the Jackson Blue BMAP area (23,162 of 41,559 agricultural acres). No producers are conducting water quality monitoring in lieu of implementing BMPs at this time. Appendix B lists project information. Appendix F provides detailed information on BMPs and agricultural practices in the BMAP area.
With crop-specific BMP enrollment or monitoring for FF areas, an estimated 93,888 lb-N/yr reduction to groundwater can be achieved, based on an average reduction of 15 % in the nitrogen load to groundwater. While DEP has listed larger percentage reductions in nitrogen from agricultural BMPs in estimating benefits to surface waters, the best data available on benefits to groundwater from BMPs indicate a 15 % reduction in the load to groundwater where owner-implemented BMPs are in place. In addition to groundwater reductions from owner-implemented BMPs on fertilized lands, an additional 5,400 lb-N/yr in reductions are estimated from specific stakeholder projects on fertilized lands. This number could increase as more data are collected on the impact of BMPs to groundwater.
For all livestock operations, owner-implemented BMPs are expected to achieve a reduction of 5,401 lb-N/yr, using an estimated 10 % reduction in the load to groundwater from owner-implemented BMPs at livestock operations.
Summarizing the reductions discussed above, the total reduction from BMP implementation of all agricultural sources is 104,689 lb-N/yr.
Jackson Blue Spring Basin Management Action Plan (BMAP), June 2018
Page 32 of 75
2.7.4 Additional Agricultural Reduction Options Further reductions may be achieved through implementing additional agricultural projects or practices, including land acquisition and conservation easements. NWFWMD is implementing projects to encourage low input agriculture and water quality improvement technologies. Examples of these projects include providing incentives for producers to transition to less intensive cropping systems, changing land use to fallow or native landscape, or changing the type of cropping system. Other reductions associated with the implementation and modification of BMPs may be realized through ongoing studies and data collection. Basin-specific studies are underway to evaluate and demonstrate the effectiveness of BMPs on a site-specific basis.
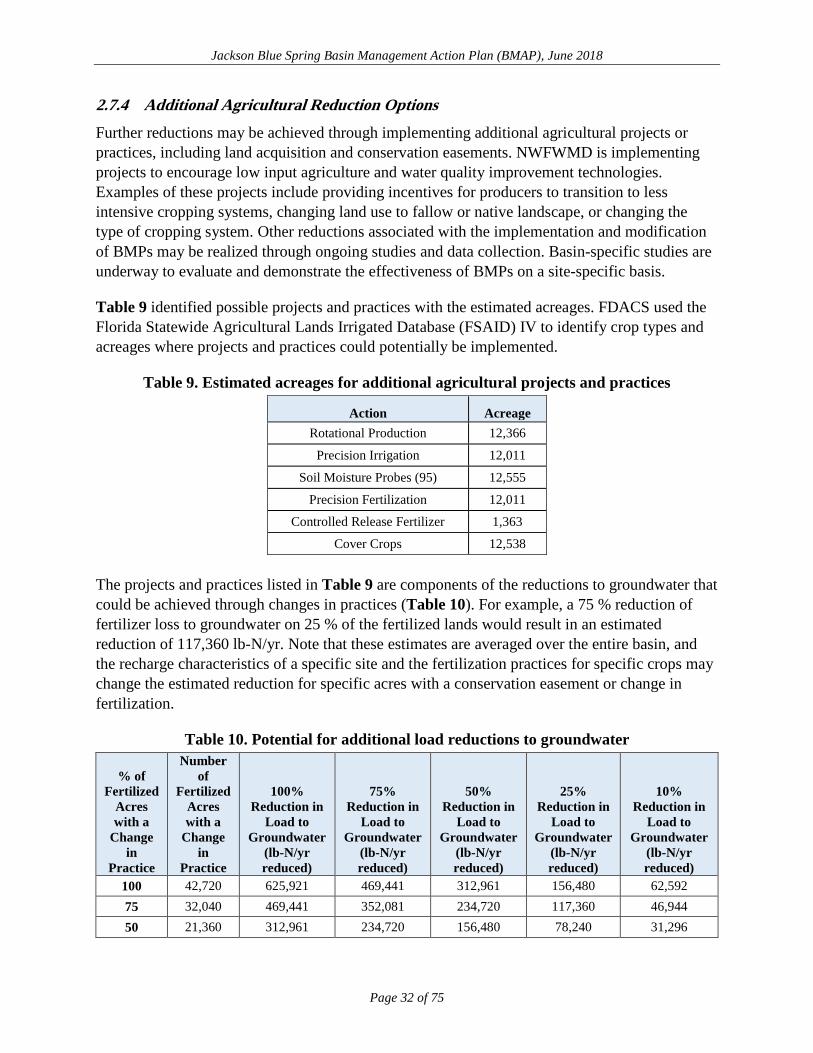
Table 9 identified possible projects and practices with the estimated acreages. FDACS used the Florida Statewide Agricultural Lands Irrigated Database (FSAID) IV to identify crop types and acreages where projects and practices could potentially be implemented.
Table 9. Estimated acreages for additional agricultural projects and practices
Action Acreage Rotational Production 12,366
Precision Irrigation 12,011
Soil Moisture Probes (95) 12,555
Precision Fertilization 12,011
Controlled Release Fertilizer 1,363
Cover Crops 12,538
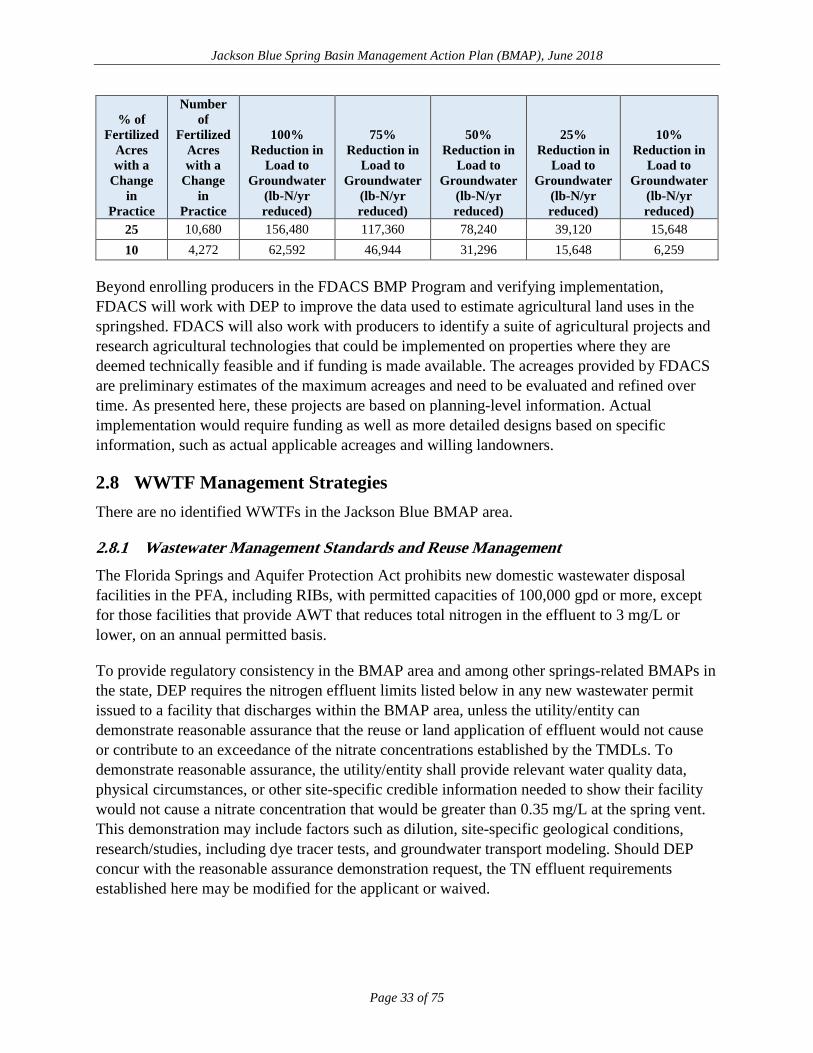
The projects and practices listed in Table 9 are components of the reductions to groundwater that could be achieved through changes in practices (Table 10). For example, a 75 % reduction of fertilizer loss to groundwater on 25 % of the fertilized lands would result in an estimated reduction of 117,360 lb-N/yr. Note that these estimates are averaged over the entire basin, and the recharge characteristics of a specific site and the fertilization practices for specific crops may change the estimated reduction for specific acres with a conservation easement or change in fertilization.
Table 10. Potential for additional load reductions to groundwater
% of Fertilized
Acres with a
Change in
Practice
Number of
Fertilized Acres with a
Change in
Practice
100% Reduction in
Load to Groundwater
(lb-N/yr reduced)
75% Reduction in
Load to Groundwater
(lb-N/yr reduced)
50% Reduction in
Load to Groundwater
(lb-N/yr reduced)
25% Reduction in
Load to Groundwater
(lb-N/yr reduced)
10% Reduction in
Load to Groundwater
(lb-N/yr reduced)
100 42,720 625,921 469,441 312,961 156,480 62,592 75 32,040 469,441 352,081 234,720 117,360 46,944 50 21,360 312,961 234,720 156,480 78,240 31,296
Jackson Blue Spring Basin Management Action Plan (BMAP), June 2018
Page 33 of 75
% of Fertilized
Acres with a
Change in
Practice
Number of
Fertilized Acres with a
Change in
Practice
100% Reduction in
Load to Groundwater
(lb-N/yr reduced)
75% Reduction in
Load to Groundwater
(lb-N/yr reduced)
50% Reduction in
Load to Groundwater
(lb-N/yr reduced)
25% Reduction in
Load to Groundwater
(lb-N/yr reduced)
10% Reduction in
Load to Groundwater
(lb-N/yr reduced)
25 10,680 156,480 117,360 78,240 39,120 15,648 10 4,272 62,592 46,944 31,296 15,648 6,259
Beyond enrolling producers in the FDACS BMP Program and verifying implementation, FDACS will work with DEP to improve the data used to estimate agricultural land uses in the springshed. FDACS will also work with producers to identify a suite of agricultural projects and research agricultural technologies that could be implemented on properties where they are deemed technically feasible and if funding is made available. The acreages provided by FDACS are preliminary estimates of the maximum acreages and need to be evaluated and refined over time. As presented here, these projects are based on planning-level information. Actual implementation would require funding as well as more detailed designs based on specific information, such as actual applicable acreages and willing landowners.
2.8 WWTF Management Strategies There are no identified WWTFs in the Jackson Blue BMAP area.
2.8.1 Wastewater Management Standards and Reuse Management The Florida Springs and Aquifer Protection Act prohibits new domestic wastewater disposal facilities in the PFA, including RIBs, with permitted capacities of 100,000 gpd or more, except for those facilities that provide AWT that reduces total nitrogen in the effluent to 3 mg/L or lower, on an annual permitted basis.
To provide regulatory consistency in the BMAP area and among other springs-related BMAPs in the state, DEP requires the nitrogen effluent limits listed below in any new wastewater permit issued to a facility that discharges within the BMAP area, unless the utility/entity can demonstrate reasonable assurance that the reuse or land application of effluent would not cause or contribute to an exceedance of the nitrate concentrations established by the TMDLs. To demonstrate reasonable assurance, the utility/entity shall provide relevant water quality data, physical circumstances, or other site-specific credible information needed to show their facility would not cause a nitrate concentration that would be greater than 0.35 mg/L at the spring vent. This demonstration may include factors such as dilution, site-specific geological conditions, research/studies, including dye tracer tests, and groundwater transport modeling. Should DEP concur with the reasonable assurance demonstration request, the TN effluent requirements established here may be modified for the applicant or waived.
Jackson Blue Spring Basin Management Action Plan (BMAP), June 2018
Page 34 of 75
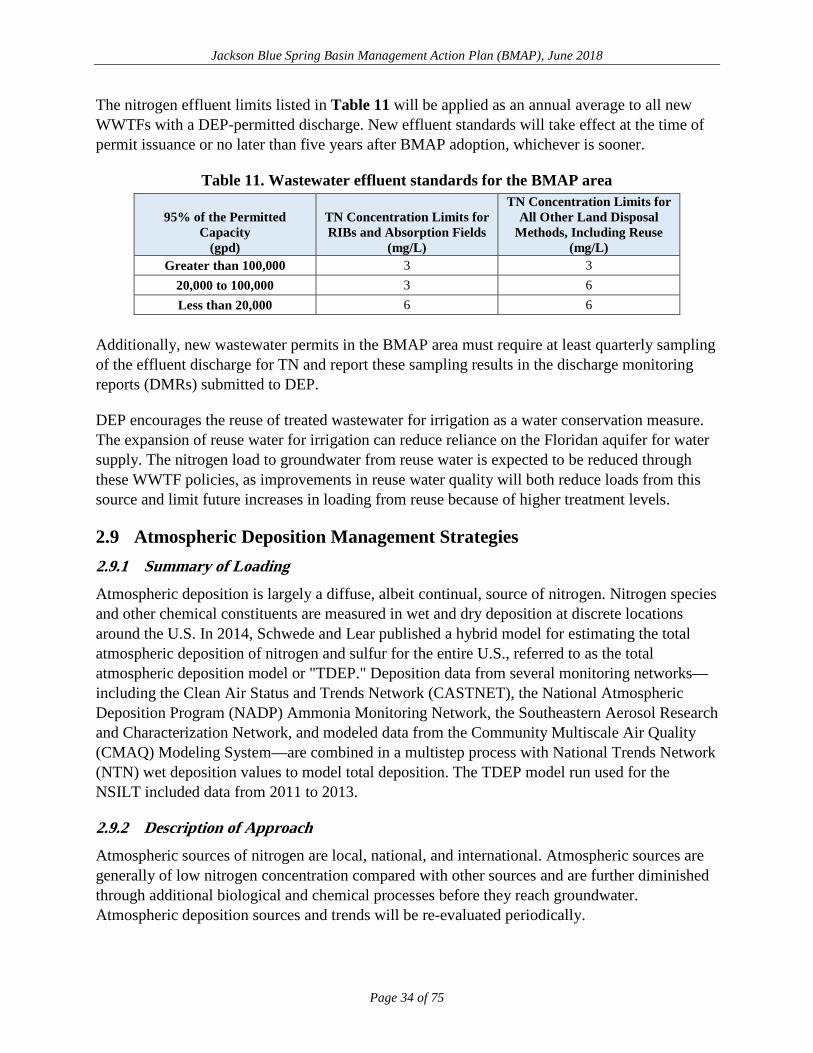
The nitrogen effluent limits listed in Table 11 will be applied as an annual average to all new WWTFs with a DEP-permitted discharge. New effluent standards will take effect at the time of permit issuance or no later than five years after BMAP adoption, whichever is sooner.
Table 11. Wastewater effluent standards for the BMAP area
95% of the Permitted Capacity
(gpd)
TN Concentration Limits for RIBs and Absorption Fields
(mg/L)
TN Concentration Limits for All Other Land Disposal
Methods, Including Reuse (mg/L)
Greater than 100,000 3 3 20,000 to 100,000 3 6 Less than 20,000 6 6
Additionally, new wastewater permits in the BMAP area must require at least quarterly sampling of the effluent discharge for TN and report these sampling results in the discharge monitoring reports (DMRs) submitted to DEP.
DEP encourages the reuse of treated wastewater for irrigation as a water conservation measure. The expansion of reuse water for irrigation can reduce reliance on the Floridan aquifer for water supply. The nitrogen load to groundwater from reuse water is expected to be reduced through these WWTF policies, as improvements in reuse water quality will both reduce loads from this source and limit future increases in loading from reuse because of higher treatment levels.
2.9 Atmospheric Deposition Management Strategies 2.9.1 Summary of Loading Atmospheric deposition is largely a diffuse, albeit continual, source of nitrogen. Nitrogen species and other chemical constituents are measured in wet and dry deposition at discrete locations around the U.S. In 2014, Schwede and Lear published a hybrid model for estimating the total atmospheric deposition of nitrogen and sulfur for the entire U.S., referred to as the total atmospheric deposition model or "TDEP." Deposition data from several monitoring networks—including the Clean Air Status and Trends Network (CASTNET), the National Atmospheric Deposition Program (NADP) Ammonia Monitoring Network, the Southeastern Aerosol Research and Characterization Network, and modeled data from the Community Multiscale Air Quality (CMAQ) Modeling System—are combined in a multistep process with National Trends Network (NTN) wet deposition values to model total deposition. The TDEP model run used for the NSILT included data from 2011 to 2013.
2.9.2 Description of Approach Atmospheric sources of nitrogen are local, national, and international. Atmospheric sources are generally of low nitrogen concentration compared with other sources and are further diminished through additional biological and chemical processes before they reach groundwater. Atmospheric deposition sources and trends will be re-evaluated periodically.
Jackson Blue Spring Basin Management Action Plan (BMAP), June 2018
Page 35 of 75
2.10 Future Growth Management Strategies New development primarily falls into to two general source categories: new urban development and new agriculture. Nutrient impacts from new development are addressed through a variety of mechanisms outlined in this BMAP as well as other provisions of Florida law. For instance, wastewater from all new and existing urban development is treated through either domestic WWTFs or OSTDS. New WWTFs must meet the stringent nitrogen limitations set forth in this BMAP. Existing WWTFs also must be upgraded to meet these same BMAP requirements. Florida law requires new development to connect to WWTFs where sewer lines are available. Where sewer is not available within the PFA, this BMAP still prohibits the installation of new OSTDS on lots of less than one-acre unless the system includes enhanced treatment of nitrogen, as described in Appendix D. Likewise, all new agricultural operations must implement FDACS-adopted BMPs and potentially other additional measures (Section 2.7), or must conduct water quality monitoring that demonstrates compliance with water quality standards.
Other laws such as local land development regulations, comprehensive plans, ordinances, incentives, environmental resource permit requirements, and consumptive use permit requirements, all provide additional mechanisms for protecting water resources and reducing the impact of new development and other land use changes as they occur (see Appendix G). Through this array of laws and the requirements in this BMAP, new development must undertake nitrogen-reduction measures before the development is complete.
2.11 Protection of Surface Water and Groundwater Resources through Land Conservation
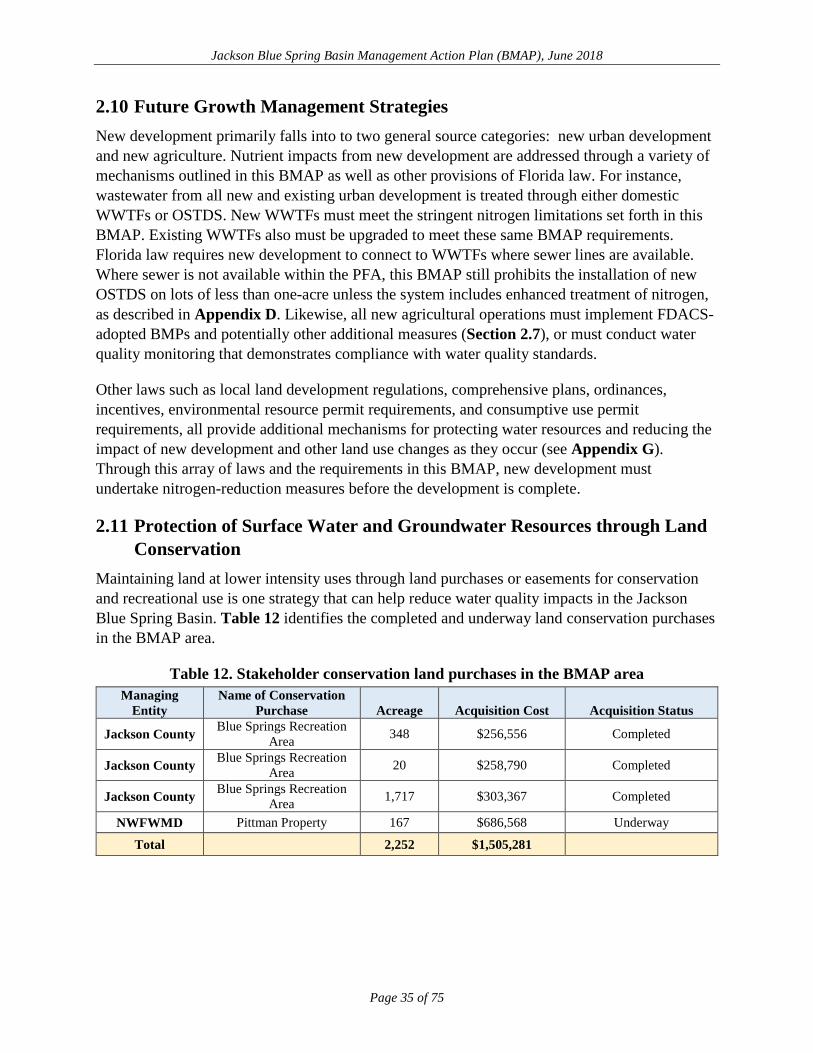
Maintaining land at lower intensity uses through land purchases or easements for conservation and recreational use is one strategy that can help reduce water quality impacts in the Jackson Blue Spring Basin. Table 12 identifies the completed and underway land conservation purchases in the BMAP area.
Table 12. Stakeholder conservation land purchases in the BMAP area Managing
Entity Name of Conservation
Purchase Acreage Acquisition Cost Acquisition Status
Jackson County Blue Springs Recreation Area 348 $256,556 Completed
Jackson County Blue Springs Recreation Area 20 $258,790 Completed
Jackson County Blue Springs Recreation Area 1,717 $303,367 Completed
NWFWMD Pittman Property 167 $686,568 Underway
Total 2,252 $1,505,281

Jackson Blue Spring Basin Management Action Plan (BMAP), June 2018
Page 36 of 75
2.12 Commitment to Implementation Successful BMAP implementation requires commitment, dedicated state funding, and follow-up. Stakeholders have expressed their intention to carry out the plan, monitor its effects, and continue to coordinate within and across jurisdictions to achieve nutrient reduction goals. As the TMDLs must be achieved within 20 years, DEP, water management districts (WMDs), FDOH, and FDACS will implement management strategies using the annual Legacy Florida appropriation from the legislature of at least $50 million to reduce nitrogen in impaired OFS. DEP, working with the coordinating agencies, will continue to invest existing funds and explore other opportunities and potential funding sources for springs restoration efforts.

Jackson Blue Spring Basin Management Action Plan (BMAP), June 2018
Page 37 of 75
Section 3: Monitoring and Reporting
3.1 Methods for Evaluating Progress DEP will work with stakeholders to track project implementation and organize the monitoring data collected each year. The project and monitoring information will be presented in an annual update. Stakeholders have agreed to meet annually after the adoption of the BMAP to follow up on plan implementation, share new information, and continue to coordinate on TMDL restoration-related issues. The following activities may occur at annual meetings:
Implementation data and reporting:
• Collect project implementation information from stakeholders, including FDACS agricultural BMP enrollment and FDOH-issued permits, and compare with the BMAP schedule.
• Discuss the data collection process, including any concerns and possible improvements to the process.
• Review the monitoring plan implementation, as detailed in Section 3.3.
Sharing new information:
• Report on results from water quality monitoring and trend information.
• Provide updates on new management strategies in the basin that will help reduce nutrient loading.
• Identify and review new scientific developments on addressing nutrient loads and incorporate any new information into annual progress reports.
Coordinating on TMDL restoration–related issues:
• Provide updates from DEP on the basin assessment cycle and activities related to any impairments, TMDLs, and BMAP.
• Obtain reports from other basins where tools or other information may be applicable to the TMDLs.
3.2 Adaptive Management Measures Adaptive management involves making adjustments in the BMAP when circumstances change or monitoring indicates the need for additional or more effective restoration strategies. Adaptive management measures may include the following:

Jackson Blue Spring Basin Management Action Plan (BMAP), June 2018
Page 38 of 75
• Implementing procedures to determine whether additional cooperative strategies are needed.
• Using criteria/processes for determining whether and when plan components need revision because of changes in costs, project effectiveness, social effects, watershed conditions, or other factors.
• Revising descriptions of stakeholders' roles during BMAP implementation and after BMAP completion.
• Updating information on corrective actions (and any supporting documentation) being implemented as data are gathered to refine project implementation schedules and performance expectations.
Key components of adaptive management are to share information and expertise include tracking plan implementation, monitoring water quality and pollutant loads, and holding periodic meetings.
3.3 Water Quality and Biological Monitoring 3.3.1 Objectives Focused objectives are critical for a monitoring strategy to provide the information needed to evaluate implementation success. Since the BMAP implementation involves an iterative process, the monitoring efforts are related to primary and secondary objectives. The primary objectives focus on achieving water quality targets, while the secondary objectives focus on water quality parameters that can be used to provide information for future refinements of the BMAP. The monitoring strategy may be updated as necessary.
Primary objectives:
• Measure the water quality and biological response in the impaired springs, river, and/or groundwater at the beginning of the BMAP period and during implementation.
• Document nutrient trends in the Jackson Blue Spring Basin and associated springs and groundwater.
• Focus BMP efforts by using water quality results combined with appropriate project information and land use in conjunction with statistical and spatial analysis tools.
Secondary objectives:
• Identify areas where groundwater data and modeling might help in understanding the hydrodynamics of the system.
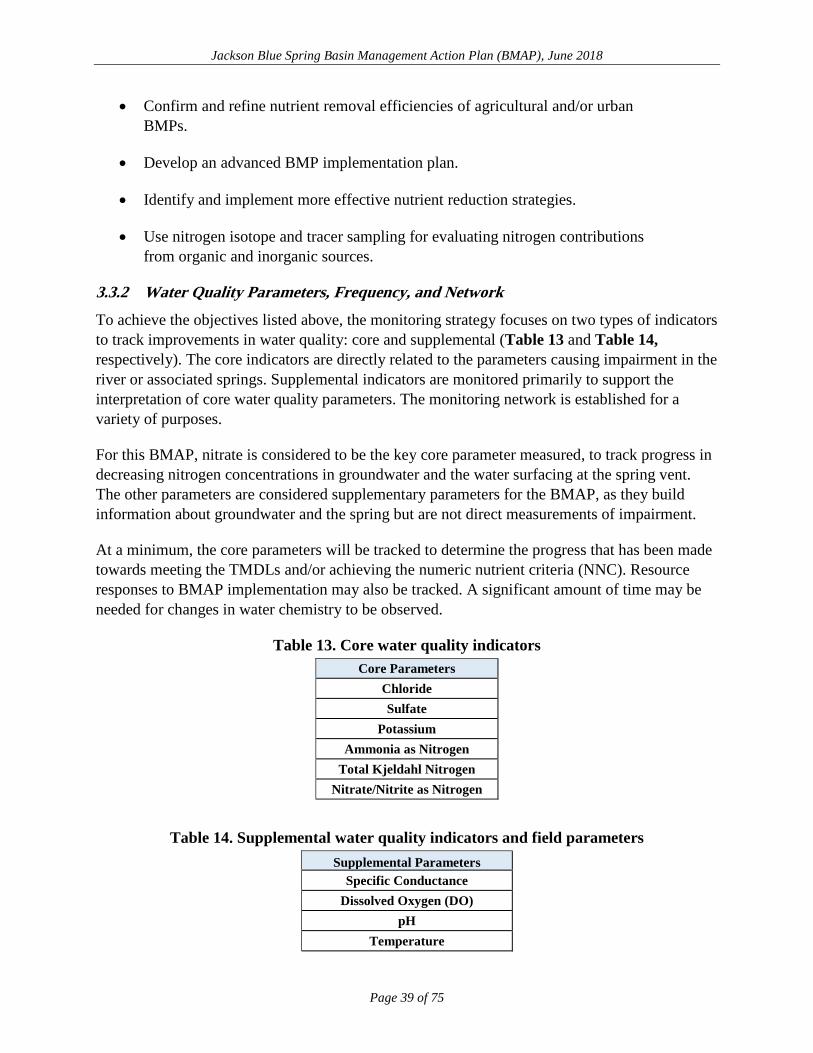
Jackson Blue Spring Basin Management Action Plan (BMAP), June 2018
Page 39 of 75
• Confirm and refine nutrient removal efficiencies of agricultural and/or urban BMPs.
• Develop an advanced BMP implementation plan.
• Identify and implement more effective nutrient reduction strategies.
• Use nitrogen isotope and tracer sampling for evaluating nitrogen contributions from organic and inorganic sources.
3.3.2 Water Quality Parameters, Frequency, and Network To achieve the objectives listed above, the monitoring strategy focuses on two types of indicators to track improvements in water quality: core and supplemental (Table 13 and Table 14, respectively). The core indicators are directly related to the parameters causing impairment in the river or associated springs. Supplemental indicators are monitored primarily to support the interpretation of core water quality parameters. The monitoring network is established for a variety of purposes.
For this BMAP, nitrate is considered to be the key core parameter measured, to track progress in decreasing nitrogen concentrations in groundwater and the water surfacing at the spring vent. The other parameters are considered supplementary parameters for the BMAP, as they build information about groundwater and the spring but are not direct measurements of impairment.
At a minimum, the core parameters will be tracked to determine the progress that has been made towards meeting the TMDLs and/or achieving the numeric nutrient criteria (NNC). Resource responses to BMAP implementation may also be tracked. A significant amount of time may be needed for changes in water chemistry to be observed.
Table 13. Core water quality indicators Core Parameters
Chloride Sulfate
Potassium Ammonia as Nitrogen
Total Kjeldahl Nitrogen Nitrate/Nitrite as Nitrogen
Table 14. Supplemental water quality indicators and field parameters Supplemental Parameters
Specific Conductance Dissolved Oxygen (DO)
pH Temperature

Jackson Blue Spring Basin Management Action Plan (BMAP), June 2018
Page 40 of 75
Supplemental Parameters Total Suspended Solids (TSS) Nitrate and Oxygen Isotopes
Initially, data from the ongoing sampling effort being conducted by NWFWMD at the spring vent as well as sampling performed by DEP will be used to determine progress towards the primary objectives. Surface water and groundwater monitoring network locations were selected to track changes in water quality and allow the annual evaluation of progress toward achieving the TMDL. Figure 4 shows the locations of the river and spring stations that will be used for the BMAP monitoring in the Jackson Blue Basin.
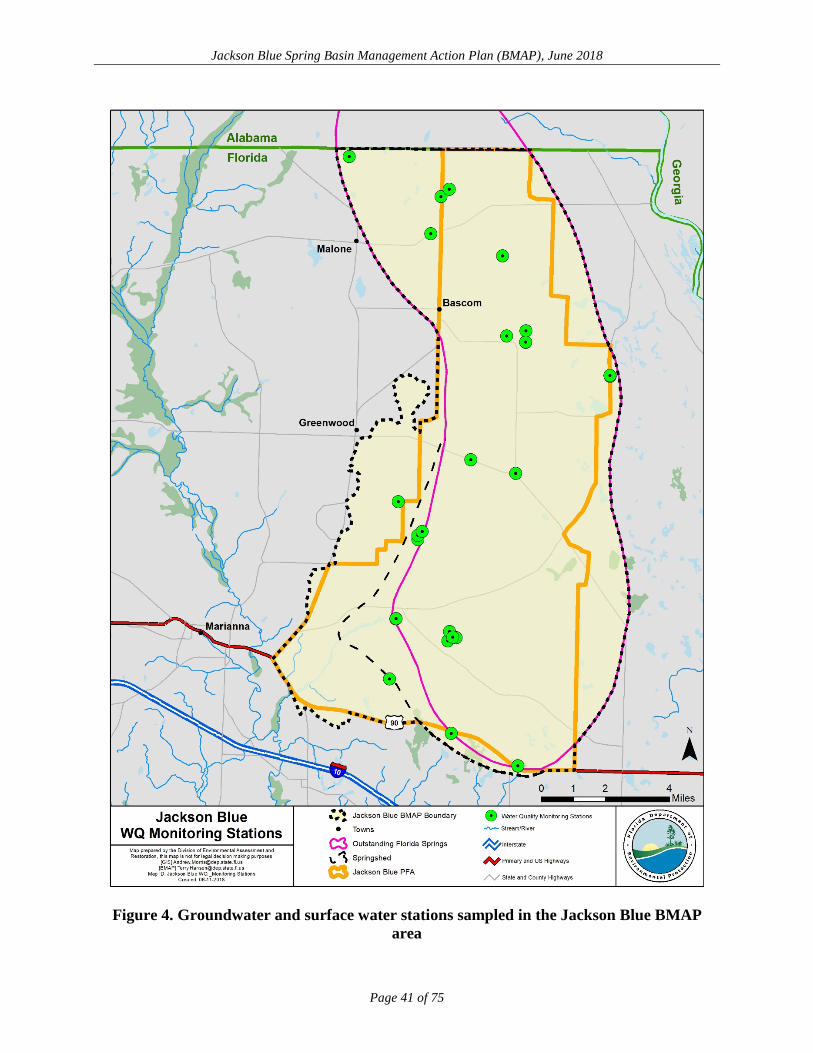
Jackson Blue Spring Basin Management Action Plan (BMAP), June 2018
Page 41 of 75
Figure 4. Groundwater and surface water stations sampled in the Jackson Blue BMAP
area
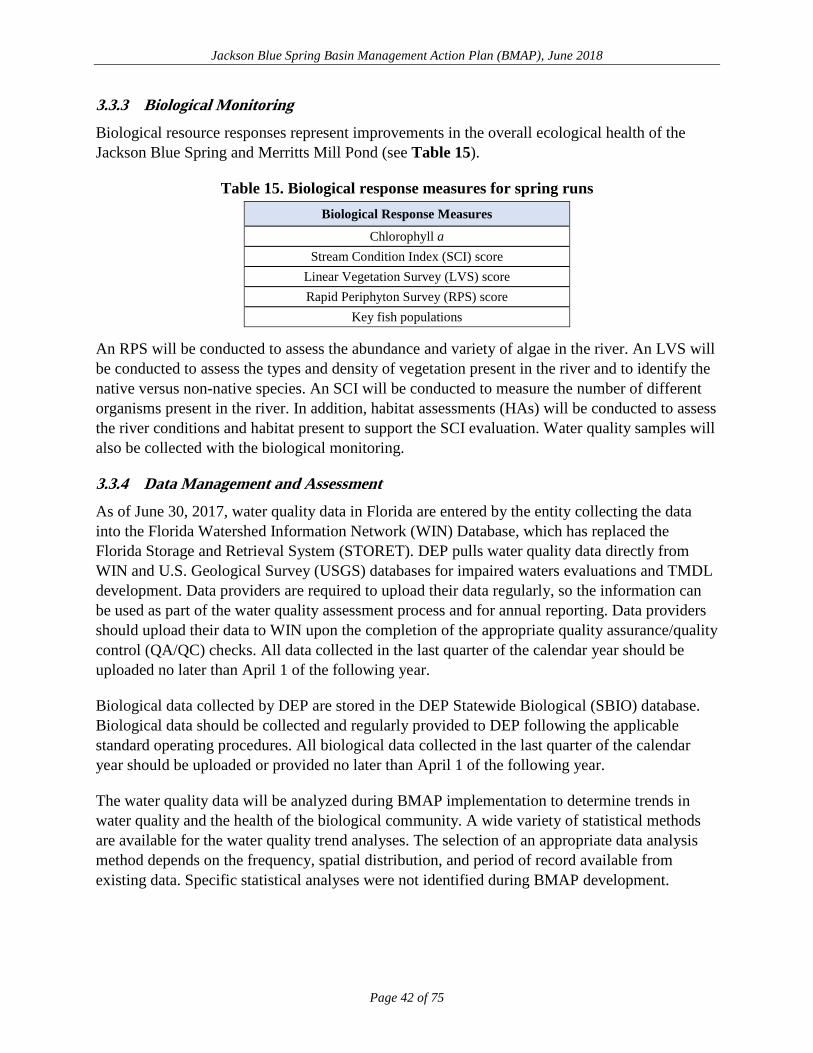
Jackson Blue Spring Basin Management Action Plan (BMAP), June 2018
Page 42 of 75
3.3.3 Biological Monitoring Biological resource responses represent improvements in the overall ecological health of the Jackson Blue Spring and Merritts Mill Pond (see Table 15).
Table 15. Biological response measures for spring runs Biological Response Measures
Chlorophyll a Stream Condition Index (SCI) score
Linear Vegetation Survey (LVS) score Rapid Periphyton Survey (RPS) score
Key fish populations An RPS will be conducted to assess the abundance and variety of algae in the river. An LVS will be conducted to assess the types and density of vegetation present in the river and to identify the native versus non-native species. An SCI will be conducted to measure the number of different organisms present in the river. In addition, habitat assessments (HAs) will be conducted to assess the river conditions and habitat present to support the SCI evaluation. Water quality samples will also be collected with the biological monitoring.
3.3.4 Data Management and Assessment As of June 30, 2017, water quality data in Florida are entered by the entity collecting the data into the Florida Watershed Information Network (WIN) Database, which has replaced the Florida Storage and Retrieval System (STORET). DEP pulls water quality data directly from WIN and U.S. Geological Survey (USGS) databases for impaired waters evaluations and TMDL development. Data providers are required to upload their data regularly, so the information can be used as part of the water quality assessment process and for annual reporting. Data providers should upload their data to WIN upon the completion of the appropriate quality assurance/quality control (QA/QC) checks. All data collected in the last quarter of the calendar year should be uploaded no later than April 1 of the following year.
Biological data collected by DEP are stored in the DEP Statewide Biological (SBIO) database. Biological data should be collected and regularly provided to DEP following the applicable standard operating procedures. All biological data collected in the last quarter of the calendar year should be uploaded or provided no later than April 1 of the following year.
The water quality data will be analyzed during BMAP implementation to determine trends in water quality and the health of the biological community. A wide variety of statistical methods are available for the water quality trend analyses. The selection of an appropriate data analysis method depends on the frequency, spatial distribution, and period of record available from existing data. Specific statistical analyses were not identified during BMAP development.
Jackson Blue Spring Basin Management Action Plan (BMAP), June 2018
Page 43 of 75
3.3.5 QA/QC Stakeholders participating in the monitoring plan must collect water quality data in a manner consistent with Chapter 62-160, F.A.C., and the DEP standard operating procedures (SOPs) for QA/QC required by rule. The most current version of these procedures is available on the DEP website. For BMAP-related data analyses, entities should use National Environmental Laboratory Accreditation Conference (NELAC) National Environmental Laboratory Accreditation Program (NELAP)–certified laboratories or other labs that meet the certification and other requirements outlined in the DEP SOPs.
Jackson Blue Spring Basin Management Action Plan (BMAP), June 2018
Page 44 of 75
Appendices
Appendix A. Important Links
The links below were correct at the time of document preparation. Over time, the locations may change and the links may no longer be accurate. None of these linked materials are adopted into this BMAP.
• DEP Website: http://www.floridadep.gov
• DEP Map Direct Webpage: https://ca.dep.state.fl.us/mapdirect/
• Florida Statutes: http://www.leg.state.fl.us/statutes
o Florida Watershed Recovery Act (Section 403.067, F.S.)
o Florida Springs and Aquifer Protection Act (Part VIII of Chapter 373, F.S.)
• DEP Model Ordinances: http://fyn.ifas.ufl.edu/fert_ordinances.html
• DEP Standard Operating Procedures for Water Quality Samples:
• https://floridadep.gov/dear/quality-assurance/content/dep-sops
• NELAC NELAP: https://fldeploc.dep.state.fl.us/aams/index.asp
• FDACS BMPs: https://www.freshfromflorida.com/Business-Services/Best-Management-Practices-BMPs/Agricultural-Best-Management-Practices
• FDACS BMP and Field Staff Contacts: http://www.freshfromflorida.com/Divisions-Offices/Agricultural-Water-Policy
• Florida Administrative Code (Florida Rules): https://www.flrules.org/
• NWFWMD Surface Water Improvement and Management (SWIM) Plans: https://www.nwfwater.com/Water-Resources/Surface-Water-Improvement-and-Management
• NWFWMD 2017 Consolidated Annual Report: https://www.nwfwater.com/Data-Publications/Reports-Plans/Consolidated-Annual-Reports
• University of Florida-Institute of Food and Agricultural Sciences (UF–IFAS) Research: http://research.ifas.ufl.edu/
Jackson Blue Spring Basin Management Action Plan (BMAP), June 2018
Page 45 of 75
Appendix B. Projects to Reduce Nitrogen Sources
Prioritization of Management Strategies
The management strategies in Table B-1 are ranked with a priority of high, medium, or low. In 2016, the Florida Legislature amended the Watershed Restoration Act (Section 403.067, F.S.), creating additional requirements for all new or revised BMAPs. BMAPs must now include planning-level details for each listed project, along with their priority ranking.
Project status was selected as the most appropriate indicator of a project’s priority ranking based primarily on need for funding. Projects with a "completed" status were assigned a low priority. Projects classified as "underway" were assigned a medium priority because some resources have been allocated to these projects, but additional assistance may be needed for the project to be completed. High priority was assigned to projects listed with the project status "planned" as well as certain "completed" projects that are ongoing each year (any project with one of these project types: "street sweeping," "catch basin inserts/inlet filter cleanout," "public education efforts," "fertilizer cessation," "fertilizer reduction," or "aquatic vegetation harvesting"), and select projects that are elevated because substantial, subsequent project(s) are reliant on their completion.
Description of the Management Strategies Responsible entities submitted these management strategies to the department with the understanding that the strategies would be included in the BMAP, thus requiring each entity to implement the proposed strategies in a timely way and achieve the assigned load reduction estimates. However, this list of strategies is meant to be flexible enough to allow for changes that may occur over time. Any change in listed management strategies, or the deadline to complete these actions, must first be approved by the department. Substituted strategies must result in equivalent or greater nutrient reductions than expected from the original strategies.
While the 20-year planning period for this BMAP is 2018 to 2038, projects completed since July 1, 2007 count toward the overall nitrogen reduction goals.
Estimated nitrogen reductions are subject to refinement based on DEP verification and/or on adjustment to calculations based on loading to groundwater rather than surface water. Agriculture load reductions (FDACS-01 and FDACS-02) assume 100 % enrollment and verification. Projects with a designation of TBD (to be determined) denotes information is not currently available, but will be provided by the stakeholder when it is available. Projects with a designation of N/A (not applicable) indicates the information for that category is not relevant to that project. Projects with a designation of "Not Provided" denotes that information was requested by DEP but was not provided by the lead entity.

Jackson Blue Spring Basin Management Action Plan (BMAP), June 2018
Page 46 of 75
Table B-1. Stakeholder projects to reduce nitrogen sources
Lead Entity
Project No.
Project Name Project Description
Project Type
Project Status
Start Date
Estimated Completion
Date
Nitrogen Source
Addressed by Project
Estimated Nitrogen
Load Reduction (lb-N/yr)
Cost Estimate
Funding Source
Funding Amount
FDACS FDACS-01
BMPs Implementa
tion and Verification
- Farm Fertilizer
Implementation of existing BMPs on applicable acreage. Up to 15% reduction in load to
groundwater.
Agricultural BMPs Underway Underway TBD FF 93,888 TBD TBD TBD
FDACS FDACS-02
BMPs Implementa
tion and Verification - Livestock
Waste
Implementation of existing BMPs at applicable facilities. Up to 10% reduction in load to
groundwater.
Agricultural BMPs Underway Underway TBD LW 5,401 TBD TBD TBD
Jackson County JC-01
Indian Springs Sewer
Extension Phase 1
Convert 125 residential septic systems to central
sewer.
Wastewater Service
Area Expansion
Underway 2016 2018 OSTDS 1,671 $1,450,000 DEP $1,450,000
Jackson County JC-02
Indian Springs Sewer
Extension Phase 2A
Phase 2A includes the Magnolia Blossom, Oak
Drive, and partial Seminole Drive segments (convert 89
residential systems to sewer).
Wastewater Service
Area Expansion
Planned 2018 TBD OSTDS 695 $2,000,000 DEP $2,000,000
Jackson County JC-03
Blue Spring Road Sewer
Extension
Provide central sewer service to Blue Springs Recreational Area and
approximately 74 homes in the Blue Springs area. The project will also include removing the public park septic system at Jackson Blue Spring, and provide sewer service to homes
adjacent to Merritts Mill Pond.
Wastewater Service
Area Expansion
Underway 2017 2020 OSTDS 838 $3,566,749 DEP $3,566,749
Jackson County JC-04
Jackson Blue Spring Recreation
Area Improve-
ments
Stormwater improvements. BMP
Treatment Train
Underway 2017 Not Provided UTF Not Provided
Not Provided
Not Provided
Not Provided

Jackson Blue Spring Basin Management Action Plan (BMAP), June 2018
Page 47 of 75
Lead Entity
Project No.
Project Name Project Description
Project Type
Project Status
Start Date
Estimated Completion
Date
Nitrogen Source
Addressed by Project
Estimated Nitrogen
Load Reduction (lb-N/yr)
Cost Estimate
Funding Source
Funding Amount
Jackson County JC-05
Jackson Blue Spring Recreation
Area Stormwater Improvement Project
Design and construction of a stormwater management system that captures and
treats stormwater at Jackson Blue Spring. In addition, will stabilize and restore approximately 250-300 linear feet of shoreline.
Stormwater System
Upgrade Underway 2017 2021 UTF TBD $751,200
DEP/ Local Match
DEP: $729,200
Local: $22,000
Jackson County JC-06 Education
Landscape ordinance; implementation of FYN
Program.
Education Efforts Underway 2013 2017 UTF 120 N/A N/A N/A
NWFWMD NWF-01
Agricultural BMPs and Equipment Cost-Share Program
Cost-share funding for agricultural BMPs and
equipment to improve water use efficiency and reduce
nutrient loading. Assisted 50 producers through 2017.
20% reduction in TN reported. Cost estimate is
cumulative since fiscal year (FY) 13-14.
Agricultural BMPs Underway 2013 TBD FF TBD $6,698,595
DEP/ FDACS/ Jackson Soil and Water
Conservation
District
DEP: $4,239,500 Producers
Match: $1,959,095
NWFWMD NWF-02
Blue Springs
Plantation, Inc.
Fee simple acquisition and protection of 394 acres
adjacent to Jackson Blue Spring.
Land Acquisition Canceled 2015 N/A N/A N/A N/A N/A N/A
NWFWMD NWF-03 Lakeshore Farms II,
LLC
Fee simple or less-than-fee acquisition and protection of 598 agricultural acres in the Jackson Blue groundwater
contributing area.
Land Acquisition Canceled N/A N/A N/A N/A N/A N/A N/A
NWFWMD NWF-04
Pittman Property
Land Acquisition
Less-than-fee acquisition and protection of 167
agricultural acres in the Jackson Blue groundwater
contributing area.
Land Acquisition Underway 2017 2018 N/A N/A $686,568 DEP $686,568
NWFWMD NWF-05
Sod-Based Crop
Rotation Grant
Program
Grants to producers to rotate sod in existing crop fields to improve water quality and reduce water use demands
around Jackson Blue Spring.
Agricultural BMPs Underway 2017 2022 FF TBD $806,032
U.S. EPA/ DEP/
Producers/ NWF-WMD
U.S. EPA/DEP: $480,032
NWFWMD: $256,000
Producers: $70,000

Jackson Blue Spring Basin Management Action Plan (BMAP), June 2018
Page 48 of 75
Lead Entity
Project No.
Project Name Project Description
Project Type
Project Status
Start Date
Estimated Completion
Date
Nitrogen Source
Addressed by Project
Estimated Nitrogen
Load Reduction (lb-N/yr)
Cost Estimate
Funding Source
Funding Amount
NWFWMD NWF-06
Apalachicola River and Bay SWIM
Plan
Implementation and periodic review and update of the
Apalachicola SWIM Plan. Study Completed 2015 2017 N/A N/A $99,290
National Fish and Wildlife Foun-dation
(NFWF)
$99,290
NWFWMD NWF-07
Claiborne Aquifer Water Supply
Testing of the Claiborne aquifer in Jackson Blue
Spring contributing area to determine viability as
alternative water source to offset demand on Floridan
aquifer.
Study Underway 2015 2018 N/A N/A $440,000 DEP $440,000
NWFWMD NWF-08 Mobile
Irrigation Laboratory
Annual contract to support water quantity evaluations
and retrofits with producers across the NWFWMD, but
largely concentrated in Jackson County.
Agricultural BMPs Underway 2005 TBD N/A N/A $745,063 NWF-
WMD $745,063
NWFWMD NWF-09
Sod-Based Crop
Rotation Education
Annual contract to provide education and outreach in
NWFWMD jurisdiction on sod-based crop rotation.
Agricultural BMPs Underway 2004 TBD FF N/A $543,000 NWF-
WMD $543,000
NWFWMD NWF-10 BMPs BMPs implemented as part
of the District's FY 2013/2014 funding cycle.
Agricultural BMPs Completed 2013 2014 FF 5,400 Not
Provided NWF-WMD
Not Provided
UF-IFAS IFAS-01
Sod-Based Crop
Rotation Pilot
Project
Demonstration project for up to four sod farms to
improve water quality and quantity over a four-year
period.
Agricultural BMPs Underway 2014 2018 FF TBD $806,032
DEP/ NWF-WMD/
Ag. Producers
DEP: $480,032
NWFWMD: $256,000
Ag. Producers:
$70,000
Various OSTDS-01
Enhancement of
Existing OSTDS - Voluntary
Repair, upgrade, replacement, drainfield
modification, addition of effective nitrogen reducing features, initial connection
to a central sewerage system, or other action to reduce nutrient loading, voluntarily taken by the
OSTDS Enhanceme
nt Underway 2018 N/A OSTDS TBD TBD DEP TBD

Jackson Blue Spring Basin Management Action Plan (BMAP), June 2018
Page 49 of 75
Lead Entity
Project No.
Project Name Project Description
Project Type
Project Status
Start Date
Estimated Completion
Date
Nitrogen Source
Addressed by Project
Estimated Nitrogen
Load Reduction (lb-N/yr)
Cost Estimate
Funding Source
Funding Amount
owner of an OSTDS within the BMAP.
Town of Malone TM-01
Malone High
School Sanitary Sewer
Connection Project
Connect Malone High School to the Malone
WWTF, abandoning 10 septic systems.
Wastewater Service
Area Expansion
Underway 2017 2020 OSTDS 90 $432,077 DEP $432,077
Jackson Blue Spring Basin Management Action Plan (BMAP), June 2018
Page 50 of 75
Appendix C. PFA Report
A PFA (Jackson Blue Spring, October 2017) is defined as the area(s) of a basin where the Floridan aquifer is generally most vulnerable to pollutant inputs and where there is a known connectivity between groundwater pathways and an OFS. As required by the Florida Springs and Aquifer Protection Act, DEP delineated a PFA for the Jackson Blue Spring Basin. This PFA is adopted and incorporated by reference into this BMAP. Detailed information on the PFA is available in report format at the following link: http://publicfiles.dep.state.fl.us/dear/PFAs.

Jackson Blue Spring Basin Management Action Plan (BMAP), June 2018
Page 51 of 75
Appendix D. OSTDS Remediation Plan
The Florida Aquifer and Springs Protection Act specifies that if during the development of a BMAP for an OFS, DEP identifies OSTDS as contributors of at least 20 % of nonpoint source nitrogen pollution in a PFA or if DEP determines remediation is necessary to achieve the TMDL, the BMAP shall include an OSTDS remediation plan. Based on the Jackson Blue NSILT estimates and GIS coverages, OSTDS contribute approximately 3 % of the pollutant loading in the PFAs. Although this is a small percentage, DEP has determined that an OSTDS remediation plan is necessary to achieve TMDLs and to limit the increase in nitrogen loads from future growth. Irrespective of the percent contribution from OSTDS, DEP has determined that an OSTDS remediation plan is necessary to achieve the TMDLs and to limit the increase in nitrogen loads from future growth.
D.1 Plan Elements
D.1.1 Installation of New OSTDS
Per statute, new OSTDS on lots of less than one acre are prohibited within PFAs, if the addition of the specific systems conflicts with an OSTDS remediation plan incorporated into an OFS BMAP (see Section 373.811(2), F.S.). This OSTDS remediation plan prohibits new conventional systems on lots of less than one acre within the PFAs, unless the OSTDS includes enhanced treatment of nitrogen or unless the OSTDS permit applicant demonstrates that sewer connections will be available within 5 years. To aid in implementation, the DEP Map Direct webpage includes a detailed downloadable springs PFA boundary shapefile. DEP also maintains on its website an interactive map of the PFA and BMAP boundaries; the map can be easily searched for specific street address locations.
FDOH permits the installation of new OSTDS pursuant to Chapter 64E-6, F.A.C., which includes not only systems installed on a property where one has not previously been installed, but also systems installed to replace illegal systems, systems installed in addition to existing systems, and other new systems. FDOH permitting requirements with respect to the definition of "new" or "less than one acre" will be followed for this remediation plan. To meet the enhanced treatment of nitrogen requirement the system must include at least one of the following nitrogen reducing enhancements:
• Features allowed pursuant to FDOH rule, such as in-ground nitrogen-reducing biofilters (media layer systems).
• Features consistent with and identified in the FDOH Florida Onsite System Nitrogen Removal Strategy Studies report, such as in-tank nitrogen-reducing biofilters.
• Other FDOH-approved treatment systems capable of meeting or exceeding the NSF International (NSF) Standard 245 nitrogen removal rate before disposing the wastewater in the drain field, such as aerobic treatment units (ATU) and performance-based

Jackson Blue Spring Basin Management Action Plan (BMAP), June 2018
Page 52 of 75
treatment systems (PBTS). For FDOH-approved treatment systems that meet NSF 245, but do not meet or exceed the minimum treatment level expected from the in-ground nitrogen-reducing biofilters, the drain fields, at minimum, shall be installed with a 24-inch separation between the bottom of the drain field and the seasonal high-water table.
D.1.2 Modification and Repair of Existing OSTDS
At this time, this remediation plan does not require the addition of nitrogen reducing enhancements upon modification or repair of existing OSTDS. D.1.3 Other Plan Elements
Statutes also require that OSTDS remediation plans contain the following elements.
• An evaluation of credible scientific information on the effect of nutrients, particularly forms of nitrogen, on springs and spring systems. (See Section D.2.)
• Options for repair, upgrade, replacement, drain field modification, the addition of effective nitrogen-reducing features, connection to a central sewer system, or other action. (See Section D.3.)
• A public education plan to provide area residents with reliable, understandable information about OSTDS and springs. (See Section D.4.)
• Cost-effective and financially feasible projects necessary to reduce the nutrient impacts from OSTDS. (See Section 2 and Appendix B.)
• A priority ranking for each project for funding contingent on appropriations in the General Appropriations Act. (See Section 2 and Appendix B.)
The Florida Springs and Aquifer Protection Act defines an OSTDS as a system that contains a standard subsurface, filled, or mound drain field system; an aerobic treatment unit; a graywater system tank; a laundry wastewater system tank; a septic tank; a grease interceptor; a pump tank; a solids or effluent pump; a waterless, incinerating, or organic waste–composting toilet; or a sanitary pit privy that is installed or proposed to be installed beyond the building sewer on land of the owner or on other land on which the owner has the legal right to install such a system. The term includes any item placed within, or intended to be used as a part of or in conjunction with, the system. The term does not include package sewage treatment facilities and other treatment works regulated under Chapter 403, F.S.
D.2 Collection and Evaluation of Credible Scientific Information
As discussed in Section 2, DEP developed the NSILT, a planning tool that provides estimation of nitrogen loading sources to groundwater based on the best available scientific data for a
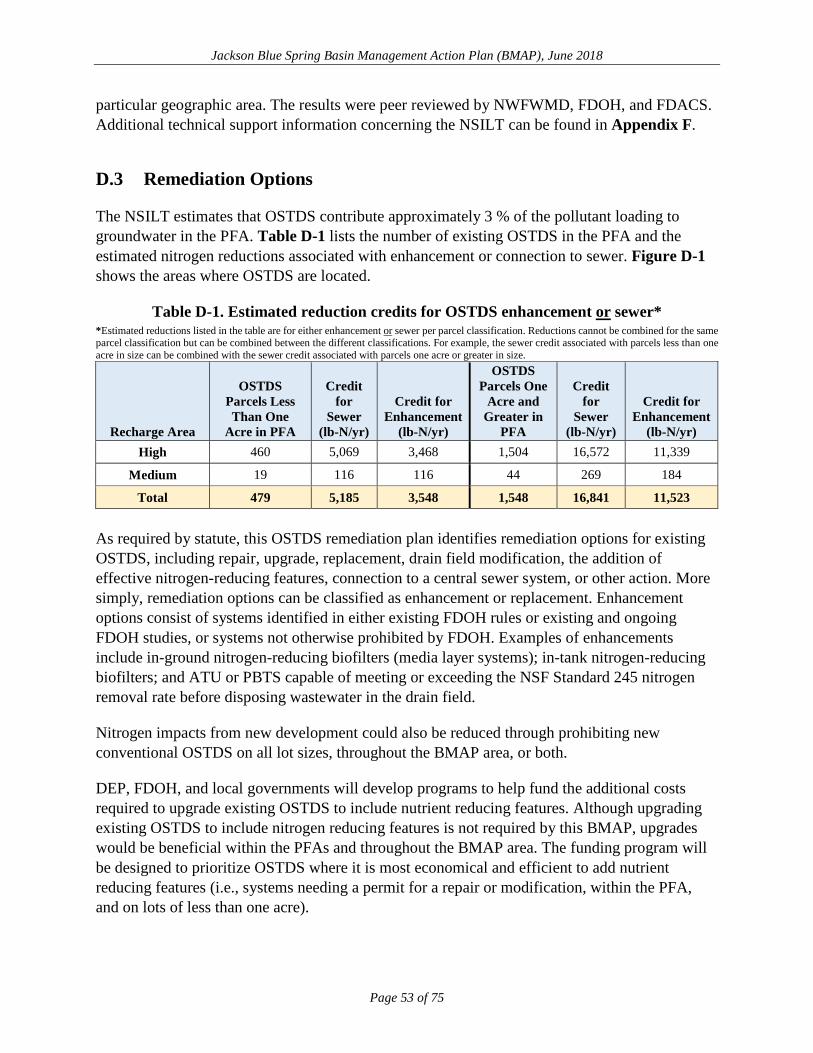
Jackson Blue Spring Basin Management Action Plan (BMAP), June 2018
Page 53 of 75
particular geographic area. The results were peer reviewed by NWFWMD, FDOH, and FDACS. Additional technical support information concerning the NSILT can be found in Appendix F.
D.3 Remediation Options
The NSILT estimates that OSTDS contribute approximately 3 % of the pollutant loading to groundwater in the PFA. Table D-1 lists the number of existing OSTDS in the PFA and the estimated nitrogen reductions associated with enhancement or connection to sewer. Figure D-1 shows the areas where OSTDS are located.
Table D-1. Estimated reduction credits for OSTDS enhancement or sewer* *Estimated reductions listed in the table are for either enhancement or sewer per parcel classification. Reductions cannot be combined for the same parcel classification but can be combined between the different classifications. For example, the sewer credit associated with parcels less than one acre in size can be combined with the sewer credit associated with parcels one acre or greater in size.
Recharge Area
OSTDS Parcels Less Than One
Acre in PFA
Credit for
Sewer (lb-N/yr)
Credit for Enhancement
(lb-N/yr)
OSTDS Parcels One
Acre and Greater in
PFA
Credit for
Sewer (lb-N/yr)
Credit for Enhancement
(lb-N/yr) High 460 5,069 3,468 1,504 16,572 11,339
Medium 19 116 116 44 269 184
Total 479 5,185 3,548 1,548 16,841 11,523
As required by statute, this OSTDS remediation plan identifies remediation options for existing OSTDS, including repair, upgrade, replacement, drain field modification, the addition of effective nitrogen-reducing features, connection to a central sewer system, or other action. More simply, remediation options can be classified as enhancement or replacement. Enhancement options consist of systems identified in either existing FDOH rules or existing and ongoing FDOH studies, or systems not otherwise prohibited by FDOH. Examples of enhancements include in-ground nitrogen-reducing biofilters (media layer systems); in-tank nitrogen-reducing biofilters; and ATU or PBTS capable of meeting or exceeding the NSF Standard 245 nitrogen removal rate before disposing wastewater in the drain field.
Nitrogen impacts from new development could also be reduced through prohibiting new conventional OSTDS on all lot sizes, throughout the BMAP area, or both.
DEP, FDOH, and local governments will develop programs to help fund the additional costs required to upgrade existing OSTDS to include nutrient reducing features. Although upgrading existing OSTDS to include nitrogen reducing features is not required by this BMAP, upgrades would be beneficial within the PFAs and throughout the BMAP area. The funding program will be designed to prioritize OSTDS where it is most economical and efficient to add nutrient reducing features (i.e., systems needing a permit for a repair or modification, within the PFA, and on lots of less than one acre).

Jackson Blue Spring Basin Management Action Plan (BMAP), June 2018
Page 54 of 75
To facilitate incorporation of nitrogen reducing features at the time of a permit to repair or modify an existing OSTDS, FDOH will pursue regulatory solutions to accomplish the following objectives:
• Update OSTDS rule language regarding permits, variances, and waivers to include consideration of DEP-adopted OSTDS remediation plans.
• Update OSTDS rules to allow installation of passive remediation systems, including but not limited to systems featuring liners, nitrogen reducing material, or both underneath the drain field.
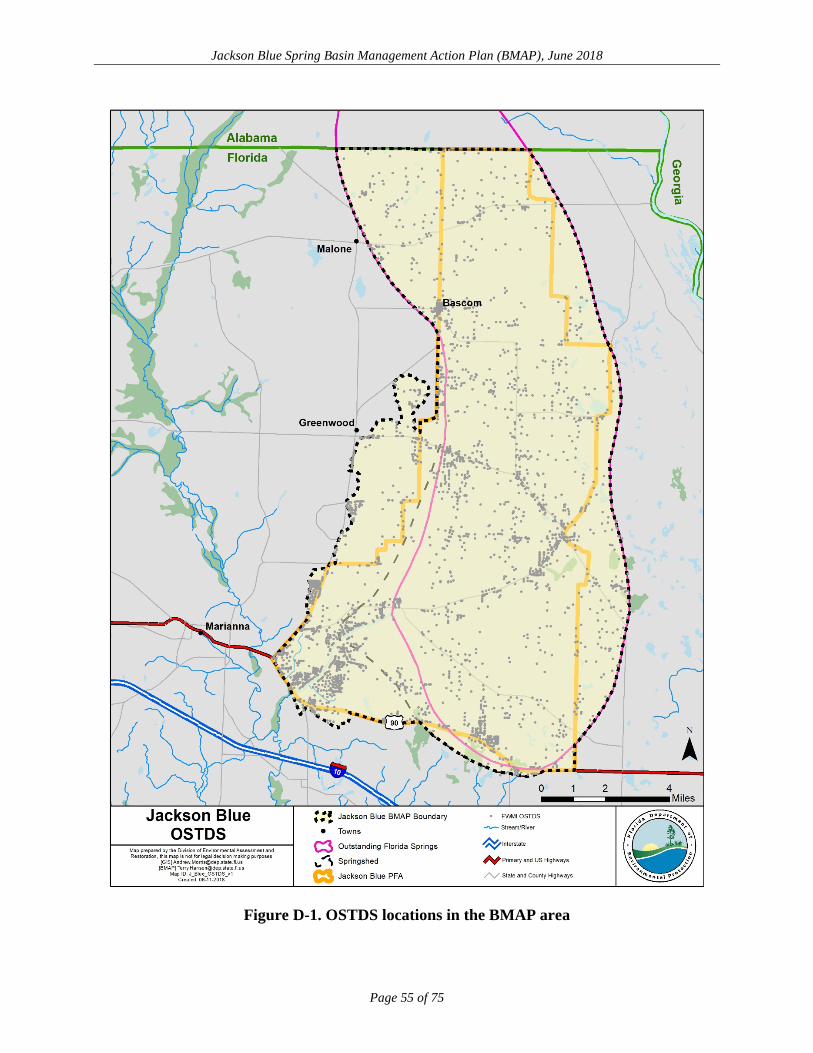
Jackson Blue Spring Basin Management Action Plan (BMAP), June 2018
Page 55 of 75
Figure D-1. OSTDS locations in the BMAP area

Jackson Blue Spring Basin Management Action Plan (BMAP), June 2018
Page 56 of 75
D.4 Public Education Plan
DEP and FDOH will develop and disseminate educational material focused on homeowners and guidance for builders and septic system contractors. The materials will identify the need for advanced, nitrogen reducing OSTDS along with the requirements for installing nitrogen reducing technologies under this OSTDS remediation plan. DEP will coordinate with industry groups such as Florida Home Builders Association and the Florida Onsite Wastewater Association (FOWA).

Jackson Blue Spring Basin Management Action Plan (BMAP), June 2018
Page 57 of 75
Appendix E. NSILT Report
E.1 NSILT Data
An NSILT workbook was completed for the Jackson Blue Basin that delineated groundwater contributing areas for Jackson Blue Spring and Merritts Mill Pond. This technical support information identifies the data sources relied upon during NSILT development and documents the major assumptions used by DEP when applying the NSILT approach to the springshed in the Jackson Blue BMAP.
The general NSILT approach involves estimating the nitrogen load to the surface for various source categories based on land use. The NSILT subjects the surface loading to recharge and attenuation to derive the estimated load to groundwater at the top of the aquifer. The estimated load to groundwater determines the scope of reduction strategies needed in the BMAP for each source category. For additional information about the general NSILT approach, see any of the NSILT reports posted online at http://publicfiles.dep.state.fl.us/DEAR/NSILT.
E.1.1 General Data Inputs
Hydrogeology and Aquifer Recharge Within the Jackson Blue Spring-Merritts Mill Pond contributing area, there is minimal surface drainage with considerable local recharge into the UFA which is the predominant source of ground water in this area. Within this region of Florida, there is insufficient data quantifying recharge; therefore, soil drainage is utilized as an indicator for recharge. This soil data is obtained from the National Cooperative Soil Survey SSURGO dataset.
Land Use Land use information is from NWFWMD based on the 2012 Florida Land Use Cover and Forms Classification System (FLUCCS); 2014 property appraiser data for Jackson County; 2013 Farm Service Agency (FSA) aerial photography of crops and land use classifications based on the FLUCCS; 2014 National Agricultural Statistics Service (NASS) Cropscape satellite imagery-based land use data designed to capture the 2014 growing season; and 2014 FSAID irrigated agricultural lands based on field verification for farming operations.
E.1.2 Land Surface Nitrogen Inputs
Atmospheric Deposition Atmospheric deposition information is derived from the TDEP hybrid model (Schwede and Lear 2014) that inputs wet and dry monitoring network data for the U.S. and calculates an estimated TN deposition load. The data set is comprised of data from 2011 to 2013.
WWTFs There are no WWTFs located within the Jackson Blue BMAP groundwater contributing areas.
Jackson Blue Spring Basin Management Action Plan (BMAP), June 2018
Page 58 of 75
OSTDS FDOH is continuously updating the OSTDS inventory for the entire state, known as the "Florida Water Management Inventory." The results of this process are used to estimate the total number of OSTDS.
The population served by the OSTDS was estimated using the 2010 U.S. Census Bureau data. Data were used to estimate the effective population and OSTDS usage. This resulted in a per capita contribution of 9.012 lb-N/yr.
UTF (including STF) Nitrogen in fertilizer used in urban areas was assumed to be applied mostly to golf courses and residential lawns. UTF inputs in the groundwater contributing areas were estimated using fertilizer sales data compiled by FDACS. It was assumed that the majority of the fertilizer was purchased locally and that out-of-county sales of fertilizer were not significant.
The FDACS sales reports provide data for the entire county, while only a portion of the county is included within the contributing areas. To estimate the amount of fertilizer applied just within the contributing areas, the NWFWMD land use coverage was used to provide a breakdown of the land area likely to receive urban fertilizers (residential lands, recreational facilities, and golf courses). The land areas were totaled for the entire county as well as the land areas representing soil drainage classes. These summations were used to calculate a land use percentage relative to the entire county for urban lands in the different drainage classes. These percentages were then applied to the total fertilizers sold for urban uses.
FF Crop acreage was identified by using a composite land use coverage comprised of data from FSAID, NWFWMD land use, NASS Cropscape, FSA, and Jackson County Property Appraiser. Agricultural fertilizer is applied at varying rates, depending on crop type and farm practices. Estimated applications rates are based on UF-IFAS recommendations. The associated application rate was applied to the calculated acreage for the corresponding crop types by drainage area by contributing area to estimate FF input. LW Livestock population estimates were obtained through the United States Department of Agriculture (USDA) Census of Agriculture (CoA) 2012 census report. As was the case with the fertilizer sales data, CoA provides full county information and land use percentages were utilized to estimate the BMAP area populations. Nitrogen waste factors were assigned for each animal type and applied to the estimated livestock populations to estimate the nitrogen input to the land surface.
Estimated Nitrogen Inputs to Land Surface The estimated input from each source category above is summed and a relative percent calculated.

Jackson Blue Spring Basin Management Action Plan (BMAP), June 2018
Page 59 of 75
E.1.3 Nitrogen Attenuation and Loading to Groundwater
The two types of attenuation that are evaluated are biochemical attenuation factors (BAFs) and hydrogeological attenuation (recharge for each soil drainage class).
BAFs and Uncertainty Factors The BAFs used to account for the processes affecting the movement of nitrogen from each source category in the subsurface are based on literature review of studies in Florida and similar areas. The BAFs in Table E-9 are the result of this evaluation. The BAF is used to estimate what percent of the surface input could infiltrate to groundwater. For example, if 70 % of urban fertilizer is biologically attenuated, then the remaining 30 % could infiltrate to the groundwater. The environmental attenuation of nitrogen from specific sources within the categories can vary substantially, both spatially and with depth in the subsurface, and will affect the amount of nitrogen leaching to groundwater and the relative contribution of nitrogen from each source category. The range in nitrogen attenuation can result from variability in soil properties, crop types, agricultural practices, nitrogen storage, volatilization of ammonia to the atmosphere, uptake by vegetation, denitrification, and other removal processes.
The potential range in nitrogen attenuation for each source is shown in Table E-9.
Table E-1. Range of environmental attenuation of nitrogen from a detailed literature review
N Source Category Low-Level
Attenuation (%) Attenuation Used
for This Analysis (%) High-Level
Attenuation (%) Atmospheric Deposition 85 90 95
WWTFs-RIBs 10 25 40 WWTFs-Sprayfield 50 60 75
Septic Systems 40 50 75 Livestock Operations 80 90 95
Farm Fertilizers 50 80 85 Urban Fertilizers 50 70 85
Hydrogeological Attenuation (i.e. Recharge) The recharge rate for the area where the surface input is calculated is based on the soil drainage map previously described. To account for variations in recharge rates to the UFA, non-attenuated nitrogen inputs in well drained recharge areas are multiplied by a weighting factor of 0.9, while nitrogen inputs are multiplied by a weighting factor of 0.7 for moderately drained recharge areas and 0.1 for poorly drained recharge areas. Estimated Nitrogen Loads to Groundwater The surface inputs by source category are adjusted by applying the BAFs for the appropriate source category and location-based recharge factors to estimate the load to groundwater by source category. It is important to note that this load is estimated for the top of the aquifer. As the load interacts with the aquifer, additional factors likely modify it prior to discharge at the spring vents.

Jackson Blue Spring Basin Management Action Plan (BMAP), June 2018
Page 60 of 75
E.2 References
Schwede, D.B., and G.G. Lear. 2014. A novel hybrid approach for estimating total deposition in the United States. Atmospheric Environment 92: 207–220.
U.S. Department of Agriculture Census of Agriculture website: https://www.agcensus.usda.gov.

Jackson Blue Spring Basin Management Action Plan (BMAP), June 2018
Page 61 of 75
Appendix F. FDACS Information on BMPs
F.1 Implementation of Agricultural BMPs
Agricultural nonpoint sources in a BMAP area are required by state law (Subsection 403.067[7], F.S.) either to implement FDACS-adopted BMPs, which provides a presumption of compliance with water quality standards, or to conduct water quality monitoring prescribed by DEP or NWFWMD. Failure either to implement BMPs or conduct monitoring may result in enforcement action by DEP.
Growers who implement BMPs may be eligible for cost-share funding from FDACS, NWFWMD, or others to defray partially the costs of implementation. Through OAWP, the Florida Forest Service, and the Division of Aquaculture, FDACS develops, adopts, and assists producers in implementing agricultural BMPs to improve water quality and water conservation.
FDACS identified potential land for enrollment in the FDACS BMP Program within the Jackson Blue Springs and Merritts Mill Pond BMAP area using the FSAID IV geodatabase.
Table F-1 summarizes the land use data for agriculture in the Jackson Blue Springshed and Merritts Mill Pond Basin. Based on the FSAID IV geodatabase, the total agricultural lands within the Jackson Blue Springshed and Merritts Mill Pond Basin is 41,559 acres. Table F-2 summarizes the agricultural land by crop type that was estimated to be fertilized and the corresponding acreages. The primary agricultural fertilized land use in the Jackson Blue Springshed is cropland which comprises 73 % of the fertilized land use in the springshed. Table F-3 provides a summary of the agricultural lands with livestock. It is important to note that some of the agricultural lands include more than one agricultural practice.
Figure F-1 shows the approximate location of the agricultural lands based on the FSAID within the Jackson Blue Springshed and Merritts Mill Pond Basin.
Table F-1. Agricultural land use within the Jackson Blue Springshed and Merritts Mill Pond Basin
Agricultural Nitrogen Loading Category Acres Crop Fertilizer Lands only 16,854
Livestock Lands only 2,135
Crop Fertilizer and Livestock Lands 9,145
Abandoned/Fallow/Former 13,425
Total 41,559
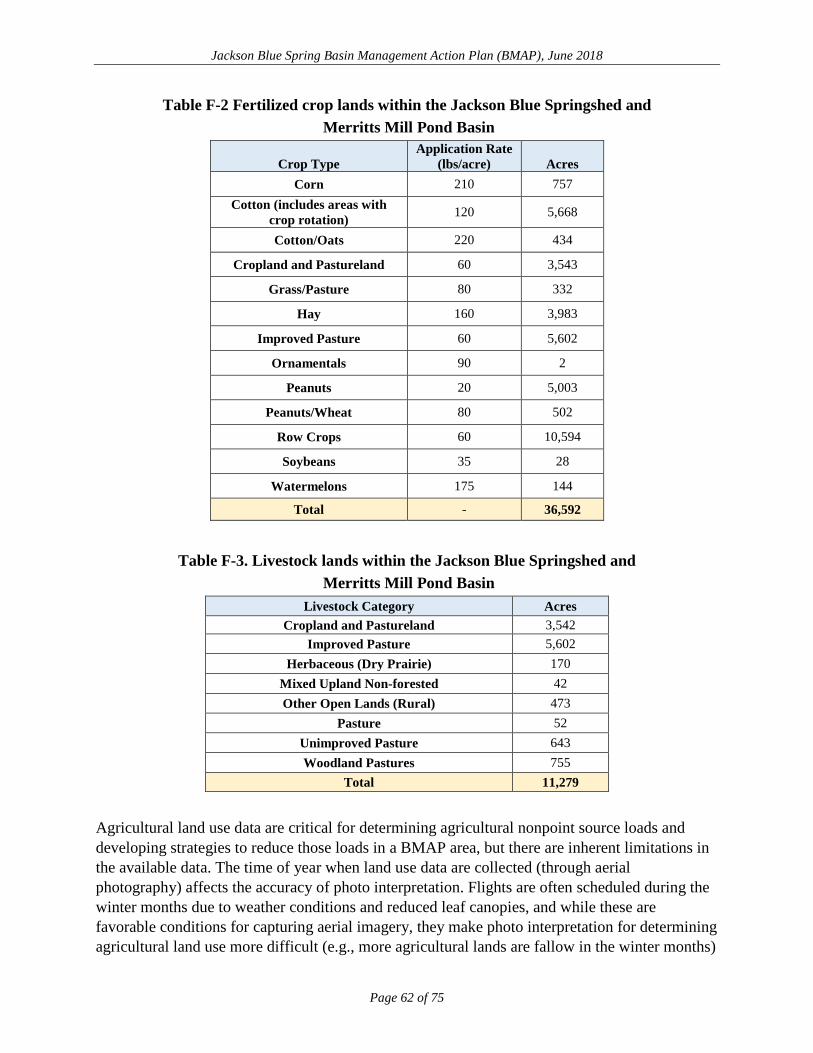
Jackson Blue Spring Basin Management Action Plan (BMAP), June 2018
Page 62 of 75
Table F-2 Fertilized crop lands within the Jackson Blue Springshed and Merritts Mill Pond Basin
Crop Type Application Rate
(lbs/acre) Acres Corn 210 757
Cotton (includes areas with crop rotation) 120 5,668
Cotton/Oats 220 434
Cropland and Pastureland 60 3,543
Grass/Pasture 80 332
Hay 160 3,983
Improved Pasture 60 5,602
Ornamentals 90 2
Peanuts 20 5,003
Peanuts/Wheat 80 502
Row Crops 60 10,594
Soybeans 35 28
Watermelons 175 144
Total - 36,592
Table F-3. Livestock lands within the Jackson Blue Springshed and Merritts Mill Pond Basin
Livestock Category Acres Cropland and Pastureland 3,542
Improved Pasture 5,602 Herbaceous (Dry Prairie) 170
Mixed Upland Non-forested 42 Other Open Lands (Rural) 473
Pasture 52 Unimproved Pasture 643 Woodland Pastures 755
Total 11,279
Agricultural land use data are critical for determining agricultural nonpoint source loads and developing strategies to reduce those loads in a BMAP area, but there are inherent limitations in the available data. The time of year when land use data are collected (through aerial photography) affects the accuracy of photo interpretation. Flights are often scheduled during the winter months due to weather conditions and reduced leaf canopies, and while these are favorable conditions for capturing aerial imagery, they make photo interpretation for determining agricultural land use more difficult (e.g., more agricultural lands are fallow in the winter months)

Jackson Blue Spring Basin Management Action Plan (BMAP), June 2018
Page 63 of 75
and can result in inappropriate analysis of the photo imagery. There is also a significant variation in the frequency with which various sources of data are collected and compiled, and older data are less likely to capture the frequent changes that often typify agricultural land use. In addition, agricultural activity being conducted on the land is not always apparent. For example, acreage classified as improved pasture may be used for a cow-calf operation, consist of forage grass that is periodically harvested for hay, or simply be a fallow vegetable field awaiting planting. Finally, the classification method itself may be an issue. For example, property appraiser data assigns an agricultural land use designation to an entire parcel, although agricultural production may only be conducted on a portion of the parcel. Because of error in the collection and characterization of land use data and changes in land use over time, agricultural land use acreage estimates are subject to adjustment.

Jackson Blue Spring Basin Management Action Plan (BMAP), June 2018
Page 64 of 75
Figure F-1. Agricultural lands in the Jackson Blue Springshed and Merritts Mill Pond
Basin
This map is the product of the Department of Agriculture and Consumer Services, Office of Agricultural Water Policy. It represents estimated areas of production agriculture, it is not binding, and does not otherwise affect the interests of any persons, including any vested rights or existing uses of real property. The accuracy and reliability of this map is not guaranteed. Production agricultural acreage is affected by continual changes in land use, crop production, and other socioeconomic factors.
Jackson Blue Spring Basin Management Action Plan (BMAP), June 2018
Page 65 of 75
F.2 Agricultural BMPs
Through the Office of Agricultural Water Policy, the Florida Forest Service, and the Division of Aquaculture, FDACS develops, adopts, and assists producers in implementing agricultural BMPs to improve water quality and water conservation. Adopted BMPs are initially verified by the FDEP as reducing nutrient loss (e.g., total nitrogen and total phosphorus [TP]) to the environment. OAWP BMPs are published in commodity-specific manuals that cover key aspects of water quality and water conservation. The BMP categories include:
• Nutrient Management practices that help determine appropriate source, rate, timing, placement of nutrients (including both organic and inorganic sources) to minimize impacts to water resources.
• Irrigation and Water Table Management practices that address methods for irrigating to reduce water and nutrient losses to the environment and to maximize the efficient use and distribution of water.
• Water Resource Protection practices such as buffers, setbacks, and swales to reduce or prevent the transport of nutrients and sediments from production areas to water resources.
The Notice of Intent to Implement (NOI) and BMP checklist are incorporated into each manual.
Information on the BMP manuals and field staff contact information can be obtained here: http://www.freshfromflorida.com/Divisions-Offices/Agricultural-Water-Policy. Printed BMP manuals can be obtained by contacting OAWP field staff.
OAWP outreach to solicit enrollment extends to all types of agricultural operations, but is more intensive in BMAP areas because of the relationship of BMPs to the presumption of compliance with water quality standards in a BMAP area. FDACS field staff works with producers to enroll in the FDACS BMP program by signing a Notice of Intent to Implement BMPs, and enrollment is based on the expectation that producers recognize and address the water quality and conservation issues associated with their operations. Upon completion of all information in the BMP checklist, an NOI must be signed by the landowner or the landowner’s authorized agent (who may be the producer if the producer is not the landowner).
F.3 BMP Enrollment
Figure F-2 shows the acres enrolled in the FDACS BMP Program in the Jackson Blue Springshed and Merritts Mill Pond Basin as of December 31, 2017. Table F-4 lists the acres enrolled in the FDACS BMP Program by manual. Given that the enrolled acres where BMPs are implemented can contain nonproduction acres (such as buildings, parking lots, and fallow acres),

Jackson Blue Spring Basin Management Action Plan (BMAP), June 2018
Page 66 of 75
only the enrollment for the land classified as agriculture based on the FSAID is also included in the tables.
As of December 31, 2017, the NOIs cover approximately 29,877 acres in the Jackson Blue Springshed and Merritts Mill Pond Basin. No producers are conducting water quality monitoring in lieu of implementing BMPs at this time.
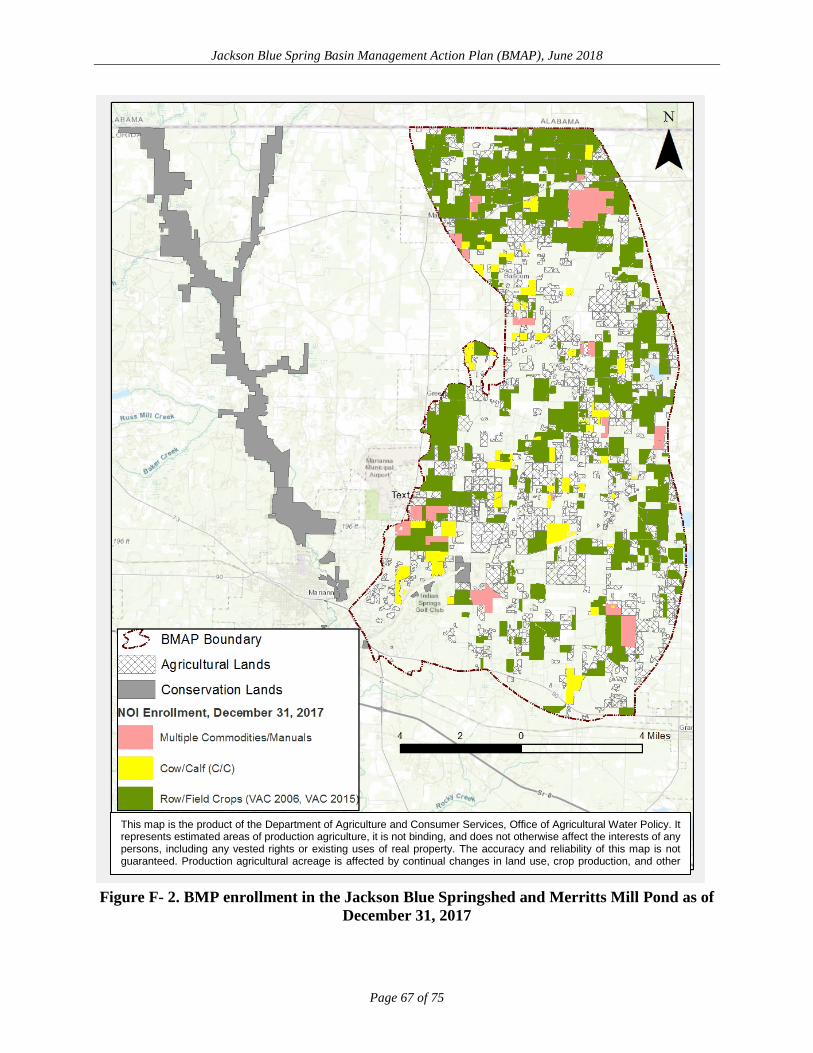
Jackson Blue Spring Basin Management Action Plan (BMAP), June 2018
Page 67 of 75
Figure F- 2. BMP enrollment in the Jackson Blue Springshed and Merritts Mill Pond as of
December 31, 2017
This map is the product of the Department of Agriculture and Consumer Services, Office of Agricultural Water Policy. It represents estimated areas of production agriculture, it is not binding, and does not otherwise affect the interests of any persons, including any vested rights or existing uses of real property. The accuracy and reliability of this map is not guaranteed. Production agricultural acreage is affected by continual changes in land use, crop production, and other

Jackson Blue Spring Basin Management Action Plan (BMAP), June 2018
Page 68 of 75
Table F-4. Agricultural acreage and BMP enrollment in the Jackson Blue Springshed and Merritts Mill Pond Basin as of December 31, 2017
Related FDACS BMP Programs NOI Acreage
Enrolled FSAID Agricultural Land
Use Acres within NOIs Cow/Calf Operations 3,159 2,086
Cow/Calf Operations and Row/Field Crops 2,923, 2,191
Row Field Crops 23,795 18,885
Total 29,877 23,162
F.4 FDACS OAWP Role in BMP Implementation and Follow-Up
OAWP works with producers to submit NOIs to implement the BMPs applicable to their operations, provides technical assistance to growers, and distributes cost-share funding, as available, to eligible producers for selected practices. OAWP follows up with growers through site visits to evaluate the level of BMP implementation and record keeping, identify areas for improvement, if any, and discuss cost-share opportunities.
When DEP adopts a BMAP that includes agriculture, it is the agricultural producer’s responsibility to implement BMPs adopted by FDACS to help achieve load reductions. If land use acreage corrections and BMP implementation do not fully account for the current agricultural load reduction allocation, it may be necessary to develop and implement additional projects and practices that reduce nutrients from agricultural nonpoint sources. In that case, FDACS will work with DEP and NWFWMD to identify appropriate options for achieving further agricultural load reductions.
Section 403.067, F.S., requires that, where water quality problems are demonstrated despite the proper implementation of adopted agricultural BMPs, FDACS must reevaluate the practices, in consultation with DEP, and modify them if necessary. Continuing water quality problems will be detected through the BMAP monitoring component and other DEP and NWFWMD activities. If a reevaluation of the BMPs is needed, FDACS will also include NWFWMD and other partners in the process.
F.5 OAWP Implementation Verification (IV) Program
OAWP established an Implementation Assurance (IA) Program in 2005 in the Suwannee River Basin as part of the multi-agency/local stakeholder Suwannee River Partnership. In early 2014, OAWP began to streamline the IA Program to ensure consistency statewide and across commodities and BMP manuals. The IA Program was based on interactions with producers during site visits by OAWP staff and technicians as workload allowed. For the visits, field staff and technicians used a standard form (not BMP specific) developed in 2014, that focused on nutrient management, irrigation management, and water resource protection BMPs common to all of the BMPs that were adopted by rule. Once completed, these paper forms were submitted to OAWP staff and compiled into a spreadsheet, and the data were reported annually.
Jackson Blue Spring Basin Management Action Plan (BMAP), June 2018
Page 69 of 75
On November 1, 2017, the OAWP’s Implementation Verification rule (Chapter 5M-1, F.A.C.) became effective. The IV program provides the basis for assessing the status of BMP implementation and for identifying enrolled producers who require assistance with BMP implementation. The components of the IV program are 1) site visits; 2) implementation status reporting on common practices that apply across all BMP manuals; 3) technical assistance; and 4) external reporting. Implementation verification is confirmed by field staff through site visits and by producers through annual common practices status reports.
Site visits to agricultural operations by OAWP field staff and contract technicians are the most effective means to determine the status of BMP implementation. These visits also provide an opportunity to identify needs for assistance with implementation and explore potential improvements. Resource limitations prevent site visits from occurring on all enrolled operations every year, and for that reason, site visits are prioritized. The program objective is for field staff to conduct site visits for 5-10% of active NOIs each year, with approximately 10% of the site visit locations selected randomly.
Per the implementation verification rule, each year, producers participating in the BMP program will be requested to participate in reporting on the status of implementation of common practices only for their operations. Lack of response from enrollees with parcels in a BMAP area raises the priority of the operation for a site visit from field staff. Where a need is identified, the OAWP may facilitate technical assistance for the producer from UF/IFAS or other resources, including third-party vendors. In some cases, cost share support may be available. Data from producers and site visits will be used to complete the annual reports on the status of BMP implementation as required by s. 403.0675(2), F.S., beginning July 1, 2018.
F.6 Beyond BMPs
Beyond enrolling producers in the FDACS BMP Program and verifying implementation, FDACS will work with DEP to improve the data used to estimate agricultural land uses in the springshed. FDACS will also work with producers to identify a suite of agricultural projects and research agricultural technologies that could be implemented on properties where they are deemed technically feasible and if funding is made available. Acreages provided by FDACS are preliminary estimates that are the maximum acreages and will need to be evaluated and refined over time.
As presented here, these projects are based on planning-level information. Actual implementation would require funding as well as more detailed design based on specific information, such as actual applicable acreages and willing landowners. Table F-5 summarizes potential practices that could be implemented in this BMAP area. It is important to note that the research projects listed in the table are being conducted in the Suwannee River Basin. At some future point, the findings of these studies may be applicable to the Jackson Blue Springshed and Merritts Mill Pond Basin. Actual implementation would require funding as well as more detailed design based on specific information, such as actual applicable acreages and willing landowners.

Jackson Blue Spring Basin Management Action Plan (BMAP), June 2018
Page 70 of 75
Table F-5. Beyond BMP implementation
Category Name Description
Practices Precision Irrigation Deployment of equipment, procedures, and training to improve location, volume, and timing of irrigation to match crop needs
more precisely.
Practices Soil Moisture Probes Deployment, training, technical support, and use of soil moisture probes to manage irrigation systems.
Practices Cover Crops Planting of cover crops between production cycles to increase
soil organic content, improve nutrient retention, and reduce erosion.
Research Bioreactors Bioreactors/denitrification walls and onsite capture and reuse of high-N water.
Research Rotational Production Conversion of conventional production operations to planned
rotational production incorporating grass and cover crops. May include cattle.
Research Soil Moisture Sensor Deployment and Calibration
Installation, training, monitoring, and research on use of electronic soil moisture sensors, including correlations to
nutrient movement through the root zone.
Research Controlled Release Fertilizer (CRF)
Application of new and developing fertilizer products that become available to crops via dissolution over longer periods in
the growing season.
Research Reuse of High Nutrient Value Water Sources
Study of potential sources of high nutrient value water, potential beneficial reuse sites, legal and regulatory obstacles, and costs.

Jackson Blue Spring Basin Management Action Plan (BMAP), June 2018
Page 71 of 75
Appendix G. Future Growth Strategies of Local Jurisdictions
Table G-1. Future growth strategies of Jackson County Local
Jurisdiction Strategy Name Description Strategy Type Status Jackson County Ordinance 87-4 Private Sewage Disposal System Ordinance Completed
Jackson County Ordinance 97-01 Water and Sewer Systems for
Unincorporated Urban-Character Areas Ordinance Completed
Jackson County Ordinance 97-01
Section 102-93: Septic tanks shall be constructed, repaired, altered, enlarged
and maintained in accordance with plans and specifications approved by FDOH,
county environmental health unit. Package sewage treatment plants for on-site sewage disposal shall be constructed,
repaired, altered, enlarged and maintained in accordance with plans and
specifications approved by DEP.
Ordinance Completed
Jackson County Ordinance 97-01
Section 102-93: No septic tank or other on-site waste disposal facility shall be
installed where a public sewer or combined sewer is accessible to the
premises involved. A public sewer or combined sewer shall be accessible to
the premises if the public sewer lines are within 200 feet or less distance from the
nearest point on the property line. A public sewer or combined sewer at a
distance greater than 200 feet from the nearest property line may be deemed
accessible to a proposed development as a result of the issuance of a county
development order, or as a result of the approval by the board of county
commissioners of a preliminary or final subdivision plat.
Ordinance Completed
Jackson County Ordinance 97-01
Section 102-204: The county may require, as a condition of service or as a condition of development approval, a
developer to install necessary lines, lift stations and appropriate appurtenances
for reuse of effluent for irrigation of lawns, common areas, golf courses, etc. The county may charge a reasonable fee for use of the effluent to offset the cost
of operation and maintenance of the reuse system.
Ordinance Completed
Jackson County
Ordinance 2013-06 Landscape Ordinance Ordinance Completed
Jackson County
Future Land Use Policy 6.2
Develop land development code language with the support of DEP and NWFWMD to provide measures for protecting high magnitude springs.
Comprehensive Plan Completed

Jackson Blue Spring Basin Management Action Plan (BMAP), June 2018
Page 72 of 75
Local Jurisdiction Strategy Name Description Strategy Type Status
Jackson County
Conservation Policy 1.5
Throughout the county the maximum residential density is one (1) dwelling
unit per acre for undeveloped land having severe septic tank soil suitability
ratings and where sewer lines are not available, except where density restrictions are more stringent.
Comprehensive Plan Completed
Jackson County
Conservation Policy 2.6
All new proposals for public wastewater facilities shall require a feasibility study
for reuse of wastewater. The County shall require reuse of wastewater where
feasible.
Comprehensive Plan Completed
Jackson County
Conservation Policy 2.9
Lots for which septic tanks are the intended method of sewage disposal
shall not be created unless the size and configuration of the lot would allow for the permitting of a septic tank system
consistent with state regulations in place at that time.
Comprehensive Plan Completed
Jackson County
Conservation Policy 9.1
Protect high magnitude springs using the latest science and technology available.
The County will adopt all state and federal rules identified by statute and
will develop language as state and federal funding is made available.
Comprehensive Plan Completed
Jackson County
Conservation Policy 9.2
Develop appropriate language in order to minimize the contribution of nitrates to
groundwater to foster long-term stewardship of springs, special design,
and BMPs.
Comprehensive Plan Completed
Jackson County
Conservation Policy 10.1
The County will coordinate with FGS, NWFWMD, and DEP to map major
spring basins as federal, state, or regional funding becomes available.
Comprehensive Plan Completed
Jackson County
Conservation Policy 11.1
Using FGS, NWFWMD, and DEP databases and federal, state, and regional
funding, the County will identify and delineate buffer areas around major
springs and sinkholes and swallets with direct connection to the aquifer.
Comprehensive Plan Completed
Jackson County
Conservation Policy 11.4
Where it is not possible to fully avoid negative impacts through limiting or
prohibiting land use activities, the impact of use and development within one-quarter (1/4) mile of first magnitude
springs shall be minimized and mitigated to the maximum feasible extent.
Comprehensive Plan Completed
Jackson County
Conservation Policy 11.5
The maximum residential density within 1/4 mile of a first magnitude springs is 1
unit per acre.
Comprehensive Plan Completed
Jackson County
Conservation Objective 12
Manage the amount of fertilization and water use within a designated radius
from springs.
Comprehensive Plan Completed
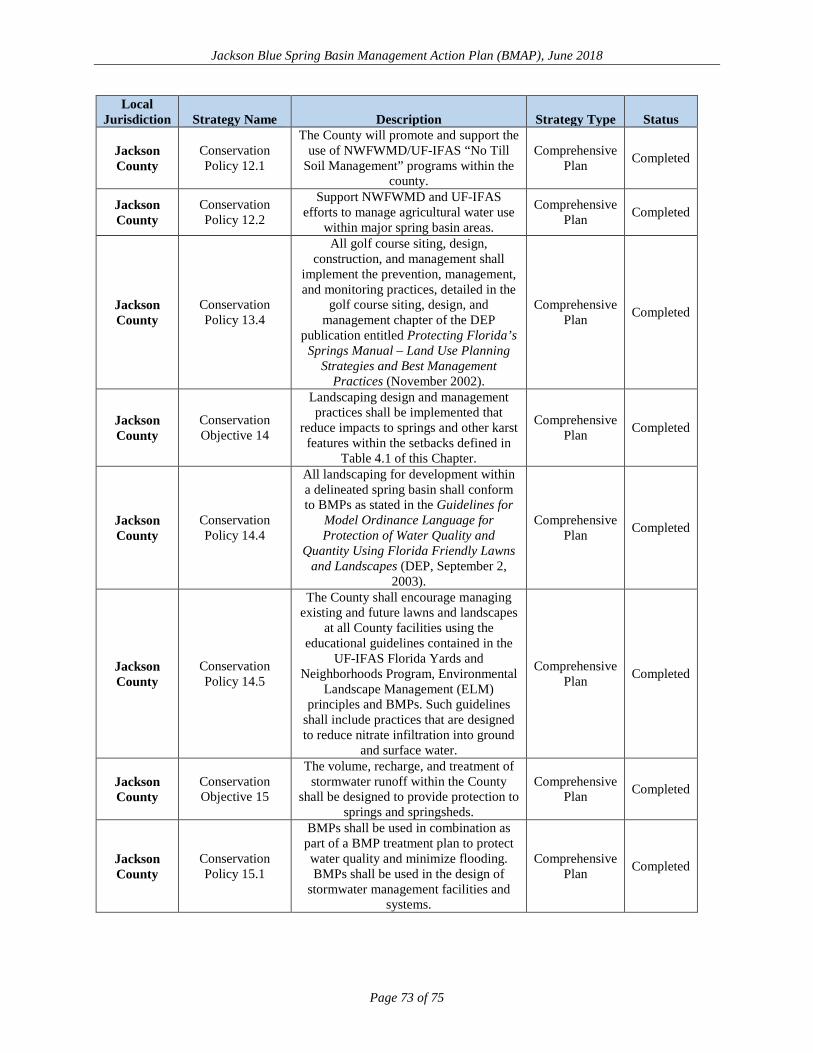
Jackson Blue Spring Basin Management Action Plan (BMAP), June 2018
Page 73 of 75
Local Jurisdiction Strategy Name Description Strategy Type Status
Jackson County
Conservation Policy 12.1
The County will promote and support the use of NWFWMD/UF-IFAS “No Till
Soil Management” programs within the county.
Comprehensive Plan Completed
Jackson County
Conservation Policy 12.2
Support NWFWMD and UF-IFAS efforts to manage agricultural water use
within major spring basin areas.
Comprehensive Plan Completed
Jackson County
Conservation Policy 13.4
All golf course siting, design, construction, and management shall
implement the prevention, management, and monitoring practices, detailed in the
golf course siting, design, and management chapter of the DEP
publication entitled Protecting Florida’s Springs Manual – Land Use Planning
Strategies and Best Management Practices (November 2002).
Comprehensive Plan Completed
Jackson County
Conservation Objective 14
Landscaping design and management practices shall be implemented that
reduce impacts to springs and other karst features within the setbacks defined in
Table 4.1 of this Chapter.
Comprehensive Plan Completed
Jackson County
Conservation Policy 14.4
All landscaping for development within a delineated spring basin shall conform to BMPs as stated in the Guidelines for
Model Ordinance Language for Protection of Water Quality and
Quantity Using Florida Friendly Lawns and Landscapes (DEP, September 2,
2003).
Comprehensive Plan Completed
Jackson County
Conservation Policy 14.5
The County shall encourage managing existing and future lawns and landscapes
at all County facilities using the educational guidelines contained in the
UF-IFAS Florida Yards and Neighborhoods Program, Environmental
Landscape Management (ELM) principles and BMPs. Such guidelines
shall include practices that are designed to reduce nitrate infiltration into ground
and surface water.
Comprehensive Plan Completed
Jackson County
Conservation Objective 15
The volume, recharge, and treatment of stormwater runoff within the County
shall be designed to provide protection to springs and springsheds.
Comprehensive Plan Completed
Jackson County
Conservation Policy 15.1
BMPs shall be used in combination as part of a BMP treatment plan to protect water quality and minimize flooding. BMPs shall be used in the design of
stormwater management facilities and systems.
Comprehensive Plan Completed

Jackson Blue Spring Basin Management Action Plan (BMAP), June 2018
Page 74 of 75
Local Jurisdiction Strategy Name Description Strategy Type Status
Jackson County
Conservation Objective 16
Coordinate with local governments to ensure a consistent approach to springs,
springshed, and aquifer protection.
Comprehensive Plan Completed
Jackson County
Conservation Policy 16.1
The County will support the implementation of an interlocal
agreement that specifies responsibilities for land development regulation,
stormwater management, and other matters that impact the springs and
springshed. The interlocal agreement shall contain joint strategies for spring
protection to be implemented by all local governments within an identified
springshed.
Comprehensive Plan Completed
Jackson County
Intergovernmental Coordination Objective 16
Coordinate with local governments to ensure a consistent approach to springs,
springshed, and aquifer protection.
Comprehensive Plan Completed
Jackson County
Infrastructure Policy 1.1.2
Systems for all types of development within Commercial and Industrial Land Use categories or any land use category
within the urban service area shall be conditioned to require that users be
connected to central water and sewer facilities within 365 days after receiving notice of availability of public water or sewer supply or collection system lines.
Comprehensive Plan Completed
Jackson County
Infrastructure Policy 1.2.4
In areas to be served by on-site wastewater treatment systems, final
development orders shall not be issued prior to demonstration that applicable federal, state, and local permits for on-site wastewater treatment systems have
been obtained.
Comprehensive Plan Completed
Jackson County
Infrastructure Policy 1.2.7
Development shall not be permitted in areas not served by public sanitary sewer
unless site is approved by DEP or another designated agency for in-ground
septic system or developer agrees to provide a state-permitted sewer system
concurrent with the development.
Comprehensive Plan Completed
Jackson County
Infrastructure Policy 1.4.2
The County will continue to support participation in watershed protection efforts. Efforts to identify and protect
critical watershed areas will include use of the land development code, BMPs, or
acquisition. Jackson County will continue to seek funding opportunities
for watershed management and protection projects.
Comprehensive Plan Completed
Jackson County
Infrastructure Objective 2.1
Use sound management practices regarding prime groundwater aquifer recharge areas and natural drainage features through adoption of land
Comprehensive Plan Completed

Jackson Blue Spring Basin Management Action Plan (BMAP), June 2018
Page 75 of 75
Local Jurisdiction Strategy Name Description Strategy Type Status
development regulations and establishment of coordination
mechanisms with federal, state, and local agencies.
Jackson County
Infrastructure Objective 2.2
Conserve and protect potable water resources from adverse impacts through adoption of the land development code and BMPs coordinating with federal,
state, and local agencies.
Comprehensive Plan Completed