Embed Size (px)
Citation preview

(JA0)
Department of Human Servicesdhs.dc.govTelephone: 202-671-4200
Table JA0-1
DescriptionFY 2019
ActualFY 2020
ActualFY 2021
ApprovedFY 2022
Approved
% Changefrom
FY 2021OPERATING BUDGET $564,252,797 $614,753,956 $609,933,995 $723,489,380 18.6FTEs 1,168.7 1,169.0 1,314.3 1,363.2 3.7CAPITAL BUDGET $67,213,260 $41,373,791 $5,777,000 $66,782,000 1,056.0FTEs 2.0 1.0 0.0 0.0 N/A
The mission of the District of Columbia Department of HumanServices (DHS) is to empower every District resident to reach their fullpotential by providing meaningful connections to work opportunities,economic assistance, and supportive services.
Summary of ServicesThe mission of DHS is achieved via the following agency programs:
Agency Management/Office of the Director: provides executive management, policy direction, strategicand financial planning, human capital management, information technology, capital programs, legislative andcommunity relations, and performance management. The Office of Program Review, Monitoring, andInvestigation includes agency risk management, fraud investigation, homeless shelter monitoring, and aquality control division.
Economic Security Administration(ESA): determines and maintains eligibility for cash, food, child care,and medical benefits. ESA also, through a Two Generational approach, administers the Temporary Assistancefor Needy Families (TANF) and Supplemental Nutritional Assistance Program (SNAP) Employment andTraining programs, which provide employment and training-related activities designed to improve long-termemployability and achieve sustaining income.
Family Services Administration (FSA): provides an array of social services and supports for Districtresidents to solve crises, strengthen families, and connect residents to resources and programs to improvetheir well-being. FSA manages a system of care to make homelessness rare, brief and non-recurring;administers a system of services and supports for youth who are at-risk of court involvement, schooldisengagement, homelessness and repeat teen pregnancy; and provides crisis-intervention services forfamilies and refugees.
The agency’s FY 2022 approved budget is presented in the following tables:

FY 2022 Approved Gross Funds Operating Budget and FTEs, by Revenue TypeTable JA0-2 contains the approved FY 2022 budget by revenue type compared to the FY 2021 approvedbudget. It also provides FY 2019 and FY 2020 actual data.
Table JA0-2(dollars in thousands)
Dollars in Thousands Full-Time Equivalents
Appropriated FundActual
FY 2019Actual
FY 2020Approved
FY 2021Approved
FY 2022
Changefrom
FY 2021%
Change*Actual
FY 2019Actual
FY 2020Approved
FY 2021Approved
FY 2022
Changefrom
FY 2021%
ChangeGENERAL FUNDLocal Funds 375,404 412,095 419,714 510,129 90,415 21.5 649.5 616.0 731.1 790.3 59.3 8.1Special PurposeRevenue Funds -627 727 1,000 900 -100 -10.0 0.0 0.0 0.0 0.0 0.0 N/ATOTAL FORGENERAL FUND 374,778 412,822 420,714 511,029 90,315 21.5 649.5 616.0 731.1 790.3 59.3 8.1FEDERALRESOURCESFederal Payments 0 0 0 44,835 44,835 N/A 0.0 0.0 0.0 2.0 2.0 N/AFederal Grant Funds 173,141 183,149 169,294 147,999 -21,295 -12.6 370.6 371.0 416.5 398.8 -17.8 -4.3Federal MedicaidPayments 13,653 15,925 16,562 16,124 -438 -2.6 128.9 160.0 145.7 146.1 0.5 0.3TOTAL FORFEDERALRESOURCES 186,794 199,074 185,856 208,958 23,102 12.4 499.5 531.0 562.2 546.9 -15.3 -2.7PRIVATE FUNDSPrivate Donations 0 13 0 0 0 N/A 0.0 0.0 0.0 0.0 0.0 N/ATOTAL FORPRIVATE FUNDS 0 13 0 0 0 N/A 0.0 0.0 0.0 0.0 0.0 N/AINTRA-DISTRICTFUNDSIntra-District Funds 2,681 2,845 3,364 3,503 138 4.1 19.7 22.0 21.0 26.0 5.0 23.8TOTAL FORINTRA-DISTRICTFUNDS 2,681 2,845 3,364 3,503 138 4.1 19.7 22.0 21.0 26.0 5.0 23.8GROSS FUNDS 564,253 614,754 609,934 723,489 113,555 18.6 1,168.7 1,169.0 1,314.3 1,363.2 49.0 3.7*Percent change is based on whole dollars.
Note: If applicable, for a breakdown of each Grant (Federal and Private), Special Purpose Revenue type and Intra-District agreement,please refer to Schedule 80 Agency Summary by Revenue Source in the FY 2022 Operating Appendices located on the Office ofthe Chief Financial Officer’s website.

FY 2022 Approved Operating Budget, by Comptroller Source GroupTable JA0-3 contains the approved FY 2022 budget at the Comptroller Source Group (object class) levelcompared to the FY 2021 approved budget. It also provides FY 2019 and FY 2020 actual expenditures.
Table JA0-3(dollars in thousands)
Comptroller Source GroupActual
FY 2019Actual
FY 2020Approved
FY 2021Approved
FY 2022
Changefrom
FY 2021Percentage
Change*11 - Regular Pay - Continuing Full Time 79,762 90,393 101,989 109,313 7,325 7.212 - Regular Pay - Other 4,849 827 1,307 1,103 -204 -15.613 - Additional Gross Pay 1,508 704 21 12 -9 -42.314 - Fringe Benefits - Current Personnel 21,093 23,172 25,679 28,598 2,919 11.415 - Overtime Pay 3,331 5,868 1 90 90 11,482.8SUBTOTAL PERSONAL SERVICES (PS) 110,542 120,964 128,996 139,117 10,120 7.820 - Supplies and Materials 543 303 513 282 -231 -45.130 - Energy, Communication and Building Rentals 768 675 2,576 2,966 391 15.231 - Telecommunications 1,621 1,769 1,728 2,006 277 16.132 - Rentals - Land and Structures 19,893 23,029 24,882 27,124 2,241 9.034 - Security Services 3,442 2,742 5,008 5,634 625 12.535 - Occupancy Fixed Costs 2,006 2,073 7,044 7,738 694 9.840 - Other Services and Charges 4,492 3,851 5,241 4,346 -894 -17.141 - Contractual Services - Other 9,711 10,095 12,082 12,693 611 5.150 - Subsidies and Transfers 409,578 448,449 421,301 521,078 99,777 23.770 - Equipment and Equipment Rental 1,656 804 562 506 -56 -10.0SUBTOTAL NONPERSONAL SERVICES (NPS) 453,710 493,790 480,938 584,373 103,435 21.5GROSS FUNDS 564,253 614,754 609,934 723,489 113,555 18.6*Percent change is based on whole dollars.
FY 2022 Approved Operating Budget and FTEs, by Division/Program and ActivityTable JA0-4 contains the approved FY 2022 budget by division/program and activity compared to theFY 2021 approved budget. It also provides FY 2019 and FY 2020 actual data. For a more comprehensiveexplanation of divisions/programs and activities, please see the Division/Program Description section, whichfollows the table.
Table JA0-4(dollars in thousands)
Dollars in Thousands Full-Time Equivalents
Division/Program and ActivityActual
FY 2019Actual
FY 2020Approved
FY 2021Approved
FY 2022
Changefrom
FY 2021Actual
FY 2019Actual
FY 2020Approved
FY 2021Approved
FY 2022
Changefrom
FY 2021(0000)No Activity Assigned 0 28 0 0 0 0.0 0.0 0.0 0.0 0.0SUBTOTAL (0000) 0 28 0 0 0 0.0 0.0 0.0 0.0 0.0(1000) AGENCY MANAGEMENT(1010) Personnel 1,459 1,758 1,751 1,772 21 34.7 10.5 14.0 14.0 0.0(1015) Training 0 0 0 163 163 0.0 0.0 0.0 1.0 1.0(1017) Labor Management Partnership 111 152 142 143 1 0.9 0.9 1.0 1.0 0.0(1030) Property Management 1,406 1,403 1,520 3,858 2,337 4.2 5.8 6.5 6.5 0.0

Table JA0-4(dollars in thousands)
Dollars in Thousands Full-Time Equivalents
Division/Program and ActivityActual
FY 2019Actual
FY 2020Approved
FY 2021Approved
FY 2022
Changefrom
FY 2021Actual
FY 2019Actual
FY 2020Approved
FY 2021Approved
FY 2022
Changefrom
FY 2021(1040) Information Technology 15,397 15,136 18,802 18,545 -257 51.5 70.2 66.3 67.2 1.0(1055) Risk Management 6,913 6,059 7,152 7,100 -53 48.5 51.7 61.0 61.0 0.0(1060) Legal Services 1,268 1,352 1,389 1,429 40 6.4 8.0 9.0 9.0 0.0(1080) Communications 626 714 734 746 11 3.9 5.3 6.0 6.0 0.0(1085) Customer Service 52 49 58 58 0 0.7 0.9 1.0 1.0 0.0(1090) Performance Management 3,295 4,112 4,164 4,524 359 17.0 20.3 25.0 29.0 4.0SUBTOTAL (1000) AGENCYMANAGEMENT 30,527 30,735 35,712 38,336 2,623 167.8 173.5 189.8 195.8 6.0(100F) AGENCY FINANCIALOPERATIONS(110F) Budget Operations 837 852 1,020 1,015 -5 2.7 4.4 5.0 5.0 0.0(120F) Accounting Operations 2,082 2,082 2,093 2,130 38 13.2 14.9 17.0 17.0 0.0(130F) ACFO 237 245 279 281 2 0.9 0.9 1.0 1.0 0.0SUBTOTAL (100F) AGENCYFINANCIAL OPERATIONS 3,157 3,179 3,392 3,427 35 16.9 20.1 23.0 23.0 0.0(2000) ECONOMIC SECURITYADMINISTRATION(2011) Burial Assistance 336 272 438 438 0 0.0 0.0 0.0 0.0 0.0(2012) General Assistance for Children 758 704 725 725 0 0.0 0.0 0.0 0.0 0.0(2013) Interim Disability Assistance 4,677 3,686 3,345 3,345 0 0.9 0.0 0.0 0.0 0.0(2020) Temporary Assistance to NeedyFamilies (TANF) 26,937 24,441 1,405 1,445 40 0.0 0.0 0.0 0.0 0.0(2021) Cash Assistance (TANF) 88,550 98,242 96,997 110,340 13,343 0.0 0.0 0.0 0.0 0.0(2022) Job Opportunity and Training(TANF) 19,988 25,942 27,686 28,449 763 0.0 0.0 0.0 0.0 0.0(2024) Supplemental Food Assistance 1,222 1,400 1,155 1,155 0 0.0 0.0 0.0 0.0 0.0(2030) Case Management 16,511 18,355 20,979 24,917 3,938 175.0 159.4 181.0 180.0 -1.0(2040) Eligibility Determination Services 66,843 68,450 75,733 74,159 -1,574 486.4 491.8 561.0 541.0 -20.0(2055) Monitoring and Quality Assurance 4,167 5,156 5,610 7,290 1,680 39.3 44.6 52.0 66.0 14.0(2065) Early Education Subsidy Transfer 36,960 34,960 36,973 35,013 -1,960 0.0 0.0 0.0 0.0 0.0SUBTOTAL (2000) ECONOMICSECURITY ADMINISTRATION 266,949 281,609 271,047 287,275 16,229 701.6 695.7 794.0 787.0 -7.0(5000) FAMILY SERVICES(5010) Adult Protective Services 3,064 2,294 0 0 0 21.0 15.5 0.0 0.0 0.0(5013) Homeless Prevention 0 5,619 6,314 5,439 -875 0.0 0.0 0.0 0.0 0.0(5014) Emergency Rental Assistance(ERAP) 0 7,624 14,023 15,023 1,000 0.0 0.0 0.0 0.0 0.0(5020) Domestic Violence Services 2,018 2,098 2,024 2,359 334 0.0 0.0 0.0 0.0 0.0(5021) Transitional Housing Youth 0 9,815 10,457 10,457 0 0.0 0.0 0.0 0.0 0.0(5022) Youth Services 24,365 10,298 10,482 10,415 -66 88.8 81.7 93.0 96.0 3.0(5023) Homeless Service Continuum -Youth 0 1,565 588 636 48 0.0 0.9 1.0 1.0 0.0(5024) Permanent Supportive Housing -Youth 0 3,713 3,732 3,682 -50 0.0 0.0 0.0 0.0 0.0(5026) Transitional Age Youth Shelter 0 1,980 1,980 1,980 0 0.0 0.0 0.0 0.0 0.0(5027) Rapid Rehousing - Youth 0 1,200 1,200 1,200 0 0.0 0.0 0.0 0.0 0.0(5028) Rapid Rehousing - Individuals(RRH-I) 0 5,872 6,182 5,832 -350 0.0 0.0 0.0 0.0 0.0
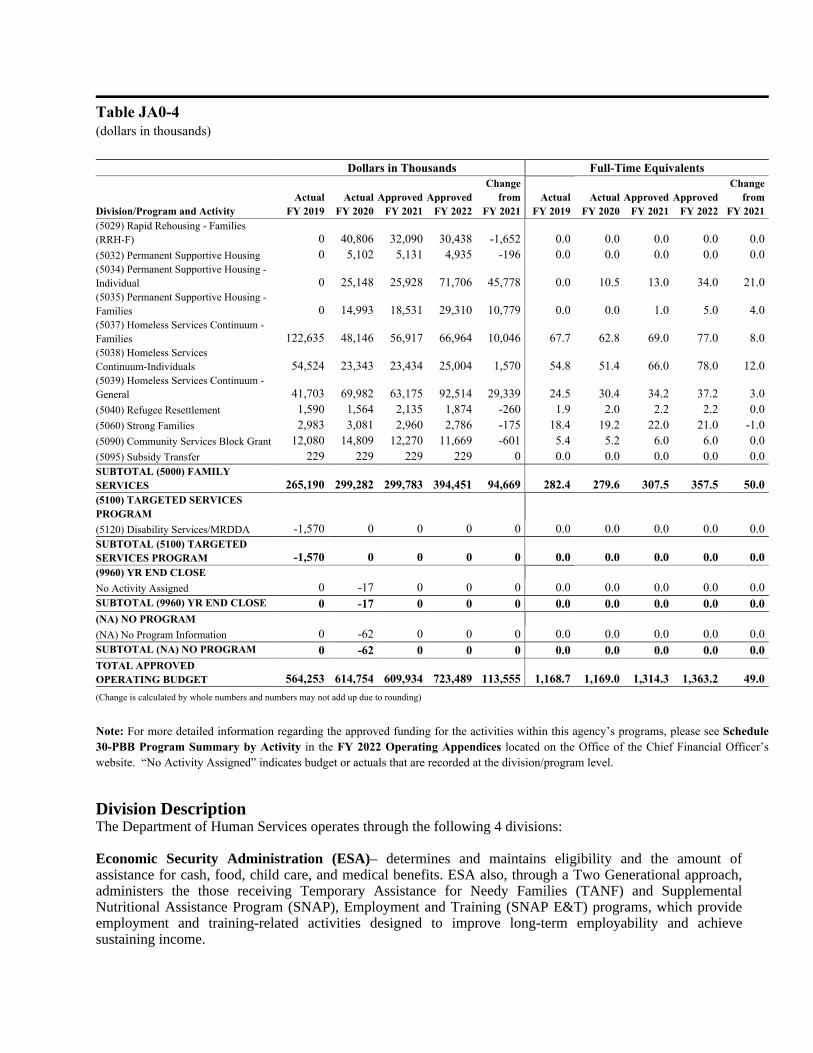
Table JA0-4(dollars in thousands)
Dollars in Thousands Full-Time Equivalents
Division/Program and ActivityActual
FY 2019Actual
FY 2020Approved
FY 2021Approved
FY 2022
Changefrom
FY 2021Actual
FY 2019Actual
FY 2020Approved
FY 2021Approved
FY 2022
Changefrom
FY 2021(5029) Rapid Rehousing - Families(RRH-F) 0 40,806 32,090 30,438 -1,652 0.0 0.0 0.0 0.0 0.0(5032) Permanent Supportive Housing 0 5,102 5,131 4,935 -196 0.0 0.0 0.0 0.0 0.0(5034) Permanent Supportive Housing -Individual 0 25,148 25,928 71,706 45,778 0.0 10.5 13.0 34.0 21.0(5035) Permanent Supportive Housing -Families 0 14,993 18,531 29,310 10,779 0.0 0.0 1.0 5.0 4.0(5037) Homeless Services Continuum -Families 122,635 48,146 56,917 66,964 10,046 67.7 62.8 69.0 77.0 8.0(5038) Homeless ServicesContinuum-Individuals 54,524 23,343 23,434 25,004 1,570 54.8 51.4 66.0 78.0 12.0(5039) Homeless Services Continuum -General 41,703 69,982 63,175 92,514 29,339 24.5 30.4 34.2 37.2 3.0(5040) Refugee Resettlement 1,590 1,564 2,135 1,874 -260 1.9 2.0 2.2 2.2 0.0(5060) Strong Families 2,983 3,081 2,960 2,786 -175 18.4 19.2 22.0 21.0 -1.0(5090) Community Services Block Grant 12,080 14,809 12,270 11,669 -601 5.4 5.2 6.0 6.0 0.0(5095) Subsidy Transfer 229 229 229 229 0 0.0 0.0 0.0 0.0 0.0SUBTOTAL (5000) FAMILYSERVICES 265,190 299,282 299,783 394,451 94,669 282.4 279.6 307.5 357.5 50.0(5100) TARGETED SERVICESPROGRAM(5120) Disability Services/MRDDA -1,570 0 0 0 0 0.0 0.0 0.0 0.0 0.0SUBTOTAL (5100) TARGETEDSERVICES PROGRAM -1,570 0 0 0 0 0.0 0.0 0.0 0.0 0.0(9960) YR END CLOSENo Activity Assigned 0 -17 0 0 0 0.0 0.0 0.0 0.0 0.0SUBTOTAL (9960) YR END CLOSE 0 -17 0 0 0 0.0 0.0 0.0 0.0 0.0(NA) NO PROGRAM(NA) No Program Information 0 -62 0 0 0 0.0 0.0 0.0 0.0 0.0SUBTOTAL (NA) NO PROGRAM 0 -62 0 0 0 0.0 0.0 0.0 0.0 0.0TOTAL APPROVEDOPERATING BUDGET 564,253 614,754 609,934 723,489 113,555 1,168.7 1,169.0 1,314.3 1,363.2 49.0(Change is calculated by whole numbers and numbers may not add up due to rounding)
Note: For more detailed information regarding the approved funding for the activities within this agency’s programs, please see Schedule30-PBB Program Summary by Activity in the FY 2022 Operating Appendices located on the Office of the Chief Financial Officer’swebsite. “No Activity Assigned” indicates budget or actuals that are recorded at the division/program level.
Division DescriptionThe Department of Human Services operates through the following 4 divisions:
Economic Security Administration (ESA)– determines and maintains eligibility and the amount ofassistance for cash, food, child care, and medical benefits. ESA also, through a Two Generational approach,administers the those receiving Temporary Assistance for Needy Families (TANF) and SupplementalNutritional Assistance Program (SNAP), Employment and Training (SNAP E&T) programs, which provideemployment and training-related activities designed to improve long-term employability and achievesustaining income.

This division contains the following 11 activities:
• Burial Assistance– provides assistance to low-income families who need help with funeral expenses;• General Assistance for Children – provides financial assistance to eligible individuals caring for
unrelated children under the age of 18;• Interim Disability Assistance (IDA) – provides temporary financial assistance to those who are unable
to work due to a disability and who have a high probability of receiving federal Supplemental SecurityIncome (SSI). IDA payments are issued until SSI eligibility is approved or denied, after which the IDApayment ends;
• Temporary Assistance for Needy Families (TANF) – provides financial assistance to eligible familiesindividuals with children under the age of 19, so that they can meet their basic needs, while supportingentire family through a Two Generational approach in providing supportive services aimed at buildingand transition to economic self-sufficiency;
• Cash Assistance (TANF) – provides financial assistance to eligible individuals with children under theage of 19, so that they can meet their basic needs and transition to economic self-sufficiency;
• Job Opportunity and Training (TANF) – provides employment readiness, job placement,coordination and skill development training, and educational enrichment to eligible individuals so thatthey can be socially and economically self-reliant;
• Supplemental Food Assistance (Local) – provides locally funded food assistance to the District‘sSNAP recipients. This assistance is provided to District residents who receive the minimum SNAPbenefits to increase the food supplement to $30 per month;
• Case Management – provides diagnostic, evaluation, and plan development services to consumers inorder to determine the needs and plan the treatment and other related services and supports needed.Coordinates treatment and services to remediate barriers to employment and assists with securing otherfinancial supports, such as Program on Work Employment and Responsibility (POWER) and SSI. Thisactivity includes the Office of Work Opportunity and the SNAP Employment and Training programs;
• Eligibility Determination Services – provides program eligibility determination services for residentsof the District of Columbia in the Cash, SNAP, and Medical Assistance programs;
• Monitoring and Quality Assurance – provides internal monitoring of ESA’s compliance with federaland District laws and court orders; identifies, investigates, and reports customer fraud in obtainingassistance; and addresses the accurate and timely determination of eligibility and administration ofbenefits; and
• Early Education Subsidy Transfer – provides funding to the Office of the State Superintendent ofEducation for subsidized child care for the children of TANF-eligible families.
Family Services Administration (FSA) – FSA provides an array of social services and supports for Districtresidents to solve crises, strengthen families, and connect residents to resources and programs to improvetheir well-being. FSA manages a system of care to make homelessness rare, brief and non-recurring;administers a system of services and supports for youth who are at-risk of court involvement, schooldisengagement, homelessness and repeat teen pregnancy; and provides crisis-intervention services forfamilies and refugees.
This division contains the following 21 activities:
• Homeless Prevention – This activity includes programs for families, individuals and youthexperiencing an imminent risk of homelessness that provide stabilizing services and resources aimed atpreventing housing loss. Services offered may include diversion and mediation services, casemanagement and/or care coordination, referrals to partners, rental assistance and other limited financialassistance;
• Emergency Rental Housing – The Emergency Rental Assistance program helps low-income Districtresidents who are facing housing emergencies, or at imminent risk for homelessness. A housingemergency is when immediate action is needed to avoid homelessness, to re-establish a home, or toprevent eviction from a home;

• Domestic Violence Services – provides protection, emergency shelter, and crisis intervention servicesto victims of domestic violence so that they can seek immediate relief from harm;
• Transitional Housing Youth – provides transitional housing and case management supports for up to24 months for youth ages eighteen to twenty-four who are experiencing or at risk of experiencinghomelessness;
• Youth Services – provides integrated services for vulnerable at-risk youth through the programs listedbelow. In addition to case management and crisis intervention, youth programs has the authority totravel with participants for enrichment opportunities.o Alternatives to the Court Experience (ACE), the sole youth diversion program in Washington,
DC, offers individually tailored and clinically appropriate services to youth up to 17 years old andfamilies as alternatives to arrest and prosecution. ACE’s goal is to reduce recidivism, reengageyouths in school, and improve overall youth functioning;
o Parent and Adolescent Support Services – (PASS), which works with youth up to the age of 17years old who have committed status offense (mainly truancy) by conducting comprehensive youthassessments and providing intensive case management and linkages to other supportive services;
o Teen Parent Assessment Program (TPAP), which provides case management and supportservices to teen parents age 17 and under who receive TANF or self-refer to the program. TPAP’sgoal is to move program participants towards self-sufficiency through completion of their highschool or GED program;
o Strengthening Teens Enriching Parents (STEP), which works with youth up to 17 yearsold who are reported missing to the police. Case managers provide outreach to assess why theyouth has left home and together with the family, implement services with community partners andother District agencies to reduce the likelihood of future missing persons reports, and increasefamily stability;
o PASS Crisis and Stabilization Team (PCAST), provides crisis assessment, intervention, andstabilization services to youth and their families that are referred to the Parent and AdolescentSupport Services Program (PASS). Staff provide outreach, advocacy and coordination of serviceswhile engaging community resources. In addition, PCAST works to enhance coping skills andempower youth and their families to achieve stability; and
o Functional Family Therapy (FFT) is an intensive, short term intervention/preventive service thatoffers in-home family counseling designed specifically to address status-offending behaviors andjuvenile delinquency from a relational/ family-based perspective. FFT services target adolescentswho are experiencing a high level of conflict in the home, exposure to domestic violence, truancy,curfew violations, running away, and substance abuse. In addition, FFT services are also used aspart of the homeless youth prevention services. FFT sessions are held at least once per week for3-6 months; every session includes all key members of the family. FFT therapists use a nationalFFT evidence-based model to work with the referred youth and families. This model assessesfamily behaviors that have contributed to the youth’s delinquent behavior, modifies strained familycommunication.
• Homeless Services Continuum - Youth – Works with youth up to 24 years old who are experiencinghomelessness – or at risk of experiencing homelessness – to connect them with services to reunite themwith their family and resolve family conflicts. Community organizations provide services such asdrop-in centers, street outreach and housing. Additional youth homeless services include the provisionof emergency shelter beds and homeless prevention services; resources to help youth experiencinghomelessness with shelter placement and drop-in centers that provide meals; life skills training;assessment of needs; and vocational training;
• Permanent Supportive Housing -Youth – the Extended Transitional Housing program (ETH) provideshousing support and wrap-around services to youth with a high level of need that require long-termhousing supports and intensive case management and other services;
• Transitional Age Youth Shelter – provides emergency housing and supportive services to youth ageseighteen to twenty-four experiencing or at risk of experiencing homelessness;
• Rapid Rehousing - Youth – provides access to permanent housing with the use of temporary financialsupports and case management assistance for up to 12 months;.
• Rapid Rehousing - Individuals – the Rapid Re-housing for Individuals Program provides access topermanent housing with the use of temporary financial supports and case management assistance for upto 12 months;
• Rapid Rehousing - Families – the Family Rehousing and Stabilization Program (FRSP) supportsDistrict residents who are experiencing homelessness or at imminent risk of experiencing homelessnessto achieve stability in permanent housing through individualized and time-limited assistance. FRSPoffers a wide range of supports that are responsive to participant needs including: individualized casemanagement services, housing identification, connection to mainstream and community-based resourcesand financial assistance;
• Permanent Supportive Housing - General – the Shelter Plus Care program is a HUD federally fundedhousing voucher program that provides long-term rental assistance to chronically homeless individualsand families;
• Permanent Supportive Housing - Individuals – Works with youth up to 24 years old who areexperiencing homelessness – or at risk of experiencing homelessness – to connect them with services toreunite them with their family and resolve family conflicts. Community organizations provide servicessuch as drop-in centers, street outreach and housing. Additional youth homeless services include theprovision of emergency shelter beds and homeless prevention services; resources to help youthexperiencing homelessness with shelter placement and drop-in centers that provide meals; life skillstraining; assessment of needs; and vocational training;
• Permanent Supportive Housing - Families – the Permanent Supportive Housing program provideslong-term permanent housing to eligible chronically homeless families who are at risk of becominghomeless and need intensive case management. Eligibility is based on VI-SPDAT Assessment or FullSPDAT Assessment score with PSH recommendation;
• Homeless Services Continuum - Families – services include intake at the Virginia Williams FamilyResource Center, crisis intervention and prevention, emergency and temporary shelter, transitionalhousing, rapid rehousing, and permanent supportive housing to families in the District of Columbia whoare homeless or at risk of homelessness;
• Homeless Services Continuum - Individuals – services include outreach and coordinated entry, crisisintervention and prevention, services targeted to veterans, day center, low barrier shelter, temporaryshelter, transitional housing, rapid rehousing, and permanent supportive housing to individuals in theDistrict of Columbia who are homeless or at risk of homelessness;
• Homeless Services Continuum - General – provides security, food, management, emergency rentalassistance, housing navigation, fixed costs (for shelter and housing facilities), supplies, equipment, andadministrative support for the activities listed under the Homeless Continuum;
• Refugee Resettlement – provides social services, cash, and medical assistance to eligible refugees andtheir families through sub-grant arrangements with community-based non-profit agencies;
• Strong Families – provides comprehensive service delivery through case management and supportservices to families who are experiencing significant social, emotional, or other crises in order tode-escalate and help stabilize the family;
• Community Services Block Grant – provides assistance to low-income residents through a network ofcommunity action agencies and other neighborhood-based organizations in order to reduce poverty,revitalize low-income communities, and empower low-income families and individuals to becomeself-reliant; and
• Subsidy Transfer – provides childcare benefits for low-income families.
Agency Management/Office of the Director – provides executive management, policy direction, strategic and financial planning, human capital management, information technology, capital programs, legislative and community relations, and performance management. The Office of Program Review, Monitoring, and Investigation includes agency risk management, fraud investigation, internal affairs, homeless shelter monitoring, and a quality control division.
Agency Financial Operations – provides comprehensive and efficient financial management services to, and on behalf of, District agencies so that the financial integrity of the District of Columbia is maintained. This division is standard for all agencies using performance-based budgeting.

Division Structure ChangeThe Department of Human Services has no division structure changes in the FY 2022 approved budget.
FY 2021 Approved Budget to FY 2022 Approved Budget, by Revenue TypeTable JA0-5 itemizes the changes by revenue type between the FY 2021 approved budget and theFY 2022 approved budget. For a more comprehensive explanation of changes, please see theFY 2022 Approved Budget Changes section, which follows the table.
Table JA0-5(dollars in thousands)
DESCRIPTION DIVISION/PROGRAM BUDGET FTE
LOCAL FUNDS: FY 2021 Approved Budget and FTE 419,714 731.1Removal of One-Time Costs Multiple Programs -32,929 0.0
LOCAL FUNDS: FY 2022 Recurring Budget 386,785 731.1Increase: To support the OSSE Childcare Grant Economic Security
Administration35,000 0.0
Increase: To align Fixed Costs with proposed estimates Multiple Programs 5,651 0.0Increase: To support additional FTE(s) Multiple Programs 3,824 4.3Increase: To adjust the Contractual Services budget Multiple Programs 204 0.0Decrease: To realize savings in nonpersonal services Multiple Programs -287 0.0Decrease: To realize programmatic cost savings in nonpersonal services Multiple Programs -9,446 0.0Enhance: ARPA - Federal Funds for Local Revenue Replacement funding to supportAffordable Housing and extended benefits to FRSP families
Multiple Programs 6,734 27.0
Enhance: To provide approximately 50 transition-aged beds for youth (one-time) Family Services 1,300 0.0Enhance: Programming and operations support at the 801E replacement shelter Family Services 1,044 5.0Enhance: To support an MOU agreement with the Office of Contracting andProcurment
Family Services 145 0.0
Transfer-In: ICH Consumer Stipends Family Services 20 0.0LOCAL FUNDS: FY 2022 Mayor’s Proposed Budget 430,974 767.3
Enhance: ARPA – Federal funds for Local Revenue Replacement to support PermanentSupportive Housing ($19M) and the Emergency Rental Assistance Program ($5.5M)
Family Services 24,500 0.0
Enhance: To support the services required for 775 new units of PSH for individuals Family Services 19,963 0.0Enhance: To provide approximately 255 new PSH units for families Family Services 10,428 0.0Enhance: To support several housing initiatives, Project Reconnect and to hireDomestic Violence specialist (one-time)
Family Services 10,335 0.0
Enhance: To support approximately 307 new units of Targeted Affordable Housing Family Services 8,185 0.0Enhance: To support the DC Flex program Family Services 5,221 0.0Enhance: To support additional FTE(s) Family Services 2,259 20.0Enhance: FTEs to support the Interagency Council on Homelessness Family Services 368 3.0Reduce: To reflect savings associated with ongoing local and federally supportingprograms and services
Family Services -2,104 0.0
LOCAL FUNDS: FY 2022 District’s Approved Budget 510,129 790.3
FEDERAL PAYMENTS: FY 2021 Approved Budget and FTE 0 0.0Enhance: ARPA - Municipal funding to support Affordable Housing; TANFassistance; shelter for Transgender residents and Workforce Development
Multiple Programs 47,319 2.0
FEDERAL PAYMENTS: FY 2022 Mayor’s Proposed Budget 47,319 2.0Reduce: Reduce: ARPA – Municipal Funds from Rapid Re-Housing initiatives forindivduals
Family Services -2,484 0.0
FEDERAL PAYMENTS: FY 2022 District’s Approved Budget 44,835 2.0
FEDERAL GRANT FUNDS: FY 2021 Approved Budget and FTE 169,294 416.5Increase: To adjust the Contractual Services budget Multiple Programs 258 0.0

Table JA0-5(dollars in thousands)
DESCRIPTION DIVISION/PROGRAM BUDGET FTEDecrease: To align Fixed Costs with proposed estimates Multiple Programs -557 0.0Decrease: To realize savings in nonpersonal services Multiple Programs -852 0.0Decrease: To recognize savings from a reduction in FTE(s) Multiple Programs -1,079 -17.8Decrease: To support operational requirements Multiple Programs -19,065 0.0
FEDERAL GRANT FUNDS: FY 2022 Mayor’s Proposed Budget 147,999 398.8No Change 0 0.0
FEDERAL GRANT FUNDS: FY 2022 District’s Approved Budget 147,999 398.8
FEDERAL MEDICAID PAYMENTS: FY 2021 Approved Budget and FTE 16,562 145.7Increase: To support additional FTE(s) Multiple Programs 270 0.5Increase: To align resources with operational spending goals Multiple Programs 157 0.0Decrease: To align Fixed Costs with proposed estimates Multiple Programs -865 0.0
FEDERAL MEDICAID PAYMENTS: FY 2022 Mayor’s Proposed Budget 16,124 146.1No Change 0 0.0
FEDERAL MEDICAID PAYMENTS: FY 2022 District’s Approved Budget 16,124 146.1
SPECIAL PURPOSE REVENUE FUNDS: FY 2021 Approved Budget and FTE 1,000 0.0Decrease: To adjust the Contractual Services budget Agency Management -100 0.0
SPECIAL PURPOSE REVENUE FUNDS: FY 2022 Mayor’s Proposed Budget 900 0.0No Change 0 0.0
SPECIAL PURPOSE REVENUE FUNDS: FY 2022 District’s Approved Budget 900 0.0
INTRA-DISTRICT FUNDS: FY 2021 Approved Budget and FTE 3,364 21.0Increase: To support additional FTE(s) Multiple Programs 441 5.0Decrease: To realize savings in nonpersonal services Multiple Programs -303 0.0
INTRA-DISTRICT FUNDS: FY 2022 Mayor’s Proposed Budget 3,503 26.0No Change 0 0.0
INTRA-DISTRICT FUNDS: FY 2022 District’s Approved Budget 3,503 26.0
GROSS FOR JA0 - DEPARTMENT OF HUMAN SERVICES 723,489 1,363.2(Change is calculated by whole numbers and numbers may not add up due to rounding)
FY 2022 Approved Operating Budget ChangesTable JA0-6 contains the approved FY 2022 budget by fund compared to the FY 2021 approved budget.
Table JA0-6
Appropriated FundFY 2021
ApprovedFY 2022
Approved
% Changefrom
FY 2021Local Funds $419,713,591) $510,128,911) 21.5Federal Payments $0) $44,835,321) N/AFederal Grant Funds $169,294,054) $147,998,742) -12.6Federal Medicaid Payments $16,561,911) $16,123,558) -2.6Special Purpose Revenue Funds $1,000,000) $900,000) -10.0Intra-District Funds $3,364,439) $3,502,848) 4.1GROSS FUNDS $609,933,995) $723,489,380) 18.6

Recurring BudgetThe FY 2022 budget for DHS includes a reduction of $32,928,800 to account for the removal of one-time funding appropriated in FY 2021. This funding was comprised of $13,070,800 to support the Rehousing and Stabilization program and least cost for hotels and service centers; $10,000,000 to provide TANF cash assistance; $5,500,000 to support the Emergency Rental Assistance program (ERAP); $1,808,000 to support the Homeless Street Outreach program; $1,320,000 to support transitional age youth shelters; $1,200,000 to support Project Reconnect; and $30,000 to support the DC Healthcare Alliance Program Recertification Simplification Amendment Act of 2017.
Mayor’s Proposed BudgetIncrease: DHS’ proposed budget reflects an increase of $35,000,000 in Local funds to supplement the cost of services received from the Office of the State Superintendent of Education (OSSE) for child care for its client population. It also includes an increase of $5,651,156 across multiple divisions for projected Fixed Cost estimates, consisting of $3,663,881 for Rentals, $693,565 for Occupancy, $625,409 for Security Services,$390,842 for Energy, and $277,459 for Telecommunications costs. Additionally, the proposed Local budget reflects an increase of $3,823,752 and 4.3 Full-Time Equivalents (FTEs) for salary, fringe benefits, step increases, and additional FTEs in the Family Services division to support the agency’s Youth program. DHS also proposes an increase of $203,951 in contractual services to support the Electronic Benefit Transfer Memorandum of Understanding (MOU) with the Office of Finance and Treasury (OFT) and Business Process Reengineering contract for the D.C. Access System (DCAS).
In Federal Grant funds, DHS proposes an increase of $258,362, primarily due to the new Supplemental Nutritional Assistance Program (SNAP) Employment/Training Data and Technical Assistance grant and an increase in MOU with OFT for EBT services.
DHS’ proposed budget for Federal Medicaid Payments supports an increase of $269,782 and 0.5 FTE due to salary, step, and fringe benefits adjustments across multiple divisions. In addition, the agency’s proposal includes $157,273 to support cost allocation for the Asset Verification contract and to reflect costs for the IT Assessment.
Finally, DHS’ Intra-District funds budget projects an increase of $441,294 and 5.0 positions to support the homeless opioid initiative.
Decrease: DHS’ Local funds budget proposal reflects a decrease of $287,379, primarily to align costs associated with the agency’s IT assessment across multiple divisions. The proposal also includes a reduction of $9,445,570 to account for cost savings reductions in Subsidies and Transfers for several grants and programs including, but not limited to, a reduction to the Downtown Day Service Center grant; a reallocation to support increase in fixed cost estimates; Cash Assistance for the closure of one service center and the operational savings in fixed cost due to another service center being closed for renovations; Case Management for Permanent Supportive Housing-Individual Human Care Agreement due to the establishment of Medicaid benefits in FY 2022; COC contracts and grants; and a cost savings reduction to Short Term Family Housing and shelter operations for fixed cost savings in terminating the lease and moving the Virginia Williams Family Resource Center.
DHS’ Federal Grant funds budget reflects a decrease of $557,324 across multiple divisions to account for projected Fixed Cost estimates for Rentals. The DHS proposal includes a reduction of $852,107 due primarily to reduction in carryover for SNAP Bonus, the elimination of the Veteran Affairs Grant, and an MOU with the Department of Health Care Finance (DHCF) for DCAS. In personal services, the agency proposed a reduction of $1,078,911 and 17.75 FTEs, of which 11 were due to the expiration of the Veteran Affairs grant. Finally, DHS’ budget proposal decreased by $19,065,333 primarily due to a reduction in carryover for Temporary Assistance for Needy Families (TANF).
In Federal Medicaid Payments, the proposed budget includes a reduction of $865,407 for projected Fixed Cost estimates for Rentals.
In Special Purpose Revenue funds, DHS proposes a decrease of $100,000 to align the budget with projected revenues in the Agency Management division.
DHS’ proposed Intra-District funds budget reflects a reduction of $302,885 primarily due to a reduction in an MOU with DHCF for the DCAS Equifax contract.

Enhance: In Local funds, DHS’ proposed budget includes an increase of $6,734,180 and 27.0 FTEs from ARPA - Federal Funds for Local Revenue Replacement funding. This adjustment is comprised of $4,029,630 and 22.0 FTEs to provide Affordable Housing to Individuals Families and Youth and $2,704,550 and 5.0 FTEs to extend existing benefits (FRSP rental subsidies, TANF, SNAP, transport assistance, and childcare) for 300 FRSP families to ensure net resources in the home grows as earned income increases. This increase in spending is supported by Coronavirus Relief funds from the American Rescue Plan Act. To address the emergency bed shortage for youth experiencing homelessness, DHS’ proposed Local funds budget reflects one-time increase of $1,300,000 in the Family Services division to provide approximately 50 transition-aged beds for youth. The agency also proposes adding $1,043,528 and 5.0 FTEs for needed programming and operations support at the 801 E Street replacement shelter. Finally, $145,169 is proposed to support a Memorandum of Understanding Agreement with the Office of Contracting and Procurement.
In Federal Payment funds, the agency’s proposed budget includes an increase of $47,319,429 and 2.0 FTEs. This adjustment is comprised of $30,969,429 and 2.0 FTEs for affordable housing for Individuals, Families and Youth; $15,000,000 to provide TANF Cash Assistance to DHS constituents; $850,000 to support a Low-Barrier Shelter for Transgender residents; and $500,000 to support Workforce Development. This increase in spending is supported by Coronavirus Relief funds from the American Rescue Plan Act.
Transfer-In: The proposed Local funds budget includes $20,000 in the Family Services division from the Deputy Mayor for Health and Human Services to support a transfer of the Inter-Agency Council on Homelessness (ICH) Consumer Stipends within contractual services.
District's Approved BudgetEnhance: The Department of Human Services' approved Local funds budget supports several initiatives to assist in eradicating homelessness in the District of Columbia in the Family Services division. The budget reflects an increase of ARPA—Federal Funds for Local Revenue Replacement in the amount of $24,500,000 to support housing programs that benefit the District's homeless population. This adjustment includes$19,000,000 to provide 827 units of Permanent Supportive Housing (PSH) and $5,500,000 to support the Emergency Rental Assistance Program (ERAP). These increases in spending are supported by Coronavirus Relief funds from the American Rescue Plan Act. The agency’s continued commitment to providing permanent supportive housing is further evidenced by an increase of $19,963,225 for 775 new units for individuals and $10,428,016 for approximately 255 new units for families. The Local funds budget also includes an increase of $10,335,125 in one-time funding, which consists of $8,383,728 in additional support for PSH, $1,000,000 for ERAP, $325,000 for Project Reconnect, $321,397 to expand the capacity of Virginia Williams Family Resource Center, and $305,000 in support for youth-related housing. Additionally, the budget includes $5,220,600 to provide a subsidy of $8,400 to 501 households and a subsidy of $1,200 to 131 households, all through the DC Flex program. Lastly, DHS' approved Local budget reflects the following increases in the Family division: $2,258,500 and 20.0 FTEs to support projected personal service costs and$368,076 and 3.0 FTEs to support the Interagency Council on Homelessness.
Reduce: DHS' Local funds approved budget includes a reduction of $2,103,500 in the Family Services division to reflect savings associated with ongoing local and federally supported programs and services.In Federal Payments, the approved budget includes a reduction of $2,484,108 in ARPA – Municipal Funding for Rapid Re-Housing initiatives, as part of a reallocation of funding supported by the American Rescue Plan Act.

Agency Performance Plan*The Department of Human Services (DHS) has the following strategic objectives for FY 2022:
Strategic ObjectivesStrategic Objectives describe what the agency will do, at a high level, to achieve its mission. These areaction-based sentences that define what an agency does for its customers, whether the customers are residentsor other District agencies, and how that improves the District.Objectives1. Develop an effective crisis response system for unaccompanied adults who experience homelessness.2. Develop an effective system of care for families who experience homelessness.3. Implement a system of services and supports for youth, parenting youth and their families4. Through a Two Generational (2Gen) Approach, empower DHS customers to improve their economic
stability and well-being.5. Improve the customer experience at DHS service centers.7. Create and maintain a highly efficient, transparent, and responsive District government.
ACTIVITIESActivities include the work that happens on a daily basis to help achieve the Strategic Objectives. Activitynames come from the budget line items. This is further divided into “daily services” (ex. sanitation disposal),and long-term “key projects” that are high profile, one-time and span several years, (ex. redevelopment ofWalter Reed Army Medical Center). Many agencies will mostly have daily services, whereas some agenciesthat have more of their budget come from capital funding will have several key projects.
1. Develop an effective crisis response system for unaccompanied adults who experiencehomelessness. (1 Activity)Activity Title Activity Description Type of ActivityHomeless Services Continuum- Individuals The Family Services Administration provides a
continuum of services to individuals experiencinghomelessness or at risk of homelessness, so thatthey can access temporary shelter and obtain and/ormaintain sustainable housing. The continuum ofservices includes outreach, coordinated entry, lowbarrier shelter, diversion and rapid exit fromshelter, rapid rehousing, day programs, mealprograms, targeted affordable housing andpermanent supportive housing. FSA also providestargeted support for Veterans experiencinghomelessness as well as resources and servicesduring hypothermia and cold emergency alerts.
Daily Service
2. Develop an effective system of care for families who experience homelessness. (1 Activity)Activity Title Activity Description Type of ActivityHomeless Services Continuum- Families The Family Services Administration provides a
continuum of services to families experiencinghomelessness or at risk of homelessness, so thatthey can obtain and/or maintain improved housing.The continuum of family services includescentralized intake and eligibility assessment at theVirginia Williams Family Resource Center,prevention services, emergency shelter, rapidrehousing, housing navigation and permanentsupportive housing.
Daily Service

3. Implement a system of services and supports for youth, parenting youth and their families (1 Activity)Activity Title Activity Description Type of ActivityYouth-Focused Diversion Services DHS, Family Services Administration (FSA),
Youth Services Division (YSD) providesyouth-focused services through the followingprograms:• Parent and Adolescent Support Services (PASS),which works with youth up to the age of 17 yearsold who have committed status offenses (mainlytruancy) by conducting comprehensive youthassessments and providing intensive casemanagement and linkages to other supportiveservices.• PASS Crisis and Stabilization Team (PCAST),provides crisis assessment, intervention, andstabilization services to youth and their familiesthat are referred to the Parent and AdolescentSupport Services Program (PASS). Staff provideoutreach, advocacy and coordination of serviceswhile engaging community resources. In addition,PCAST works to enhance coping skills andempower youth and their families to achievestability.• Functional Family Therapy (FFT) is an intensive,short term intervention/preventive service thatoffers in-home family counseling designedspecifically to address status-offending behaviorsand juvenile delinquency from a relational/family-based perspective. FFT services targetadolescents who are experiencing a high level ofconflict in the home, exposure to domesticviolence, truancy, curfew violations, running away,and substance abuse. In addition, FFT services arealso used as part of the homeless youth preventionservices. FFT sessions are held at least once perweek for 3-6 months; every session includes all keymembers of the family. FFT therapists use anational FFT evidence-based model to work withthe referred youth and families. This modelassesses family behaviors that have contributed tothe youth’s delinquent behavior, modifies strainedfamily communication, improves parenting skills,and generalizes changes to community contexts andrelationships.• Alternatives to the Court Experience (ACE), thesole diversion program in Washington, DC, whichoffers individually tailored andclinically-appropriate services to youth up to 17years old and families as alternatives to arrest andprosecution. ACE’s goal is to reduce recidivism,reengage youths in school, and improve overallyouth functioning• The Teen Parent Assessment Program (TPAP),which provides case management and supportservices to teen parents ages 17 and under whoreceive TANF or self-refer to the program. TPAP’sgoal is to move program participants towardsself-sufficiency through completion of their highschool or GED program.
Daily Service
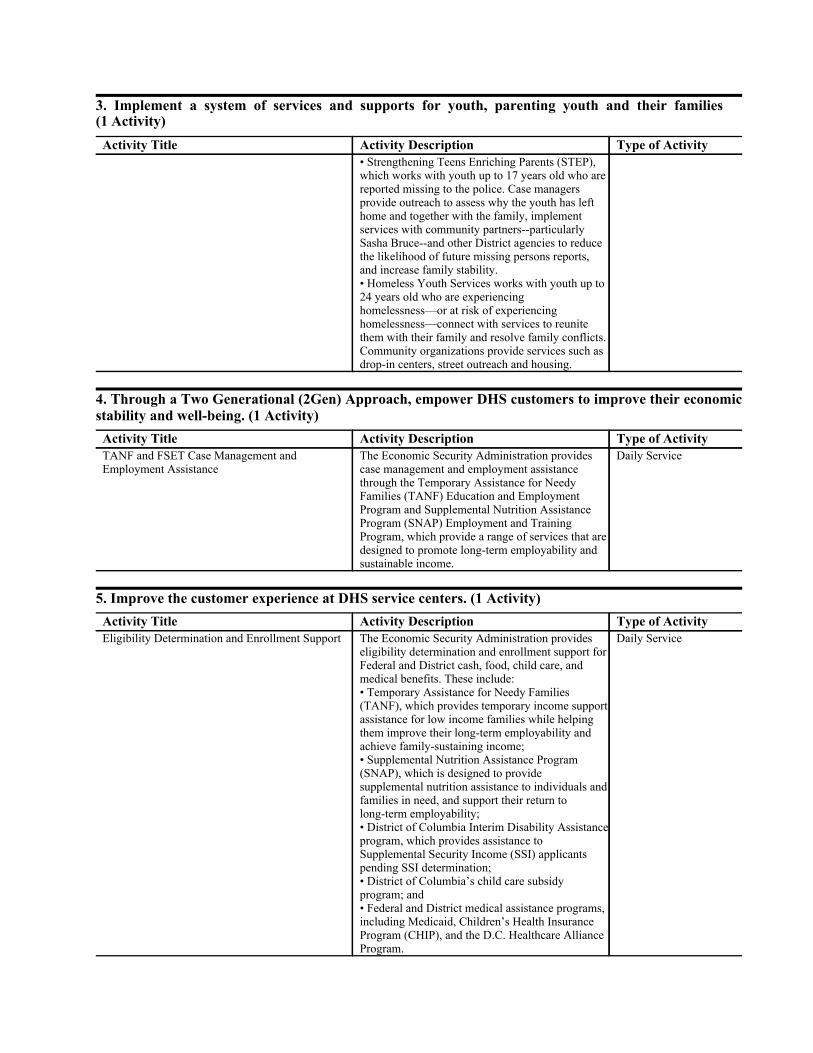
3. Implement a system of services and supports for youth, parenting youth and their families (1 Activity)Activity Title Activity Description Type of Activity
• Strengthening Teens Enriching Parents (STEP),which works with youth up to 17 years old who arereported missing to the police. Case managersprovide outreach to assess why the youth has lefthome and together with the family, implementservices with community partners--particularlySasha Bruce--and other District agencies to reducethe likelihood of future missing persons reports,and increase family stability.• Homeless Youth Services works with youth up to24 years old who are experiencinghomelessness—or at risk of experiencinghomelessness—connect with services to reunitethem with their family and resolve family conflicts.Community organizations provide services such asdrop-in centers, street outreach and housing.
4. Through a Two Generational (2Gen) Approach, empower DHS customers to improve their economicstability and well-being. (1 Activity)Activity Title Activity Description Type of ActivityTANF and FSET Case Management andEmployment Assistance
The Economic Security Administration providescase management and employment assistancethrough the Temporary Assistance for NeedyFamilies (TANF) Education and EmploymentProgram and Supplemental Nutrition AssistanceProgram (SNAP) Employment and TrainingProgram, which provide a range of services that aredesigned to promote long-term employability andsustainable income.
Daily Service
5. Improve the customer experience at DHS service centers. (1 Activity)Activity Title Activity Description Type of ActivityEligibility Determination and Enrollment Support The Economic Security Administration provides
eligibility determination and enrollment support forFederal and District cash, food, child care, andmedical benefits. These include:• Temporary Assistance for Needy Families(TANF), which provides temporary income supportassistance for low income families while helpingthem improve their long-term employability andachieve family-sustaining income;• Supplemental Nutrition Assistance Program(SNAP), which is designed to providesupplemental nutrition assistance to individuals andfamilies in need, and support their return tolong-term employability;• District of Columbia Interim Disability Assistanceprogram, which provides assistance toSupplemental Security Income (SSI) applicantspending SSI determination;• District of Columbia’s child care subsidyprogram; and• Federal and District medical assistance programs,including Medicaid, Children’s Health InsuranceProgram (CHIP), and the D.C. Healthcare AllianceProgram.
Daily Service

7. Create and maintain a highly efficient, transparent, and responsive District government. (1 Activity)Activity Title Activity Description Type of ActivityAgency Management/Performance Management The Office of the Director provides executive
management, policy direction, strategic andfinancial planning, human capital management,information technology, capital programs,legislative and community relations, legalguidance, and performance management. TheOffice of Program Review, Monitoring, andInvestigation includes agency risk management,fraud investigation, homeless shelter monitoringand a quality control division.
Daily Service
KEY PERFORMANCE INDICATORSKey Performance Indicators measure how well an agency is achieving its Strategic Objectives. They areoutcome-oriented and should be used to answer the question, “What does the agency need to measure todetermine success?”
1. Develop an effective crisis response system for unaccompanied adults who experiencehomelessness. (3 Measures)
MeasureNew Measure/
Benchmark YearFY 2019
ActualFY 2020
TargetFY 2020
ActualFY 2021
TargetFY 2022
TargetAverage length of time (days)experiencing homelessness(individuals)
No 175 No TargetSet
160 No TargetSet
No TargetSet
Individuals becoming homeless forthe first time
No 3428 No TargetSet
2993 No TargetSet
No TargetSet
Percent of individuals returning tohomelessness within 6- 12 months
No 7.5% No TargetSet
5.4% No TargetSet
No TargetSet
2. Develop an effective system of care for families who experience homelessness. (3 Measures)
MeasureNew Measure/
Benchmark YearFY 2019
ActualFY 2020
TargetFY 2020
ActualFY 2021
TargetFY 2022
TargetAverage length of time (days)experiencing homelessness(families)
No 281 No TargetSet
256 No TargetSet
No TargetSet
Families becoming homeless for thefirst time
No 605 No TargetSet
531 No TargetSet
No TargetSet
Percent of families returning tohomelessness within 6- 12 months
No 2.1% No TargetSet
3.4% No TargetSet
No TargetSet
3. Implement a system of services and supports for youth, parenting youth and their families (7 Measures)
MeasureNew Measure/
Benchmark YearFY 2019
ActualFY 2020
TargetFY 2020
ActualFY 2021
TargetFY 2022
TargetNumber of youth diverted fromshelter or time limited housingprograms (includes familypreservation, reunification withnatural supports, and other exits topermanency)
No 31 16 73 36 36
Number of youth who exited theyouth homelessness system topermanent, stable housing
No 23 8 69 48 48

3. Implement a system of services and supports for youth, parenting youth and their families (7 Measures)
MeasureNew Measure/
Benchmark YearFY 2019
ActualFY 2020
TargetFY 2020
ActualFY 2021
TargetFY 2022
TargetPercent of teen parents receivingservices from the Teen ParentAssessment Program (TPAP) whodo not have additional pregnancies
No 85.1% 85% 91.6% 85% 85%
Percent of teen parents who met theeducational component of theirIndividual Responsibility Plan(IRP)
No 63.8% 75% 77% 75% 75%
Percent of youth who completedYouth Services Division programswho showed improved functioningat closure as indicated by decline intheir Child and AdolescentFunctional Assessment Scale(CAFAS) scores
No 86.4% 85% 84.3% 85% 85%
Percent of youth who completedYouth Services Division programswith improved school attendancewhen truancy was an issue atreferral and/or at closure
No 42.3% 60% NotAvailable
60% 60%
Percent of youth who completedYouth Services Division programswithout juvenile justiceinvolvement while they were in theprogram
No 88.9% 85% 91.4% 85% 85%
4. Through a Two Generational (2Gen) Approach, empower DHS customers to improve their economicstability and well-being. (4 Measures)
MeasureNew Measure/
Benchmark YearFY 2019
ActualFY 2020
TargetFY 2020
ActualFY 2021
TargetFY 2022
TargetNumber of New Education orTraining Placements per 1,000TANF Work-eligible Customers(Monthly Average)
No 28.7 10 19.8 10 10
Number of New EmploymentPlacements per 1,000 TANFWork-eligible Customers (MonthlyAverage)
No 9 18 5.4 18 18
Percent of Newly EmployedCustomers Earning a DC LivingWage
No 41.8% 35% 62.8% 35% 35%
Percent of TANF EmploymentProgram Participants WhoParticipated in Eligible Activities
No 16% 25% 23.5% 25% 25%
5. Improve the customer experience at DHS service centers. (7 Measures)
MeasureNew Measure/
Benchmark YearFY 2019
ActualFY 2020
TargetFY 2020
ActualFY 2021
TargetFY 2022
TargetCall Center: Abandonment Rate No 62% 40% 23.5% 40% 40%Call Center: Average Wait Time(Minutes)
No 23.8 12 32.5 12 12
SNAP Application TimelyProcessing Rate (applicationsprocessed within 7 days for e-SNAP
No 95.5% 95% 95.3% 95% 95%

5. Improve the customer experience at DHS service centers. (7 Measures)
MeasureNew Measure/
Benchmark YearFY 2019
ActualFY 2020
TargetFY 2020
ActualFY 2021
TargetFY 2022
Targetand 30 days for regular SNAP)SNAP Error Rate No 15.7% 10% Not
Available10% 10%
Service Center Average Wait Timein Lobby (minutes)
No 122.5 110 DataForthcoming
110 110
Service Center Average Wait Timein non-Lobby (days)
No 5 7 4 7 7
Service Center Same DayCompletion Rate (Percent of LobbyCases)
No 85% 85% 83.7% 85% 85%
WORKLOAD MEASURESWorkload Measures, also called inputs or outputs, quantify an activity, effort or process that is necessary tomake progress towards the Strategic Objectives. They help answer the question; “How much are we doing?”
1. Youth-Focused Diversion Services
MeasureNew Measure/
Benchmark YearFY 2018
ActualFY 2019
ActualFY 2020
ActualNumber of teen parents served by the TeenParent Assessment Program (TPAP)
No 51 47 48
Number of youth experiencing homelessnessplaced into a housing program through theCoordinated Assessment and HousingPlacement (CAHP) system
No 13.8 16 22
Number of youth served by the StrengtheningTeens Enriching Parents (STEP) program
No 498 444 364
Number of youth served in the Alternatives tothe Court Experience (ACE) program
No 693 778 614
2. Homeless Services Continuum- Families
MeasureNew Measure/
Benchmark YearFY 2018
ActualFY 2019
ActualFY 2020
ActualAverage monthly census in family shelter No 670 534 472Number of family households experiencinghomelessness (annual)
No 1545 1537 1371
Number of family households experiencinghomelessness, January Point-in-Time (PIT)
No 924 815 768
Number of housing placements annually(family households)
No 621 788 715
3. Homeless Services Continuum- Individuals
MeasureNew Measure/
Benchmark YearFY 2018
ActualFY 2019
ActualFY 2020
ActualAverage monthly housing placements(Individuals experiencing homelessness)
No 188 116 75
Average monthly housing placements(Veterans)
No 115 47 30
Number of homeless Veterans, Point-in-Time(PIT)
No 302 292 294
Number of individuals experiencing chronichomelessness, Point-in-Time (PIT)
No 1586 1374 1337

3. Homeless Services Continuum- Individuals
MeasureNew Measure/
Benchmark YearFY 2018
ActualFY 2019
ActualFY 2020
ActualNumber of individuals experiencinghomelessness (annual)
No 12,343 11,096 9253
Number of individuals experiencinghomelessness, January Point-in-Time (PIT)
No 3770 3875 3947
4. TANF and FSET Case Management and Employment Assistance
MeasureNew Measure/
Benchmark YearFY 2018
ActualFY 2019
ActualFY 2020
ActualAverage Number of Families Entering TANF(Per Month)
No 402 346 331
Average Number of Families Exiting TANF(Per Month)
No 413 350 233
Average TANF Caseload (Per Month) No 11,651 12,544 13,813Number of Families Re-certified for TANFEligibility (Per Month)
No 605 644 Not Available
Total Number of Adults Receiving TANFCash Benefits (Monthly Average)
No 9551 11,036 12,405
Total Number of Children Receiving TANFCash Benefits (Monthly Average)
No 19,547 22,248 24,959
Total Number of Work-Eligible TANFCustomers (Monthly Average)
No 8118 9380 10,544
5. Eligibility Determination and Enrollment Support
MeasureNew Measure/
Benchmark YearFY 2018
ActualFY 2019
ActualFY 2020
ActualCall Center: Average Number of CallsReceived, Includes Served + Abandoned (PerMonth)
No 37,128 32,615 33,198
Call Center: Average Number of Calls Served(Per Month)
No 18,321 12,348 20,473
Medical Assistance: Average AllianceMedical Assistance Program Enrollment (PerMonth)
No 15,315 14,987 14,840
Medical Assistance: Average Medicaid(MAGI + Non-MAGI) Enrollment (PerMonth)
No 259,558 259,356 258,723
Medical Assistance: Number of MedicaidApplications
No 3518 10,613 Data Forthcoming
Medical Assistance: Number of MedicaidApplications that are Approved
No 3564 10,940 Data Forthcoming
Service Centers: Average Daily Number ofClient Visits at Service Centers, IncludingLobby Cases (Per Month)
No 779 831 Not Available
Service Centers: Average Daily Number ofNon-lobby Cases at Service Centers (PerMonth)
No 581 558 687

5. Eligibility Determination and Enrollment Support
MeasureNew Measure/
Benchmark YearFY 2018
ActualFY 2019
ActualFY 2020
ActualSNAP: Average SNAP Caseload (Per Month) No 68,828 65,447 70,419SNAP: Number of Households Re-certifiedfor SNAP Eligibility (Per Month)
No 3340 3081 Not Available
SNAP: Number of New Households Approvedfor SNAP and Receiving SNAP Benefits (PerMonth)
No 2514 2350 2771
SNAP: Number of SNAP Applications(Monthly Average)
No 3367 3205 3953
Performance Plan Endnotes:*For more information about the structure and components of FY 2022 draft performance plans, please see the FY 2022 Proposed Budget and Financial Plan, Volume 1, Appendix E.**Key performance indicators that are new may not have historical data and may only have FY 2022 targets. ***To view the final versions of agency FY 2022 performance plans when they become available in December 2021, see the OCA website at https://oca.dc.gov/.