Embed Size (px)
DESCRIPTION
JA Solar company introduction - Please view in full screen -
Citation preview
Protect the one Earth we all share, for this and future generations.
JA SolarCorporate Presentation
March 2011
This presentation contains forward-looking statements. These statements relate to future
events or to future financial performance and involve known and unknown risks, uncertainties,
and other factors that may cause our actual results, levels of activity, performance, or
achievements to be materially different from any future results, levels of activity, performance,
or achievements expressed or implied by these forward-looking statements. In some cases,
you can identify forward-looking statements by the use of words such as “may,” “could,”
“expect,” “intend,” “plan,” “seek,” “anticipate,” “believe,” “estimate,” “predict,” “potential,”
or “continue” or the negative of these terms or other comparable terminology. You should not
place undue reliance on forward-looking statements because they involve known and
unknown risks, uncertainties and other factors that are, in some cases, beyond our control
and that could materially affect actual results, levels of activity, performance, or achievements.
Any forward-looking statement you see or hear during this presentation reflects our current
views with respect to future events and is subject to the risks, uncertainties, and assumptions
relating to our operations, results of operations, growth strategy, and liquidity. We assume no
obligation to publicly update or revise these forward-looking statements for any reason,
whether as a result of new information, future events, or otherwise.
Forward-looking Statements
Introduction to JA Solar
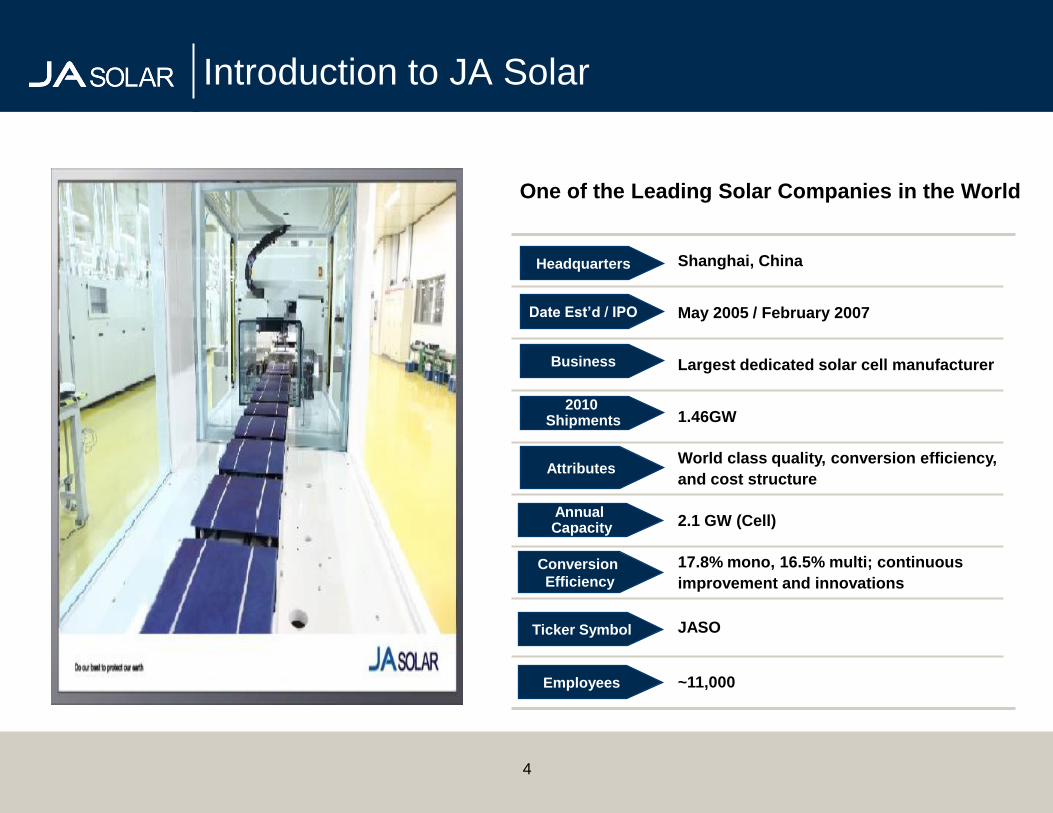
Shanghai, China
May 2005 / February 2007
Largest dedicated solar cell manufacturer
1.46GW
World class quality, conversion efficiency,
and cost structure
2.1 GW (Cell)
17.8% mono, 16.5% multi; continuous
improvement and innovations
JASO
~11,000
One of the Leading Solar Companies in the World
Headquarters
2010 Shipments
Ticker Symbol
Date Est’d / IPO
Attributes
Annual Capacity
Conversion
Efficiency
Employees
Business
4
Introduction to JA Solar
Experienced Management Team
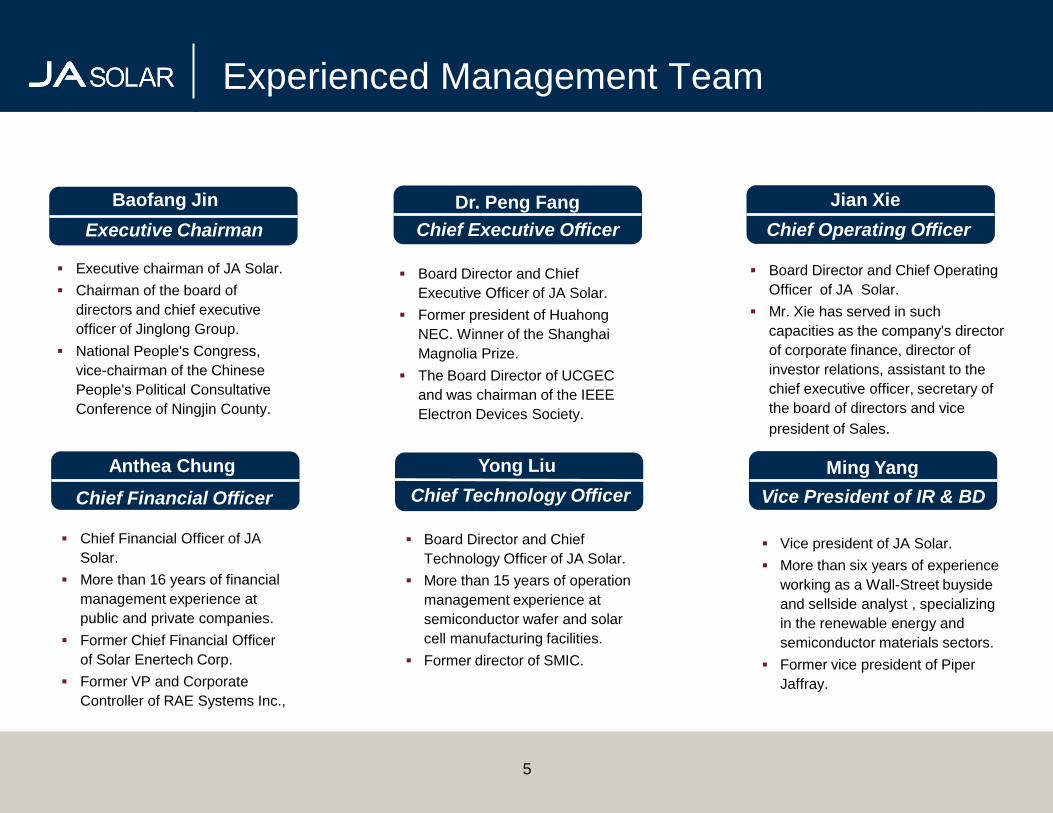
Baofang Jin
Executive Chairman
Dr. Peng Fang
Chief Executive Officer
Jian Xie
Chief Operating Officer
Anthea Chung
Chief Financial Officer
Yong Liu
Chief Technology Officer
Ming Yang
Vice President of IR & BD
5
Executive chairman of JA Solar.
Chairman of the board of
directors and chief executive
officer of Jinglong Group.
National People's Congress,
vice-chairman of the Chinese
People's Political Consultative
Conference of Ningjin County.
Board Director and Chief
Executive Officer of JA Solar.
Former president of Huahong
NEC. Winner of the Shanghai
Magnolia Prize.
The Board Director of UCGEC
and was chairman of the IEEE
Electron Devices Society.
Board Director and Chief Operating
Officer of JA Solar.
Mr. Xie has served in such
capacities as the company's director
of corporate finance, director of
investor relations, assistant to the
chief executive officer, secretary of
the board of directors and vice
president of Sales.
Chief Financial Officer of JA
Solar.
More than 16 years of financial
management experience at
public and private companies.
Former Chief Financial Officer
of Solar Enertech Corp.
Former VP and Corporate
Controller of RAE Systems Inc.,
Board Director and Chief
Technology Officer of JA Solar.
More than 15 years of operation
management experience at
semiconductor wafer and solar
cell manufacturing facilities.
Former director of SMIC.
Vice president of JA Solar.
More than six years of experience
working as a Wall-Street buyside
and sellside analyst , specializing
in the renewable energy and
semiconductor materials sectors.
Former vice president of Piper
Jaffray.
6
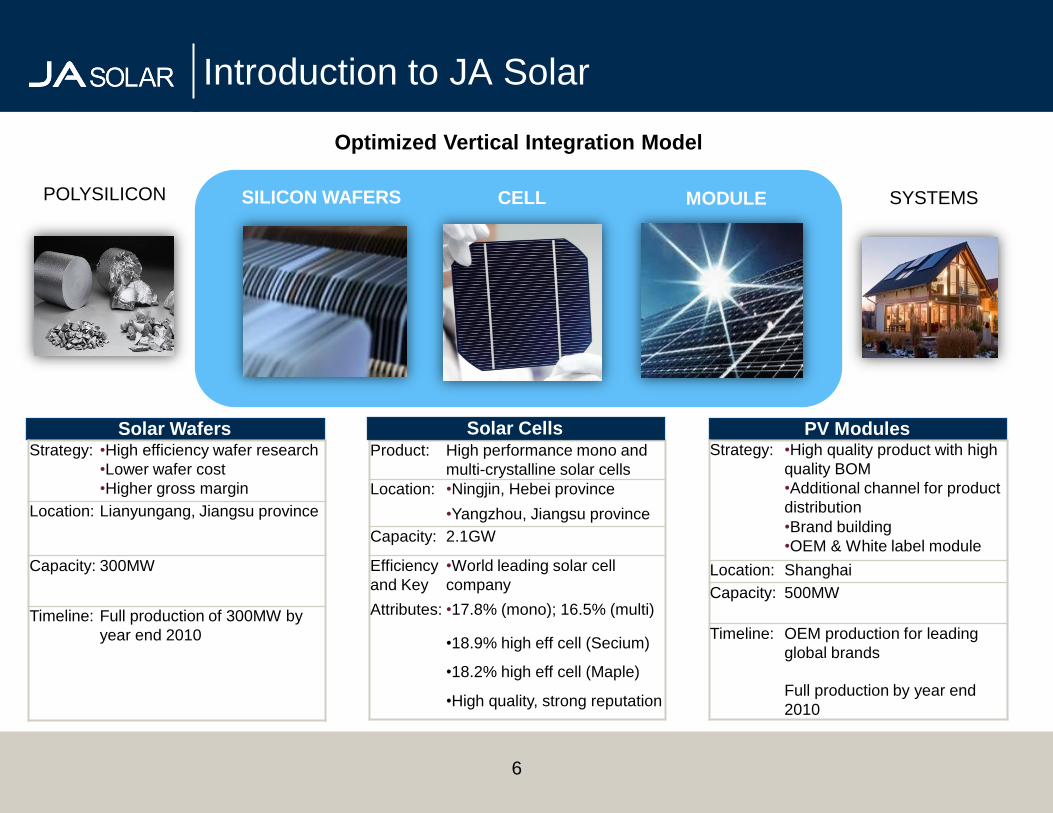
Product: High performance mono and
multi-crystalline solar cells
Location: •Ningjin, Hebei province
•Yangzhou, Jiangsu province
Capacity: 2.1GW
Efficiency
and Key
•World leading solar cell
company
Attributes: •17.8% (mono); 16.5% (multi)
•18.9% high eff cell (Secium)
•18.2% high eff cell (Maple)
•High quality, strong reputation
PV ModulesSolar Wafers Solar CellsStrategy: •High efficiency wafer research
•Lower wafer cost
•Higher gross margin
Location: Lianyungang, Jiangsu province
Capacity: 300MW
Timeline: Full production of 300MW by
year end 2010
POLYSILICON SILICON WAFERS CELL MODULE SYSTEMS
Introduction to JA Solar
Optimized Vertical Integration Model
Strategy: •High quality product with high
quality BOM
•Additional channel for product
distribution
•Brand building
•OEM & White label module
Location: Shanghai
Capacity: 500MW
Timeline: OEM production for leading
global brands
Full production by year end
2010
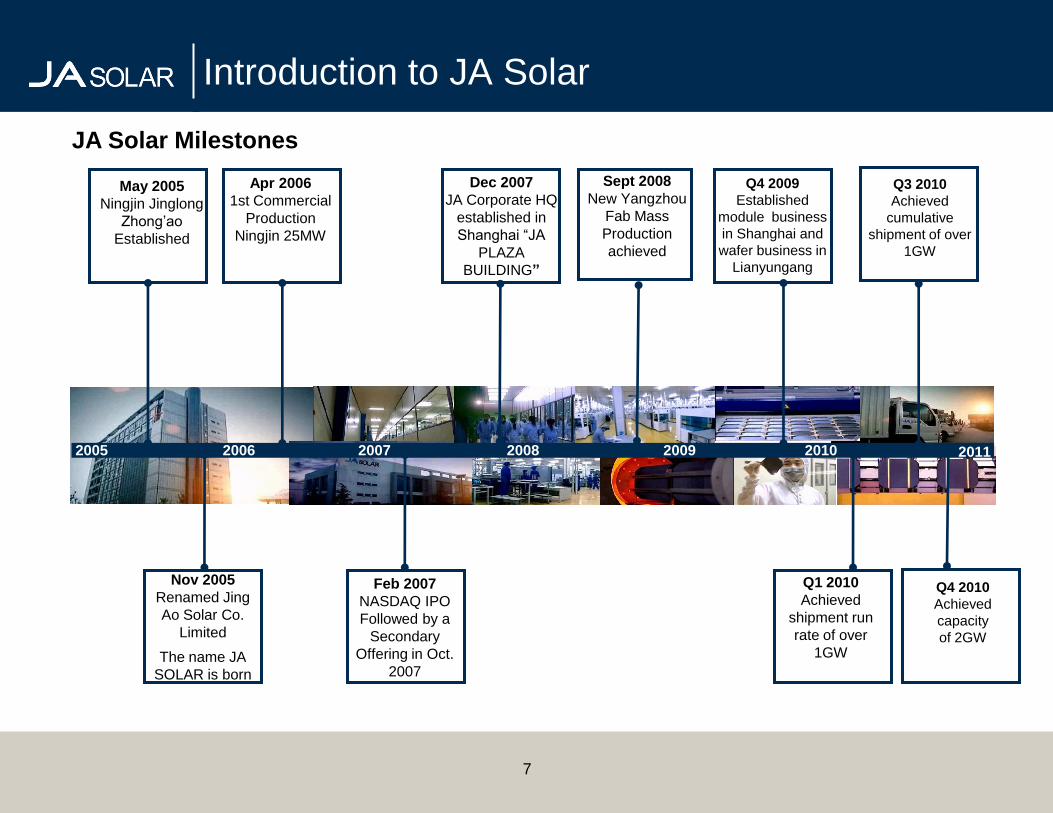
Introduction to JA Solar
2005 2006 2007 2008 2009
May 2005
Ningjin Jinglong
Zhong’ao
Established
Apr 2006
1st Commercial
Production
Ningjin 25MW
Dec 2007
JA Corporate HQ
established in
Shanghai ―JA
PLAZA
BUILDING”
Sept 2008
New Yangzhou
Fab Mass
Production
achieved
Q4 2009
Established
module business
in Shanghai and
wafer business in
Lianyungang
Feb 2007
NASDAQ IPO
Followed by a
Secondary
Offering in Oct.
2007
Nov 2005
Renamed Jing
Ao Solar Co.
Limited
The name JA
SOLAR is born
Q1 2010
Achieved
shipment run
rate of over
1GW
2010
JA Solar Milestones
7
2011
Q3 2010
Achieved
cumulative
shipment of over
1GW
Q4 2010
Achieved
capacity
of 2GW
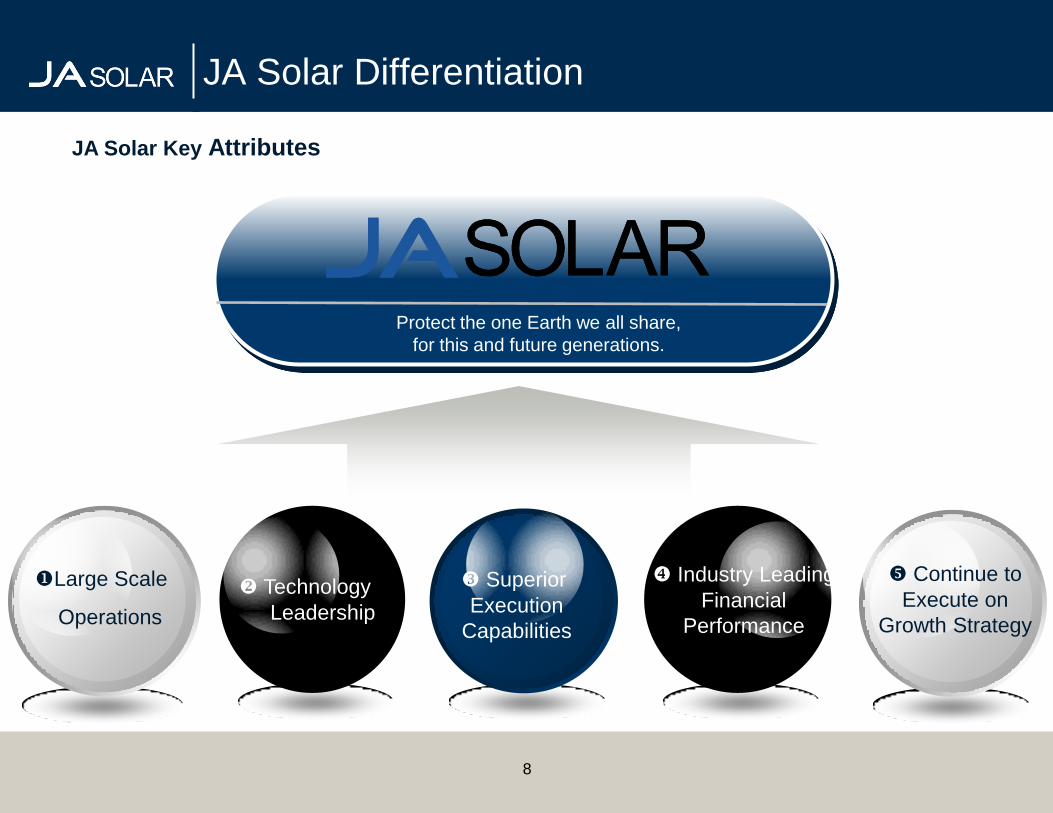
JA Solar Differentiation
JA Solar Key Attributes
8
Superior
Execution
Capabilities
Industry Leading
Financial
Performance
Continue to
Execute on
Growth Strategy
Technology
Leadership
Large Scale
Operations
Protect the one Earth we all share,
for this and future generations.
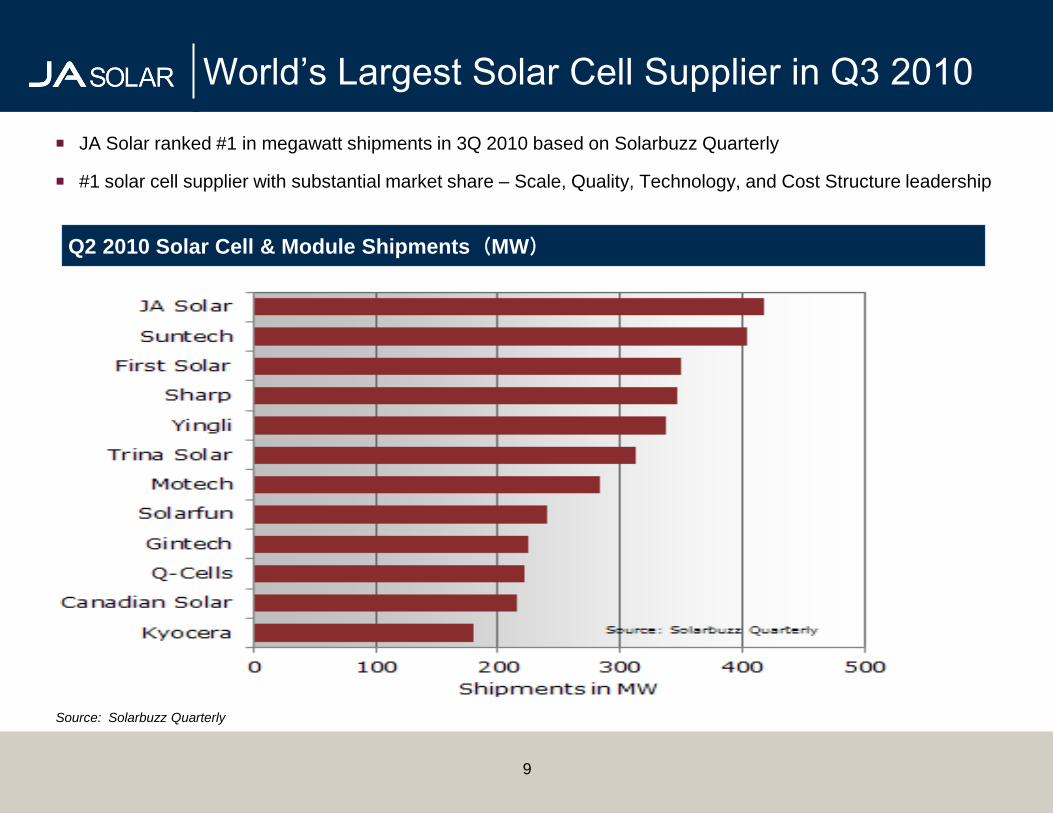
Q2 2010 Solar Cell & Module Shipments(MW)
Source: Solarbuzz Quarterly
JA Solar ranked #1 in megawatt shipments in 3Q 2010 based on Solarbuzz Quarterly
#1 solar cell supplier with substantial market share – Scale, Quality, Technology, and Cost Structure leadership
9
World’s Largest Solar Cell Supplier in Q3 2010
10
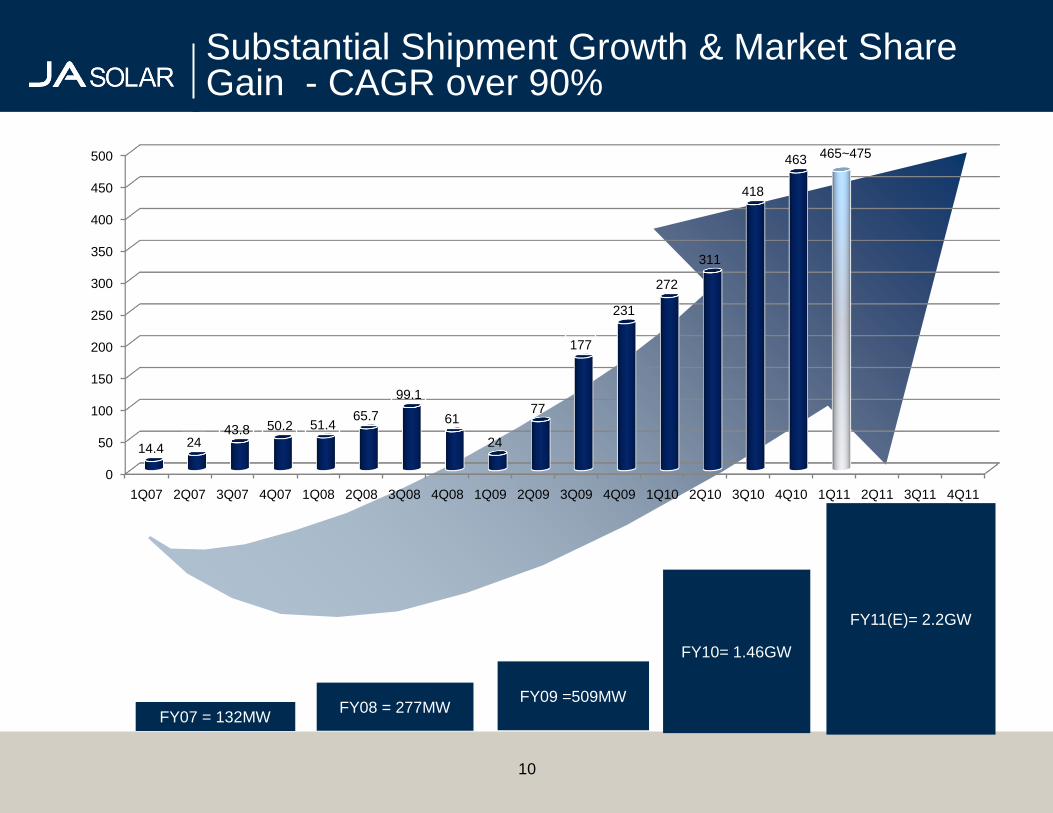
FY07 = 132MWFY08 = 277MW
FY09 =509MW
FY10= 1.46GW
Substantial Shipment Growth & Market Share Gain - CAGR over 90%
FY11(E)= 2.2GW
0
50
100
150
200
250
300
350
400
450
500
1Q07 2Q07 3Q07 4Q07 1Q08 2Q08 3Q08 4Q08 1Q09 2Q09 3Q09 4Q09 1Q10 2Q10 3Q10 4Q10 1Q11 2Q11 3Q11 4Q11
14.4 2443.8 50.2 51.4
65.7
99.1
61
24
77
177
231
272
311
418
463465~475
Customer Base
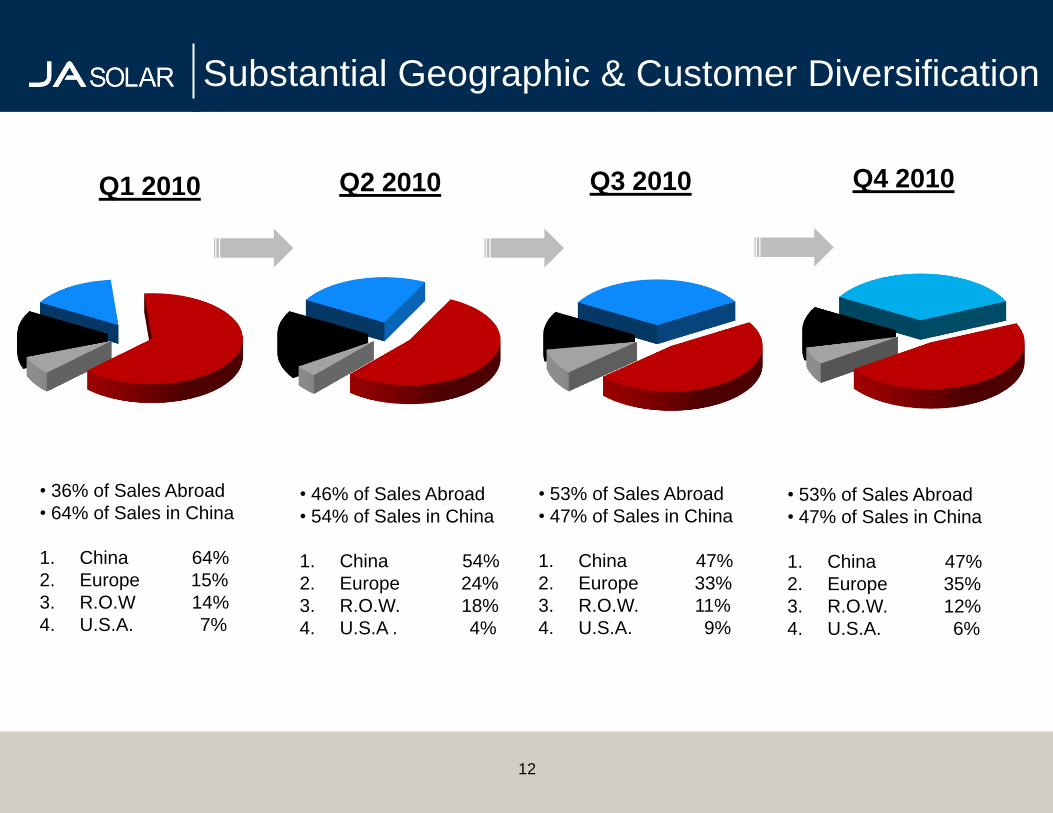
• 46% of Sales Abroad
• 54% of Sales in China
1. China 54%
2. Europe 24%
3. R.O.W. 18%
4. U.S.A . 4%
Q2 2010
• 53% of Sales Abroad
• 47% of Sales in China
1. China 47%
2. Europe 33%
3. R.O.W. 11%
4. U.S.A. 9%
Q3 2010
12
Substantial Geographic & Customer Diversification
• 53% of Sales Abroad
• 47% of Sales in China
1. China 47%
2. Europe 35%
3. R.O.W. 12%
4. U.S.A. 6%
Q4 2010
• 36% of Sales Abroad
• 64% of Sales in China
1. China 64%
2. Europe 15%
3. R.O.W 14%
4. U.S.A. 7%
Q1 2010
13
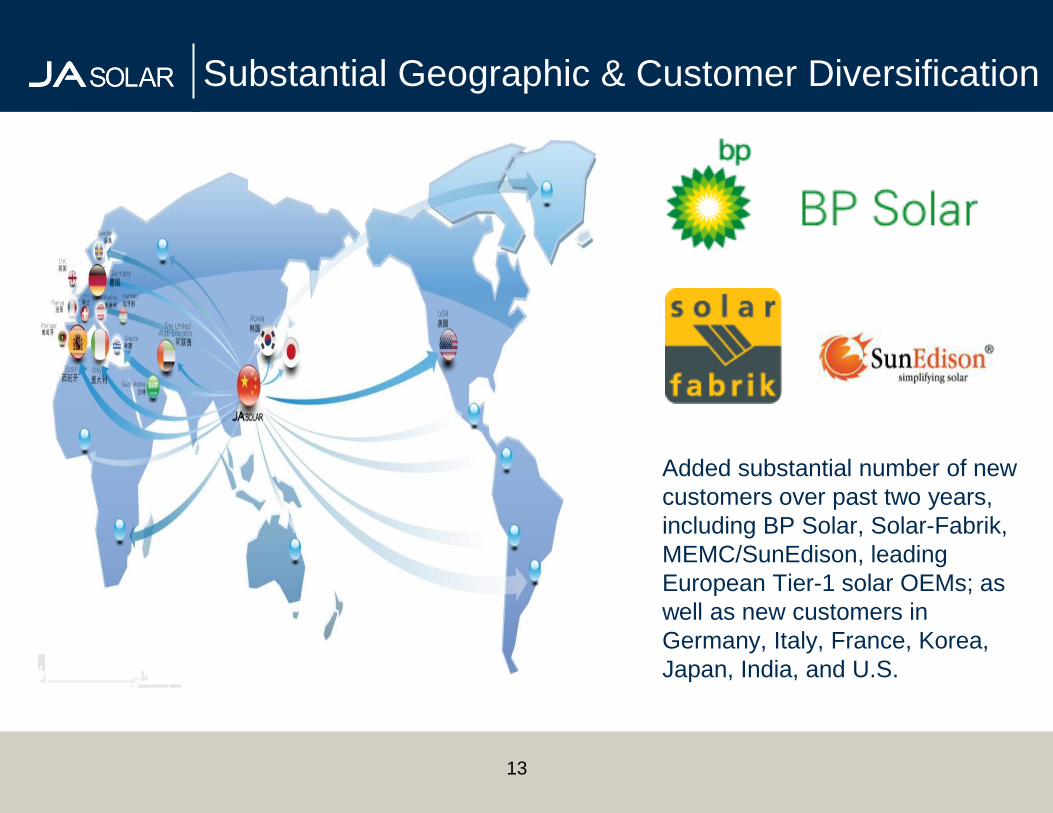
Added substantial number of new
customers over past two years,
including BP Solar, Solar-Fabrik,
MEMC/SunEdison, leading
European Tier-1 solar OEMs; as
well as new customers in
Germany, Italy, France, Korea,
Japan, India, and U.S.
Substantial Geographic & Customer Diversification
Manufacturing and Technology
Large Scale Operations
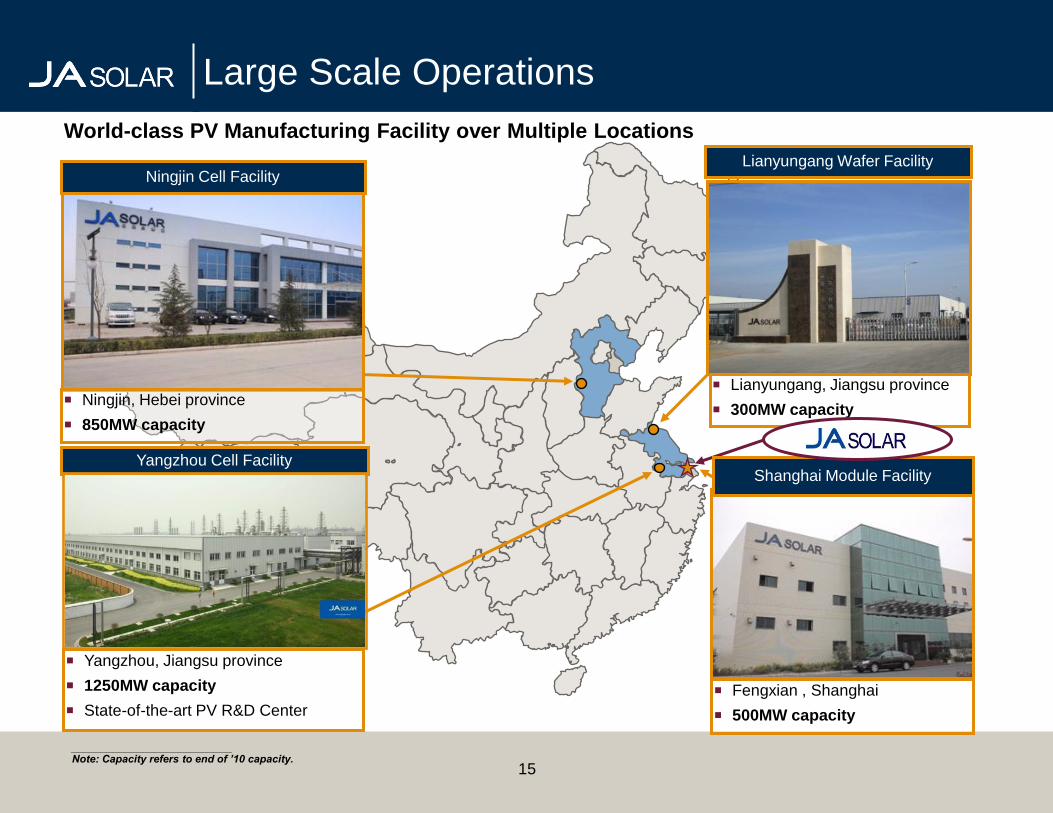
Ningjin, Hebei province
850MW capacity
Yangzhou, Jiangsu province
1250MW capacity
State-of-the-art PV R&D Center
Ningjin Cell Facility
Lianyungang, Jiangsu province
300MW capacity
Lianyungang Wafer Facility
Fengxian , Shanghai
500MW capacity
Shanghai Module FacilityYangzhou Cell Facility
___________________________Note: Capacity refers to end of ’10 capacity.
World-class PV Manufacturing Facility over Multiple Locations
15
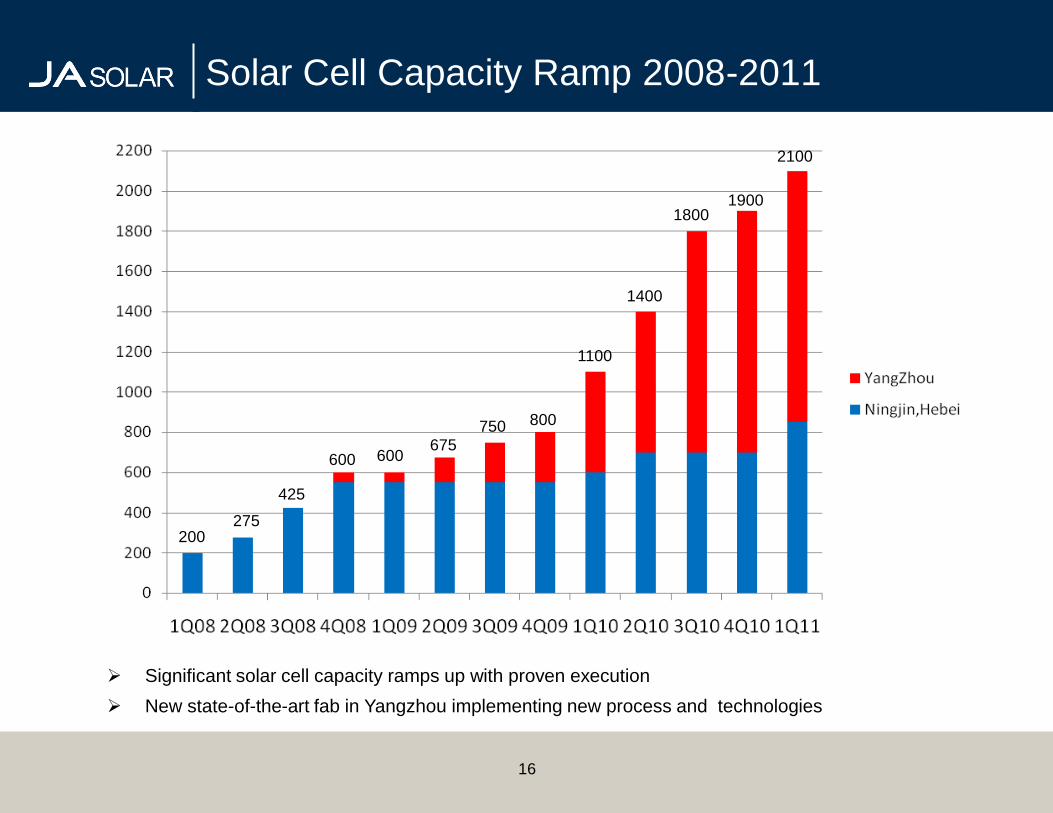
1Q08 2Q08 3Q08 4Q08 1Q09 2Q09 3Q09 4Q09 1Q10 2Q10 3Q10 4Q10 1Q11
YangZhou 50 50 125 200 250 500 700 1100 1200 1250
0
200
400
600
800
1000
1200
1400
1600
1800
2000
2200
YangZhou
YangZhou
Solar Cell Capacity Ramp 2008-2011
Significant solar cell capacity ramps up with proven execution
New state-of-the-art fab in Yangzhou implementing new process and technologies
16
200275
425
600 600675
750 800
1100
1400
18001900
2100
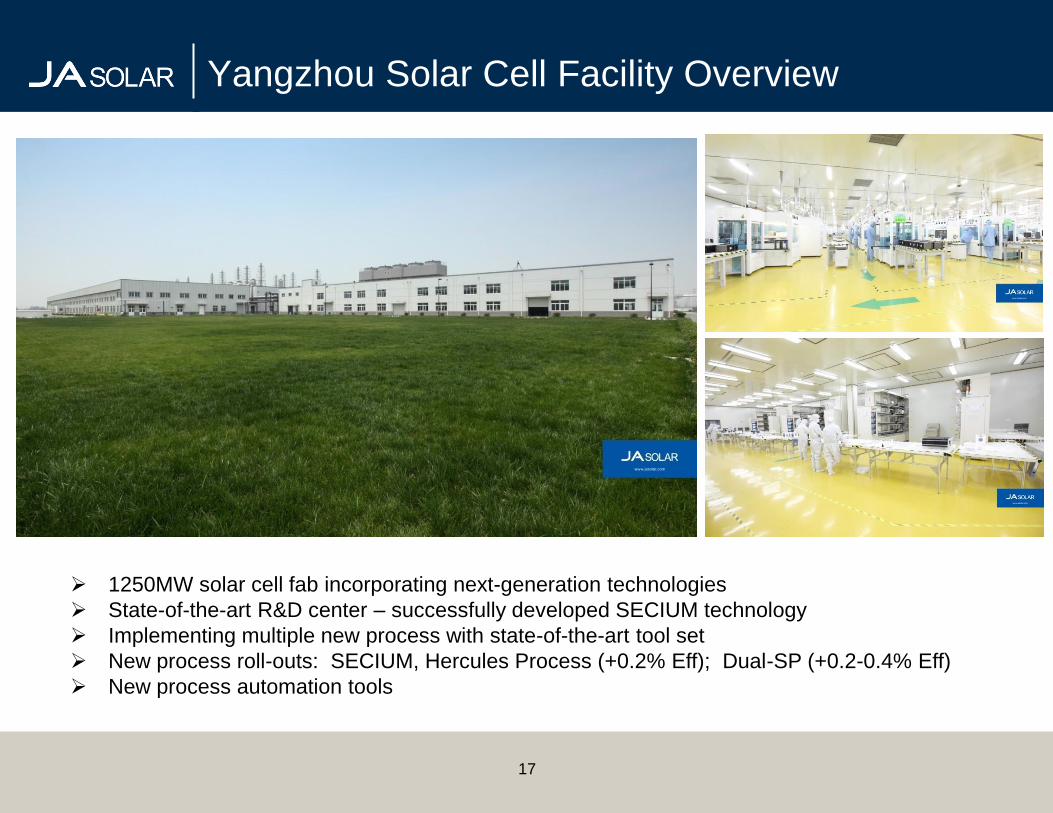
Yangzhou Solar Cell Facility Overview
1250MW solar cell fab incorporating next-generation technologies
State-of-the-art R&D center – successfully developed SECIUM technology
Implementing multiple new process with state-of-the-art tool set
New process roll-outs: SECIUM, Hercules Process (+0.2% Eff); Dual-SP (+0.2-0.4% Eff)
New process automation tools
17
14.0%
14.5%
15.0%
15.5%
16.0%
16.5%
17.0%
17.5%
18.0%
1Q08 2Q08 3Q08 4Q08 1Q09 2Q09 3Q09 4Q09 1Q10 2Q10 3Q104Q10 1Q11 2Q11 3Q11 4Q11
Multi-crystalline
Maple
15.0%
15.5%
16.0%
16.5%
17.0%
17.5%
18.0%
18.5%
19.0%
1Q08 2Q08 3Q08 4Q08 1Q09 2Q09 3Q09 4Q09 1Q10 2Q10 3Q104Q10 1Q11 2Q11 3Q11 4Q11
Conventional Mono
Secium Cell
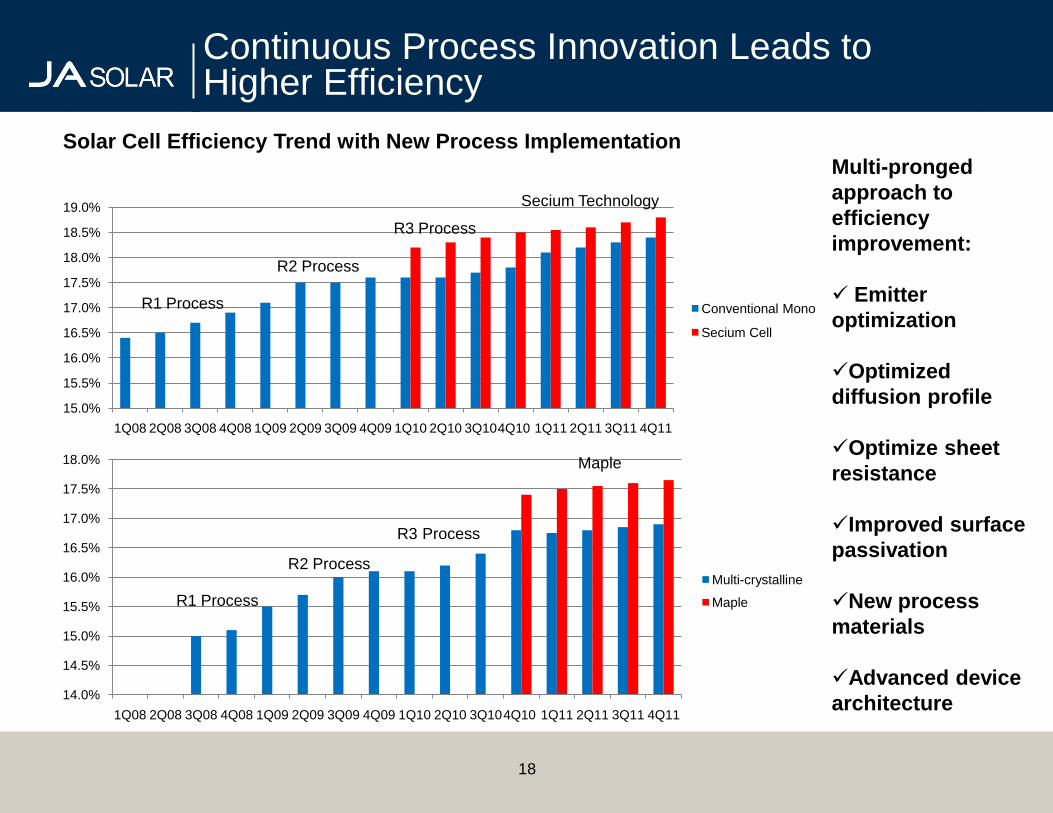
Continuous Process Innovation Leads to Higher Efficiency
18
Solar Cell Efficiency Trend with New Process Implementation
R1 Process
R2 Process
Secium Technology
R1 Process
R2 Process
R3 Process
Multi-pronged
approach to
efficiency
improvement:
Emitter
optimization
Optimized
diffusion profile
Optimize sheet
resistance
Improved surface
passivation
New process
materials
Advanced device
architecture
Maple
R3 Process
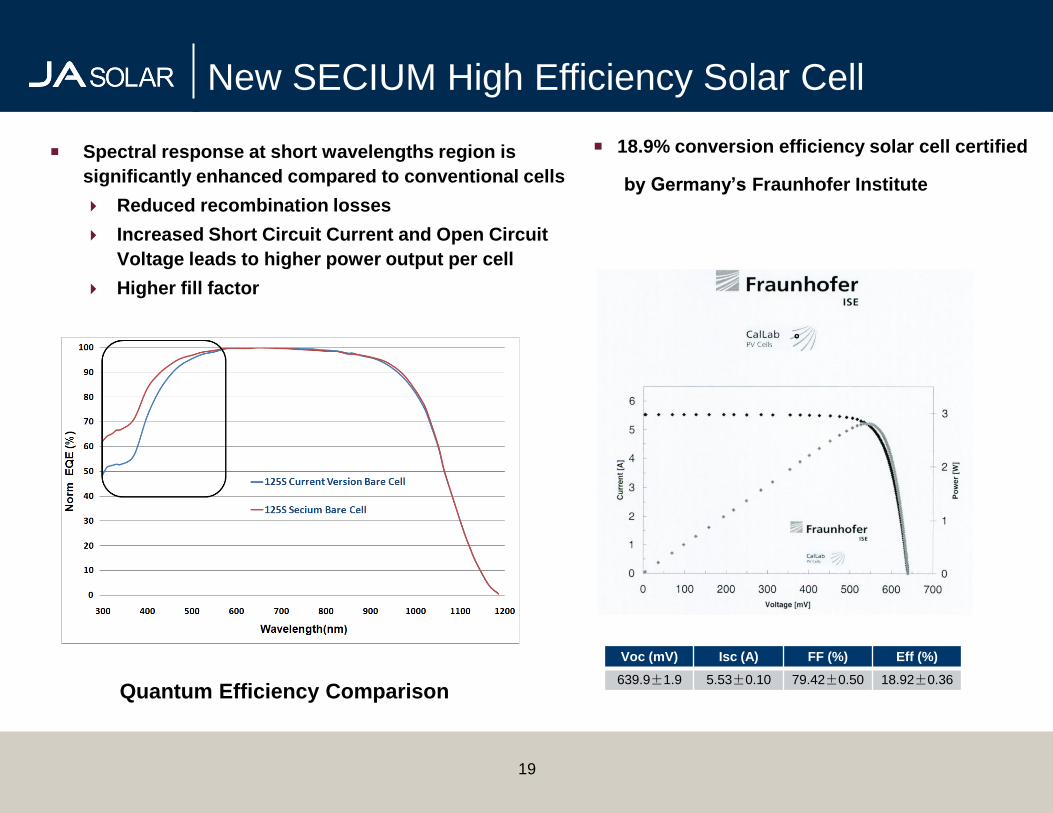
Quantum Efficiency Comparison
Spectral response at short wavelengths region is
significantly enhanced compared to conventional cells
Reduced recombination losses
Increased Short Circuit Current and Open Circuit
Voltage leads to higher power output per cell
Higher fill factor
19
New SECIUM High Efficiency Solar Cell
Voc (mV) Isc (A) FF (%) Eff (%)
639.9±1.9 5.53±0.10 79.42±0.50 18.92±0.36
。
18.9% conversion efficiency solar cell certified
by Germany’s Fraunhofer Institute
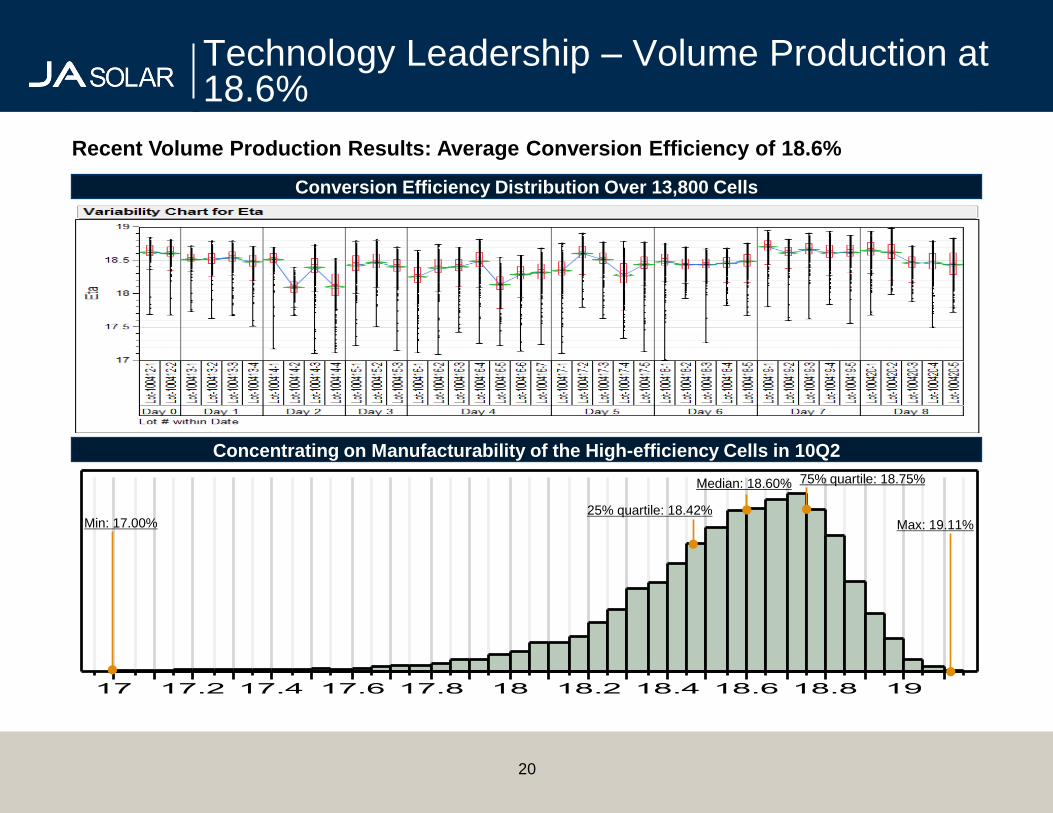
Recent Volume Production Results: Average Conversion Efficiency of 18.6%
Conversion Efficiency Distribution Over 13,800 Cells
Concentrating on Manufacturability of the High-efficiency Cells in 10Q2
Technology Leadership – Volume Production at 18.6%
Min: 17.00% Max: 19.11%25% quartile: 18.42%
Median: 18.60% 75% quartile: 18.75%
20
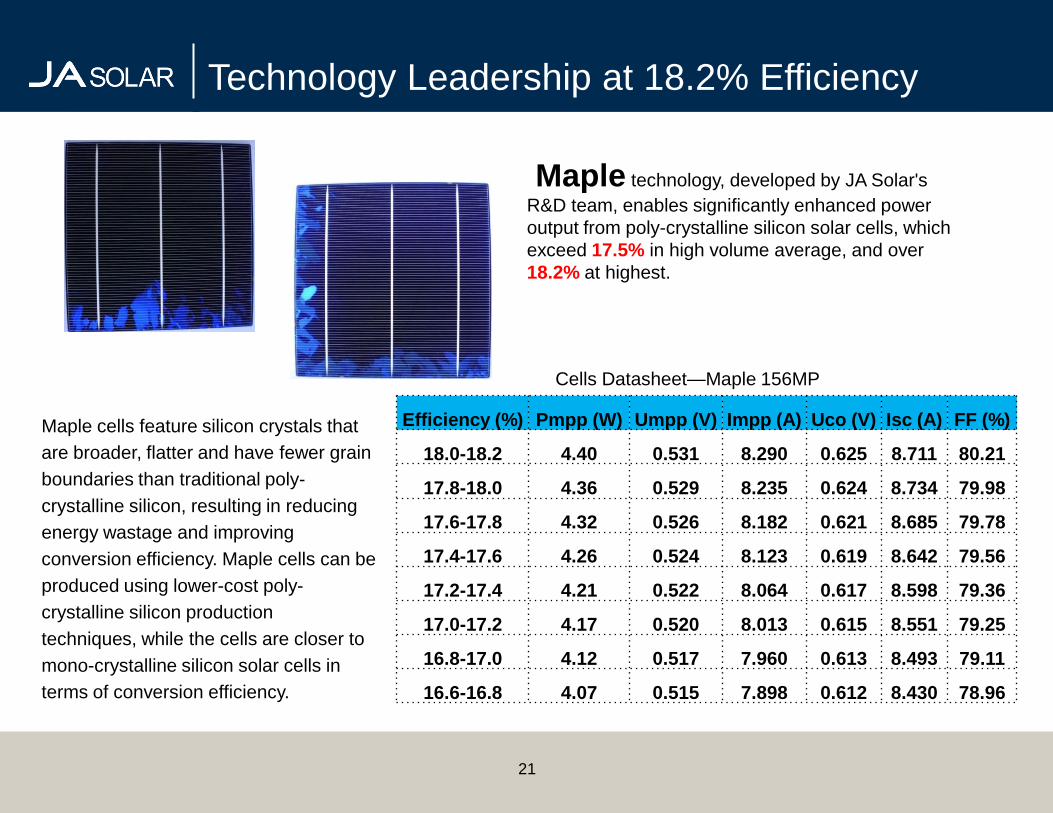
Technology Leadership at 18.2% Efficiency
21
Maple cells feature silicon crystals that
are broader, flatter and have fewer grain
boundaries than traditional poly-
crystalline silicon, resulting in reducing
energy wastage and improving
conversion efficiency. Maple cells can be
produced using lower-cost poly-
crystalline silicon production
techniques, while the cells are closer to
mono-crystalline silicon solar cells in
terms of conversion efficiency.
Cells Datasheet—Maple 156MP
Maple technology, developed by JA Solar's
R&D team, enables significantly enhanced power
output from poly-crystalline silicon solar cells, which
exceed 17.5% in high volume average, and over
18.2% at highest.
Efficiency (%) Pmpp (W) Umpp (V) Impp (A) Uco (V) Isc (A) FF (%)
18.0-18.2 4.40 0.531 8.290 0.625 8.711 80.21
17.8-18.0 4.36 0.529 8.235 0.624 8.734 79.98
17.6-17.8 4.32 0.526 8.182 0.621 8.685 79.78
17.4-17.6 4.26 0.524 8.123 0.619 8.642 79.56
17.2-17.4 4.21 0.522 8.064 0.617 8.598 79.36
17.0-17.2 4.17 0.520 8.013 0.615 8.551 79.25
16.8-17.0 4.12 0.517 7.960 0.613 8.493 79.11
16.6-16.8 4.07 0.515 7.898 0.612 8.430 78.96
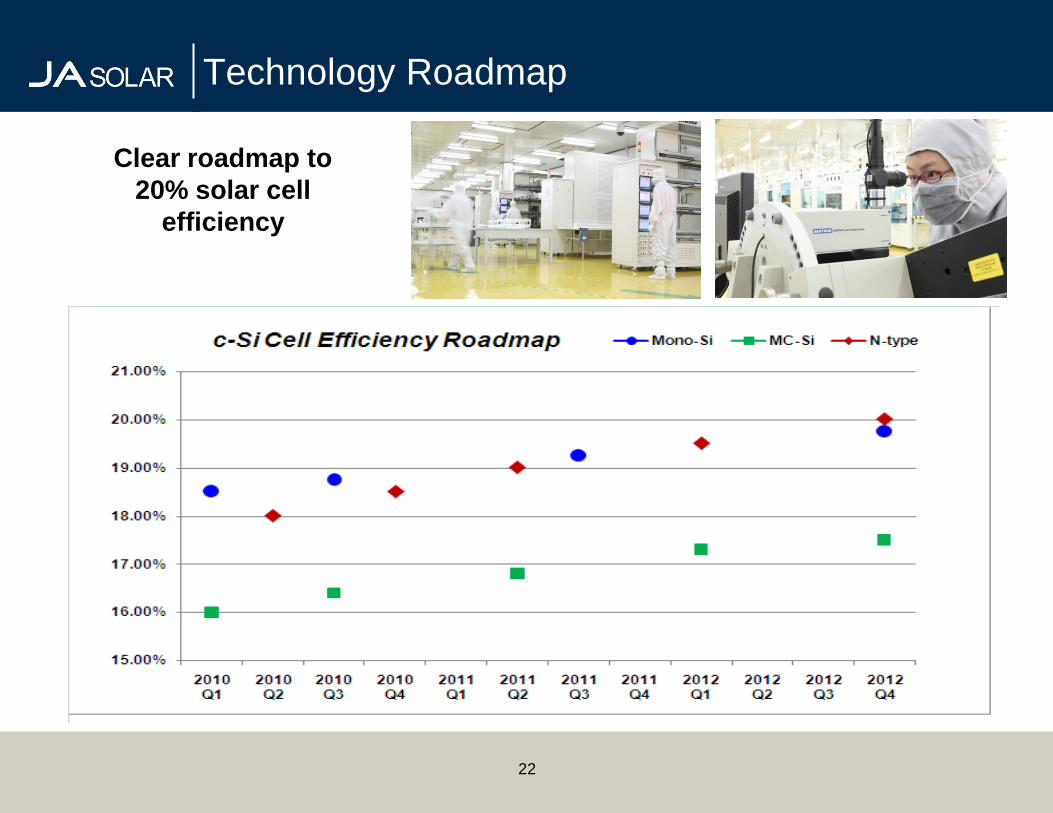
Technology Roadmap
22
Clear roadmap to
20% solar cell
efficiency
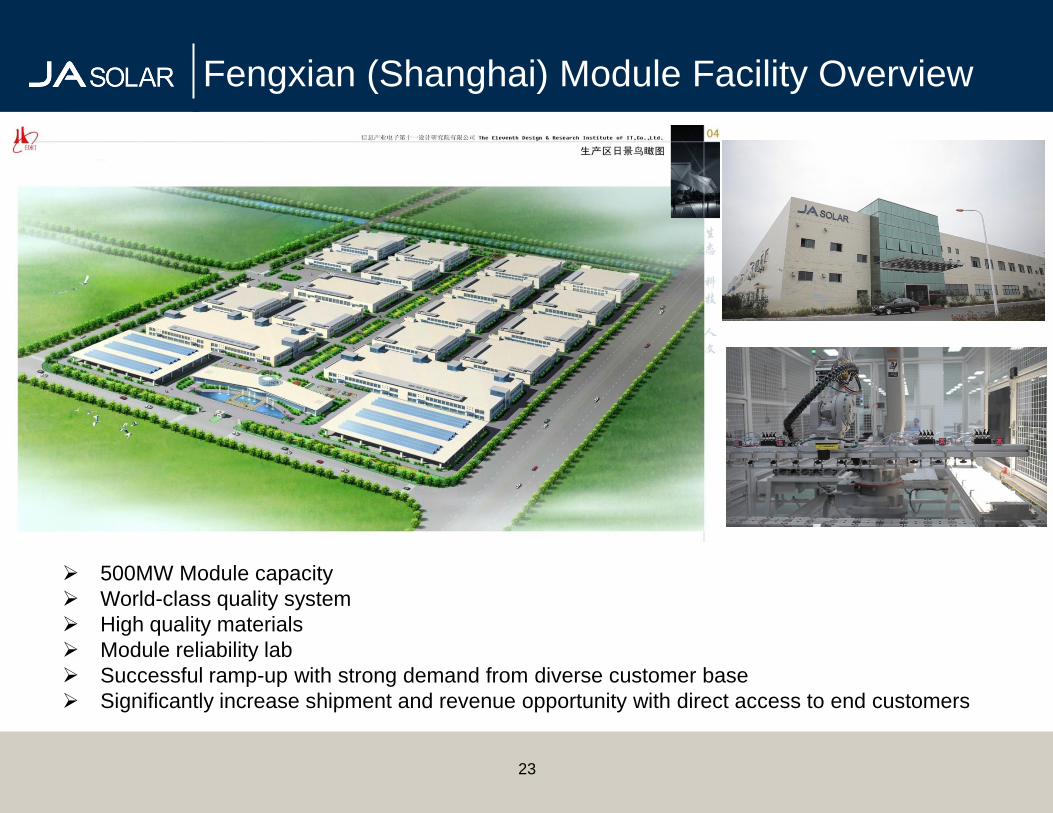
Fengxian (Shanghai) Module Facility Overview
500MW Module capacity
World-class quality system
High quality materials
Module reliability lab
Successful ramp-up with strong demand from diverse customer base
Significantly increase shipment and revenue opportunity with direct access to end customers
23
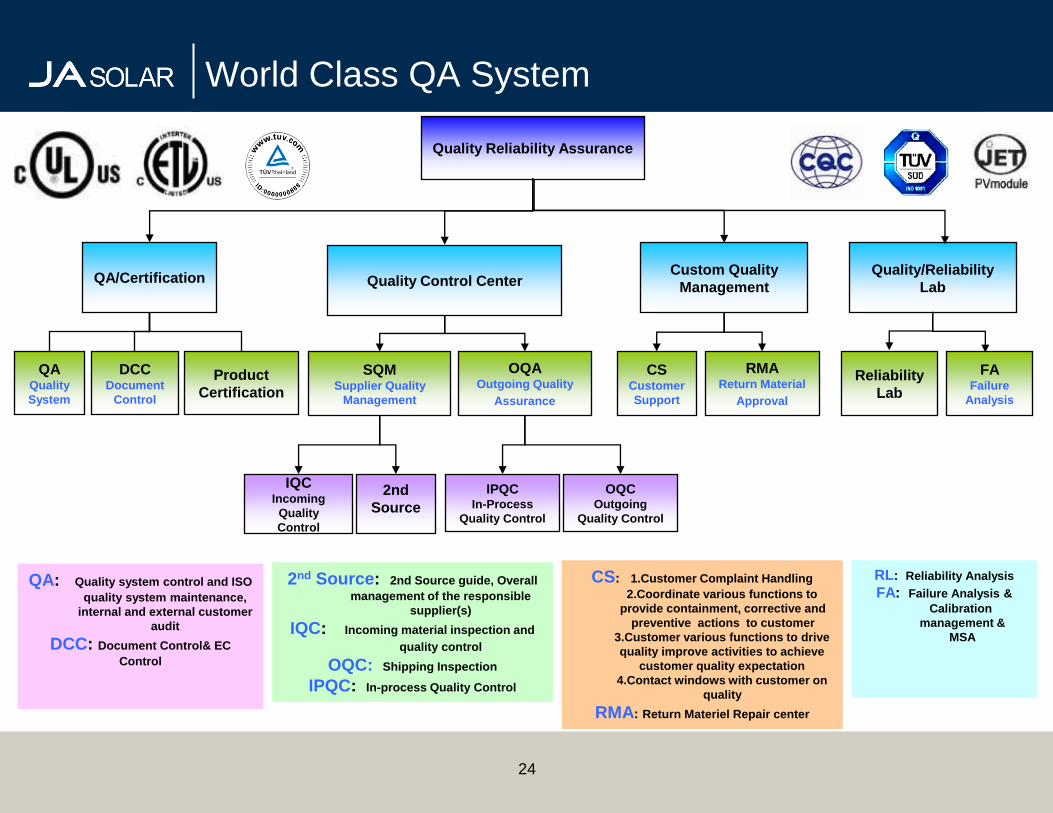
CS: 1.Customer Complaint Handling
2.Coordinate various functions to
provide containment, corrective and
preventive actions to customer
3.Customer various functions to drive
quality improve activities to achieve
customer quality expectation
4.Contact windows with customer on
quality
RMA: Return Materiel Repair center
Quality Reliability Assurance
QA: Quality system control and ISO
quality system maintenance,
internal and external customer
audit
DCC: Document Control& EC
Control
2nd Source: 2nd Source guide, Overall
management of the responsible
supplier(s)
IQC: Incoming material inspection and
quality control
OQC: Shipping Inspection
IPQC: In-process Quality Control
Custom Quality
Management
RMAReturn Material
Approval
CSCustomer
Support
OQAOutgoing Quality
Assurance
Quality Control Center
SQMSupplier Quality
Management
IQCIncoming
Quality
Control
2nd
Source
IPQCIn-Process
Quality Control
QA/Certification
QAQuality
System
DCCDocument
Control
Product
Certification
Quality/Reliability
Lab
Reliability
Lab
RL: Reliability Analysis
FA: Failure Analysis &
Calibration
management &
MSA
FAFailure
Analysis
OQCOutgoing
Quality Control
World Class QA System
24
Financial Performance
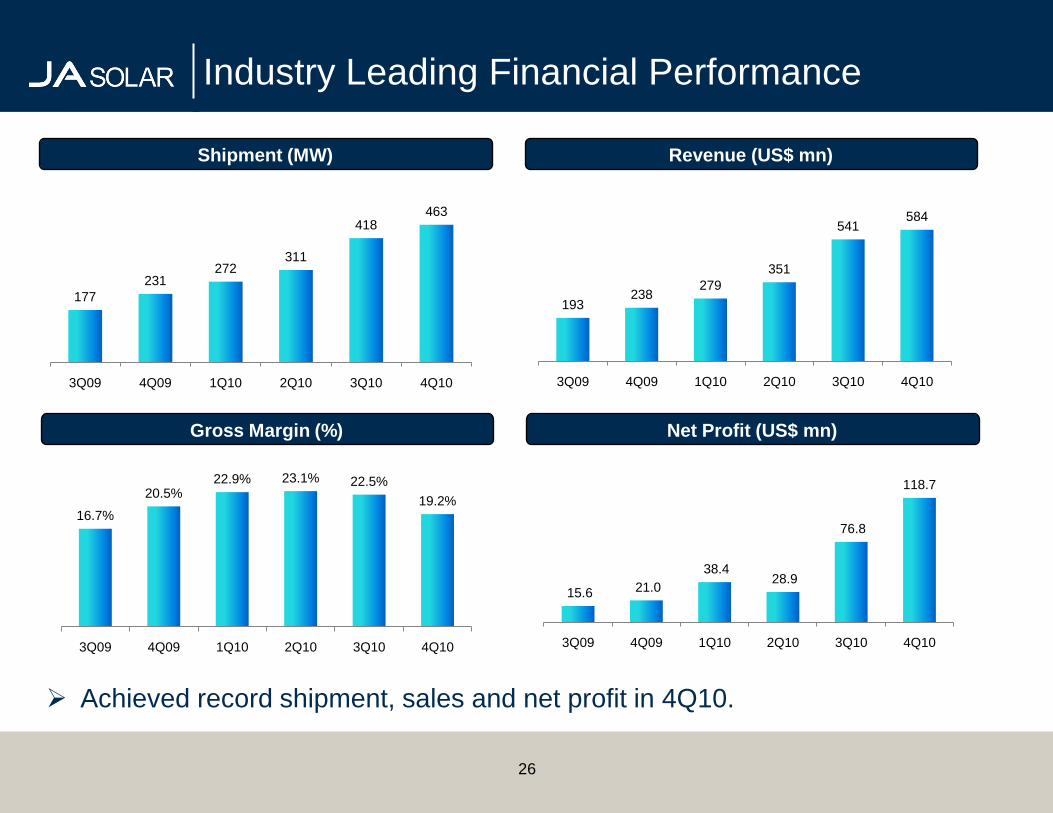
Industry Leading Financial Performance
26
177
231272
311
418463
3Q09 4Q09 1Q10 2Q10 3Q10 4Q10
193238
279
351
541584
3Q09 4Q09 1Q10 2Q10 3Q10 4Q10
Shipment (MW) Revenue (US$ mn)
Gross Margin (%) Net Profit (US$ mn)
Achieved record shipment, sales and net profit in 4Q10.
16.7%
20.5%22.9% 23.1% 22.5%
19.2%
3Q09 4Q09 1Q10 2Q10 3Q10 4Q10
15.6 21.0
38.4 28.9
76.8
118.7
3Q09 4Q09 1Q10 2Q10 3Q10 4Q10
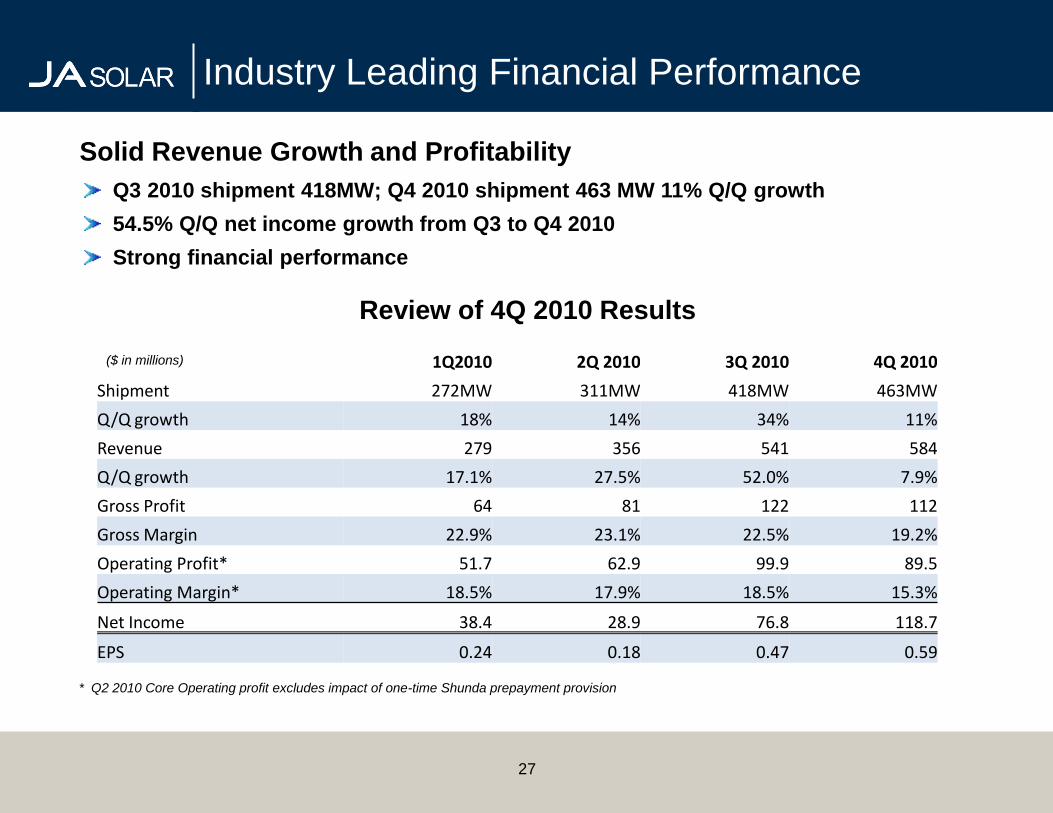
Review of 4Q 2010 Results
Industry Leading Financial Performance
($ in millions)
27
Q3 2010 shipment 418MW; Q4 2010 shipment 463 MW 11% Q/Q growth
54.5% Q/Q net income growth from Q3 to Q4 2010
Strong financial performance
* Q2 2010 Core Operating profit excludes impact of one-time Shunda prepayment provision
Solid Revenue Growth and Profitability
1Q2010 2Q 2010 3Q 2010 4Q 2010
Shipment 272MW 311MW 418MW 463MW
Q/Q growth 18% 14% 34% 11%
Revenue 279 356 541 584
Q/Q growth 17.1% 27.5% 52.0% 7.9%
Gross Profit 64 81 122 112
Gross Margin 22.9% 23.1% 22.5% 19.2%
Operating Profit* 51.7 62.9 99.9 89.5
Operating Margin* 18.5% 17.9% 18.5% 15.3%
Net Income 38.4 28.9 76.8 118.7
EPS 0.24 0.18 0.47 0.59
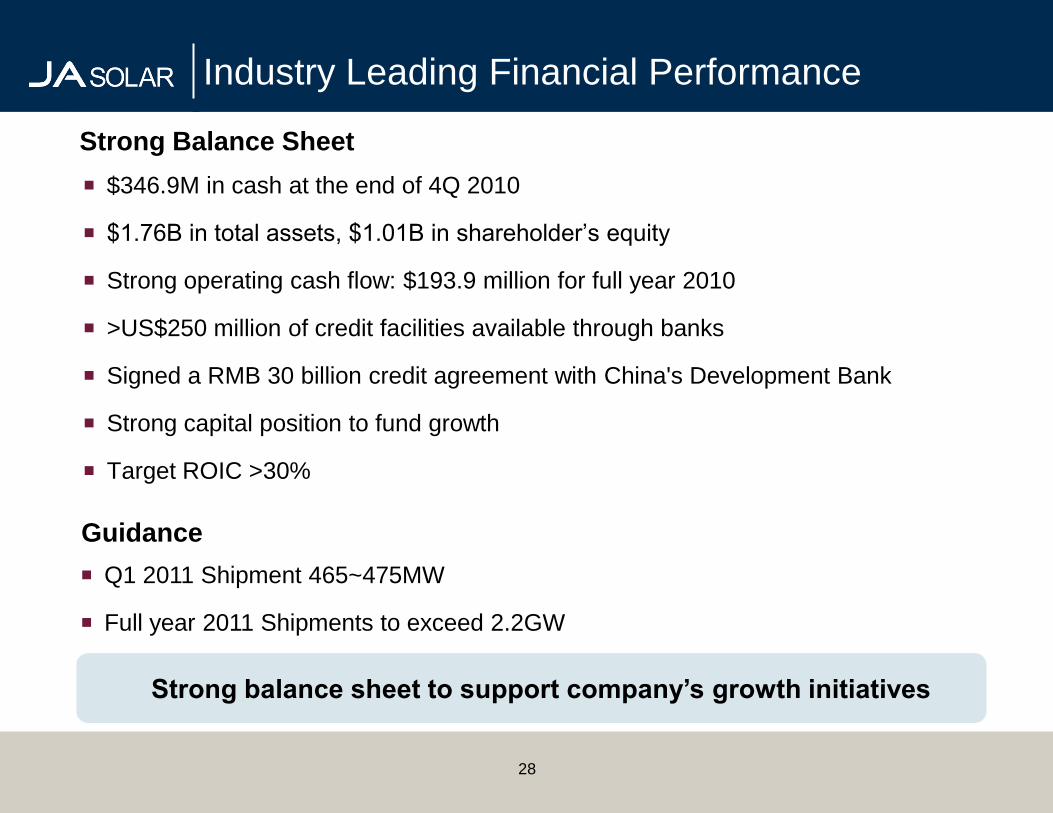
Strong Balance Sheet
$346.9M in cash at the end of 4Q 2010
$1.76B in total assets, $1.01B in shareholder’s equity
Strong operating cash flow: $193.9 million for full year 2010
>US$250 million of credit facilities available through banks
Signed a RMB 30 billion credit agreement with China's Development Bank
Strong capital position to fund growth
Target ROIC >30%
Strong balance sheet to support company’s growth initiatives
Industry Leading Financial Performance
Guidance
28
Q1 2011 Shipment 465~475MW
Full year 2011 Shipments to exceed 2.2GW
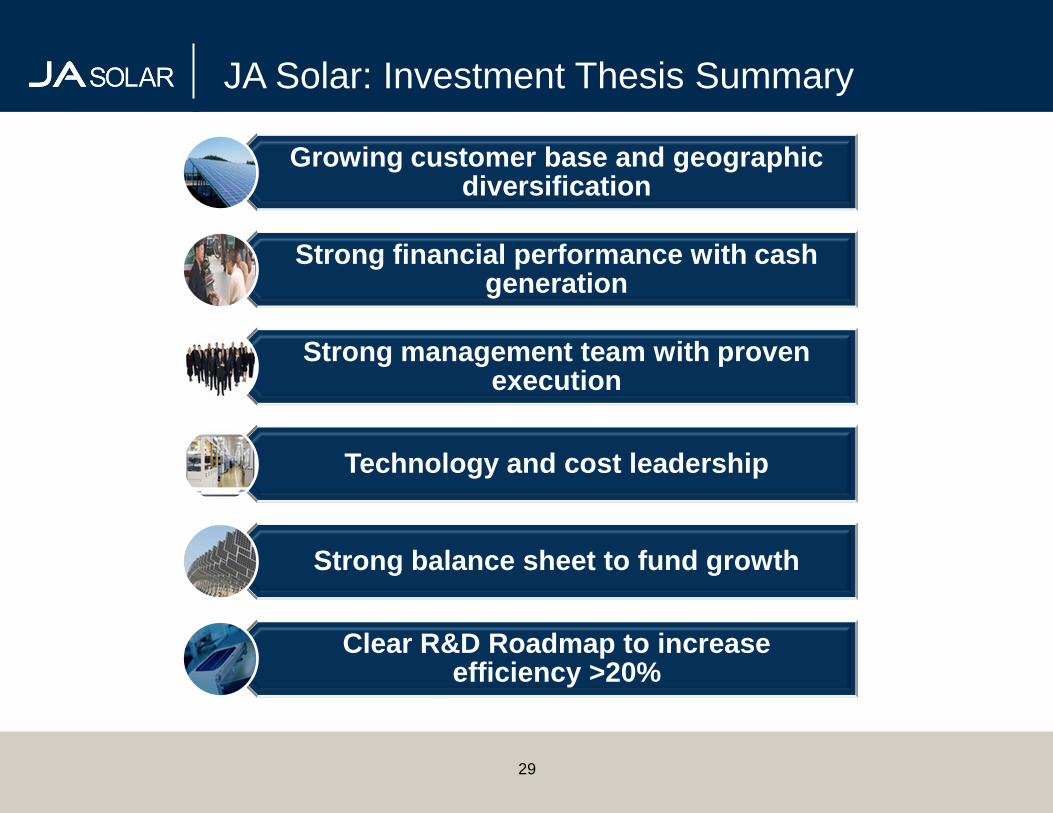
JA Solar: Investment Thesis Summary
Growing customer base and geographic diversification
Strong financial performance with cash generation
Strong management team with proven execution
Technology and cost leadership
Strong balance sheet to fund growth
Clear R&D Roadmap to increase efficiency >20%
29
Thank you!