Embed Size (px)
Citation preview
r I '3055
I I I I I I I I I I I I I
1
I I I I I
, J
(Gll'(ION HI~lorlU
The differences between urban marketing and consumption of vegeta bies versus staple foods
A case study on snap bean consumption and marketing in Bogotá. Colombia
CCoLAU Centro Internacional de Agricultura Tropical
Cali, Colombia
I I I I I I I I I I I I I I I I I I I
THE
-=·--r¡ I¡
, ~ ¡ j ~ ~ ; ~ '1 ' .. ______ ......... L. I
\ ~--------:-:--;-
, DIFFERENCES BETWEEN URBAN MARKETING AND CONSUMPTION
DF VEGETABlES VERSUS STAPlE FODDS •
A case study on snap bean consumption and marketing
in Bogotá, Colombl.
Menna Mulder
M.rch 1988 "'
Centro Internacional de Agricultura Tropical "
Cali. Colombia
I I I I I I I I I I I I I I I I I I I
PREFACE
In the Consultative Group
(eGIARI, there Is Interest fDr
motivations were;
Qn International Agricultural Research
vegetable research since 1974. The
- diet diversification and improvement;
- increasing importance with income growth¡
- income potential for 5m3ll farmers;
- employment far landless labor.
Howev9r! the low data availability has strongly :onstraired balancet
dec.isian making. Ir 1983 the Technical Advisory Committee (TAe) Df the CGL4~:
recommended that CIAT should do a study en the economic potential o~ snap
beans. CIAr already has
improvement of dry beans.
this mandate shouló be
the warld mandate within the CGIAR for the
lAe thDUght it .as useful to understond .hether
extended with the improvement cf snap oeans.
Genetically snap beans and dry beans belong to the 5am2 specie5 !Phaseolus
Vulgaris). The goal became to understand in more detail the importanee of
snap beans~ as well as the factofs that are presently limiting prQd~ction
and consumpticn. As part of the study oi the economlC pctential of snap
beanS 1 CIAT had planned to do a number o; case studies :n diffe~ent
:ountries in the develDping HorId.
I I I I I I I I I I I I I I I I I I I
ACKNDWLED6EMENT5
The opportunity for the executicn of a case study en
marketing and consumption of snap b~ans in Bogotá i5 offered
coordlnator af the snap bean proleet, Dr.Millem Jonssen. Far
the urban
me by the
that ¡ want
first to thank him for giving me that opportunity and for the guidance
received from him. Furthermore I want to thank;
- the Dfficial cadre of CIAl, that permitted me in doing the study here;
- Carlos Adolfo Luna Ganzalez, economist en C1AT, who aIso took part in the
supervision of this study;
- CErORA-Bogotá! who allowed me tD work within their organizat~0n;
- Maria Cristina Vidal Pr~da, Yadira Zamora and ~anny Rocio Esparza, who
ha ve do~e all the inquirías on the household level:
- Jairo Casta~o Gálve:, statistician on CIAT, wha contributed a lot in the
statistical analysis.

I I I I I I I I I I I I I I I I I I I
TABLE OF CONTENTS
ACKNOWLEDGEMENTS
PREFI\CE
TABLE OF CONTENTS
TABlES
A THEORETICAl CONS[DE~ATION OF THE URBAN MARKETING AND CQNSUMPTION
OF VEGETABLES VERSUS STAPlE FODOS
2 THE CAPITAL OF COLOMBIA AS A RESEARCH ARE A
2.1 Characteristics oi the citv
2.2 ConsumptjoD
2.3 Market structure
3 THE DESIGN OF rHE SNAP BEAN CONSUMPTION ANO URBAN MARKETING STUDY
3. t TMe hypotheses
3.2 The methods in the study
SNAP BEAN MARKETING IN BOGOrA
4.1 Wholesale trade
4.2 Neighborhood shops, market places anct mobile markets
4.3 Supermarket chains
4.4 Restaurants
4.5 A final remark
5 CONSUMPTION OF SNAP BEANS IN BOGOTA
5.1 Cnar¿l.cteristics of the househDlds
5.2 Snap bean consumption patterns
5.3 Veget3ble purchasing habbits
1. ::
1 Ü
19
25
28
.29
30
31
I I I I I I I I I I I I I I I I I I I
7
8
9
10
QUALITY OF SNAP BEANS
6.1 Quality examinaticn
6.2 Acceptance of quality defects
6.3 Perishability and losses
PREFERENCES FOR SNAP BEANS
ATTITUDES TOMARDS SNAP BEANS
8.1 Attitude measurement through statements
8.2 Price conception in relation to other attituctes
8.3 Underlying patterns and its relation tD cD1sumption level
EXPLANATION JF SNAP 8EAN CONSUMPTION
9,1 The model for exolaining conSuffiDtion
9.2 The results of the analvsis
SUMMARY AND CDNCLUSIONS
10.1 1Me results in response to the hvpothesES
10.2 !mplications for vegetable marketing and consumption research
10.3 Implications far agricultural food policies
10.4 Implicat~ons tor improvement of snap beans
REFERENCES
SUMi1ARY
~NNEXES
Annex 1: Buying and selling prices on the wh~le5ale market, CDRABASTOS.
Annex 2: Mean consumer prices ~$/kgJ per month of two supermarr.i?t
[hains l 1987.
Anne:{ 3: Purchased quantities of vegetables per head per week (gr,) 1
Bogotá, dec. '87.
Ann.x 4: Total purchased quantities of vegetables per week !kg.),
Bogotá, dec. '87.
Annex 5: Photos of the preference inquiry.
37
39
41
51
5t
58
ó7
S9
74
76
77
78
79
I I I I I I I I I I I I I I I I I I I
TABLES
Table
rabIe ~ ~
TabIe 3
Table 4
Table o
"
Ta.bie L u
:able "
Table B
Table 9
TabIe .¡ ,-:1; l~
TabIe 11
Table 12
Tabl2 (.3
T ah 1 e 14
Table 15
T a~ 1 e 16
Table 17
T a.b 1 e 18
Numoer of snap heao retail traders in Bogotá, dec. '87.
Total number of interviewed traders in the study.
Average costs of "holesale traders in snap beans, Bogotá,
jan. '88.
Characteristics 0+ wnolesale traders, Bogotá, jan. 'B8~
Characteristics of three different types of retail traders,
Bogotá, dec. '87-jan. '88.
Dai1y buying volumes of the different vegetables (kg.) of
three different typas of retail oatlets, Bogotá,
de.:. '87-jan. '88.
Casts, number of personnal and margins of three different
tyP!?S of retail Dutlet':;~ Boqotá~ de-c. '87-ja.n. '88.
Mean qUintitv and mean number oi preparations ~f snap beans
in restaura.nt5~ Bogotá. jan. '88.
Mean Quantities of vegetables that restaurants buy per
week, Bogotá, jan. '88.
Veget3ble outlet choice of restaura.nts, Bogotá, ja.n. 'ea. ~lean ca-st·; Di restaurants, Bogctá, Jan. '·88.
A comparison of five different individual traders on sorne
characteristics! Bogotá, dec. '87-jan. '88.
Ch2.racteristics af the hauseholds 1 B-ogot.á, dec. '87.
Snap bean consumptlon pattet-n-s, Bogotá, dec. '87.
Substit 1Jtes for snap beans (/.-age of consumers, wt10
m~ntior,ed the p(oduct as a ·;ubst~tute) 1 Bogotá, dee. ':37.
P~rchased quantities Di the different vegetables in grams
per capi ta per week! Bogotá, dec.' 87.
Vegetable purchasing habits, Bogotá,dec. '87.
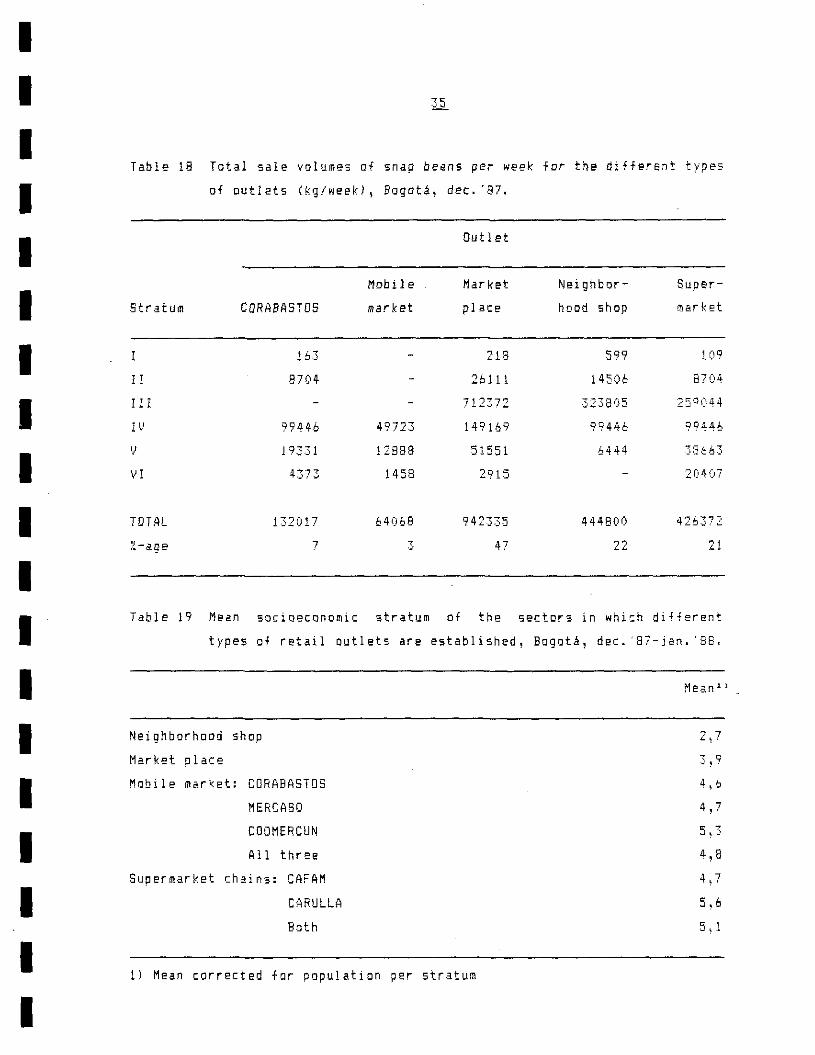
Total sale volumes of snap beans Der week for the different
types of outlets (kg/we-ek), Bogotá, dec. '87.
Tabie 19 Mean socioeconomic stratum af the sectors in which the
different tYP2S of retail outlets are established, Bogotá,
dec. '87-ja.n. '88.
12
lB
20
., t
.-, --:' ." ·-,7 .i... ,~,
26
...:.,.
28
" . . .:, i
34
I I I I I I I I I I I I I
I I I I I
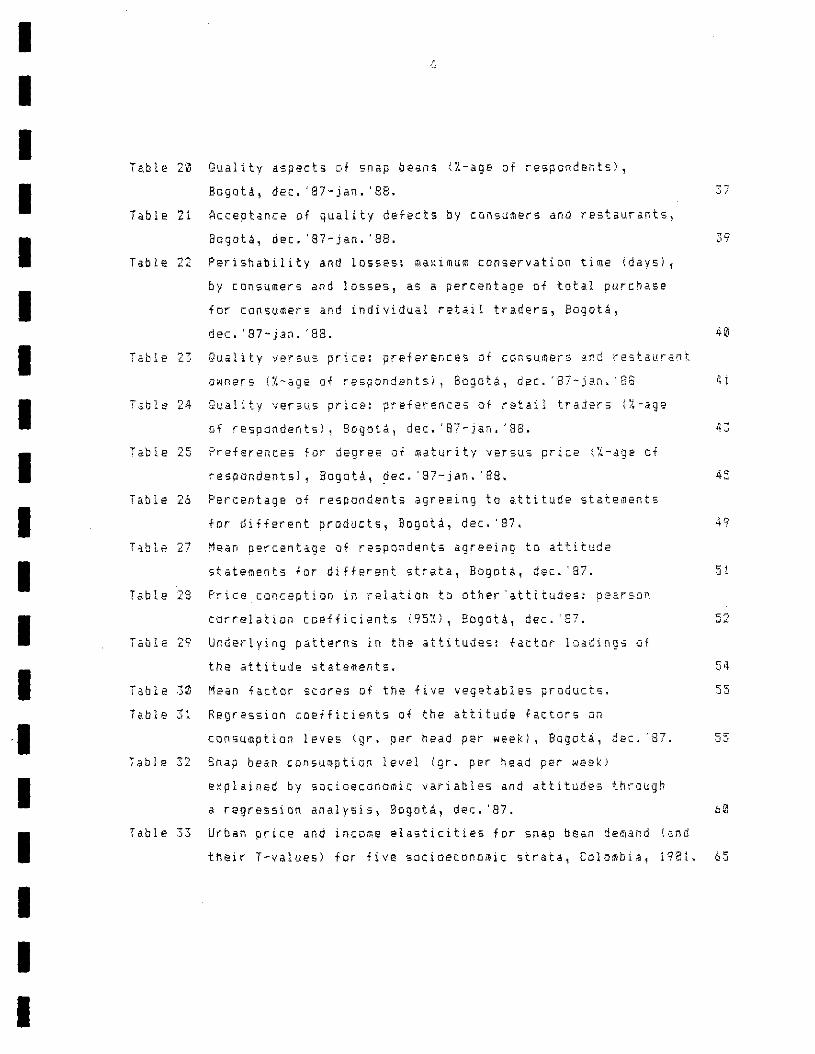
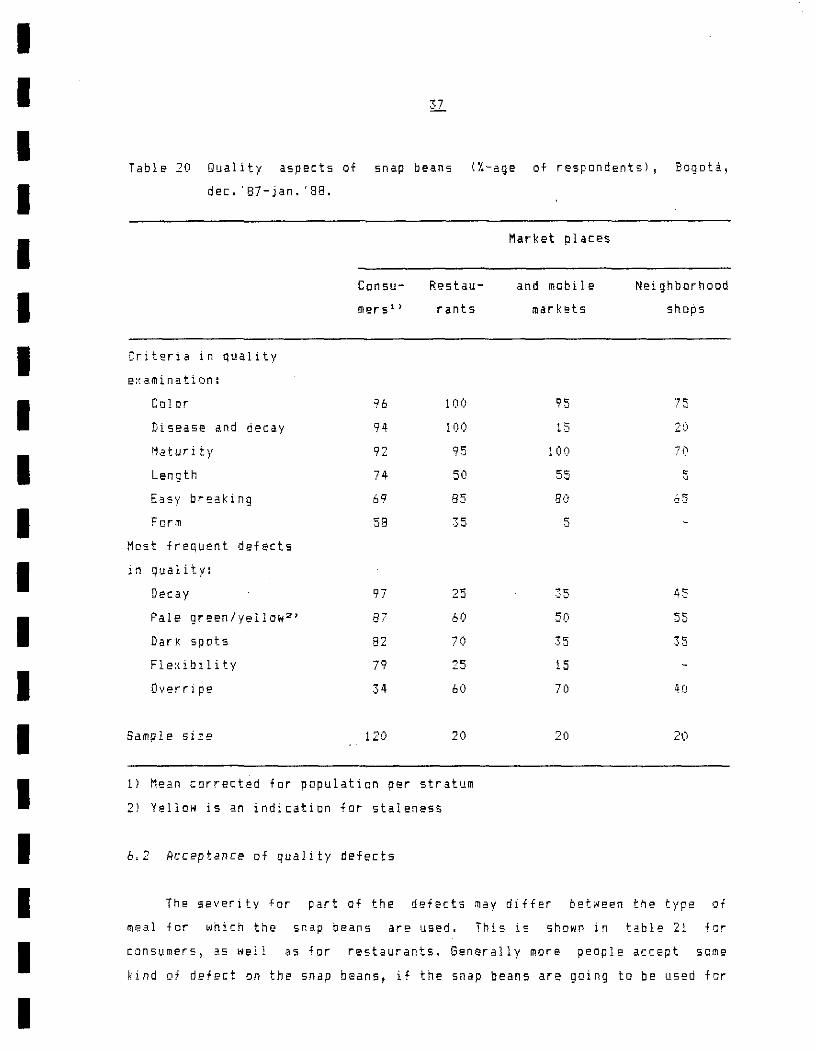
TabIe 20 Quality aspects Df snap beans (X-age of respondents),
Bogotá, dec. '87-jan. '88.
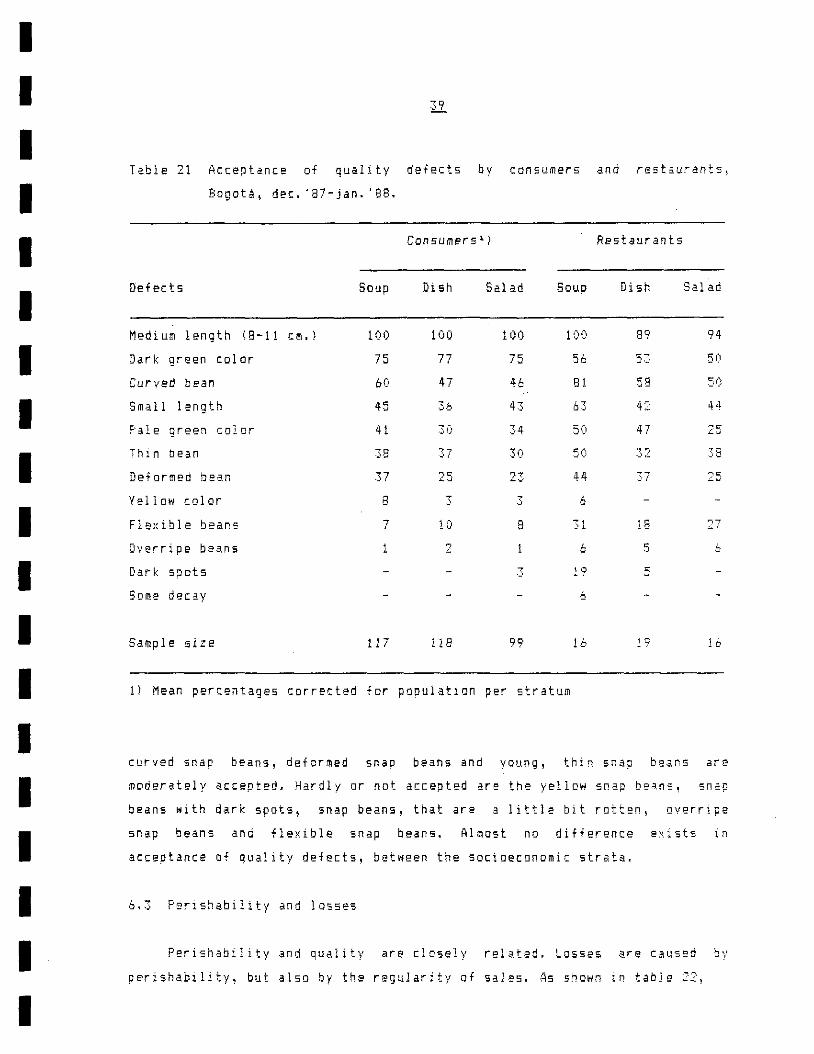
Table 21 Accept¡nce of quality defects by consumero and restaurants,
Bogotá, dec. '87-jan. '88.
Table 22 Períshability and 10552S; mi:1}~imum conservation time (days) 1
by consumers and losses J as a percentage Of total purchase
for consumers and individual retail traders, Bogotá,
dec. '87-jan. '88.
Table 23 Quality versus price: preferences af consumers a~d restaurant
(J¡-I/ners \~I.-age of res¡:¡ondentsi- 1 Bogotá, dec. '87-ja:,rt. '88
T.Jol¿ 24 Qualitv versus ptice: preferences of retail traders (:t-a.ge
of respandents) 1 Bogotá, dec. 'B7-jan. '88.
Table 25 Preferences for degree of maturity versus price (%-age of
respondentsJ 1 Bogotá, ~ec. '87-jan. '88.
Table 26 Percentage of respondents agreeing te attitude statements
for different products, Bogotá, dec. '87.
Table 27 Mean percentage of respondents agreeing to attitude
statements for different strata, Bogotá, dec. '87.
TabIe 28 Price conception in relation to other-attitudes: pear;on
carrelatiDn coefficients (95:{), Bogotá, dec. '87.
Table 29 Underlying patterns in the attitudes: factor loadings of
ra.bie ,30
Table "<1 ·h
7able 32
the attitude statements.
Mean factor scores Df the five vegetables products.
Regression [Q@fficients 0+ the attitude factars Jn
consumption leves (g¡--. pet- head per week) 1 Bogotá, >:12C. '87.
Snap bean consumptian level (gr. per head par week)
explained by socioeconomic variables and attitudes through
a regression analysis, Bogotá, dec. '87.
37
39
4 1
43
-, -D
"
.51
54
Table 33 Urban price and income elasticities for snap bean demand (and
their T-'1alues) for five sacio2conúmic strata, Colombia, 1981.. 65
I I I I I I I I I I I I I I I I I I ·1
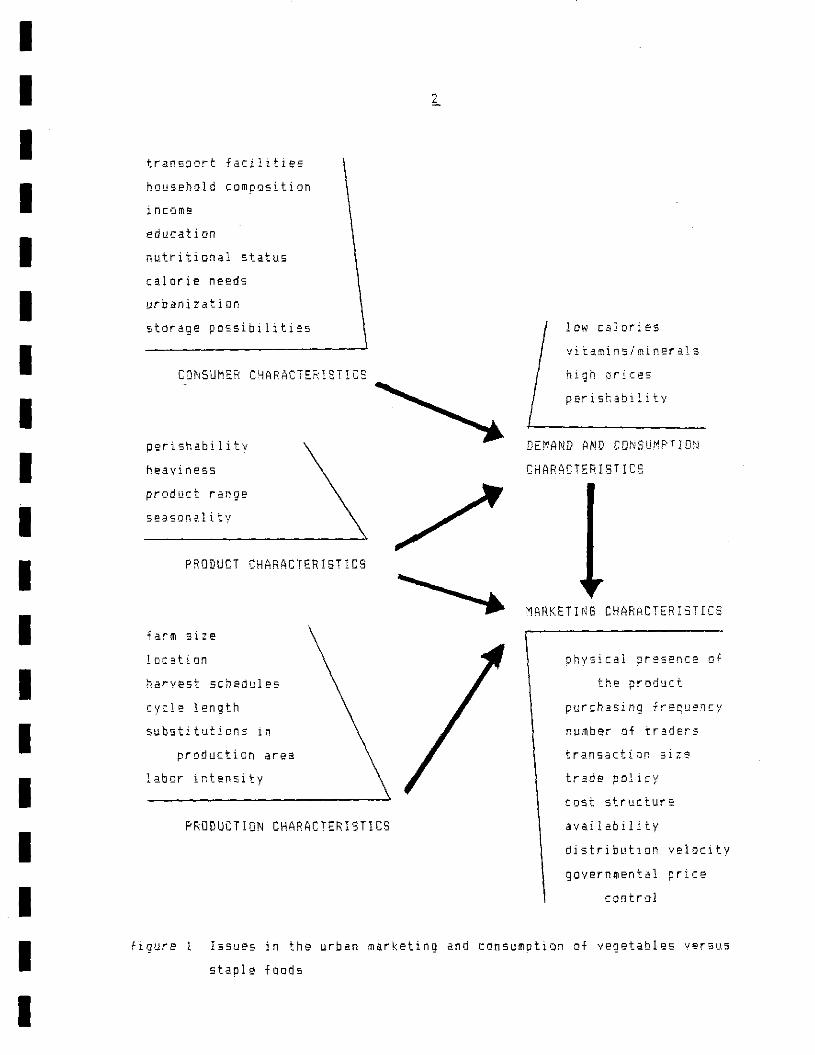
1 A THEORETICAL CONSIDERATION OF THE URBAN MARKETING AND CONSUMPTION OF
VEGETABLES VERSUS STAPLE FODDS
lhe next seherne will be used as a Quide!;ne to describe the issues in
whieh marketing and consumption af vegetables differ fram stlple foods. lhe
consumption and demand characteristics can be seen a5 a result 0+ consumer
characteristics and product characteristics. The marketing and market
.teuctore then Is a result of produet characteristies, praduetion
characteristics and consumption and demand characteristics. Di [ourse this
seheme is a simplifieation of reality, whleh Is much more eomplicated for
its (inter)relations, but it can serve as a guideline te highlight the most
important issues.
Consumer cha~atteristics
lhe most of the developing eountries are eharacterized by a fBst urban
growth, and thus a fast growing demand for toad IFrancois,!9Bl: Forman, ~
Bucklin,1977; FAD,1973), It is recognizeó that with urbanization, foad
habits tend to change, due tD rising incomes, more demand for convenience
gQods\ promotíon of certain fDOds, etc., which can benefit the consumption
Df vegetables·'. However, in the first years af being established in a city,
the place af origin _ill have a esrtain ¡nfluenee Dn the adaptation of the
urban foad habits IDuque,19831.
One of the first needs af eonsumers in foad eonsumption iB for part of
the calarles and proteins. Far a great deal staple fDOds can pravióe those
needs. lf there Is a deficiency of ealories and/or proteins within the
household, than this well first be provided, befDre people will set
themselves to consumption Df vegetables. At all income leve!s, people will
therefore consume staple toads, althaugh consumers in high income strata
1) Data of a natio. wide nutrition survey af DAME DRI in Colombia, analyzed
by CIAT, show for example in the urban sector a higher level of meat and
vegetable consumption, and a lower level of eassava and patato
consumption, than in the rural sector <Duque,1984).
I I I I I I I I I I I I I I I I I I I
transport facilities
household composition
income
educatioll
nutritional status
calorie needs
urbanlzation
storage possibilití~5
CONSUMER CHARACTERISTIC5
perishabilit'f
heaviness
product range
sea:5o!1,~1 i t v
P,ODUCT CHARACTERI8TICS
tarm si;:::e
loc:!.tion
harvest schedules
cyc:le length
substituticns In
production area
labor intensity
PRGDUCTION CHARACTERISTICS
low calDries
vitamins/minerals
high orices
perisrabilitv
DEMAND AND CONSUMPTIDN
CHARACTERISTICS
MARKETING CHARACTERISTICS
ohysical presence of
the product
purchasing freque~[y
number of traders
transaction size
trade policy
tost structure
availability
distribution velocity
governmental price
control
figure Issues in the urban marketing and consumption of vegetables versus
staple foads
I I I I I I I I I I I I I I I I I I I
,il1 'ace more possibllities to replace a certaln part of the staple food
consumption by other products, like meat and vegetables" IPachico,I9871,
Staple foods therefore have low, or sometimes even negative income
elasticities IDuque,1983; Ross,1980; Calcedo,1978; APO,1976l. Vegetables on
the other hand often show high income elasticities (Musgrove,19851.
Staple foods are mostly nearby avaiJable, for eKample,
many neighborhood shops. Vegetables, on the other hand can
in one of the
often on). be
found in more specific outlets, like market places. When consumers face good
transpDrt facilities, then buying frequency, buying quantity and buying
places can easily be adapted to the circumstances, which will particularly
benefit the vegetable consllmption IHarrison,19741.
Educ.lion leve! i. important in the Hay that higher education level.
cften go along with better knowledge Df the ldifferentl nutrients. lhis can
ralse the need for foad that Is rieh in vitamins and minerals. For staple
foad., there will e~ist less influence of the edueation·level (Dewalt,19771.
[f the consumer. hBve enough c.sh to their disposal, than thev can
e.5ily buy big amounts of grains and, although to a lesser extent, tubers,
without fBcing problems with keeping the product fresh. Far vegetables on
the other hand, one must have at least a refrigerator, if he wants to buy
big Bmouot •. But stil1 there exist more limitation on the conservation time
as is the case with staple foods IKaynak,1981; Janssen,19851.
The per eapita consumption of individual foods tends to change
according to age af the housewife. To a Iarge extent this pattern may
reflect the associated differences between the number Df adults and
children, between total househald income and between changing foad patterns
in different generations. According to those differences, the relative
11 In Latin Ameriea, meat forms an important completian of the meal
IFAO,1985; Duque,1984l, while in sorne Asian cDuntries, far e.ample Korea,
vegetables are important products to complete the meals IHan.1969).
I I I I I I I I I I I I I I I I I I I
i
consumption of staple foods versus vegetables can be different (Derry!1985:
Musgrove,1985) ~
Produrt characteristics
One af the first characteristics of vegetable praducts versus staple
foods is that they are much more perishable. Staple foods can be stored foe
quite a long time without decay to any extent 1 ). Vegetables on the Qt~er
~and can hardly be stored at al1 (Torres~1977). Acrordi~g to perishability,
the avail!bility oi veget!bles i5 mere tied fer 52350n, than staple foods
are. [n dssociation with supply, prices of vegetables vary much more than of
staple fOlJds~
Staple foods, as the name already indicates, serve in filling the
stomach. They are characterized by high calarie and protein contents and low
water contents. The contrary is true for most of the vegetables whic~ ~n th2
other hand have high contents of vitamins and mineral s II.N.N., [9671.
Noteworthy 1150 i5 that vegetables enclose a bread range of different
products, while staple foada include only a f~w different
IAPO,1976l.
Consumption and demand chararteristics
products
Due to urbanization and rising intornes, the demand for vegetables grDws
relatively faster than for staple foods. Vegetables are appreciated ior its
taste! vitamins and mineral;, while staole foods are appreciated ior
satisfying hungry feelings I.d giving energy. Stlple foads form for this
reaSQn the base of meals, while vegetables complete them. In accardance with
the different functions of the products, consumption quantities oi
vegetables will in general be lOHer than of staple foods.
1) Most true it is for foad grains, like rice, wheat and maize iC05Cia. j 1980;
APO,1976¡ Lele,1971J. Potatoes are already more perishable !Scott,19B51
and cassave comes very near vegetables (Janssen~1986).
I I I I I I I I I I I I I I I I I I I
Vegetable consumption 15 characterized by high price elasticities
(Musgrave,1985l! which are higher in low incorne strata than in high income
strata. Because prices of vegetables fluctuate fast and between wide ranges,
consumption levels of the individual vegetables alter a lat !Luna,19B7;
Harrison,1974J. lhose alteratians Df conlumption levels are also stimulated
by the broad range of substitutes wlthin the vegetab!e products. lo the
contrary of vegetables, the demand for individual staple fODds is much more
rigid~ due ta lawer price elasti[ities, less price fluctuations~ and less
alternatives in the product range IC05cla,1980; APO,1976J.
In accordance with consumption lev~ls, buying quantities of vegetables
will be lower than of staple foods. But there i5 also anotner constraint on
buying big amounts 0+ vegetables at ane time; that is perishability. 1+ ene
wants to consume a lot of vegetables, than he has te buy more frequently in
s:ead Qf buying big amounts in advance. Thís l .. 'on't benefit the
commodiousness of the
Harri son 11974).
vegetable products (Janssen,i985; l<avnak,1981;
Prodllction characteristics
Although prcduction is not 0+ interest in thi3 case study! it will
brief!y be discussed here, for obtaining ¿ better understanding oi the urban
ffi3rketing characteristics.
Vegetable production is labor intensive! when comparad with staple food
production. A lot of work has to be dDne by hand! while most of the
agricultural work for staple foods can be done by machinery. For this reason
vegetables are af interest for particularly small farrners (Jan5sen~1987). A
result js th.t vegetable production happens to be done by I lot of smal!
farmers. ihis oi9 number of producers,
tranSDort to the consumption area, makes
together with the necessary fast
that ccllection and/or transport
becomes very labor intensive too (Dijken,1988).
Due to perishability\ the marketing channel for vegetabl~s' e::periences
more direct influence of the harvest schedules 0+ the vegetable farmers,
I I I I I I I I I I I I I I I I I I I
than It does with staple foads. Staple loads can alwlys be stored, but
vegetable have direetly to be send to the wholesala market for avoidlng
deterioration.
Vegetables have In general I shorter eyeJe length th.n staple loodl,
Therefore f~rmers have to contact traders more frequently than in the case
01 staole foods, But also farmers 01 vegetables face better opportunltles to
change their prQducts in cultivation. This shift 0+ product is aIso mane
easier by the relatively broad range of alternative vegetabies, while with
staple foads iarmers have hardly any choice in the craps to cultivate.
Vegetables tend to be cultivated near, or ar3und big cittes. ISQ13ted
productian areas "ouid cause tOD much delay in the distribution to the
cities. So traders, if they want, can easy visit their supplle~5! and
farmers on their turn can transport their product to the whalesale market
INestel,¡Q79).
Marketing charatteristics
Because vegetables are highly oerishable, qualitv becomes a risky
element in the transactions. And often there doesn't 2Kist sorne way of
grading of th. product ITilburg,19811, For those reasans the product has to
be physically present durlng the transactloos. TMe personal Quality . .
e~aminatiOMt together with the broad range of products, causes that
wholesale traders tend to specialize themselves on maximum three, or four
dlfferent praducts. This situation won't benefit the retail traders, be:ause
thev have to visit a lot of different wholesale traders to acquire their
products. And because the retail trader ¡lsD has to examine the quality
personalJy, tMe acquisltian 01 the vegetables becomes a highly time
consuming activity, which has to be done very frequently! due te the
perishability al the vegetables. All wholesale traders and a Jot ai retail
traders obtain their products on a daily scheme (Harrison,19741.
The great number of small vegetable farmers around the city have tD
sell their praduct witnin short time limits. A result can be that delivery
I I I I I I I I I I I I I I I I I I I
L
of vegetables to the wholes11e market is done through a Jot Di small trucks.
Together with the frequently visiting retail traders and the relative great
number 0+ wholesale traders! the wholesale market becomes a densely
populated and congested market place, where a lot of small transacticns take
place (Harrisan, 1974).
Another aspect in the vegetable marketing that is different frcm the
staple foad marketing, i5 for part of the strong price fluctuations. This is
mainly caused by an irregular supply. Demand, however, reacts strongly on
changing prices. This situation asks for another trade poliey of t~e trade~s
than in the case 0+ staple foods! ~here they deal with a more inelastic
demand and more stable prices. Their polity concentra~e5 mere on prices and
quantities, while far vegetable traders~ quality becornes an important tool
in their trade polity.
St:iple foad marketing i5 cften ~valuated on i ts degree of
interrelationships with markets in other regians (Lele~t971}. This is hardly
0+ int9rest far vegetable marketing, because distribution Qver 13rge
distances cannot be accepted for the resulting del ay and deterioration,
1he cost structure in the vegetable marketing a150 i5 different fram
the cost structure in the marketing cf staple faods. Most 0+ the staple
foods urdergo some prccessing, like milling, ar dryinq. Furthermore, there
are tests of storage. Transpert costs on the other hand can be lowered down
by looking fer bulky transport, for example by train or bv ship (Scott j 1985;
Coscia,1980; AP011976; Sorenson~1975.; Lele,197U, Vegetables Qn the contrary
have to be transported directly and fast, which in mnst of the cases will
signify transpart by car <Tilburg,198J). AnQther cost factar in 'I<!get,ble
trade is for part of the many small transactians, which .re highly time
consuming and iovolve a lDt of traders, of whom each of them has tD earn a
living out of it. Losses also will be a CDst factor of more impcrtance than
in trade of staple foods. But on the other hand! there are no tDstS of
storage, processing,nor grading (Janssen,1985; Forero,1983; Bromley,1981;
Harrison,197 4 ) •

I I I I I I I I I I I I I I I I I I I
To realize a fast
interest te make sorne
distribution of the vegetables,
vertical coordination in the
it is quite of
marketing [hannel
IJanssen,1985; Forman, ? 1, Wholesale tradera in Latin Amarlca, for e~amp¡e,
go to tha production area to buy
the wholesale marketplace for
the product there, in stead of waiting on
what will arrive. As Harrison remarked,
vegetable traders becOme active buyers, in stead of active
(Harrison,1974I,
sellers
Staple food prices are often controlled by the government 1 for
protecting farmer prices and/or consumer prices. Vegetable pric2s on the
other hand are almost never regulated by the government. The first re3san 15
that the product isn't of much importance to the national product, ii
comoared to other products, and the second reason is that tMe taols~ which
are used for controlling staple feod prices are not, Of hardly useful fcr
vegetables 1 ).
Conclusive remar k
Research of ccnsumption and urban marketing 0+ vegetables has te deal
with a lot of difierent issues, than the same kind of research ter stapie
foodsa In vegetable research sorne important issues are; quality and
perishabilitYl the importance of a fast distribution, degree of vertical
coordination or integration, the high income and price elasticities oi
demand and ~trDng fluctuaticns of supply and prices. Staple food research on
the other hand deals for eKample with; intermarket relatians between
regions, effective storage of the product and pcssible speculation by means
of storage f processing (costs) \ imports and government price policy. What
1) Sorne traditianal tools in pricE policias have been; reguliticn of the
import/expcrt Qf the target prDduct; management of buffer stocks; fi!ed
prices, threshold prices! or fi~ed price ranges; fair price distributicn;
rational distribution of surplus aredS to deficit afeas; erice 5uppcrt
by subsidies; government Durchase at guaranteed
(Pinstrup-Pndersen,1985; Cosciaj1980; APO,1976; Sorenson,1975;
Lele,1971),
I I I I I I I I I I I I I I I I I I I
9
also follows from aboye mentioned differences is that information about
consumption levels, prices! product flow. etc. of vegetables are highly tied
te the moment of data collection. Production prices vary enormous (annex 1),
much more th.n in the case of staple foad •• Together wlth tb! high orice
elasticjty of demand, th! consumption of v!getables Is far froro steady in
time.
I I I I I I I I I I I I I I I I I I I
L THE CAPITAL OF COLOMBIA AS A RESEARCH AREA
2.1 Characteristics of the city
Bogotá i5 a medium-sized metropolis, with almost four mil1ion
inhabitants in the year 1985", and a population growth of 3,41 (DAPD,1986).
It shows the same kind of organizational problems as often seen in fast
growing cities in Latín American countries; such as shortage of suítable
housing for Eyerybody, low level of maintenancE\ slow improvements te the
infrastructure and being ir arrear with the prDvision Df public services 1
(water supplv, electricity and telephone cannection~ sewerage 1 ard r2f~se
collection). Mean incorne in Bogotá, compared to other urban areas in Ldtin
America, is around the average. As a whcle j Bogotá can be seen as a
representative urban area for Latín American countries. Because
urbanizatiDn, gross domestic prcduct and per capita ~ood su~ply are
significantly higher in Latin America than in Asia cr Afric6,
generalizations autside Latín Amerita have to be made ~ith [are
(Pachico, 1987).
Bogotá was [hosen for the study partly fer its representativeness and
also becduse an impDrtant production area of snap beans exists around the
city. Thu5 product flow up to consumers can be more easily ffionitored.
2.2 Consumption
The cultivation of different crops is tn a greater or lower extent
lirked to climatic conditions. Climate, however, varies a lot far the
different departments Qf Colombia. This means that consumption of,
pariicularly, vegetables , which cannot be transported ov~r large distances
because of perishability! is alsQ tied to those climate differences. The
most important vegetables in Bogotá are snap beans~ tomatoes, carrats i fresh
peas and onions~
1) 50urce: Colombia Censo '85, Vol l! julio de 1986, XV Censo Nacional ds
población y IV de vivienda.

I I I I I I I I I I I I I I I I I I I
Snap beans are mainly consumed in lunches and to a lesser ~~tent in
dinners. It is common for the people in Bogotá to take lunches and someti~es
dinners outside the house, in c~feteria5 or restaurants. The most ccmmon
form of preparation is to add cooked, sliced snap beans to a vegetable SGUp~
together with many other vegetables (see Ch. 5.2), but only a few spoonfuls
of sliced snap beans are added tD one, or two liters.Snap beans are alsD
very commonly prepared in a dish, together with rice, a piece of maat, a
patato and a fried plantain. For the dish, snap beans are sli~ed into little
pieces, cooked and mixed with milk, flour, butter and sometimes an eg9.
Sometimes vegetables are mixed together, for eKample, 5nap beans! carrots.
peppers, and peas. Other times snap beans are mixed with pieces of chicken
meato A third~ but lESS Common way to use snap beans i~ consumption~ is in
salads. The base for a salad are onions and tomatoes. Te thESE vegetables!
other vegetables can be added like l red beets j cabbage~ snap beans, carrots
and fresh peas. When salads are prepared, they largely replace the cooked
hot vegetables in the dish.
¿.~ Market structure
R~t~il marketinc
There are several outlets, where snap beans can be obtained. Th~re are
the market places, neighborhood 5hops~ supermarkets and mobile markets. Also
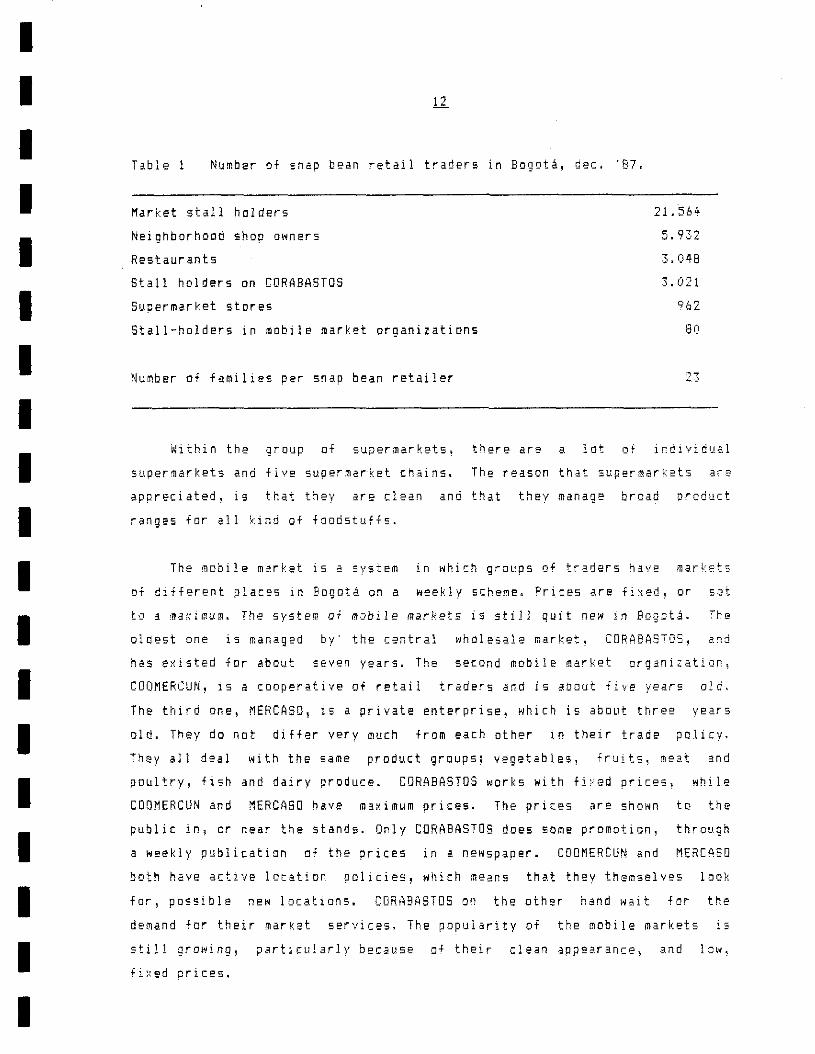
restaurants can be seen is a form of retail trade. TabIe 1 ShONS the tot31
number of each type of retail trader~ according to estimations trom this
st~dy.
Market places and neighborhood shops are the twa traditional rstail
outlets. Neighborhood shops have very limited ffiarket areas, for which it ~~
difficult for them to manage more than a 5m3ll, restricted assortment of the
majar selling veget.bles. Their popularity COmes from the flet th.t they are
nearby. Market places, on the other hand, are more speciajized in
perishables and serve big market areas. They are popular for their extended
product ranges within the perishables, and for their low prices
(Harrison,19741.
I I I I I I I I I I I I I I I I I I I
T~ble 1 Number of snap bean retail traders in Bogotá, dec. '87.
Market stall holders
Neighbarhaad shop a.ners
Restaurants
Stal! holders on CORABASTOS
Supermarket stores
Stall-ha!ders in mobile market arganizations
Number 0+ families per snap bean retailer
21.564
5.932
3.048
3.021
962
80
23
Within the group of supermarkets! there are a lot of indIvidual
supermarkets and five supermar-ket chains. The reason that supermarkets are
appreciated, i5 that they are clean and that they manage broad oroduct
ranges far al1 kind of foodstuffs.
The mobile market i5 a system in which gro~ps of traders have markets
Di different places in Bo~otá on a weekly scheme. Prices are fixed! or 52t
to a maximum. TMe system oi mobile markets is stil1 quit ne~ in BOgDt~~ The
olOest one is managed by' the central wholesale market, CORABASTOS, a~j
has existed for about seven years. The second mobile market organi:ation\
COOMERCUN, is a cooperative of retail traders and is about fíve years old,
The third one, MERCASO, is a private enterprise, which is about three years
old. TMey do not dillee very much Irom each other in thaie trade polie,.
They all deal with the same product groups; vegetables, frutt;, meat and
poultey, li5h and daiey produce. CDRABASTOS works with lioad priees, while
COOMERCUN and MERCASO have ma,imum oriees. The priees are sho,n to iha
publlc in, De near ihe stands. Only CORASASTOS does sorne promation, through
a "eekly publication o' iha prices in a ne.spaper. CODMERCUN and MERCASD
bcth have active location policies, which means that they themselves look
far, posslble ne" locatlons. CORABRSTOS on the ather hand ,ait for th.
demand for their market services. The popularity of the mobtle markets i3
stil1 growing, particularly because of their clean appearance, and low,
fixed prices.

I I I I I I I I I I I I I I I I I I I
Wholesale marketing
Most 0+ the retallers buy their snap beans in the central whoJesale
market, CORABASTOS, whlch has now been in existenee for some 18 years.
CORABASTOS is lacated on the outskirts of the city, where sorne 140 .hoJesale
traders operate for snap beans.
The supermarket chains, on the other hand, do not cbtain their
vegetables via CORABASTOS. Sorne have their Qwn providing channel~ that
starts in the surrounding production area, and sorne are supplied by prívate
enterprises, which specialize in fruit and vegetable provision. The
supermarket chains keep CORABASTOS in reserve for when their own supply
is ir,sufficient.

I I I I I I I I I I I I I I I I I I I
3 THE DESI6N OF THE SNAP SEAN CONSU~PTION AND URBAN ~ARKETIN6 RESEARCH
In chapter 1, th~ different issues regarding vegetables versus staple
foods have been d~scribed. The consequent hypothesEs, which are mentioned
below, were part of the research.
3.1 The hypetheses
One af the flrst necessjtjes of food js te fill the sto._eh _ró te glve
energy! which can be fulfilled by the consumption of staple foods,
Vegetables~ however, are appreciated fer taste, vitamins and minerals.
1. Thus, cansumption oi vegetables/snap heans per capita will be lo~er In
the low socioeconomic strata, i$ compared with consumption of
vegetables/snap beans in the higher strata.
2, The vegetahles consumed in the lew sDcioeconomic strata will mainly be
the "heavier D vegetables, like dry and fresh peas, dry and fresh bears¡
"haba verde" (a type of a broad bean), carrcts and I!ahuyama:! (actually a
fruit)~ The vegetable consumption in the higher strata will, to a large
extent~ be compased of more '!watery'l products, like spinach¡ lettuce j
cucumber~ and to a lesser extent. snap beans.
3~ In the lawer sQcioec~nQmic strata consurners will pr9fer mature snap
beans to thin snap beans, while the consumers of the higher 5tra~a
will do the opposite.
In the low socioeconomic strata, ronsumers prefer low prires to
quality, while the consumers in the high strata put quality abeve law
prices, This means that people from the low strata wilI buy prcducts of
lo"er qua1ity, If they are cheaper.
4. Far this relson, snap beans af lo. quality wll1 finó a bette~ entrance to
consume~s in low socioeconomic strata, than in the high socioeconomic
strata, if they are put on a lcwer price_
5. New varieties of snap beans, or snap beans with new, different
characteristics! will be accepted first in the 10M sDcioeccnomic strata!
if the price is put below the price of the common variety.

I I I I I I I I I I I I I I I I I I I
Perishability is dO important characteristic of vegetables! ano depends
stronqly on the quality of the produd. Because people 0+ the ION
sociaeconom.ic strata buy more vegetables ot lower quality, they wi 11 haya
oi gger problems keeping their vegetanles fresh for 10nger ti me.
6.
7
This _ill result in bigger losses of vegetables in t he low
sociaeconomic strata.
To economize on time, fuel and maybe also en food! people of the low
sDcioeconomic strata will prepare their faod/snap beans far mere than 1
meal at a time. People of the high socioeconomic strata, sn the cthef
hano, will prepare ¿ nl?w meal each time.
9. The e~planation of consumption levels 0+ vegetables/snap beans in the
10(1-1 so:ioeconomic strata depend heavily on 50ciaeconomic fa~tQrs!
i.e. household expenditures, family size, education level of the
housekeeper, mean age af the household,
costs far buying the vegetables and the
age of the housewife! transport
sDcioeconDmic stratum. In the
high sorioeconomic strata, consumption levels of vegetables!sn~p be2ns
is influenced to a greater extent by attitude.
Because consumption Df vegetables in lo~ socioeconomic strata is lower
than 1n high sOtioeconomic strata, the total sales will also be 1e55.
For this reason, fewer traders will be attracted to areas of ION
SOCloeconomlC strata (and this will result in 3 lower availability ~~
vegetables in those sectofs), and/or traders will have smaller sales In
sgctors of low socioeccnamic strata.
Consumers froID the ION socioeconomic strata prefer to buy cMeap
vegetables te vegetables 0+ gcod quality, while consumers from the high
socioeconomic str3ta do the opposite.
LO. The result is that the former buy in cheaper outlets, like market
places, the Iatter buy i. n more e:<pensi ve D'ltlets, 1 i k e
5upermarkets.

I I I I I I I I I I I I I I I I I I I
Quality is strongly related to perishability and i5 therefore an
impartant rlsk factor In buylng a"d selllng tra"saetlons.
1t. Fa. thls reason only a few traders .111 dare to manage Jow prlees at the
eopense of good quality. Thls wil1 also deerease the Ivailability of
affordable vegetables/snap ceans in the poorer areas.
Risk increases acearding to the degree oi specializatiDn in the
assortment in a certain link in the market channel
whalesale marketl.
Ifor example the
12. Because of the higher risks, there will be a lo~er degree of free entry.
13. According tD the higher risks, one will 3150 find higher margins between
buying and sel1ing prices.
As said in chapter 2, consumption also take place in a lot of
restaurants. In the campetitian between heme consumption and r~staurants.
and within restaurants prices form an important tool.
14. To offer cheap meals, restaurants will be less sxigent on the quality 0+ sn3p beans than housewives.
15. AlsD thev wi11 offer smaller portions of snap beans than is done in
house consumption.
3.2 The methads in the study
Consumption
The_ information about consumption was abtained thraugh inquiries at 1?0
households. The households were visíted ~t random,having stratified by.
selecting neighborhoods with different living standards. Si. levels of
living standards were distínguished (DAPD,1986). Four neighborhoods were
seleeted at e.eh level of living standard and in eaeh neighborhood, five
households were visited.
I I I I I I I I I I I I I I I I I I I
11..
The inquiry included among other things; questions about quality. in
which the respondent had te choose between given answers; recal] ouestions
about consumption, buying quantities and product losses, with a períod of
one week (Raj,1972); .and apen questions on expendit'lres, educatiD!i level and
other sociaeconomic iactDrs.
The inquiry also included a new, rapid, ine~pensive survey rnethod to
obtain information about preferentes, using photos that were shown te the
respondents. Each photo showed two or three different snap beans with
different prices so that a snap bean of the common type, good quality and a
iixed price of $60,00 per half kilo had to be compared with a sna~ bean of
different quality, or with new characteristics and with a price of $50,so
per half kilo!', The respondent was dsked which one they would buy, if t~ey
were to find those two, or three different snap beans at the ~arket place~
5upermarket, or neighborhood shop at prices , shown on the photo. In annex V
$ome of the pnctos are shown~
Marketing
As shown in chapter 2, there are several channels for snap beans in
urban marketing. At the retail level~ visits were made 3t neighborhood
ShOp5~ public market places, mobile markets and supermarkets. Restaurants
can alSD be seen as part of retail trading. The total number of visited
retail traders fi}!?re 60 (table 2). The neighborhoQd shQP$ io this study carne
from the Sdffi€ neighborhoods that were sel~[t~d for tbe consumption
inquiries. There W3S no snap in four of those neighbúrhoods! so tne t~t31
number became 20. The market pIaces that were visited [ame from a list si
public market places, managed by EDIS (Empresa Distrital de Servicios
Publicos). No more than one market stall-holder per market place was
interviewed. The interviews with the mDbile market traders tock place within
all the three operating organizaticns~ The restaurants that were visited~
were selected so that they were from al1 areas of Bogotá! with sorne
concentrations in commertial and industrial areas.
1) At the time of tne study, u.s.r 1.00 was about Col.! 265.00.
I I I I I I I I I I I I I I I I I I I
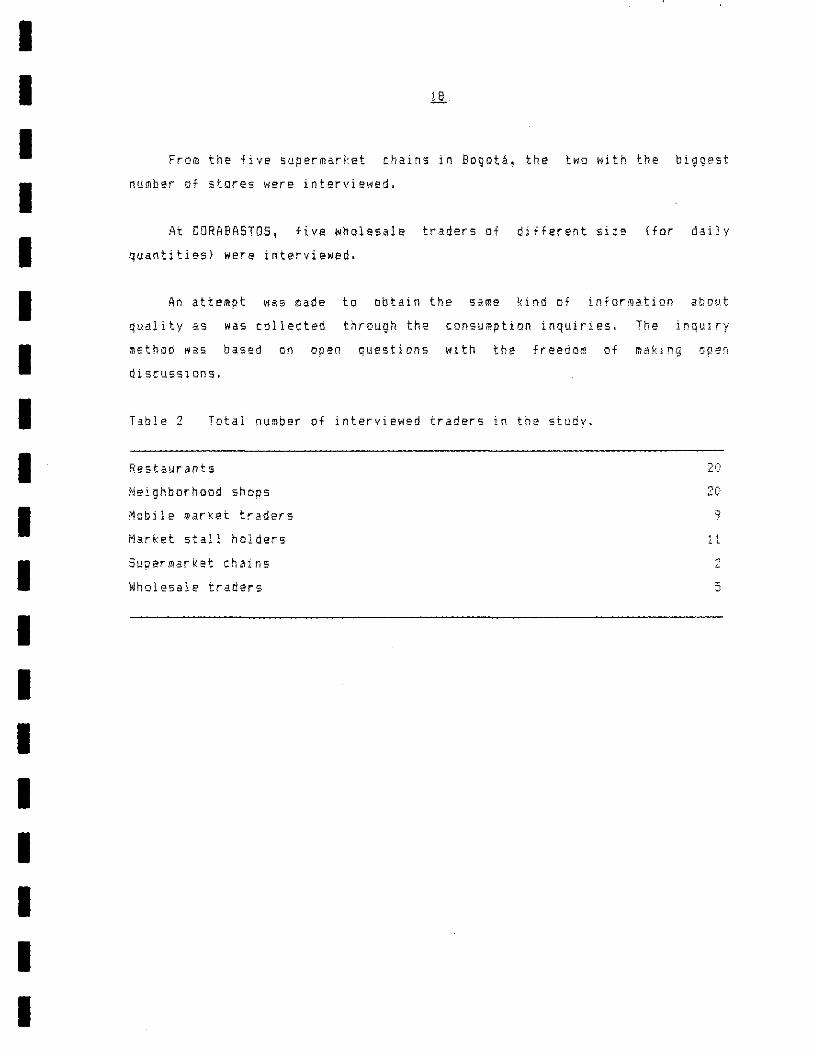
From the five supermarket chains in Bogotá~ the two with the biggest
number of stores were interviewed.
At CDRABASTOS, five wholes.le traders Df diflerent size {for dai!y
quantities} were interviewed.
An attempt was made to obtain the same ~ind of infarmation about
quality as was collected through the consumptian inquiries. The inqulry
method was based on open questions with the freedom of making ope~
discusslons.
TabIe 2 Total number of interviewed traders in the study.
Restaurants
NeighborhoDd shops
Mobjle market traders
Market stall holders
Supermarket chains
Wholesale traders
20
20
9
1 1
2
5
I I I I I I I I I I I I I I I I I I I
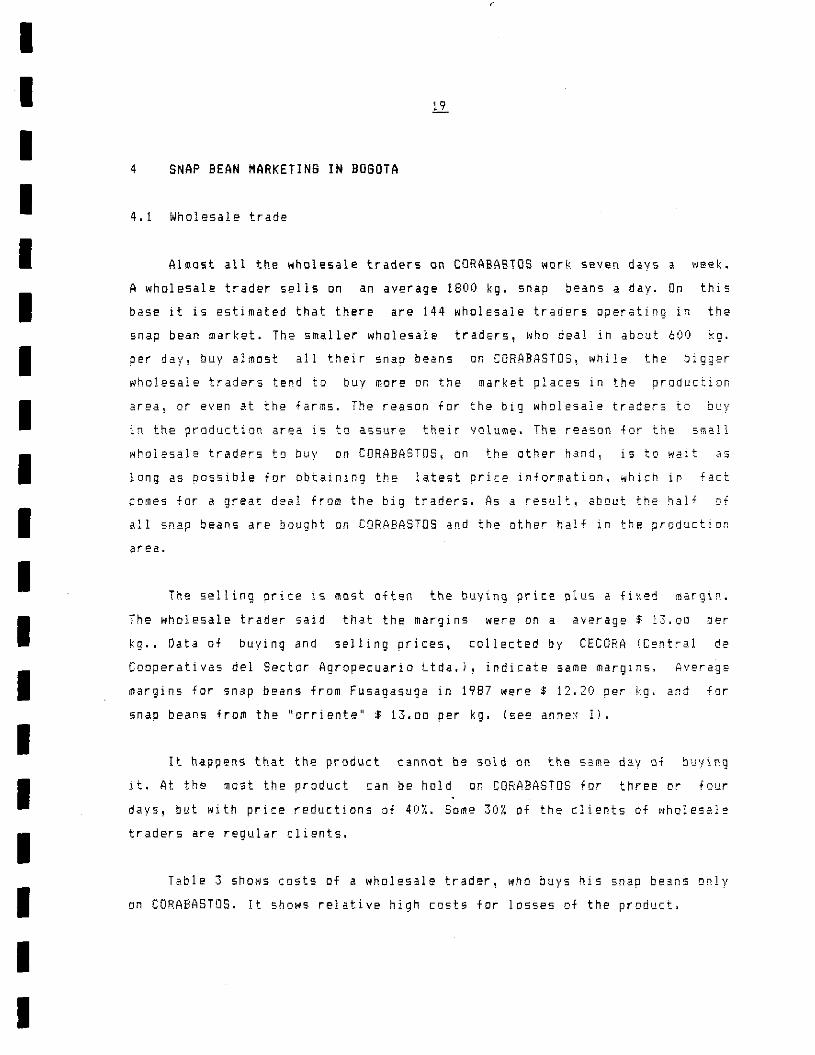
4 SNAP SEAN MARKETING IN BOBOTA
4.1 Wholesale trade
Almast all the wholesale traders an CORABASIGS work seven days. week.
A wholesale trader sel!s on an average 1800 kg. snap beans a day. On this
base it is estimated that there are 144 wholesale traders operating in the
snap bean market. The smaller wholesale traders, wha deal in about 600 kg.
per day, buy almost all their snap beans on CORABASTOS, while the bigger
wholesale traders tend te buy more on the market places in the production
afea, or even at the farms. The reason for the big wholesale traders to ni' v - - l
in the praductian area 15 to assure their volume. The reason for the small
wholesale traders to buy on CORABASTOS\ on the other hand, i5 to wait as
long as possible far obtaining the latest price information. which in fact
comes for a great deal from the big traders. As a resulto about the half cf
all snap beans are bought on CORABASTOS and the other half in the production
The selling price is most often the buying price olus a fixed margino
The wholesale trader said that the margins were on a average $ 13.00 per
kg .• Data 01 buying and selling oriees. eollected by CECORA ICentra! de
Cooperativas del Sector Agropecuario Ltda.), indicate same marglns. Average
margins for snap beans frorn Fusagasuga in 1987 were $ 12.20 per kg. ano for
snap beans from the Horriente ll $ 13.00 per kg. (see anne;.: 1).
It happens that the product cannot be sold on the same day oi buying
it. At the most the praduct can be ho!d on CORABASTOS for three or four
days, but with price reductions of 40X. Sorne 30% of the clients of wholesal~
traders are regular clients.
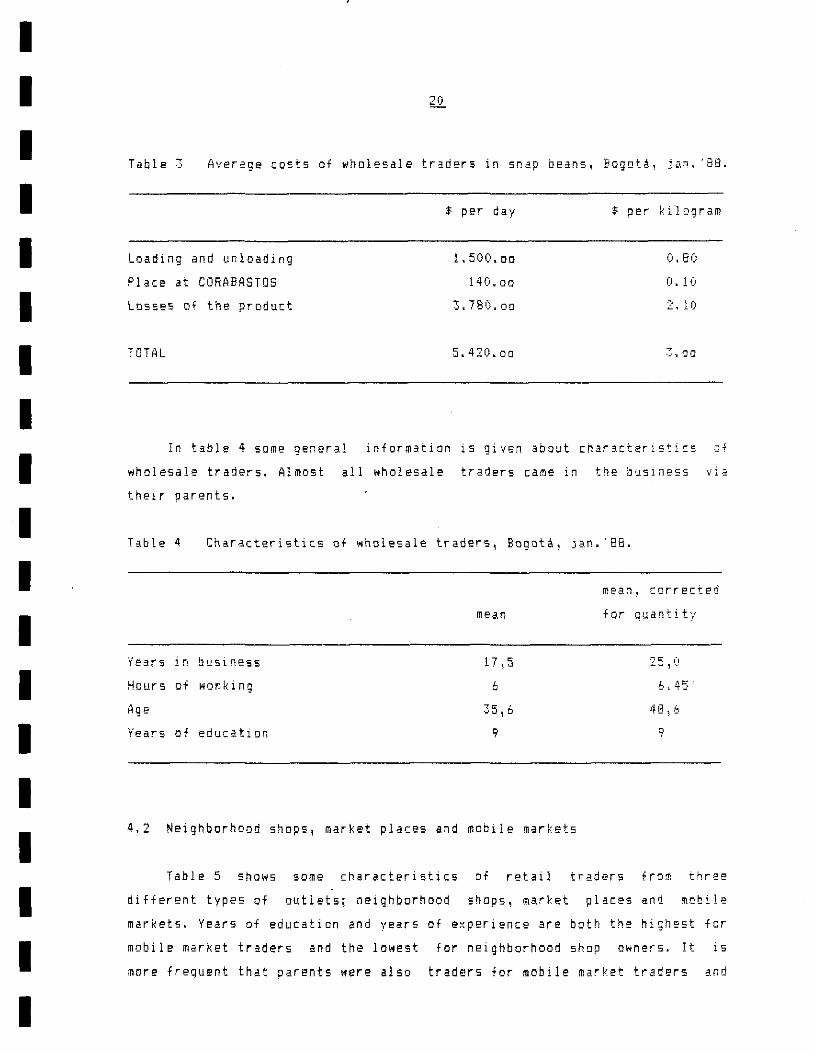
Table 3 ShOW5 tosts of a wholesale trader, who buys his snap be~n5 only
on CORABASTOS. lt shows relative high costs far 10s5es of the producto
I I I I I I I I I I I I I I I I I I I
"
Table 'o Average cests of wholesale traders in snap beans, Bogotá, jan. '88.
Loading and unloading
Place at CORABASTOS
Losses of the product
TOTAL
$ per day
1.500.00
140.00
3.780,00
5.420.00
$ per ki"lDgram
0.80
(l. 1 (J
2, 11)
In table 4 sorne general infarmation is given about characterlstics Jf
wholesale traders. Almost a11 whol~sale traders carne in the business via
their oarents.
Table 4 Characteristics of wholesale traders, Bogotá, jan. 'BS.
Years In business
Hours of "Orklng
Ag e
Years of education
mean
17,5
6
35,6
9
4.2 Neighborhood shops, market pIaces and mobile markets
mean, corree! ed
far qlJantity
6.45"
9
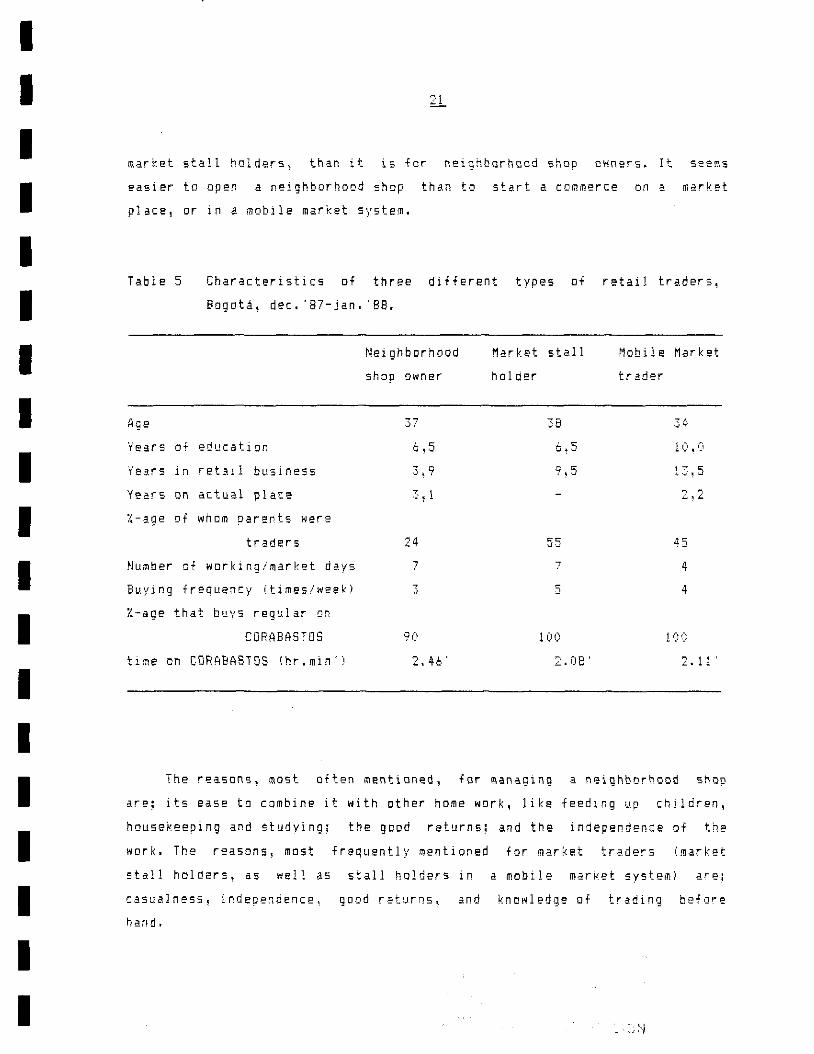
Table 5 shaws sorne characteristics of retail traders from three
different types of outlets; neighborhood shops, market pIares and mobile
markets. Years of education and years of experience are both the highest for
mobile market traders and the lowest for neighborhood shop Qwners. It is
more frequent that parents were also traders fer mobile market traders and
I I I I I I I I I I I I I I I I I I I
market stall halders, than it is for neighbarhcod shop QWners. It seems
easier to open a neighborhood shop than to start a commerce on a market
placE. or in a mobile market system.
Tab 1 e 5 Characteristics of three different types of retail traders,
Bogotá, dec. 'SI-jan. '88.
Age
Years of education
Years in retail business
Years on actual place
%-age of whom parents were
traders
Number 0+ working!market days
Buying frequency (times/week)
X-age that buys regular on
CORABASTOS
tI me on CDRABASTDS (hr. mi n')
NeighbDrhood
shop Dwner
37
6,5
24
7
3
90
2.46'
Market stall
holder
38
55
7
5
100
2.08'
t10bile Market
trader
34
10. (i
45
4
4
100
2. 11 '
The reasans, ffiQst often mentianed, for managing a neighborhood shop
are; its ease to combine it with Dther hame work, like feeding up children,
housekeeping and studying; the good returns; and the independence of the
work. The reasons, most frequently mentioned for market traders (market
=tall hold2rs~ as well as stall holders in a mobile market systemi dre;
casualness, independence, good returns~ and knowledge of trading befare
hand.
I I I I I I I I I I I I I I I I I I I
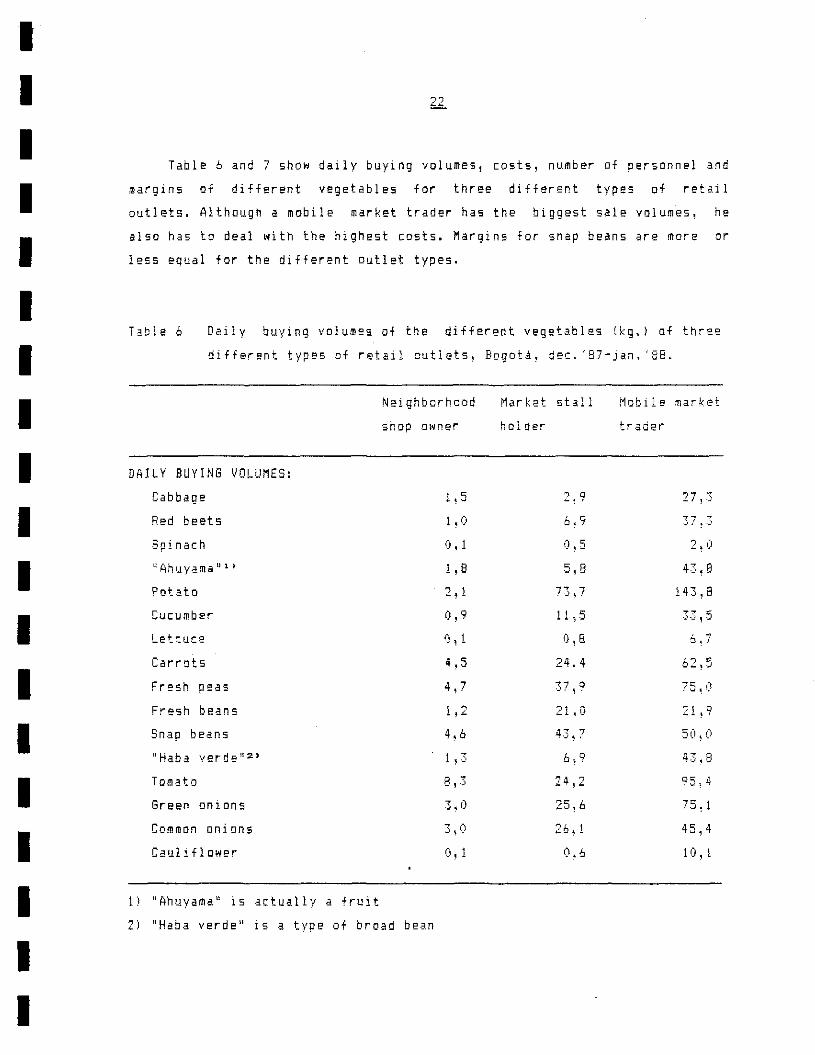
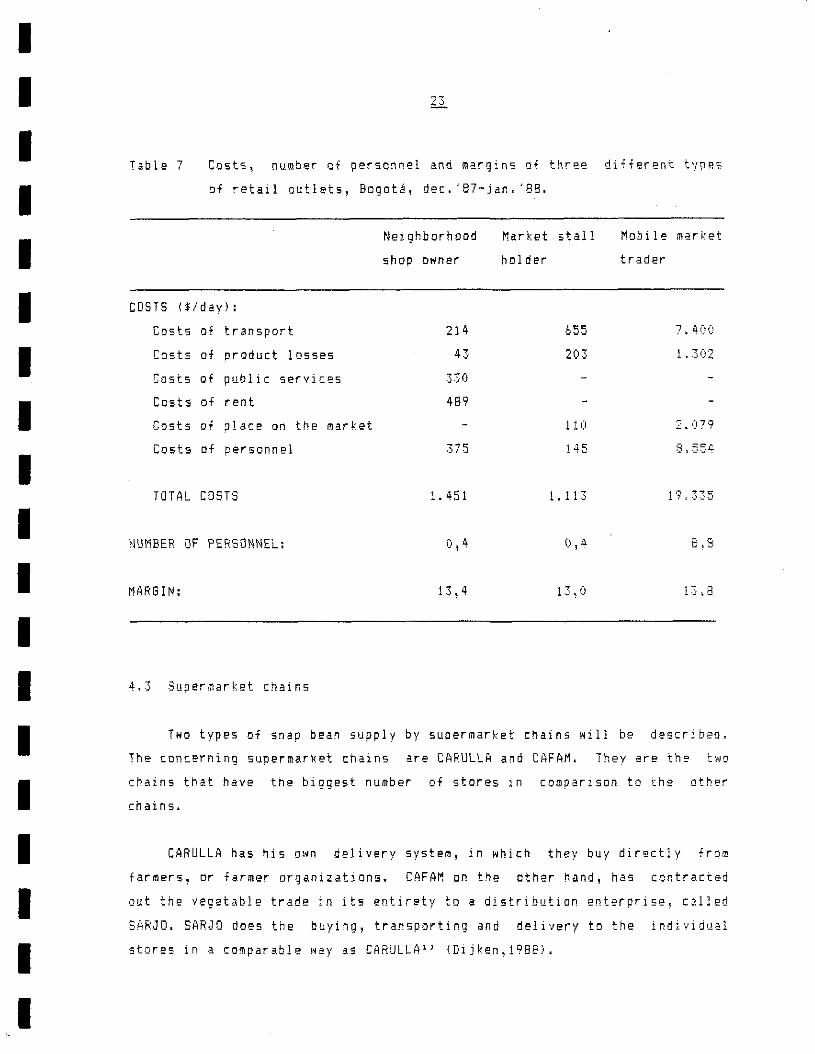
Table 6 and 7 show daily buying valumes, costs, number of personnel a"d
margins 01 different vegetables for three different types of retail
outlets. Although a mobile market trader has the biggest sale volumes, he
also has to deal with the highest costs. Margino for snap beans are more or
less equal for the different Dutlet types.
Table 6 Daily buying volumes of the different vegetables (kg~) Qf thr2e
different types of retail outlets, Bogotá, de!:. '87-jan, '88,
DA1LY BUY1NG VOLUMES:
Cabbage
Red beets
Spinach
¡¡ Ahuyama u 1 ~
Pot at a
Cucumber
Lettllce
Carrots
Fresh peas
Fresh beans
Snap beans
IlHaba verd e l!2'
Tomato
Green onions
eoroman onions
Caul j fl ower
1) "Ahuyama\' is actually a fruit
Neighborhood
shop owner
1,5
1, (1
(1.1
1,8
0,9
4,7
1,2
4,6
1,3
8,3
1), 1
2) uHaba verde!' is a type of broad bean
Market stall
holder
6,9
0,5
5,8
73,7
11 ,5
0,8
24.4
21,0
4.},7
24,2
26,1
¡1ob i 1 e market
trader
27, .3
43,8
143,8
.).j,5
62,5
75~i)
: 1 ,9
.50! O
95.4
75,1
45,4
1 O , 1
I I I I I I I I I I I I I I I I I I I
Table 7 CQsts~ number af personnel and margins Qf three different types
oi retail outlets, Bogotá, dee. '87-jan. '88.
COSTS (.Idav) :
Costs Di transport
Costs oi oroduet losses
Costs oi publie serví ces
Costs oi rent
Costs Di place on the market
Gosts oi personnel
TOTAL C05T3
NUMBER OF PERSONNEL:
MAHGIN:
4.3 Suoermarket chains
Neighborhood
shap owner
214
43
330
489
375
1. 451
13,4
Market stall
holder
655
203
11 i)
145
1. 113
Mobile mar-ket
trader
7.400
1.302
2.ü79
8,554
19·,335
8.8
13 .. 8
T.o types of snap bean supplv by supermarket chalns .111 be descr,bed.
The concerning supermarket chalns are CARULLA and CAFAM. Thev are the too
chains that have the biggest number of stores in comparison to the other
chains.
CARULLA has hls own dell"erv svstem, in which they buy dlrectly from
farmers, or farmer organizations. CAFAM on the oth~r hand, has ccntracted
out the vegetable trade in its entirety to a distribution enterprise! called
SARJO. SARJO does the buying, transporting and delivery to the individual
stores in a comparable way as CARULLA1J (Dijken,1988).
I I I I I I I I I I I I I I I I I I I
CARULLA sells about 325 tons per year and SARJO-CAFAM abcut 300 tons
per year. Consumer prices are daily adjusted 21 • Annex Ir ShOW5 the average
selling priees per month for both tonterns.
The marketing palicy of bath concerns isn't one of sharp prices, but
one of gODd quality. Severe tontral of the produtts is done befare they tan
be sold in the individual stores. Furthermore\ vegetables are cnly 3ccepted j
if they are put up in plastic boxes, which can be bought~ or borrowed from
the concerns. When the vegetables arrive in Bogotá, they are stored in CQld
storage chambers.
supply channel,
deeay.
The high
make that
attentian fer
there are
quality, together
hardly problems
with the own
with product
Both, SARJO and CARULLA, have
varieties of snap beans. SARJO has
some ~~perien[es with trading different
tried
stopped with it, because the yellow beans
a yellow snap bean, but
sold ver y bada It must be
they
however! that SARJO fixed the consumer price of the yellcw snap beans aboye
the.consumer price of the common variety. Neither they did any promotion for
the new variety. 80th concerns show interest in new varieties to introduce
them to the consumers as well as to the farmers, with whom they cooperate.
1) CAFAM on1y takes eare nf the personnel in the stores, whe se11 the
vegetables at prices fixed by SARJD. CAFAM therefore shares in the
profit of SARJO.
2> In the individual stores ooly one quality can be found f~r snao beans.
There are other vegetables~ for which both toncerns offer sQ~etimes two
qualities with different prices l like lor fresh peas and carrots. Prices
are the same in all the individual stores.
I I I I I I I I I I I I I I I I I I I
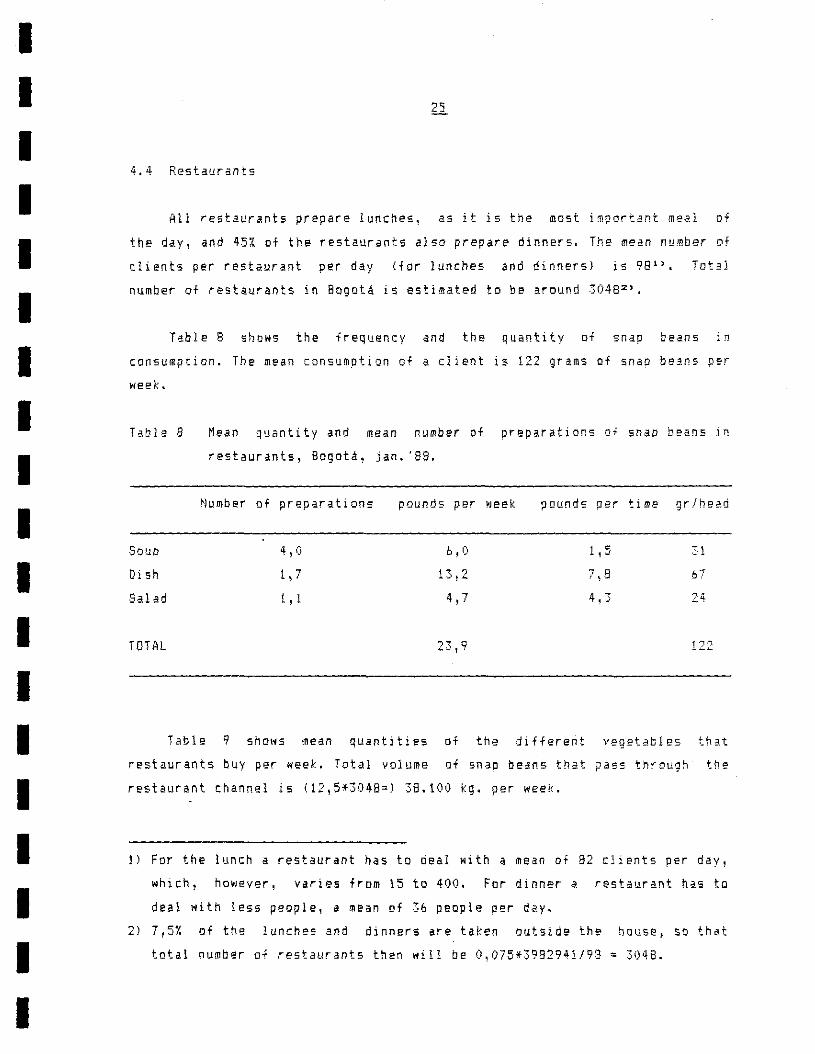
4.4 Restaurants
All restaurants prepare lunches, as it is the most important meal of
the day, and 4·5:( of the restaurants alsa prepare dínners. The mean ""mber Di
c!ients per restaurant per day (for lunches and dinners) is 98". Total
numbe. 0+ restaurants in Bogotá is estimateo to be arouno 3048 2 '.
Table 8 sha"s the f.equeney anó the quantity of snap heans in
cansumption. The mean consumpticn of a client is 122 grams oi snap beans per
week ~
Tabie B
SOliO
Dish
Salad
TOTAL
Mean Quantity and mean number of preparations o~ snao beans in
restaurants, Bogotá, jan. 'S8.
Number nf preparations pounds per ~Jeek pounds per time gr/head
4,0 b~ü ' e .. ,..J 31
1,7 13,2 7~8 67
t ! i 4,7 4!3 24
23,9 122
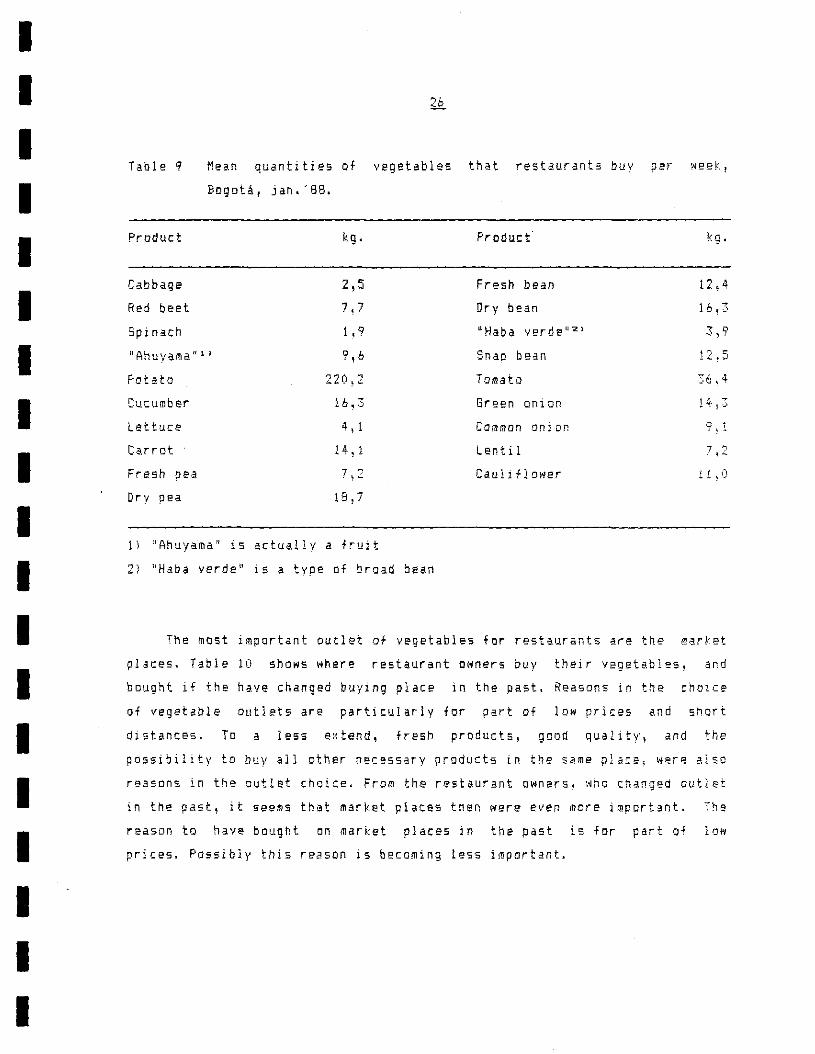
Table 9 shows mean quantities of the different vegetables that
restaurants buy per week. Total volume of snap beans that pass through the
restaurant channe! is (12,5*3048=) 38.11)1) kg. per week.
1) Far the lunch a restaurant has to dea! "ith a mean of 82 clients per day,
which, however! varies from 15 to 400. For dinner a restaurant has to
de.l with less people, d mean of 36 people per day.
2) 7,5% of the lunches aod dinners .re taken outside the house, so th.t
total "umber of restaurants then "111 be 0,075<3982941/98 = 3048.
I I I I I I I I I I I I I I I I I I I
Table q Mean quantities of vegetables that restaurants buy per week,
Bogotá, jan. '88.
Product kg. PrODuct kg.
Cabbage 2,5 Fresh bean 12,4
Red beet 7,7 Dry bean
8pinach 1,9 uHaba verde ll2)
IlAhuyama l11) 9,6 Soaa beao 12.5
Patato 220~2 Tomato 36,4
Cucumber 16,3 Green On1011
Lettuce 4! 1 Cammon orlar.
Ca.rrot 14,1 Lentil
Fresh pea 7~2 Cauliflower
Dry pea 19,7
1) l'AhuyamaJ/ is actually a fruit
2) llHaba verde u is a tvpe of braad bean
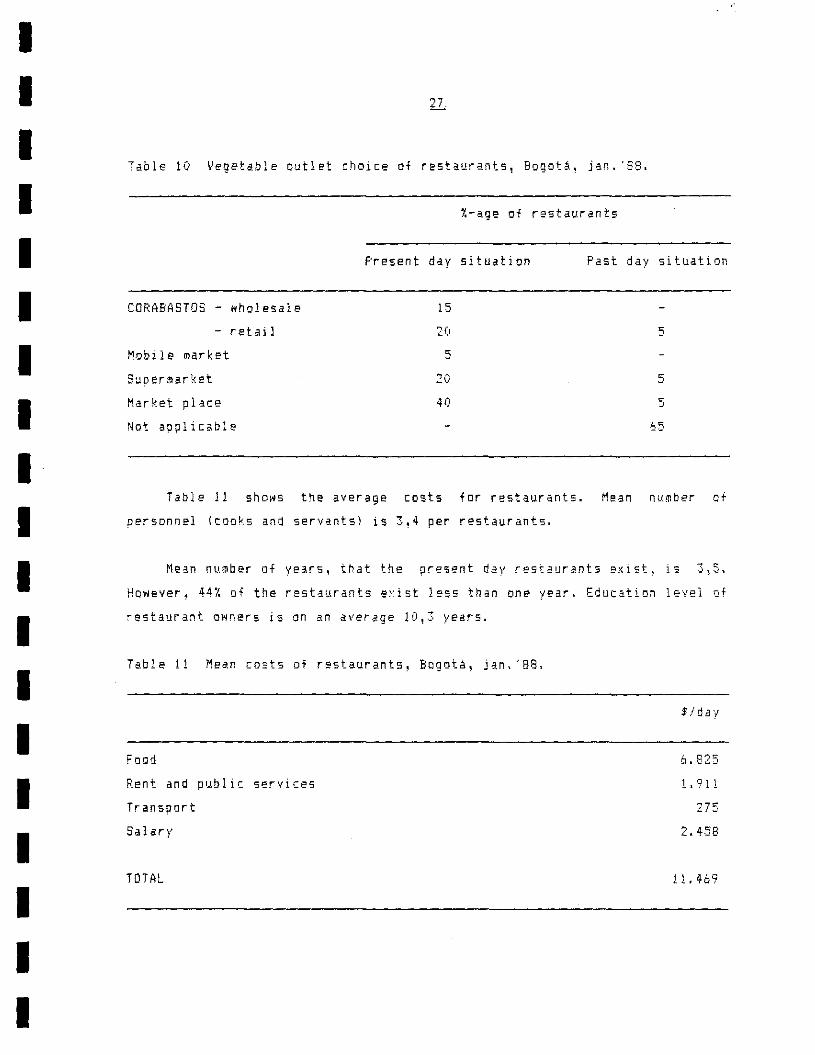
The most important outlet of vegetables for restaurants are the ma~ket
places. rabIe 10 shows where restaurant Qwners buy their vegetables, and
bought if the hay! changed buying place in the pasto Reasons in the choice
ai vegetable outlets are particularly far part of low prices and short
distances. To a 185s extend, fresh prDduct5~ good quality, and the
possibility to buy al1 other necessary products in the same pla~el Mere also
r~aSDns in the outlet choice. From the restaurant owners~ who cnanged outlet
in the past, it seems that market places then were even more important. The
reason te have bought on market placas in the past is for part of low
prices. P05sibly this reason is becoming less important.
I I I I I I I I I I I I I I I I I I I
Table 1i) Vegetable outlet choice of restaurants, Bogotá, j~n. '88.
i,-age of restaurants
Present day s¡tuatian Past day situation
CORABASTOS - wholesale
- reta; 1
Mobile market
Superma.rket
Harket place
Not aoplicable
15
20
5
20
40
5
5
5
65
Jable 11 ShD~S the average costs for restaurants. Mean number 0+
personnel (cooks and servants) is 3,4 per restaurants.
Mean number of years, that the present day restaurants exist , is 3,5.
However, 44% of the restaurants exist 1255 than one year. Education level Qf
restaurant Qwners is en an average 10!3 years.
T.able 11 Mean costs of restaurants~ Bogotá, jan, '88.
Food
Rent and public services
Transport
Salary
TOTAL
$/day
6.825
1. 911
275
2.458
11 . 469
I I I I I I I I I I I I I I I I I I I
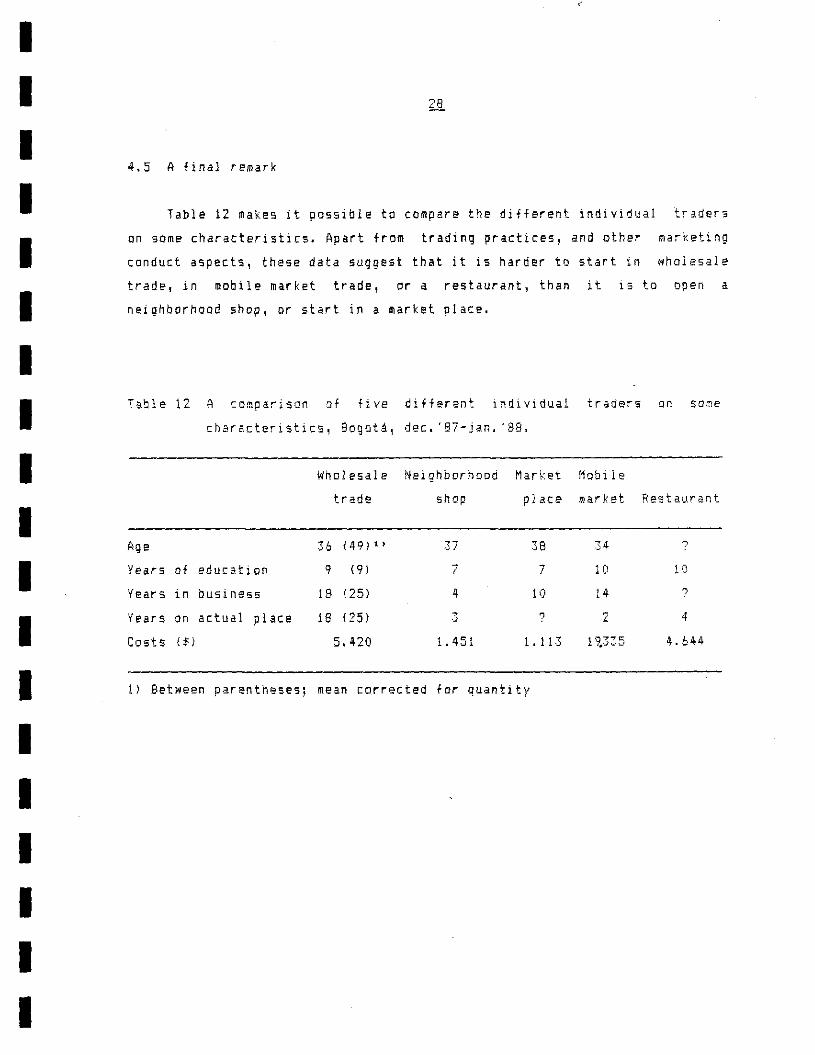
4.5 A final remark
lable 12 makes it posslble to compare the dlfferent individual trader.
on so me characterlstlcs. Apart fram trading practices, and other marketing
canduct aspects , these data suqgest that it is harder to start in .holesale
trade, in mobile market trade, or a restaurant, tha" It Is to open a
neighborhood shop, or start In a market olace.
Tabl e 12 A cDmparisan al five di flerenl Individual traders on 50me
characteristics! BogoU , dec. '87-j2n. '88.
Wholesale Nelghborhood Market 11obi!e
trade shop place mar k et Restaurant
Age 3':' (49)" 37 38 34 ?
Years oi education 9 (9 ! 7 7 10 10
Years in business 18 (25) 4 10 14 n
"iears on actual place 16 (25) ~ o 2 4 .• Cast. ($) 5.420 1. 451 [,11.3 19.335 4.644
1) Between parentheses; mean corrected for quanti ty
I I I I I I I I I I I I I I I I I I I
5 CONSUMPTION OF SNAP BEANS IN BOSUTA
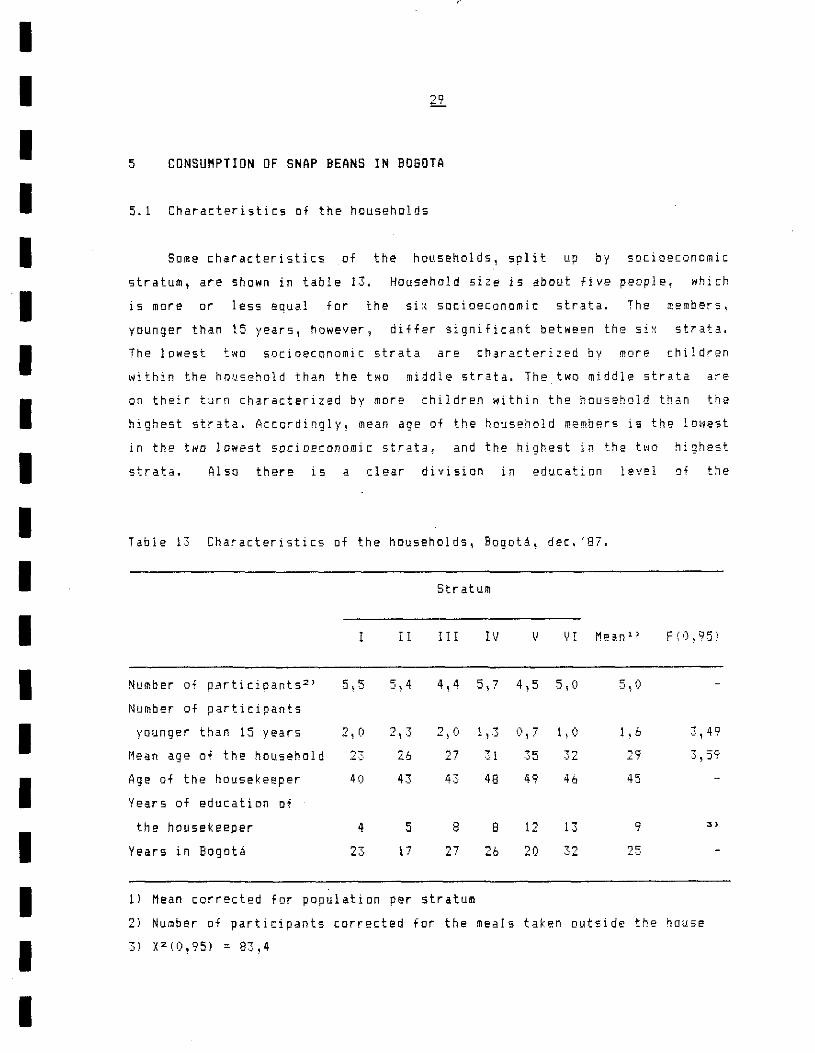
5.1 Charaderistics al the households
Sorne characteristics of the households, split up by SOcioEconomic
stratum, are shawn in table 13. Household size is about five peDple. which
is more or less equal for the six socioeconomic strata. 1he members,
younger than 15 years, however, differ significant between the six strat~.
The lowest ~wo socioeconomic strata are characterized by more childr9n
within the household than the two middle strata. TMe two middle strata are
on their turn characterized by more children within the household than the
highest strata. Accordingly, mean age of the household members is the lowest
in the twa lowest sDciDEconomic strata, and the highest in the two highest
strata. Also there is a clear division in education level of the
T ab ¡ e 13 Charaderistics of the hO'lseholds, Bogot.l. , dec. c 87.
Stratum
¡ I 1 1 1 IV V VI Me3.ol> F(i)!95)
Number of p.articioants 2 } 5,5 5~4 4,4 5,7 4,5 5,0 5~O
Number of partícipants
yO'lnger than 15 years 2,0 2, ,3 2~O 1 ! ,3 0,7 1, O 1 i 6 3,49
11ean age of the household 23 26 27 31 35 -e ')L 29 .3,59
Age of the hOlJsekeeper 40 43 43 48 49 46 45
Years of education al
th e housekeeper 4 5 8 8 12 13 9 3)
Years in Bogotá 23 17 27 26 20 ,e 00 '_'L ... '..1
[) Mean corrected for population per strat'lm
2) N'lmber of participants corrected for the meals taken outside the hous.
3) XZ(i),95) = 83,4
I I I I I I I I I I I I I I I I I I I
housekeepe~. Years of education i5 the fewest in the lowEst strata , next the
two middle strata and years Di education i5 the most far the twa highest
socioeconomic strata.
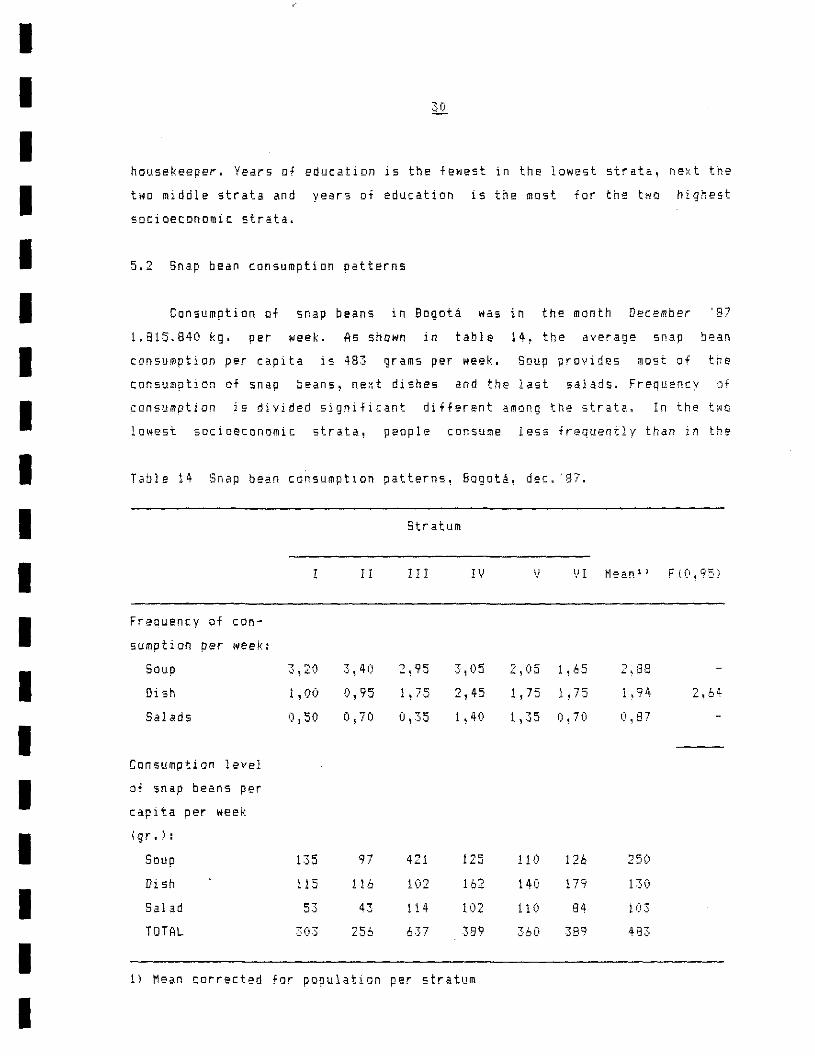
5? 50ap bean consumptíon patterns
Consumption Qf snap beans in Bogotá "aS in the month December '87
1.815.840 kg. per week. As shown in table 14, the .verage snap beao
consumption per capita is 483 grams per week. Soup provides most of the
tonsumption of snap beans, next dishes and the last salads. Frequency of
consumption is Divided significant different among the strata. In the t~Q
lowEst socioeccnomic strata, people consume less frequently than in th~
Table 14 Snap bean consumptlon patterns, Bogotá, dec. '87.
Stratum
¡ ¡ ¡ JI! JI' V \J 1 ~1e¿l.n 1 1 F ((i \ 95)
Freouency uf COn-
sumption per week:
Soup 3~20 3,40 2~95 3,05 2,05 1,65 2~B8
Dish 1 ,00 0,95 1,75 2,45 1 f 75 1 ~ 75 1 ~ 94 2,b4
Salads 0,50 0,70 0,35 1,40 1}35 0,70 0,87
Consumption J evel
of snap beans per
capita per "eek
19 r • ) :
Soup 135 97 421 125 110 126 250
Dish 11 5 116 102 162 140 179 130
Salad 53 43 114 102 ! 10 84 10.3
TOTAL 303 256 6·37 389 .360 389 483
1) Mean corrected for PQoulatíon per str.tum
I I I I I I I I I I I I I I I I I I I
other four strata. The quantities Qf snap beans per hDusehold per week~
ho"ever, are not different between the strata. So, if peopl. froro the Jowest
strata consume less frequently, than they must consume bigger portians per
time. Furthermore, people COnsume more tnan one time of the prepared
snap beans, which 15 equal for each sDcioeconomic level. For soup this is
1,3 times, for dishes 1,5 times and for salads 1,2 times.
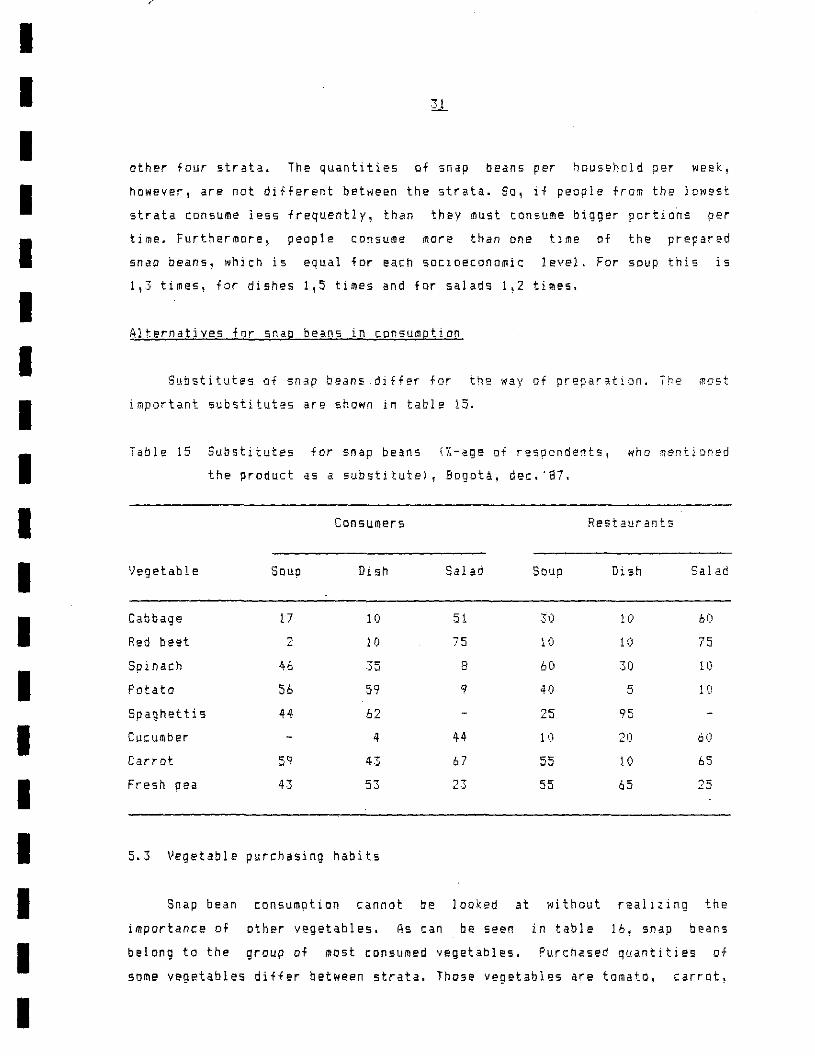
Alternatives for snap beans in consumption
Substitutes of snap beans differ far the way of preparatian. The ffiDst
important substitutes are shown in table 15.
Table 15 Suhstitutes for snap be~ns (Y.-age of respondents l wh IJ m·9nti :)ned
the product as a substi tute) , Bogota, dec. '87.
Consumers Restaurants
Vegetable Souo Dish Salad SOlip Dish Salad
Cabbage 17 10 51 ·30 10 60
Red beet 2 10 75 10 10 75
Soinaeh 4' .0 35 8 60 30 lO
Patato " "lo 59 9 40 5 10
Spaghettis 44 62 25 95
Cucumber 4 44 10 20 60
Carrot 59 43 67 55 10 65
Fresh pea 43 53 ", ... "-' 55 65 25
5.3 Vegetaol. purchasing habits
5nap bean eonsumption cannot be looked at without realizing the
importance Df other vegetables. As can be seen in table 16, snap beans
belong ta the group of most consumed vegetables. Purchased qua.tities of
some vegetables differ between strata. Those vegetables are tomato, carrot,
I I I I I I I I I I I I I I I I I I I
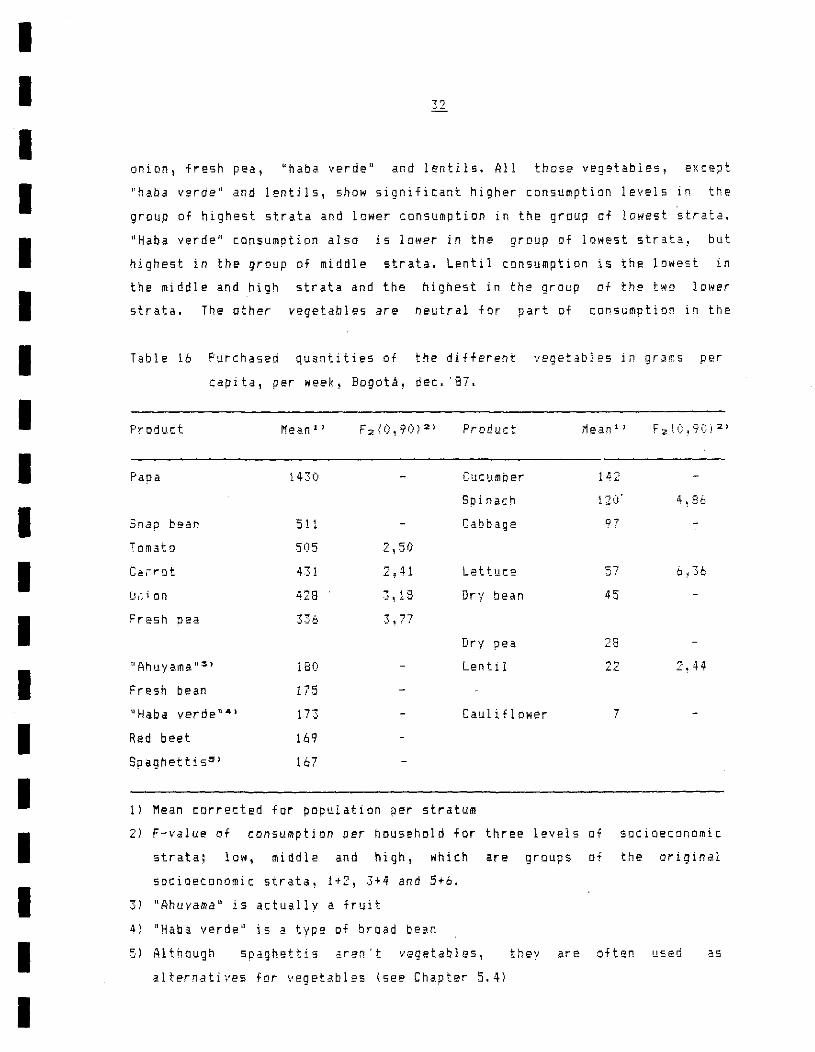
onion, fresh pea, uhaba verde» and lentils. All those veg~tables, except
"haba verde u and lentils, show significant higher consumption levels in the
group of highest strata and lower consumption in the group of lo"elt strata.
"Haba verde" consumption aIso i5 lawer in the group of lowest strata, but
highest in the graup of middle strata. lenti! consumption is the !owest in
the midd!e and high .trata and the highest in the graup af the tWD IONer
strata. The other veqetables are neutral for part of consumption in the
Tab!e 16 Purchased quantities of the different vegetables in groms pee
capita, per _eek, Bogotá, dee. '87.
Produc:t
Papa
Snap bean
Tornato
lll~ ion
Fresh pea
u Ahuyama n3)
Fresh bean
Red beet
Spaghettis'"
Mean 1 )
14:·0
511
505
431
428
336
180
175
173
169
167
PrDnuct
Cuc)lmber
Spinach
Cabbage
2,50
2,41 Lettuce
3,18 Dry bean
3 1 77
Dry pea
Lentil
Caul i fl OHer
11 Mean correeted for population oer stratum
Mean 1l F:z(0190i 2 )
142
120·
97
e--.J !
45
28
22
7
21 F-value of eonsumption per household for three levels of socioeeonomie
strata.\ low, middle and high, whi en are groups of the original
sDcíoeconomic strata, 1+2, 3+4 and 5+6.
,3) llAhuyama U i s actually a fr wi t
4' lIHaba verde u is a. type Df broad be,;\o
5) Al though spaghettis aren't vegetables, they are ofter used as
alternatives for vegetables (see Chapter 5.41
I I I I I I I I I I I I I I I I I I I
di~ferent socioeconomic strata. Purchas~d quantities per capita par week~
within each stratum, are given in annex 111. Total quant:i.ties of veget.a.bles~
bought in one ""e k in Bogotá, can be found in anne. IV.
The consumption of fresh vegetab1es (: a11 vegetab1es in table 16 less
patato, spaghettis, dry bean, dry peas and le"ti1s) is the JONest in the
group of low socioeconomic strata (1+2) ant the highest in the group of the
two middle strata 13+4), The F-value 15 however low) 1,87. If the aboye
mentioned vegetables are aIso included, than the tonsumption of vegetables
is almost the Same in the group 0+ the two lowest strata and the g~QUP Q~
the two highest strata. The consumption in the middle group, however,
almost the double of ene of t~e other groups. Ine F-value (2,59)
significant at 90% probabilit¡_
Outlet choice far veaet~bles
1 '3
Most conSUmers buy their vegetables on the market places. TabIe 17
shows that neighborhood shops are particularly of importance for the lowest
sacioeconomic stratum. The 5upermarket on the other hand is wnere most Ot
people of the highest stratum buy their vegetables, while the people of the
intermediate strata buy particularly on market placesa Above mentioned
percentages can be used to calculate volumes of snap beans that are bought
in the dif.rerent Dutlets. As shown in table lB! market pla'C2s then take
almost the half of all sales cf snap beans on their account. The rea50~S
behind the Qutlet choices can also be found in table 17. Freshness with gODO
quality is the reason Qf most importance in the group Di high strata and
less 1n the group Qf low socioeconamic strata.
The distances to the usual outlet isn't different for the consumers out
of the diff~rent socioeconomic strata.
That certain types Df snap bean retail Qutlets serve peo~le of a
particular socioeccnomic stratum, can a150 be shown in another way. For
sorne 0+ the snap bean retail outlets, it was possible to calculate a mean

I I I I I I I I I I I I I I I I I I I
for the socioeconomic strata cf areas in which they are established. This
is shown in table 19. The outcome confirms the consumer information about
outlet chaice.
Table 17 Vegetable purchasing habits, Bogotá, dec. '87.
Outlet choice of consu-
mers for vegetables:
CDRABASTDS
Mobile market
Market place
Neighborhood shop
.5upermarket
Reasons for buying in
a certain outlet:
Ch.eap
Fresh and good qualitv
Credit
Buy everything there
Near
15
20
55
10
30
35
20
55
Stratum
¡ 1 I Il
15
45
25
15
65
70
15
45
55
25
20
40
80
5
25
30
IV
20
lO
30
20
20
50
65
10
45
v
15
10
40
5
30
40
ll)
15
45
" , ".
15
5
1 O
70
20
90
15
15
Purchasing frequency 1,89 1,78 1,83 1,85 1,13 1,10
1) Mean corrected far papulation per stratum
Mean 1l
11)
5
43
20
22
45
2
18
38
1,74
8,0
3'
2) X2 -value for three levels oi socioeconomic strata: low, middle! and
high, which are groups of the original strata, 1;2, 3+4 and 5+6.
31 F-value far three levels of sociaeronomic strata • 3,65
I I I I I I I I I I I I I I I I I I I
Table 18 Total sale vDlumes of snap beans per week for the different types
of outlets (kg/week), Bogotá, dec. '87.
5tratum
1 1
1 1 1
IV
v VI
TOTAL
eDRABAS TOS
16.3
8704
99446
19331
4373
132017
7
Mob i J e
market
49723
128B8
1458
64068
Outlet
Market
place
218
26111
712372
149169
51551
2915
942335
47
Neighbor
hood shop
599
14506
323805
99446
6444
444800
22
Super-
market
109
8704
99446
3866.3
20407
4",' "':""'1,..., ':"0,_'''' .:
21
Table 19 Mean SQCiDeCOnomic stratum of the sectDrs in which different
types of retail ouUets are established, Bogotá, dec. '87-jan. '88.
Neighborhood shop
t1arket place
Mobile market: CORABASTOS
MERCASO
COOMERCUN
All three
Supermarket chains: CAFAM
CARULLA
Both
1) Mean carreeted far papulation per stratum
r1ean 1 )
4\6
4,7
5~3
4,8
5,6

I I I I I I I I I I I I I I I I I I I
6 QUALITY OF SNAP BEANS
6.1 b!ualityexamination
Far the camman snap bean, gaod quality mesns that the pod must be
emerald green, mature (but not overripe, in which the seeds are becoming
dry), and without dark spat., ar rotten parts. Furthermore, a sn •. p bean of
good quality is long, snaps easy, and has a straight and regular formo Those
criteria are not of equal importance within the market channel, as shown ln
table 20. Consumers pay ffiost attention to the color, the absence of dark
spots, or rotten parts, and maturity. The form en the other hand is of le55
importance. Consumers from different sociaeconomic stratum do not diff9f in
their quality examinatian. Restaurants Dwners tend to examine in the 5ame
way as cDnsumers, but with a little less attention ta length and form DI the
podo Remarkable is the lOH percentage of market traders and shop owners! who
5ay to pay attention to the absence Df spots and rotten parts. However! most
likely~ spots and rotten parts are 50 important, that the presence of these
defects is out of the question. Furthermore, it is striking that the form of
the snap beans are oi so little importance far market traders and Shop
owners. The l~tter a150 pay hardly attention to the length of the podo TMe
wholesale traders on CORABASTOS examine quality on the sarna criteria as th~
retail traders and consumers. But in addition they a150 set high value on
the length of the snap bean. Ferm 0+ the snap beans can vary a little bit
more, as also is the case for the retail traders and consumers~
The four most occurring defetts in quality for the consumers are detaYI
a pale green coler, spots and flexibility. These are also the defects nn
whi[h they most often check on. As appears in table 20, retail traders
experience less defetts in quality. This is logic, because they obtain the
snap belns earlier In time than consumers. lt iB striking th.t retail
traders meet hardly defects far part af the easy breaking of .nap
while this is a very frequent defect for tansumers. Dn the other
bea.ns,·
hand,
retail traders mention more often Dverripeness as a def~[t~ while this isn't
so important far consumers. The most remmon defects, far wholesale traders
are the .potl, Dverripeness and small length.
I I I I I I I I I I I I I I I I I I I
Table- 20 Quality aspects of snap beans (%-age of respondents), Bogotá,
dec. '87-jan. '88.
Critería in quality
Color
Disease and decay
liaturity
Length
E3Sy breaking
Form
Most frequent defects
in quality:
Decay
Pale green/yellow 2 >
Dark spots
Fle:<ibility
Overripe
Bample size
Con su-
mer s 1 )
96
94
92
74
69
58
97
87
82
79
34
120
Restau
rants
100
100
95
50
85
35
25
60
70
25
60
20
1) Mean corrected for population per stratum
21 Yello" is an indication for staleness
6,2 Acceptance of qUdlity defects
Market places
and mobile
markets
95
' " .. -.,J
100
55
80
5
35
50
35
15
70
20
Neighborhood
shops
75
20
7i)
< ~
'< Q.-.!
"" q._,
55
35
40
20
The severity far part of the defects may differ between the type 01
meal far which the snap beans are used. This i5 shown in table 21 for
CQnsumers~ as "e11 as far restaurants. Generally more people accept sorne
kind 0+ deferí on the snap beans, if the snap beans are golng to be used toe
I I I I I I I I I I I I I I I I I I I
the soup. For the dish and the salads more people prefer to use good oeaDS.
Furthermore it appears that restaurants on the whole accept more often so me
quality defects than consumers.
A medium length of B to 11 cm. isn't a problem for any type of mea!.
Les5 than eight cm. becomes more a problema This i5, becausE the snap .beans
are shelled befare cooking. As long as the quantitYl that has t~ be
prepared, isn't very much, people can accept small beans. But for dishes,
ior which bigger quantities are prepared, it becomes a lot oi wark to deal
with so many small beans.
Concerning col~r af the snap beans, it can be
with a dark [olor is th& snap bean that is most
difference for the meal for which they are used.
noted that a snap bean
often accepted, without
A pale green color is
accepted to a less extent, particularly when it concerns the dish, or the
salad. YellQw snap beans are hardly accepted at all.
As fur the form, curved beans are fairly accepted, particularly for
SDUpS. This is equal in all socioeconomic strata. Far dishes and salads l
curved beans are less .atcepted, particularly in the middle socioeconomic
strata. The same is true far snap beans that has sorne kind of deformations
on the pOd, although the acceptance on the whole is lawer than far the
curved beans.
Maturity. as is shown in tabIe 20, is an irnportant quality aspect fDr
consumers, which particular concerns the overripeness. As a result vQung
thin snap beans are accepted to some extend, but overripe beans aren't
accepted at all. As overripe snap beans don't break easy, people don't
accept flexible snap beans.
Dark spots, as well as sorne decay are defects, that are out of the
question in acceptance.
In summary, dark green snap beans and snap beans of medium length are
accepted by mast of the people. Pale green snap beans, short snap beans,
I I I I I I I I I I I I I I I I I I I
Table 21 Acceptance of quality defects by consumers 2nd restaurants.
Bogotá, dec. 'S7-jan. 'S8.
Consumers 1 ~ Restaurants
Def ect s Soup Dish Salad Soup Dish Salad
Medium 1 en g t h (8 -11 cm. ) 100 100 100 100 89 94
Dark green color 75 77 75 56 53 50
Curved bE'an 60 47 46 81 58 50
Small 12ngth 45 36 43 '-' tl ,_, 42 44
Pale green color 41 30 34 50 47 ";/::" L ...
Thin b ean 38 "7 30 50 ~o 38 .' , . .:.' ,~
Deformed bean 37 00 ?"r 44 -- 00 ,,:,.J .... ../ -.:.. ¡ ~..,¡
Yellow color S ·3 .3 6
Fl exi b le beans 7 10 8 31 18 27
Dverripe beans 1 , 6 5 b " Dark soots .3 19 5
Sorne decay ,~
Sample si Z E 117 118 99 16 ,Q 1 b
1 ) Mean percentages corrected f Of popuhtion per stratuffi
curved snap beans, defarmed snap beans and young, thin snap beans are
moderately accepted. Hardly or not accepted are the yellow snap beans, snap
beans with dark spots, snap beans, that are a little bit rotten, overripe
snap beans and flexible snap beans. Almost no difference exists in
acceptance of quality defects, between the socioeconomic strata.
6.3 Perishability and losses
Perishability and quality are closely related, Losses are caused by
perishability, but a150 by the regularity of sal~s. As shown in table 22,
I I I I I I I I I I I I I I I I I I I
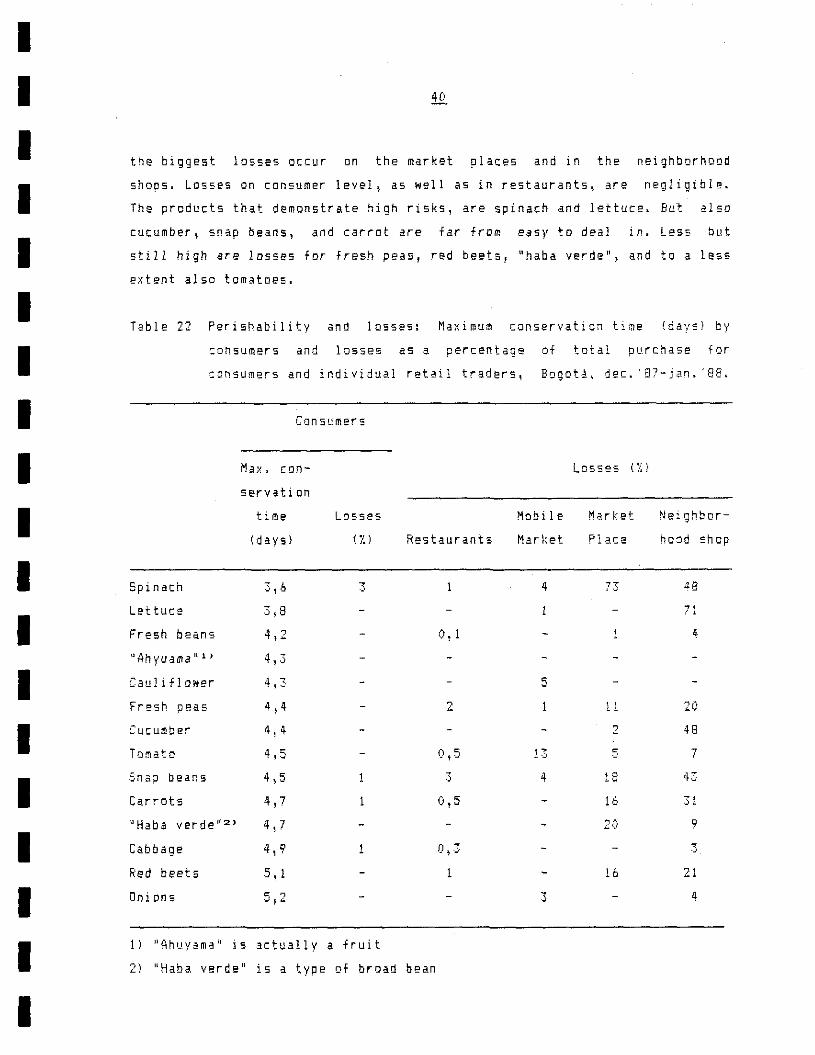
the biggest losses occur on the market places and in the neighborhood
shops. Losses on consumer level, as well as in restaurants, are negligible.
The products that demonstrate high risks, are spinach and lettuce. But alsD
cucumber, snap beans, and carrat are far from easy to deal in. Less but
stil1 high are losses for fresh peas, red beets J "haba verdeu~ and te a less
extent also tomatoes.
Table 22 Perishability and 1055e5: Maximum conservaticn time (days) by
consumers and losses as a percentage of total purchdsE for
ccnsumers and individual retail traders, Bogotá. dec. '87-jan. '88.
Cansumers
M.". con- Losses (:0
servati on
time Losses Mabile Market Neighbor-
(d ays) ( !. ) Restaurants Market Place hond shop
Spinach 3,6 3 4 7.3 48
Lettuce 3,8 "' " Fresh beans 4,2 0,1 4
UAhyuama l(1) 4, .3
Cauliflower 4,3 5
Fr esh peas 4,4 2 11 20
Cucumber 4,4 2 48
13 • 7 '0 Tomato 4,5 0,5
.5na;J beans 4 \ 5 3 4 18 43
Carrots 4,7 1 0,5 16 .31
"Haba verde U2 ) 4,7 20 9
Cabbage 4,9 1 O, .:; 3
Red beets 5,1 1 , ' .0 ?' -,
OniDfls • o .Jf':' 3 4
1) UAhuyama¡¡ is actually a fruit
21 "Haba verde" is a type of broad bean
I I I I I I I I I I I I I I I I I I I
7 PREFERENCES FDR SNAP BEANS
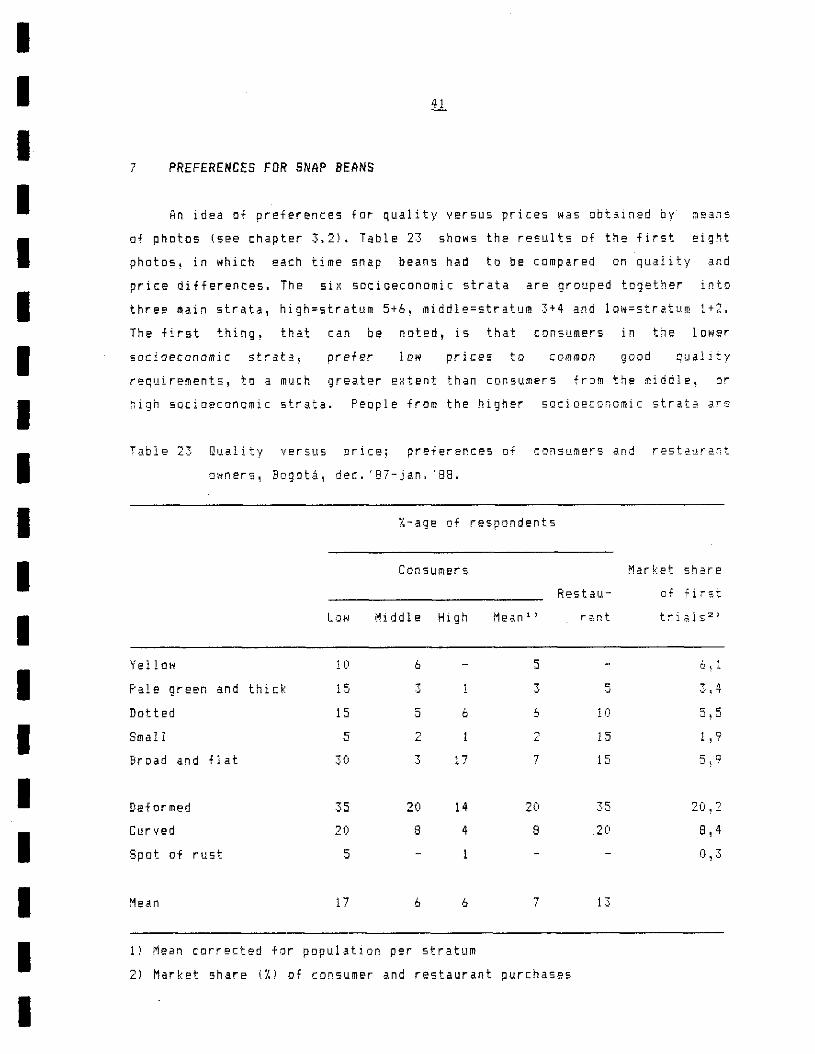
An idea of preferences for quality versus prices was obtained by' m~ans
of photos (see chapter 3.2). TabIe 23 shows the results of the first eight
photos, in which e8ch time snap beans had to be compared on quality and
price differences. The six sDtiaeconomic strata are grouped together inta
three main strata, high=stratum 5+6, middle=stratum 3+4 anti low=stratum 1+2.
The first thing, that can be noted, is that consumers in the lower
sacioeconomic strata l prefer low prices tD common good quality
requirements, to a much greater than consumers frarn the middle~ or
high socioeconomic strata. People fram the higher socioeconomic strata ar9
TabIe 23 Quality versus price; preferences of consumers and re5ta~rant
o\·~nersl Bogotá 1 dec. '87-jan. '88.
%-age of respondents
Consumers Market sh2l.re
Restau- of first
Low Middle High Mean 1 ) r~nt
Yello" 10 6 5 ,-:-J ~ 1
F'ale green and thicK 15 ., 3 • 3,4 '-
,j
Dotted 15 5 6 , 10 5 1 5
Small 5 2 .::. 15 1,9
Br Dad and fl at 30 3 17 7 15 5 1 9
Deformed 35 20 14 20 35 20!2
Curved 20 8 4 8 20 8,4
Spot of rust 5 1 0,3
Mean 17 6 6 7 13
1 ) Mean corr~cted f ar population per stratum
2) Market share (1.) of consumer and restaurant O'lrchases

I I I I I I I I I I I I I I I I I I I
hardly sensitive fDr low prites. It tan be that they indeed act according tD
the common good quality requirements, hut a150 it can be that they prefer
high priees as a seeurity for buying good quality. Significant differences
in preferentes between the strata at the 95% probability level, were found
for the ripe pale green snap bean, the snap bean with sorne defDrmatiDn5~ ~nd
the flat braad snap bean. Furthermare it is elear that sorne kind af disease
on the pod of the snap beans will not be bought by consumers~ even ii the
price is $ 10.00 lower than for the tommon one.
The restaurants in general prefer ION prices tD good quality te a
greater extent than consumers. The preferentes tor low prices have the sam~
pattern te quality differences as it has for consumers.
Neighborhaad shop awners alsa ~ere asked, ~hich of the yarieties :~ev
prefer, if buying pric2s shcwed the sama relative differenc2s 1 ). ~or t~e
retail and wholesale traders! the question was a little bit different. For
this the photas haya been divided into two groups; ane with n~w variety
characteristics and Dne with beans of less Qu~lity. The traders were asked.
which of the different varieties they would try and Nhich they wouldn't. ~or
the difference in quality the question was, if they traded sDmetimes in the
beans of le55 quality. The results are shown in table 24. Because of the
difference in the question, it becomes a little bit difficult to compare the
data.
It se2ms that shop owners are not really progressive for part of new
yarieties. This is lc~ic! because snap beans form only a ver y small part in
their assortment. The retail market traders look quite open fer sorne new
varieties. The variety characteristics that they would try, are for part of
the color and the formo When, however, the snap beans are small I the
lnterest dlsappears. Wholesale traders only shawed interest in the yelloo
variety and the flat, broad variety.
1) According to the quantitv unit of purchases j prices Mad to be changed.
But the relative price difference between the two varieties always Has
the 52me; abDut 17~.
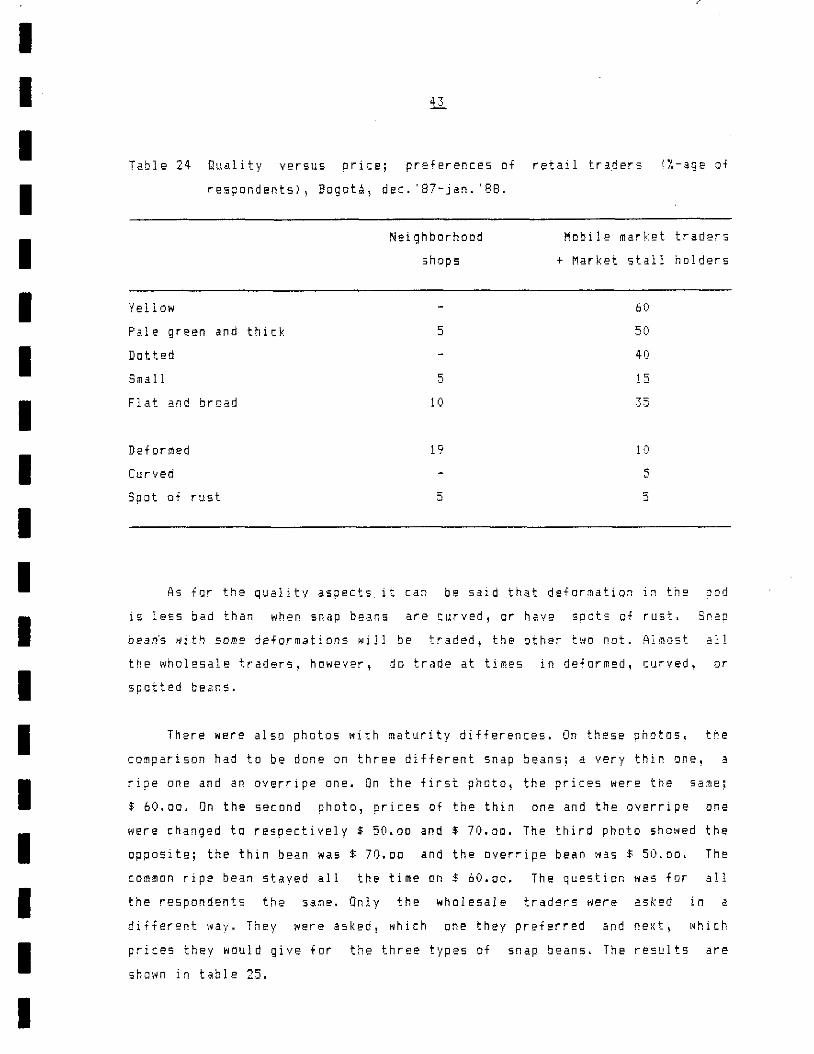
I I I I I I I I I I I I I I I I I I I
TabIe 24 Quality versus price; preferences Di retail traders (%-age Di
respondents) l Bogotá, dec. 'BY-jan. '88.
Yellow
Pale green and thick
Dotted
Sma 11
Flat an oj broad
Deformed
Curved
Spot of rust
Neighborhood
shaps
5
5
10
19
5
Mobile market tradef5
+ Market stall holders
60
50
40
15
35
10
5
s
As far the qualitv aspects it can be said that defarmation in the Dod
i5 less bad than when snap beans are curved, or nave 5Dots Qf rusto Srap
bean's Hith some deformations l')i1J be traded, the other tNO noto Almost a11
the wholesale traders, however, do trade at times in deformed, curved, or
spotted beans.
There were also photos with maturity differences. On these phOt05! the
comparison had to be done on three different snap beans; a very thin one, a
ripe one and an averripe ane. On the first photo, the prices were the same;
$ 60.00. On the second photo, prices 01 the thin one and the overripe one
oere changed to respectivelv $ 50.00 and $ 70.00. The third photo sho.ed the
opposite; the thin bean WdS $ 70.00 and the overripe bean was $ 50.00. TMe
common ripe bean stayed all the time on $ 60.00. The question was for all
the respondents the same. On1y the wholesale traders were asked in a
differ~nt way. They were dsked, which one they preferred and next, which
prices they wauld give far the three types of snap beans. The results are
shown in table 25.
I I I I I I I I I I I I I I I I I I I
Generally the ripe snap beans are preferred to the thin, or the
overripe snap heans. However, at alrnost al! levels, overripe snap beans
are preferred to thin soap beaos.
As for the consumers, three types of responses can be reeognized. In
the case, that the prices are all $ 60,00, there are more consumers in tne
low strata~ wha prefer Dverripe snap beans, than there are in the middle and
the high strata. Thin snap heans are in the situation of equal prices cut of
the question. However! when thin beans become cheaper! than 20% of the
consumers from the low strata will prefer the thin snap bean. AIsD in the
middle and high strata consumers respond in this way, but te a le55 extent.
The results cf the third photo are more difficult to interpreto 1Me
responses appear te be illogical. Probably this is caused by the sequence of
the photos, by which the consumers get a little bit confused about the
reason whv the prites changes in such an illogical way. That's mayJe why
more consumers turri back on the stable ripe snap hean of $ 60.00. It's known
that stronq price fluctuations can be of big irritation fer the consumers
(PAO, 1984).
TMe third type oi response that can be recognized is far part of the
high strata. The respondents from those strata show a positive sensitiveness
for high prlees. Probably they relate high prieBs with good quality.
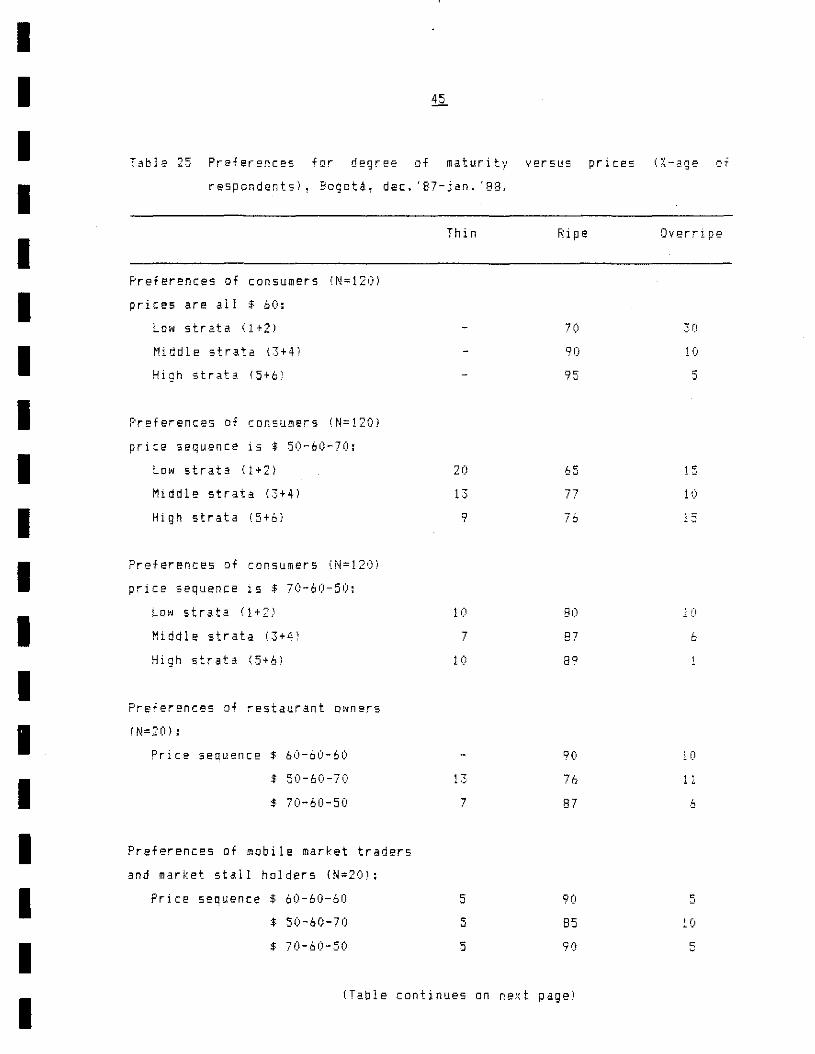
I I I I I I I I I I I I I I I I I I I
Table 25 Preferences for degree of maturity versus prices (X-age Ot
respondents), Bogotá, dec. 'B7-jan. '88.
Preferences of consumers !N=120)
prices are all $ 60:
Low strata <1+2)
Middle strata (3+4)
High strata (5+6)
Preferences nf consumers (N=120)
price sequence is $ 50-60-70:
Low strata (1+2)
Middle strata (3+4)
High strata (5+6)
Preferences of consumers (N=1201
price sequence is $ 70-60-50:
Low strata Cl+2)
Middle strata (3+4:
High strata (5+6)
Preferences of restaurant owners
!N=20),
Priee seauence $ 60-60-60
$ 50-60-70
$ 70-60-50
Preferences of mobile market traders
and market stall holders (N=201:
Price sequence $ 60-60-60
$ 50-60-70
$ 70-60-50
Thin Ripe
70
90
95
20 65
13 77
9 76
10 80
7 87
10 89
90
13 76
7 87
5 90
5 85
5 90
(Table continues on next pagel
Overripe
30
10
5
15
10
15
lO
6
, O
1 1
.S
s
5
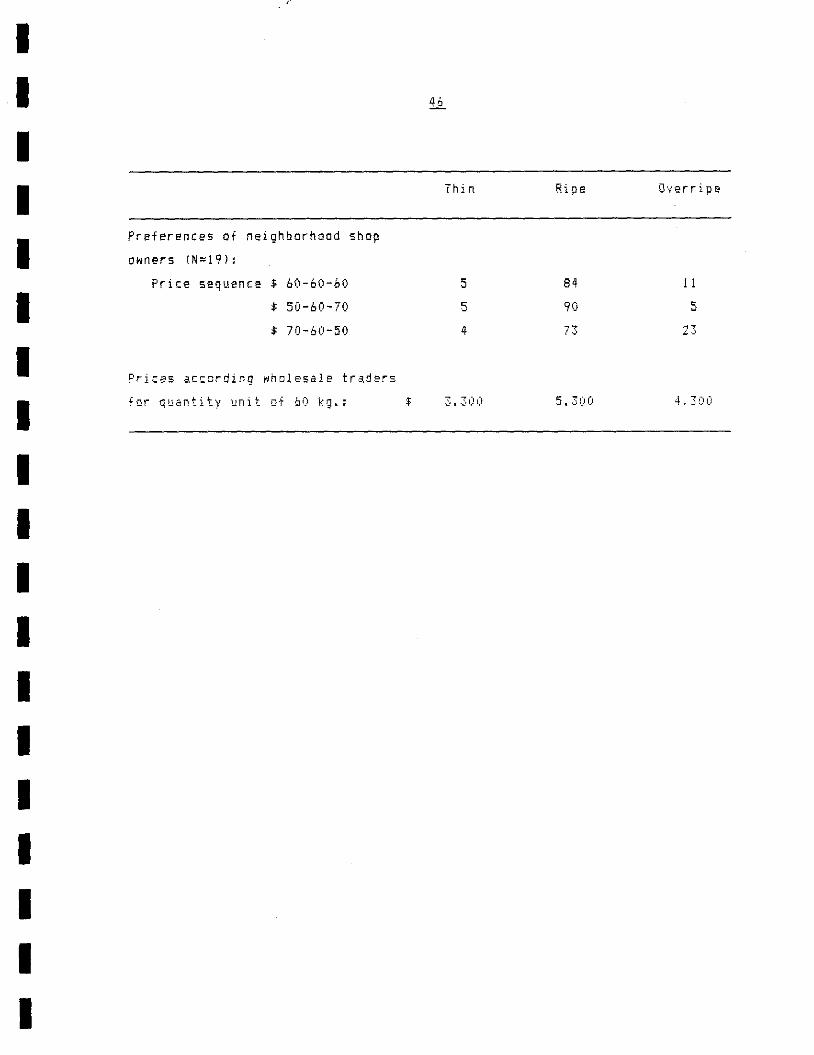
I I I I I I I I I I I I I I I I I I I
PreferElnces of neighborhoad shap
Qwners IN=19) ,
Price sequen ce $ 60-60-60
$ 50-60-70
$ 70-60-50
Prices according wholesale traders
for Quantity unit of 60 kg.:
Thin Ripe Overripe
5 84 11
5 90 5
4 73 "' ..;; .~,
$ 3.300 5 . . 300 4, -300
I I I I I I I I I I 1 I I I -1 1 I 1 1
8 ATTITUDES TOWARDS SNAP BEA~S
8,1 Attitude medsurement through statements
Sesides of the vegetable purchases, snap belns haven't bean Jooked at
in relation to other v~getable5. As is shDwn in chapter 5.2, there are many
substitutes for snap beans. To highlight the special features Df snap beans
in cDmparison with other vegetables, attitudes were measured through a
method that is described by Janssen. People Mere given tards with the names
of five praducts; snap b~ans, fresh peas, spinach, carrots anct red ~eets.
Then general statements were read out and the people were asked to name the
products that, according to them, were in agreement with the statement. Each
persan Nas presented fifteen statements. A comparison between the oroducts
can now be made by the sum, or percentages of agreements (Janssen,1986). The
statements deal with the most important features of vegetable consumption 1
like relative pric~s, nutritive value and quality.
A disadvantage of this method is that it doesn't allow to measure
intensity, because the respondents on1y can give a positiva or negativa
response. FurthermDre~ there is no weighing of the importance of the
statements, so that it is impossib1e te estimate a final, overall attitude
per consumer par crop. A big advantage! however, i5 the mínimum of time
needed te cDllect the data (Janssen,1996),
TabIe 26 shaws the percentages of agreements. The response on a
statement is assumed to be independent from the responses on other
statements. Therefore the percentages oi agreements per product per
statement are expected to be normal distributed. The significant differences
between the values then can be determined as follows:
po - p, • significant with a prebability "X' if,
po - p,
I I I I I I I I I I I I I I I I I I I
where t n = t-value Qf significance t with prabability IIX H and n degrees
Qf freedom l
and po and PI = ratios of agreements for the traps compared ln the
.nalvz~d statements.
With 120 observation the Rlnimum significant difference .ith 95% prabability
WQuld be 0,107. With 20 ohservations the significant difference _Quid be
0,208.
Snap beans, together with fresh peas anti carrots, are saio to +Qrm
an imoortant part in the vegetable consumption (1). People think that the
prices of snap beans, together with carrats\ spinach and red beets are
moderately low, while the prices of fresh peas are thought to be very high
(3). If, however, prices lower dowo, ar if the budget is higher, peoole wan:
te buy more snap beans, fresh peas and carrots (5,13),
The taste of snap beans and fresh peas is said te be excellent l while
the taste of red beets is much 1255 appreciated (4). Snap beans 1 tagether
with carrots are alSD used for special occasians, but fresh peas are ~Dre
fit fer this. Spinach ind red beets are hardly used fer special occasions
\ 6) •
The idea 01 veg2tables is that they are healthy. This j. part!cular
true for carrots and less true for red beets (12), The idea about vitami~s
is more cr less the same. that particular carrots contain a lot Di vitamins
and that red beets are thought to contain much less vitamins (8). In the
same Nay people think that vegetab12s are good for the growth 01 children.
Of earrots ehjldren grow th. best and 01 red beets ehildren grow le •• 1141,
lt is striking that it js .lso thought that the children 0150 like c •• rats
the most and red beets the l~ss (9). Snap beans are ln ali these cases
thought to be around the average, together with fresh peas and spinleh.
Vegetables are nQt thought to be very heavy in digestion. Snap bedn5
and fresh peas are thought to fil1 more than spinach, carrots, or red beets
(7 ).
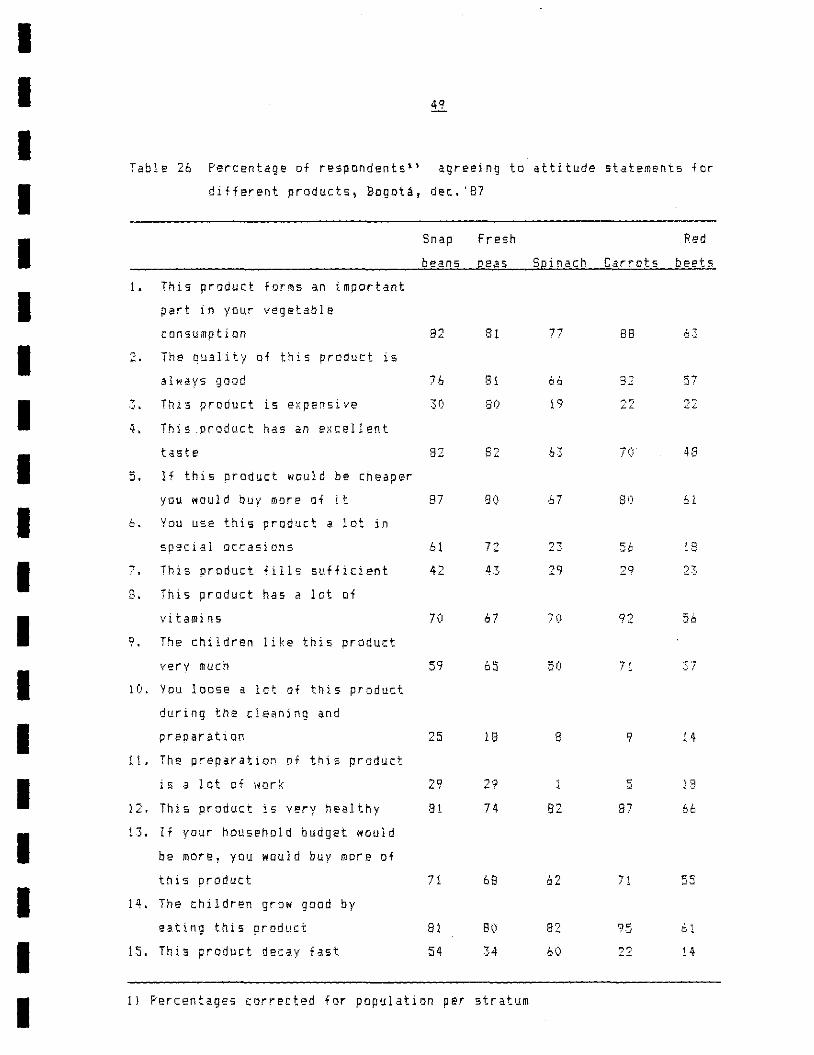
I I 49
I Table 26 Percentage Df respondents l ) agreeing to attitude statemE'nts f oc
I dífferent products, BD9Dtá, det.'87
I Snap Fresh Red
beans (2eas SQinach Carrots bepts
1. This praduct f oc ms an i mpDrtant
I part in your vegetable
-consumption 92 81 77 88 6·3
I 2. ihe Quality of this produJ:t is
good 7' 81 57 always ,0 66 8 7
I , Th i s product is e}~'p-ensi ve 30 80 19 "",,...., 2: '.l. ~~
4. Tnis .product has dn e:<eeJJent
I toste 82 82 ,b .3 70' 48
5. lf this product "ould be cheaper
you would buy more of i t 87 80 67 80 61
I 6. You use this produc:t a lot in
special QCC3S10ns 61 72 "' ,t...;; "' eJO 18
I 7. This proóuct fi 11 s sufficient 42 4.:' 29 29 '), ",,'':
8. This praduct has a lot Df
I vitamif15 70 67 70 92 56
9. The children lHe this product
'{ery much 59 65 50 71 '.7
I 10. You loase a lot af this produd
during the cleanlng and
I preparatio!l 25 18 8 9 14
11. The preparation of this product
I i s a lot of \~ork 29 29 5 19
12. Thi s praduct i 5 very healthy 81 74 82 87 66
I 13. lf your househDld budget would
be more, you wauld huy more of
this product 71 68 62 71 55
I 14. The children gro. goad by
eating thís prODuct 81 80 82 O" , . .1 61
I 15. This product deca,y fast 54 34 60 22 14
I 1) Percentages corrected f or populatian per stratum

I I I I I I I I I I I I I I I I I I I
Snap beans and spinach are thought te decay moderately ~ast, The other
three products show less problems for its decay and ji is the less for red
be.ta liS). The qUllity, however, Is thouqht to be the less stable for red
beets anti also for apinlch.
lhe people have the idea that the quality of carrots, snap beans •• ti
frash peas 15 good and stable (2). Thase three vagetables are alsD th. thr ••
that form the most impartant plrt in vegetable consumptian.
During the cleaning
losses 0+ the products.
and preparation, people do nDt experience
The losses are particular low for spinach
carrots, and the highest for snap beans (10). The preparation of snap
3190 take more work than the other vegetables, although it still isn't
muen (11).
big
3nd
bears
very
For sorne statements there appears to be differences in percentiges Qt
agreements between the socioeconomic strata. The concsrning statements are
those with numbers 5 i 6,9,13 and 15 (table 27). lf pri:es are lower, or if
the budget is higher, than more of the people from the lawer SOCIDeconomlC
strata will buy more vegetables, than of the higher strata. A!so in the
lower strata, vegetables are more for special occdsions than in the higher
strata, with an exreption for the lowest stratum. Remarkable is that in the
laNer strata more people think that the children like vegetables very much,
than in the higher strata. Furthermare it appears that in the lower strata
more people have the idea that they loose mueh of the vegetable product5,
when cleaning and preparing them, than In the higher str.t •. And .150 in the
lower strata more.people say that vegetables putrefy fast, than of the
higher strata.
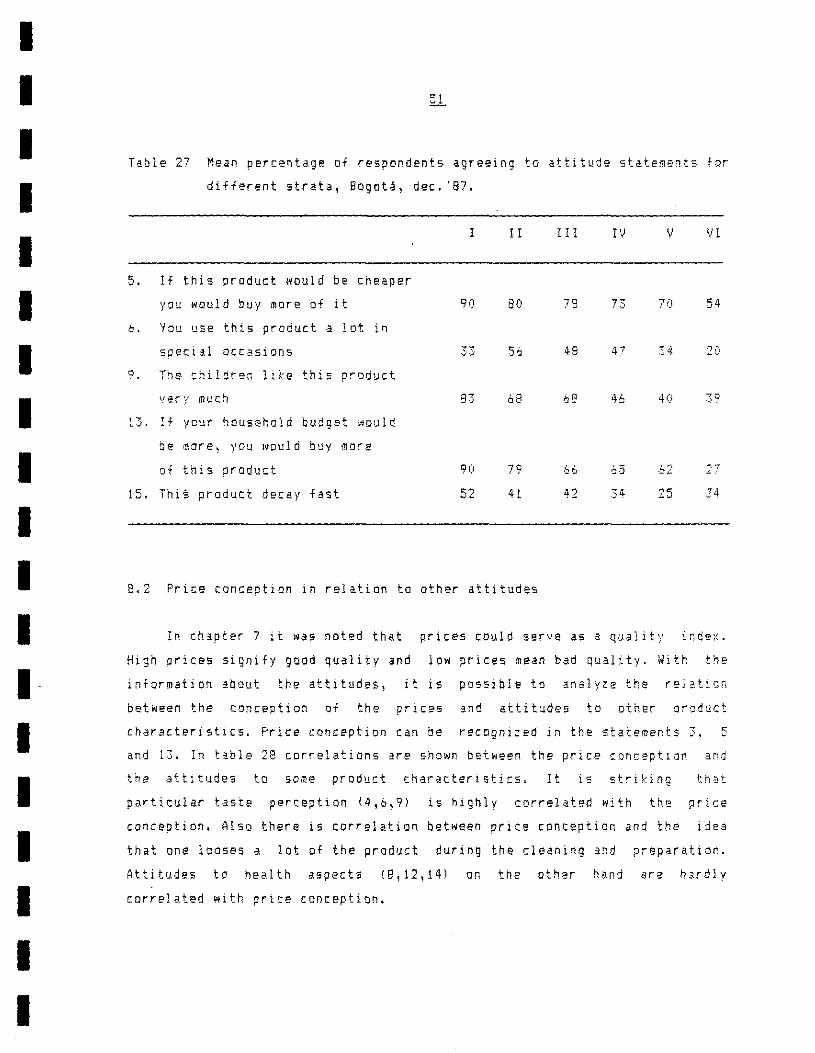
I I I I I
TabIe 27 Mean percentage af respondents agreeing to attitude statements for
different ,trata, Bogotá, dec. '87.
11 III IV v \11
5. Jf this praduct would be cheaper
I you wpul d buy more of i t 90 80 78 73 70 54
I I I I I I I I I I I I I
6. You use this product a lot in
speci31 Qccasions <:':" "..,-.) 56 48 47 34 2:)
9. The children like this product
ver '{ much 93 6.8 68 46 40 39
13, If your househald budget WDuld
ce more, you WQuld huy more
af this praQuct 90 79 S6 65 .b2 -=7
15. Thl~ product decly fast 52 41 42 34 25 ,4
8.2 Price canception in relation to other attitudes
In chapter 7 it was noted that prices could serve as a quality indexo
High prices slgnify goad quality and ¡OH priees mean bad quality. With toe
informaticn about the attitudes, it is p05sible to analyze the relation
between the conception of the prlces and attitudes to other pfoduct
characteristics. Price con~epticn can be recogni:ed in the statements 3, 5
and 13. In table 28 correlations are shown between the price conceptiJn ard
the attitudes to sorne product characteristics. It i5 striking that
particular taste perception (4,6,9) is highly correlated with the price
conception. Also there is correlation between price conceptian and the idea
that one lcoses a lot of the product during the cleaning and preparation.
Attitudes te health aspects 18,12,141 en the other hand are h3rdly
correlated with price conception.
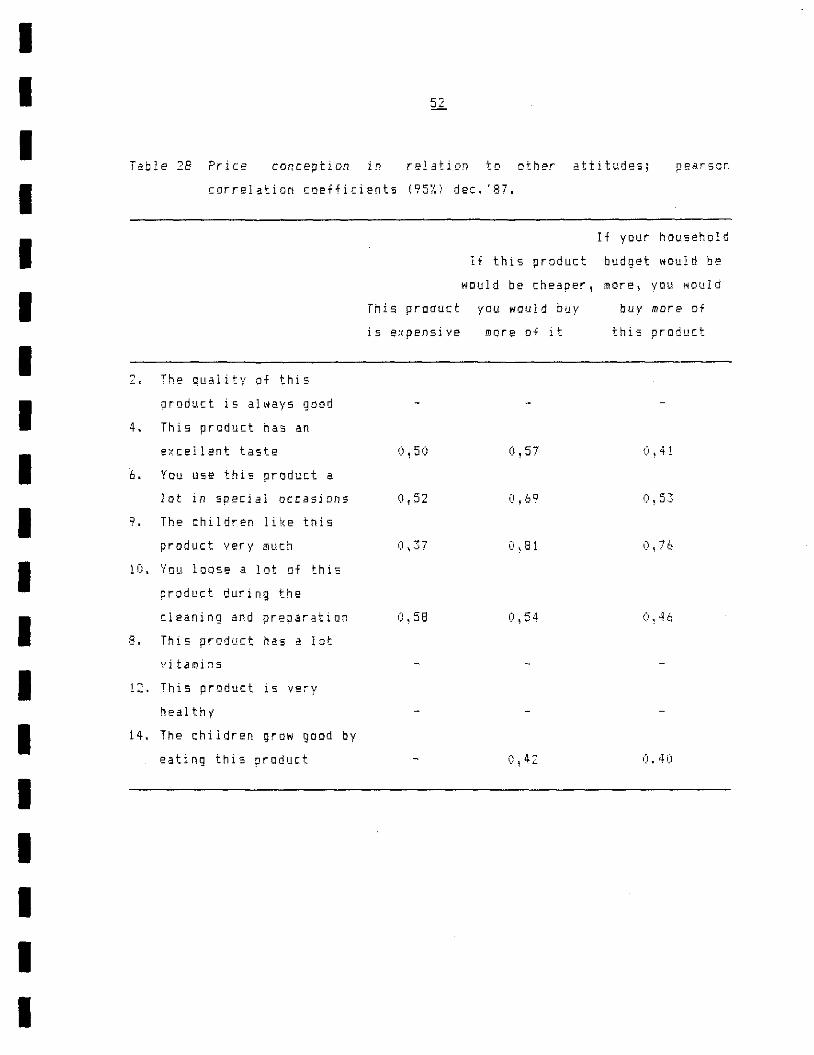
I I I I I I I I I I I I I I I I I I I
Table 28 Price conceptiDn in relation to other attitudes; pearson
correL~!.tion coefficients (95:0 det. '87.
4.
6.
The quality of this
product i5 always good
This product has an
excellent taste
You use this product a
lot in special occdsions
9. The chilaren like this
product very much
10. You loase a lot of this
product during the
cleaning and preparation
8. This product has a lot
vi tami ns
12. This product is very
healthy
14. The children grow goDa by
eating this product
Th í 5 product
i s ex pensi ve
(1 , 50
(J , 52
(1 , 37
(! \ 58
1 f thís product
would be theaper,
yau wOlJld buy
more of it
o , 57
o , 69
o , 8 1
0\54
O~42
If your household
budget would be
more} you 1'1 IJ ttI d
buy mDfe Di
this product
o , 4 1
o) , o' ,J-";,
!) " , ! a
0,40
I I I I I I I I I I I I I I I I I I I
8.3 Underlyinq patterns and its relation to consumption level
The percentages of agreements per trap per statement Here treated in a
factor analysis, wíth the varímax proeedure, to elarify the underlYlng
patterns ef the anSHers. The fírst two statements (1 a"d 2) were 1eft out 01
the analysis, beeause they didn't hlve a direct relatiDn to appreeíatíon 01
the specific product characteristics. The analysis prcduced four factofs j
which were oble to explai. 79% of the communality of the original matr,.
with statement scores. Table 29 shows the loadings Df the original
statements on the tour factors. The interoretation of the four ~actors is as
follows;
Factor 1: "being favorite l', aS50ciated with statements 5~619 anj 13;
Factor Z~ ugood for health 11! associated with statements 4~8,12 and 14;
Factor ~: "buying and preparatioo inconvenience " ¡ associated with statements
3,10,11 and 15;
Factor 4: "heaviness " , associated with statement 7.
How the five craps score en the factors is shDwn in table 30, Snap
beans appear to be around the average far being a favarite vegetable.
Carrats are the most favcrite, while red beets are the le55 favorite. Snao
beans seDre good on being good for health. Carr"ts, however, are thaught to
be better. Spinach and fresh peas are around the averdge~ while red beets
score ver y low on being good far health. Snap beans and fresh peas score
high on the buying and preparation inconveniency. Less inconvenient are
spinach, red beets and particular carrots. Snap beans and fresh peas sccre
also high an the heaviness factor. CarrQts and red beets are thought to be
less heavy and spinach scores very low Qn this factor.

I I I I I I I I I I I I I I I I I I I
Table 29 Underlying patterns in the attitude measurement; factor loadings
Qf the attitude statements.
Flctor 1 Factor 2 Factor 3 Factor •
l. 1f this product wDuld be cheaper,
you wot..d d huy mere of i t O!88 O~15 0,33 (;! l·}
2. You use this product • ! ot in
special occa.sians 0 , 59 0!04 0,47 i)!40
~ o. The chiláren like this produ:t
very much (I,B4 1),30 i), 1 4 -(J1 06
4. 1f your hOU5E'hold budget would
be more, )/011 would buy more
of this product 0,94 0,05 i) 1 11 -0,04
e c. This product hls dn exc!?l ¡ E'nt toste 0,31 0,67 Oj53 0.23
6. This product has a ¡ ot of vitamins O~Ol O¡92 -0,10 -(\ (¡R "' \ "."..."
7 , This product is ver y h.llthy l),0.3- 0,96 -i)!05 0,07
8. Th. children 9 r Cl\~ good by eating
this product 0,40 0,86 -1),12 0.09
9, Thi5 praduct 15 expensive 0,30 -0\1)6 0\70 0,07
11). You loase a lot of this product
duríng the cleaning and preparation Of37 -O) 1 (1 (l\78 -(J;!.~
11. The preparation Qt. this product
i s a lot of work _(1 (lQ ,.,,.. , -1), 14 0,74 O~25
12. Thi5 product decay fast 1) ,le O~25 ¡)~47 -0,34
1.3. This product fi 11 suffic.ient 0,07 (¡ , 1 3 O}O8 !),9~
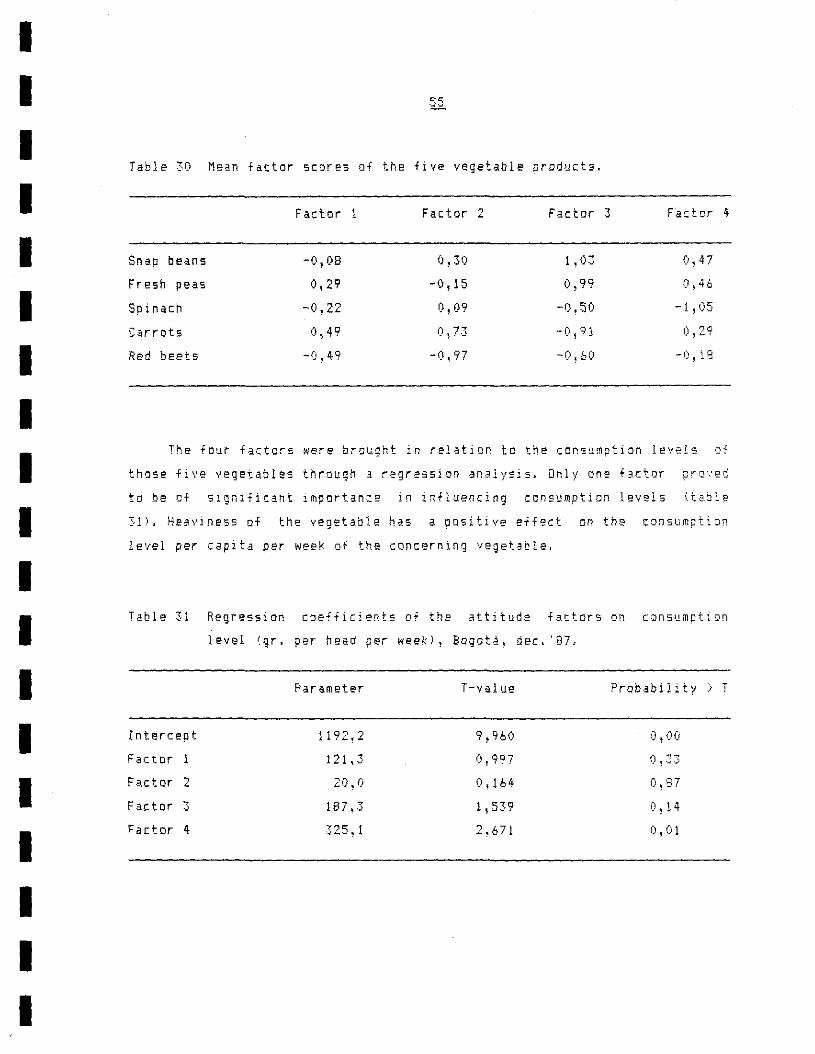
I I I I I I I I I I I I I I I I I I I
rabIe 30 Mean factor scores of the five vegetable products.
Factor 1 Factor 2 Factor 3 Factor 4
Snap beans -0,08 0,30 1 , í) 3 0,47
Fresh peas 0,29 -0,15 0,99 (1,46
Spínaeh -0,22 0,09 -O~50 -1,05
Carrots 0,49 1),7.] -Oj91 0,29
Red beets -O~49 -0,97 -0,60 -O, i 8
The four factars were brauqht in relation to the tonsumption levels af
thcse five vegetables through a regression analysjs~ On1y on~ factor preved
to be cf significant importance in influencing ccnsumption levels {tajle
31), Heaviness 0+ the vegetable has a positive eff~ct Dn the consumption
level per capita per week of the concerning vegetable.
Table 31 Regression coefficients Di the attitude fattors on ccnsumption
1 Evel ~gr. per head per week) 1 Bogotá, dee.' 87.
Parameter T-yalue Probabjlity > T
Intercept 1192,2 9,960 0,00
Factor 121,3 O!9~7 (J \ .33
Fa.ctor " 20,0 <),164 0,87 ~
Factor 3 lB7 ,.3 1,539 0,14
Factor 4 325,1 2,671 0,01

I I I I I I I I I I I I I I I I I I I
9 EXPLANATION OF SNAP BEAN
SOCIOECONOMIC FACTOR S
CDNSUMPTION BY THE ATTITUDES AND THE
9.1 The madel far e.plaining consumption
Consumption level is seen as d result of the living standard~ family
composition, urbanization and attitudes. The living standard enrIasEs
education level, household budget for foad, other household expenditures
(like transport,
Dccupation(s) of
housing, id.), income,
the household members.
properties, public services and
But thOS2 variables are highlv
correlated with each other , which makes it impossible to put more than one
variable in a regression modela Most often income is taken as the variable
that determines most of one's living standard and that therefore El:plains
most of one's consumption level. But, Df course~ this is a limitatian of the
explanation possibilities. The influente of the ather variabl~s cannot be
taken into account, but also income isn't as straight forward as the living
standard. For e"ample, in a family with high incomes, but .150 high debts,
foad expenditures and consumption level of certain food5 can be low. Or In
the other way areund, a pensioner, who hardly has an intorne, :3n have nice
saving aCCDunts which make it possible te spend a let of money en foad. In
the case of this st~dy! however! there was direct inforrnation available
about the living standard of the households in certain are3S. The
information conceros an index, called l'the quality of life in the area ~f
Bogotá " , which
occupatian level,
entlase the following
employment, housing,
variableSi household intornes,
public services, and illiteracyl)
1) The score of each variable was determined by comparing thern with the
highest and lowest level, found in Bogotá. All those scores "ere put in
an equation that produced the indexo The index then is a percentage
score, whith is low, if the scores of all individual variables are low,
and which is high, if all those individual score. are high. In Bogotá the
variation is between 221 and 971. On the base of this inde., a
stratilicatian into si. levels is made for all the areas in Bogotá. These
can be called the sacioeccnamic "trata. It is this stratification, that
is used for this study.
I I I I I I I I I I I I I I I I I I I
IDAPD,1986). So, this inde. is preferred for explaining the conS"mptiDn al
snap beans. Although information was also obtained about education level¡
and household expenditures, it all appeared to be high!y correlated with the
"quality Df life ll index 1 ),
01 the household characteristics, there 1i3S information about the age
01 the housekeeper, mean age 01 the hausehold members, number of people ~)ho
participated in the mea15~ and the number 01 people younger than 15 years
~Jh o participated in the meals. Only the total number Ot people, wMo
participated in the meals wasn't correlated with the living standard inde~,
and therefore appropriate far the regression analysis.
Urbanization was made operational through a variable that enclosed tne
number of veirs that the household was established in Bogotá. This variable
wasn't correlated Hith the living 5tandard~ nor with the number "oi
participants in the household meals.
There was information about the attitudes through the statements. Those
statements can be transformed into dummies, tD make them appropriate for the
regression analysis. There are, howEver l 15 dummies, corresponding !.'iÍ th the
15 statements, which is quite a lot to put them a11 in the explanation
modelo As is shown in the previous chapter, there are four uncterlying
patterns (factors) in the attitudes. Although the factors cannot be used
directly on the original observation 1eve1, they can be used indirectly tD
1 ) The inde:{ 1;111 be di ff i cult to interpret in its influence 011
consumption. HlJrl!~Yer , it isn't important for CIAT to know the e}~act
influence of income , hOLlsing, education, id .. In stead al t h at , the
strength of the effect of the living standard compared with the strength
of effect of the attitudes about product characteristics is more
interesting,

I I I I I I I I I I I I I I I I I I I
indicate which statements can be chosen far the regression ffiodel 1). Of each
factor one statement was taken in a way that they didn't correlate with each
other, nor with the aboye mentioned variables. The following statemen~s are
choseo:
1. You use this product a lot in special occasioos;
2. This product is very healthy;
3. The preparatioo af this product is a lot oi "ork;
4. This product fills sufficient.
9.2 The results Qf the analysis
It was expected that the influence cf the attitudes on consumptl~n of
snap beans
:oefficients
[ould differ
are cDmputed
between
at three
the strata.
levels of
Therefore regression
50cioeconomic stratu~;
low=stratum 1+2; middle=stratum 3+4; high=stratum 5+6. The results of tne
analysis are shown in table 32. The model explains 63% of the variance and
the F-value = 13,2, ~hich means that the overall value of the model is good.
Hcwever, when there is made a closer look into the model, than it can be
noted that for sorne variables, there is a high degree of unreliability,
particular tor the attitude variables~ For this reason each attitude
statement "as taken apart in a regression analysis, together with the living
standard and the number of participants. The number of years in Bogotá is
left out, because it didn't haya any effect at all.
It first can be noticed that the influence of the attitudes is
relatively of small importance compared with the living standard ~nd the
number 0+ meal participants. And second it is notable that the effects of
the attitudes on consumption af snap beans is the highest in the high strata
and the lowest in the middle strata. In chapter 3.1 it was hypothesized that
the effect of the attitudes would be the lowest in the low strata.
1) The tactors are constructed nn aO aggregated leve!, in which percentages
of agreements were used. This WdS necessary, becduse factor analysis onlv
can be done on interval variables. So factor scores of the individual
heuseholds cannot be computed.
I I I I I I I I I I I I I I I I I I I
If the vegetabl~ proóuct is a favorite one than consumption of that
product rise. This positiva effect i5 the strongest in the low strata.
Consumptian of snap beans than rise with 168 gr. per head per week. In the
middle strat. the riBe is about 88 gr. per head per week, and in the high
str.ta the effect is small and the coefficient is unreliable. Far this
attitude also the number of meaI participants must be taken ioto accQunt~
Each additional persan lowers consumption with 14 gr. per head par week.
The importance of the heaviness of snap beans appears tD be low.
5triking is however that it has a positive effect in the low strata (+137
gr. per head per week) anO a negative effect in the high strata (-83 gr. per
head per week). There 15 no affeet in the middle strata. Also there i5 no
effect of the number of meal participants en the snap bein cansumption 1 lf
lt concerns the attitude abaut heaviness.
The importance of the buying and preparation inconvenience is lcw.
has hardly, or no effect in the middle and low strata. The inconvenience
Dnly effects consumption leve! in the high strata. Consumption of snap beans
lowers then with 158 gr. per head per week. This happens without influence
0+ the number of meal participants.
The ~ttitude about the snap beans as beinq good far health is the most
important of the four. Striking is that this attitude has a positive effect
on consumption of snap beans in the low strata (+122 gr,) and a negative
effect o in the high strata (-182 gr.). These effects , however, must also be
seen in the light af the number of participants. Each additional person
means a drop of 23 gr. per head per week.
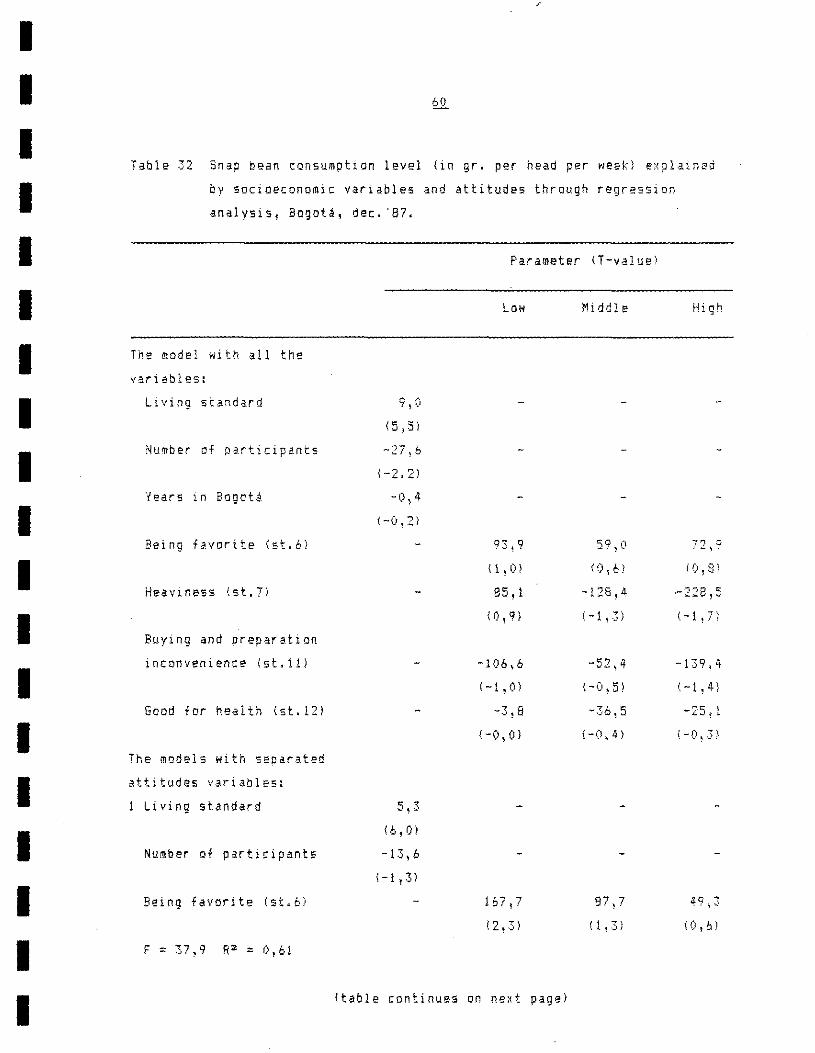
I I I I I I I I I I I I I I I I I I I
Table 32 Snap bean consumption level Un gr. per head per weak) e;<pl.ained
by socioeconomic variables and attitudes through regressiol1
analysis, Bogotá, dec. '87.
TMe model wi th all the
variables:
Lt vi ng st andard
Number of participants
Yous ln BogoU
Being favorite (st.6}
Heaviness {st.7'
Buying and preparation
inconvenience Ist.111
Good for health (sL121
The models with seoarated
attitudes variables:
1 Living standard
Number Qf participants
Being favorite (st.6)
Parameter (T-valuei
-27,6
(-2.2)
-O~4
5,3
(6,0)
-13,6
\ -1 ! 3)
Low
93 1 9
( 1 , 1) )
85,1
(0,9)
-106,6
( -1 , O)
-3,8
(-0,0)
167,7
(2, ,3)
(table continues on next pagel
Middle
59,0
(<); 6)
-128,4
(-1, :3)
-52~4
(-0,5)
-.36,5
(-1)\4)
87,7
High
72,?
(1) 1 8)
·-228,5
( - 1 -, ! j !
-139.4
(-1,4 }
-25~ 1
{-O l':;)
49,3
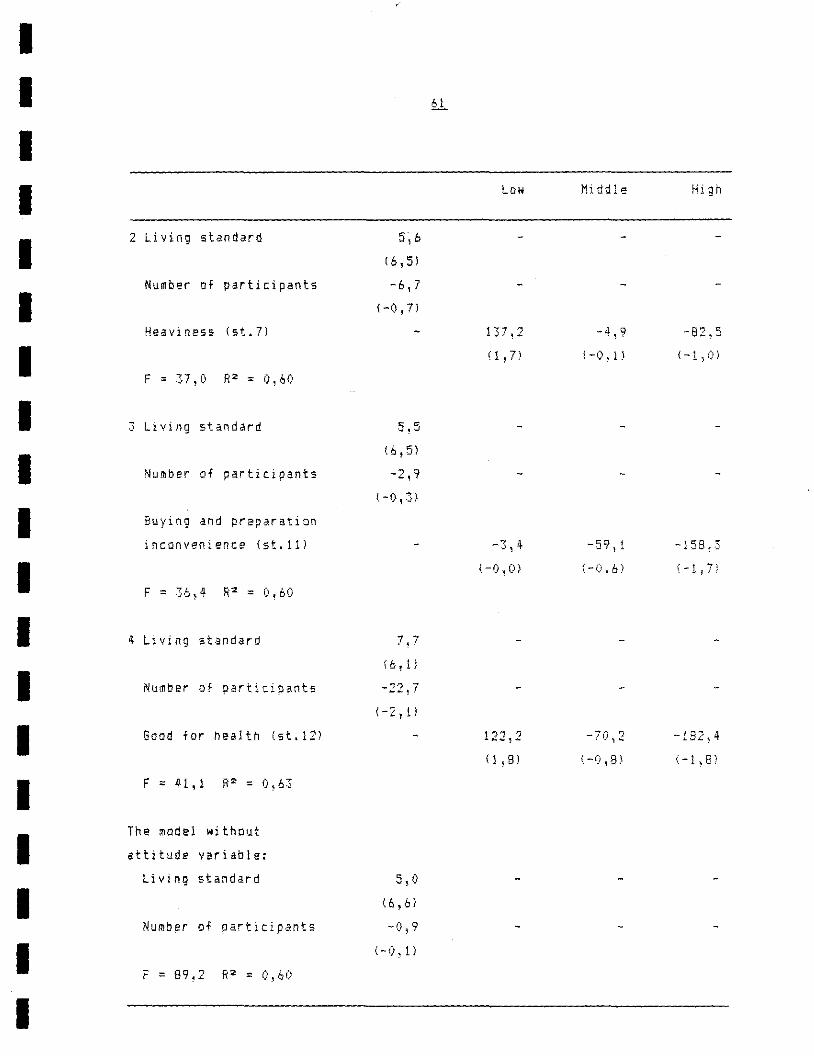
I I I I I I I I I I I I I I I I I I I
2 Living standard
Number of participants
Heavi ness (st. 7l
F • 37,0 R' = 0,60
3 living standard
Number of participants
Buying and preparation
inconvenience \st.1U
4 Living standard
Number of participants
Goad for health CsL 12)
The model without
attitune variable:
Living standard
Number 0+ participa.t.
F = 89,2 R2: 0,60
5,6
(6,5)
-6,7
(-0,7)
(6,5)
-2,9
/. -O. 3:\
7,7
í6, U
-22,7
(-2 , 11
5~O
(6,6 j
-(1,9
(-0,1)
Low
137 1 2
(1, n
-3~4
(-OtO)
Middle
-4,9
(-O; 1)
-59,1
(-O ~ 6)
l.-O ,tP
High
-82,5
(-1 , I)}
-158~.2·
(-1 f 7;.
-lB2~4
(-1,8)
I I I I I I I I I I I I I I I I I I I
10 SUMMARY AND CONCLUSIONS
10.1 The results in response to the hypotheses
The total consumptlon of vagetables Is indeed lOMar in the la •• st
loclneeo"amir strata. Veaetable consumptlan, ha.ever, Is nat the hlghest in
the highest strata, but in the rolddle strata. Probably aeople switch on
0ther foad products, ior example meat, if the living standard risss even
more. Results from a natíon ~ide consumption study, however¡ indicates a
cantinuous higher level of vegetable consumption with rising incomes (Duque,
1984), The types Qf vegetables that differ between the strata in t~~
quantity in which they are consumed, are almost in accordance with what was
~Kpected. Lentils are the ~heavyn vegetables that are consumed ~ore in the
lcwer strata and less in the higher strata. Of the so-called "wateryn
vegetables, spinach, lettuce, tomatoes 3nd onions are ccnsumed more in the
higher strata and less in the lower strata. Carrots and fresh peas, however,
are also consumad more in the higher strata, although they are more l'heavv "
than "wateryo. Snap bean consumption doesn't differ b~tween the strata. In
the IDwer socioeconomic strata! however\ there is sorne more preference for
the very ripe snap beans, than in the high strata. In the hlgn
sacioeconomic strata there is on1y preference far the common ripe snap bean
2nd no preferente far the thin, nor for the very ripe sndp beans.
As far prices! three times as manv consumers in the low socioeconomic
strata prefer low prit~s te good quality aspects, than tonsumers in the high
sociaecanomic strata. The same 1S true for neN vari?ty characteristics,
that thr~e times as many CDnsumers in the low socioeconomic strata prefef
the low prices of new varieties to the common, more expensive variety.
Although consumers fram the lawer strata agree easier with lower quality (as
long as the prices are lowar), they do not show more problems wíth
conservation time, nor losses. They bUYt however, more frequently, than
consumers frDm the high socioeconomic strata.
Consumption leve! of snap beans cln be e.plllned to a high dagree by
the living standard Ithat is Income, education leve!, occupatian, íd.l. To a
I I I I I I I I I I I I I I I I I I I
less degree attitudes effect consumption. However, it is not true that the
ctegree of effect cf the attitudes rise with sociaecanomic stratum. Although
the heaviness of the vegetable is nf most impDrtance in the consumption 0+
vegetables in general~ it 1S 0+ less importance for snap bedns. In the low
strata people consume 137 gr. snap beans per head per week more, if they
think that snap beans fill good. In the high strata, on the other hand,
peaple consume 83 gr. less. The inconvenience of snap beans, far part of
buying anO prep3ring, ís only cf importance for the tonsumers in the high
strata~ People then eat 158 gr per week less. [f the people look at the
vegetable as favorite in consumption, than the consumption rise with 168
gr. in the low strata and 88 gr. in the middle strata. In the high strata.
this attitude daesn't matter. The attitude about snap beans, as being gcod
far health, is the attitude of most importance in the explanatiao 0+ the
ccnsumption level. In the low strata f however, people then consume 122 gr.
per week more, while in the high strata they consume lB2 gr. less.
In the four lowest strata, there are more than three times as less
famiIies per trader, than in the tWQ highest strata. 1he traders, who
operate in the lower strata, however , deal in small quantities. Principally
they are neighborhood shop awner~. In the highest strata~ it are mainl~
supermarkets, wha provide the vegetable demando Supermarkets deal in big
quantities.
Although this study didn't include a collection of consumer pri:es) it
is generally said , that supermarkets are more e~pen5ive, than other types of
outlets. This is in agreement with what is known abaut their market policy.
As was expected, consumers froID the lDw socioeconomic strata buy parti:ular
in neighbDrhDod shops and market places, whiJe consumer; form the high
strata buy tD a great extent in supermarkets. The relation of pureh.sed
quantities in the traditional outlets with purchased quantitie5 in
5upermarkets! in the lowest stratum up to the highest stratum, is
respeetively 9:1. 6:1, 4:1, 4:1, 2:1, 0,5:1.
In how far retail traders dare to manage low prices at the expense of
gaod qUllity i. diffieult tu sayo All, exeept tWD, af the vJlited retail
I I I I I I I I I I I I I I I I I I I
traders (e:ccluding restaurants) said to prefer te deal in snap beans 0+ good
quality. One retail trader said to prefer to deal in two different qualities
with different prices and one said to prefer low quality for being able to
sell at ID. priees. He .as indeed ane of the fe. retail traders, ~ho had
snap beans 0+ really bad quality. Most af all retail traders had snap beans
of tolerable, or good quality. So, it appears indeed th.t most retail
traders don't like, and avoid, to trade in cheap snap beans of lcw quality.
Ha"ever, this eouldn't be proved through the data. fro'm this stc<dy.
TO examine the degree of free entry in vegetable/snap bean trade! dat}
were collected about years of education, age, years in business. years en
actual place and cests. It appears indeed that a lawer degree of free e~trv
i5 caused by the higher risks of specialization. Wholesale trade! retail
trade in the mobile market system, or a business in the restaur3nt sector
are the most difficult to start with. Retail trade Dn market pIares prDv~~
already te be easier and the easiest is te open a neighborhood shop. The
margins, however, are more or less equal tor al1 types of individual
traders, that is around $ 13.00 par kilogram~
In the campetition between consumptian and within restaurants,
restaurant Dwners are less exigent on the quality of snap beans\ th!n
housewives. Also the portioflS of snap beans are smaller. In the household
consumption, partions in soup, dish and salad are respectively 60 gr., 81
gr. and 95 gr .• In restaurants, portions are respectively 7 gr., 38 gr. and
21 gr •. The number of preparations of snap aeans in restaurants SEems to be
a little bit higher, than in the households. The result, howEver, is that
7,5% of all the meals, being taken out af the hOliS!?, correspond with about
2% af the total snap bean consumption.
10.2 Implicaticns fer vegetable marketing and consumption research
In chapter 1, the typical characteristic5 of vegetables in marketing
and consumption were highlighted. Sorne impertant conclusions can nQW be made
for further vegetable research. First of all a thOfOUgh understanding of the
tvpical characteristics of vegetables in marketing and cansumption must be
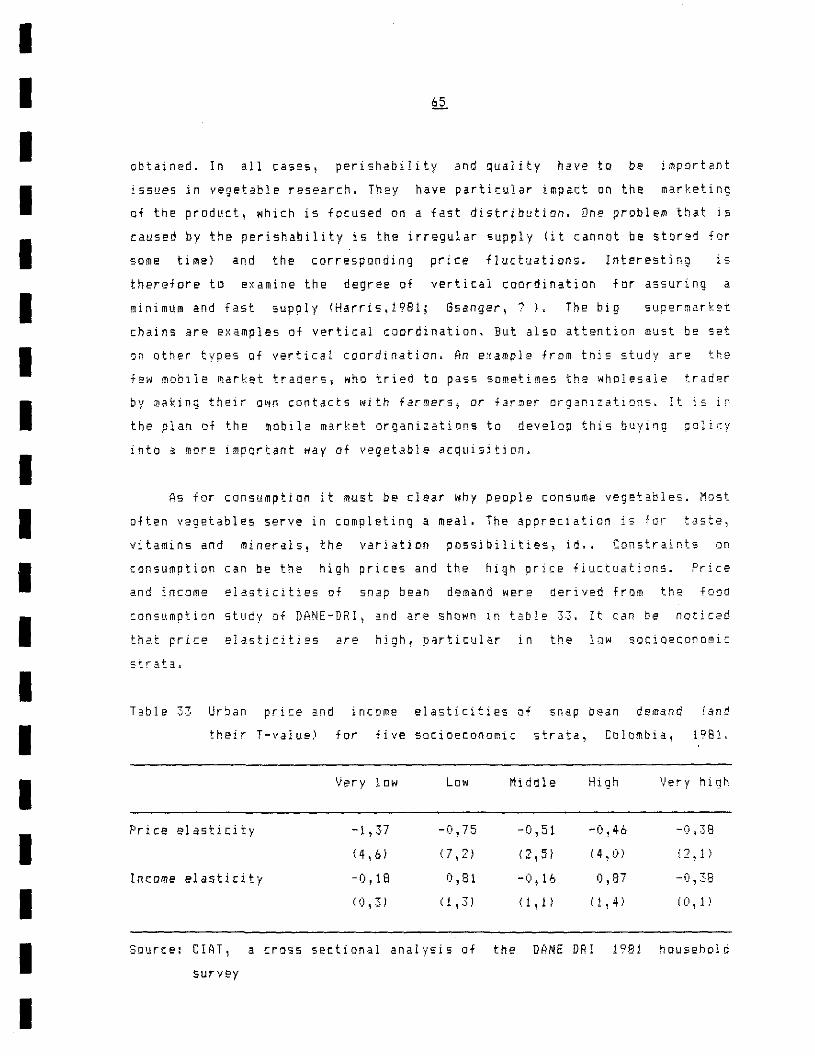
I I I I I I I I I I I I I I I I I I I
obtained. In all cases, perishability and quality have to be impcrtant
issues in vegetable research. They have particular impact on the marketing
of the product, which is focused on a fast diotribution. One problem th.t i5
[aused by the perishability io the irregular supply (it cannot be storeó f or
sorne time) and lhe corresponding price fluctuatians. lnteresti n9 is
therefore to examine the degree of vertical coordination for assuring a
minimum and flst supply (Harris.1981; Gsanger,?). lhe big slJpermarket
chains are examples of vertical coordination. But alsD attention must be sat
sn other types Qf vertical coordination. An e~ample froffi this study are the
few mobile market traders J wha triea to pass sometimes the wholesale trader
by ]aking their own contacts with farmers, or farmer organlzations. It is in
the plan of the ~obi12 market organizations to develop this buying paliey
into a more important way af vegetable acquisition.
As far cansumption it must be clear why people consume vegetables. Most
often vegetables serve in completing a meal. The appreciation is far t~ste,
vitamins and minerdls, the variatiDo pD5Sibilities~ id .. CQnstraints on
consumption can be the high prices and the high price fluctuations. Price
and income elasticities Df snap bean demand were derive~ from the foad
consumption study of DANE-DRI, 3nd are shown in table 33. It can be roticed
that price elasticitiss are high, particular in the low sociaeconomic
strata.
Table ~~ Urjan price and incorne elasticities of snap be3n demand (and
their T-value) for five socioeconomic strata, CDlombia, 1981.
Very low Low Middle High i)ery h i gh
Price E'la.ticity -1,37 -0,75 -0,51 -0,46 -0,38
(4 \ 6) (7,2) (2,5) (4 \ ¡)) (2,1)
lncome elastidty -0,18 0,81 -<),16 0,87 -0,38
(0,3) (\,3) 11,1) (1,4) (O, 1 )
SOlirce: CIAT, a cross sectional analvsi. of the DANE DRl 1981 household
survey

I I I I I I I I I I I I I I I I I I I
An important Ispect whith appears from aboye mentioned~ is haN the
market channel reacts Dn the enormous fluctuations in demand caused by the
high priee elastieity and the high peiee fluetuations. Jf priees double
oithin a oeek, what is ver y normal in the snap bean mBrtet, than theee Nill
be a big fall do"n in demand in the low income strata and a smaller fall
dowo in the high strata. And in the other "ay around, if priees halve, there
will b~ an enormous rise in snap bean demand in the low income strata and a
sffialler rise in the high income strata. How resol ves the market [hannel
those fluctuatíons? Theoretical it can he assumed that;
1. there are a lot of opportunists operating in the vegetable market in
areas of low SOcio9conomic stratum;
2. there are a lot of trad~rs, ~hD se!] tD poor people, if prices are low\
and who sel1 to rich peaple, if prices are high;
3. the traders in low strata manage very broad product ranges, in ~hich thev
change their issortment according to the products with low prices;
4. the traders in ION strata manage a narr~w product range and h3ve to Ceal
with big fluctuations in their weeklYr or monthly sales;
5. the poor pecple ge te other autlets, when prices are low.
This study shawed that neighborhood shops are of particular importance
for the areas 0+ ION socioeconomic standard. During the study it was
noticed that the type Df vegetabl~s~ being in the shops~ weren't always the
same. Bnap beans, although one of the main vegetables, weren't always
available, because of high prices. In the case of high snap bean prices,
shop owners buy in stead of snap beans for example fresh peas. qo\ it seems
that in the case 0+ Bogotá, the third type Qf interaction ~etween marketing
and consumption e.ists. The other four soJutions don't seem very probable.
Unfortunately, this issue waSf,'t ful1y realized befDr~ the study was
eKecuted. 50, no infQrmQ~ion was cal1ected about it.
I I I I I I I I I I I I I I I I I I I
Another important aspect for part af the price fluctuations i5 that the
information is fully dependent on the time periad of data col1ection. The
manth December differ completely fram another month in the vear.
Furthermore, data eDlleetion has ta be done,
a) in a short time, witnout negligible price fluctuations, or
b) over a longer time with measurement of wholesale, retail and consumer
prices. Price measurement, however, has to be done ver y frequently, because
prices can double, or triple, and then halve agaiA within a week.
10.3 Implications far agricultural food palicies
Food pclicies should be focused on price stabilization by de~elDping a
steadier supply. Because storage in [cId stores and such l~ke\
product more expensive, regulation of 5upply should be done in
The most appropriate wav would be through regulatian
distributioD by farmer organizations.
will ffi3ke the
another ~av.
0+ the seed
A second point of interest should be a bEtter control Di the quality. A
gradinq and sorting mechanism is! however, not easy to start. Again entranes
can be found in the seed distribution.
10.4 Implications fer improvement Di snap beans
By means of this study, several points oi interest for snao b93n
improvement have been clarified. Because CIAT try to fOCU5 his wor!~ to the
benefit cf the marginal part of the population, t~e following points of
interest are mentioned.
1he improvement may not result in beans that are less llheavyu, than the
existinq beans. It would aven be better if the improvements focus itself on
a snap bean that is thi[ker~ fuller and larger, than the existing ene.
Hawever, this mustn't go together with a high degree 0+ seed development
within tne podo

I I I I I I I I I I I I I I I I I I I
Low priC2S will favor particular consumers of the low sDciQeconc~i[
strata. CIAT there fore should focus attention to the development cf a snap
bean that has lower costs in production and marketing. This can be ~eached
by a variety that need 1e55 insecticides, pesticides\ fertllizer and
particular less work by hand 1 ), In the marketing channel, CQsts can be
reduced by a product that is less perishable.
During the improvement work, most attention far part of the
shculd be paid Dn the color (emerald green) and the absence cf dark SPC!S
~nd other symptoffis of diseases. Form and length of the snao Dean are :ess
importart. By improvement it should be avoided to end with a 5mal!, Of a
pale green snap bean. TMe best entrance far new product cHaracteristics wil1
be fer a yellow, a dotted and a flato bread snap bean.
1) The present snap beans have to climb along cords. This signiiy that each
plant has to be [arded. The result is that man labor i5 the highe5t tost
factor for farmers of snap bean5 (Dijken,19881.
I I I I I I I I I I I I I I I I I I I
REFERENCES
A.P.D. \ 1976; Economics of Food Grai" distribution: The Ac:ian Scene," Asian
Produetivity Drganization, Report of the symposium on Economies of ¡Dad
grain distribution (APO Project SYP/VI75).
Bromley, fi:ay, 1981; From Calvary to White Elephant: A Colombian Case of
Urban Renewal and Marketing Reform; Development and Chanqe 1
(77-120:' •
Bucklin. Louis P., May 1977; Improving Food Retailing in Developing qsian
Counties, Faod Policy~ 1114-122).
Caicedo, Elizabeth and Per Pinstrup-Andersen, 19BO; The Potential Impact
Changes In IncDme Distribution on Food Demand and Human Nutrition, American
Journ¿l.l,..,"¡: AqriclllturaI Eronomirs 1 Vo1.40 , no:3.
Coscia, Adolf'J A., 1980; Comercializrición de granos, Editorial Hemisferio
Sur S.A., Buenos Aires, Argentinia.
D.A.P.D., 1986; La calidad de la vida en los barrio~ de Boqotá 1973-1981 1
Departamento Administrativo de Planeación Distrital, Alcaldia Mayor de
Bogotá, Bogotá, Colombia.
Derry, B .. J. and P.L.Lund, Jan. 1985; Household Fcod Consumption: The
Influence of Household Characteristics, ~J~o~u~r~n~a~!~n~t~-~A~q~r~i~c~L~'l~+~,u~r=a~l~E~[~o~-n~o~~~_.~i~c~s.
Dewalt, K.M. Ind G.H.Pelto, 1977; Food Use and Household Ecology in a
Mexican Cornmunity, in: T.k.Fitzgeral~; Nutrition and AnthroDology in Action,
van Gorcum, Assen/Amsterdam, The Netherlands.
Dijken~ Gertruud A.van, 1988; The ¡"fluenee of thp
Environment an 5nap Sean Production and Marketing in Colombia:
in thp Sumapa: region of Colombia, Centro Internacional de
Tropical, Call, Colombia.
SocioecQnomic
Agricultura
I I I I I I I I I I I I I I I I I I I
Duque, M.C., Norha de Lodo~o and D.Pachico, 1983; Economic Factors, Fond
Consumption Pattern~ and Nutrition in Cali, Centro International
Agricultura Tropical, Cali, Colombia.
Duque, M.C. ~ Libardo Rivas, Luis R.Sanint anó Carlos Seré, April 1984 j
Consumption Patterns in Colombia - a cross sectional analvsis of the
Food
DANE
DRI 1981 household survey, in: Trends in CIAr Commodities, Internal Dacument
- Eronomirs 1.9, (31-63), CIAT, Cali, Colombia.
FAO , 1973; Develooment Di Food Marketing Sy~tems for Larqe Urban Ar=3s.
1.Latin America, Report of the technical conference on tMe development oi
foad ~arketing systems in large urban areas in Latin America, 8-17 Hay 1973,
Buenos Aires, Argentina.
FAO , 1984; Marketing Improvement in the Dpvelopina World: What Hapoens ~nd
~hat We Have L~arned, FAO Agricultural Services Bulletin 58! RDm~.
FAO~ 1985; Review 0+ fond tonsumption surveys, Food and Nutritian Paper 35,
Rome.
Forero, Yesid Castro l Julio de 1983: Determinantes del Margen de
ComercializaciÓn en Productos Perecedores! Revista Nacional de Aaric~~t~r~,
No.863.
Forman, Shepard and Joyce F.Riegelhaupt; Market Placp and Marketinc SVSt9ffiS!
Towards ~ Thenry of Peasant Economic Integration, (188-212),
Francois, Patrick and Francoi. Sizaret, 1981, Pulse CDnsumption in Bra.il:
Protein Intake threatened by Uncertain Supply, Food and Nutritlon, Val.!,
No.2, (11-17).
Gsanger, Hans; Marketing - An Answer to Poverty?: A Cornment, IRitschrift f~r
auslandische Landwirt~[haft, 18 Jahrgang, Heit 1, Januar - M_rz, 132-34),
I I I I I I I I I I I I I I I I I I I
Han, Kee ehun and Ki Hyak Pak, 1969; Ao Analysis of Food Consumption in The
Republic of Korea, Yonsei University, Seoel, Korea~
Harris, Barbara, 1981; Transitional Trade ."ti Rural Development: The Natur2
and Role of Agricultural Teade in a SQuth lndian District, Vikas Publishing
House PVT LTD.
Harrison\ Kel1y, Donald Henley, Harold Riley and James Schaffer, 1974;
Improving Food Marketinq Sy~tpms in Developing Countries: Expprierce Frnm
Latin Americd f Marketing in Developing Communities Series. Research
No.6, Latin American Studies Center¡ Michigan State University.
I.N.N. ,1967; Tabla de Compo~ición de Alimpnto~ Colombiano~j Instituta
Nacional de Nutrition, tercera edicion, BogotA D.E., Colombia.
.]anssen! W., J.r:.',.Lynam and D,Pachico, 1985; Estudios de Mercadee p.;!ra
Determinar Prioridades en la Investigación en Productos Agricolas: Una
Evaluación Critica de la MetDdolDqia~ in: Gregory J.5cott 3nd M.Gary
Cost~lla; ComerrializaciOn Interna de los Alimentos en Arn~rica Latina:
Problemas\ Productos y Politicas¡ Selecci6n de las ponencias presentadas en
un seminario internacional celebrado en el Centro Internacional de
Agricultura Tropical en Cali, Colombia, 11-13 Julio 1984,
International Development Research Centre, Ottawa, Canada.
(200-223) ';
.JaDssen, (~.!J., 1986; Harket Impact 0/1 Cassav ... ~'5 Dpve]Dpment PoterJtial in t\':p
Atl~ntic Coast Reoion of Colombia, Centro Internacional de Agricultura
Tropical, Cali, Colombia.
Janssen, W. 8., 1987; A Propasa.l fDr Cas¡;:I StLldy Researrh i nta the Import.!l.nce
of Snap Reans in Diffprent Dpvelopinq Countries, Centro Internacional de
Agricultura Tropical, Cali, Colombia.
laynak, Erdener, May 1981; Food Distribution 5ystems: Evolution in Latin
America and the Middle East , Foad Pnlicy, {78-Q01.
I I I I I I I I I I I I I I I I I I I
Lele~ Uma J.! 1971; Fond Grain Marketinq in India: Private Pprformanc p
Pu.hlic Policy, Carnell University Pres5, lhaca & lonDDn.
Luna, Carlos Adolfo f JuLio 1987; Propuesta para el Estudio del Mert·;¡deo
los Costos de Producción de Habichuela ~n Colomhia, Centro Internacional
Agricultura Tropical, Cali, Colombia.
an d
de
Musgrove, Philipl Ottober 1985; Household Food Cansumption in the Dominican
Republic: Effects of Income, Priee and Family Size, Eronomic Developmpnt anj
Nestel! B.~ !(.Swanberg, H.Zandstra and C~Zulberti, 1979; Ca.gu.p;;:';i: LivinG
Rural Dpvplopment, LO.R.C., Ottawa, Canada.
PachicD f Douglas and Carlos Seré, 1987; Food Consumptinn Patterns and
Malnutrition in Latin America: Some Issues far Commoditv Priorities and
Policy Analysis, Centro Internacional de Agricultura Tropical 1 Cali 1
Cnlombi a.
Pinstrup-Andersen, Per l 1985~ Food Prices and the Poor in Developing
Countries, EurD. Hes. Agr. E,o. ~ 12, (60-85}.
RaJ, Des! 1972; The Design of Sample Survey~, Mc.Graw-Híll Book Campan','.
Ross, Clark G. t November 1980; Gra.in Demand and cansumer Pn=ference in
Senegal, Food Policy, (273-281).
Scott} Gregory ,J. t 1985; Mercados Mitos E Int¡:rr~ediariQs: La
CDm~rcialización de la Papa en la lana Central del Peru, Centra de
lnvertigacion Universidad del PacificD !C.l.U.P.), lima, Peru.
SDrenSDn, L.DrlD! John R,Pedersen and Norten C.Ives, July
Marketing in Zaire, Foed and Fe~d Graín Institute, Kansas State
Report No.51, ManhBttan, Kansas.
1975; Maize
University,
I I I I I I I I I I I I I I I I I I I
Tilburg, Aad van, 1981; Evaluation 0+ th~ Perfnrmance Di the E~istinc
Marketing System for Highland Vegetable~ in West J~va. Indonesia! Paper to
be pre.ented at the 1981 annual meeting of the European Academy fo. Advanced
Research in Marketing, Copenhagen, 25-27 March 1981, Agricultural University
of Wageningen, Dept. of Marketing and Marketing Research, TMe Netherlands.
Torres, Enriqueta B.
Operatíon in Fruit
and Flord.liza A.Lantican,
anti Vegetable Marketing,
Economi es and Dpvel npment, Val, 7 1 No. 1, (79-95).
1977; Mitidlemen and their
Journal of Aoric11ltllra.l

I I I I I I I I I I I I I I I I I I I
SUIIMARY
ThrQugh thls study In attempt Is made to hlghllght toe typlcal ¡ssue.
of vegetables in urban marketing and consumption. This is done by a
theoretical comparlEon of vegetables Nlth staple food5. Tnen the typical
issu€s are transposed into hypotheses, which subsequently were investigated.
An impcrtant issue is the perishability 0+ vegetables, therefore the
extremely fast distribution, without storage ar del ay, and therefore big
5upply fluctuations and big price fluctuations.
In the consumption study~ consumption Ieve!s~ qu~lity criteria 2nd
quality defects~ preferences and attitudes are measured~ together with
several sotioeconomic factors. For part of the preference measurament a new
and fast survey method is used by means of phctos. The attitud~s ~re
measured through agreements on general statements for ~ive different
vegetable praducts. There appear to be four underlying patterns In the
attitude statements:
1. "beirq favorite U
2. 11good ter health 11
3. !lbuying and preparation inconvenience 11
4. uheaviness ll
This information became useful in the explanation o~ snap be~n corsumption
level by socioeconcmic factors and attitudes. Particular the attitude about
b~ing good for health proved to be of sorne importance.
In this study also institutional tonsumption is taken i~ta a[eaun:.
Information is collected about how restaurants deal with snap be~ns in their
meal preparations.
Fcr part of urban marketing an attempt is made to clarify hcw
distribution is done and next how marketing is connected to ~onsumption. Or
in other words, how traders look at quality and quality defects, arÓ ~hi:h
market area they serve.
At last conclusions are dr3wn for part of the hypotheses, further
vegetable research, agricultural foad policíes and improvement by CIAT.
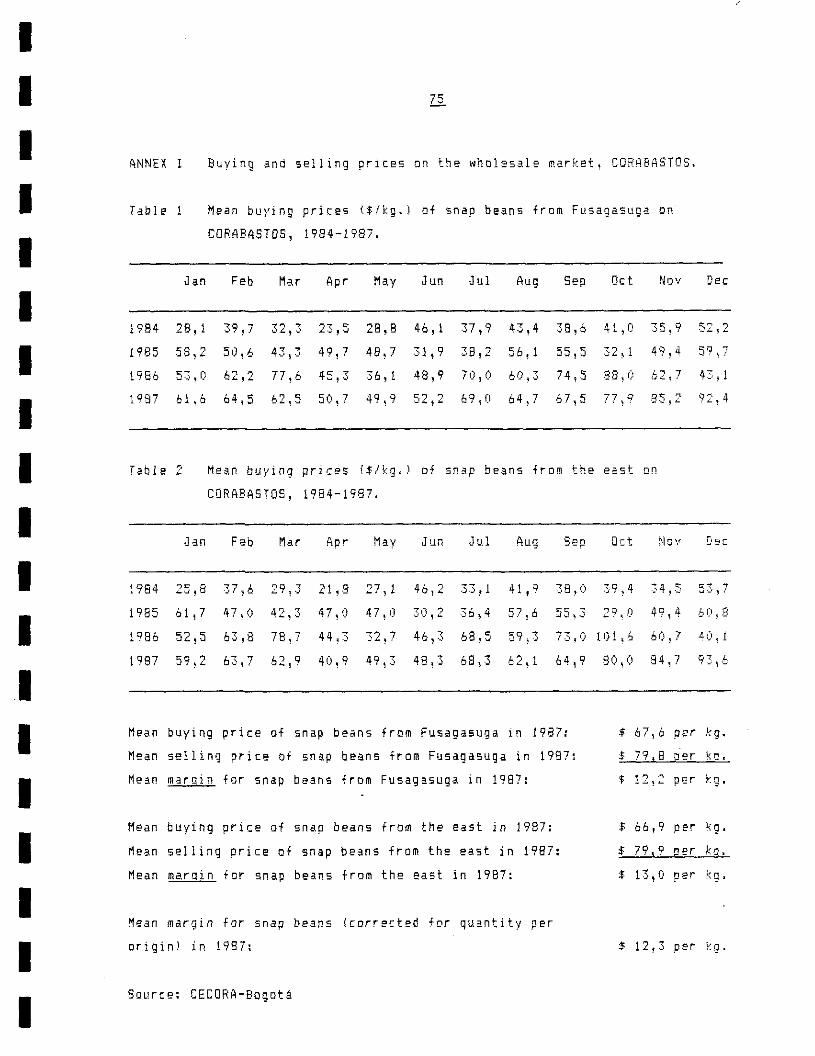
I I I I I I I I I I I I I I I I I I I
ANNEX 1 Buying ~nd selling prices on the wholesale market, CORABASTOS.
Table 1 Mean bu}'ing prices ($íkg. ) af snap beans frOffi Fusagasuga on
CORABA5TOS, 1984-1987.
Jan Feb Mar Apr Ma.y Jun J u1 Aug 5ep Oct Nov Dec
1984 28,1 39,7 32,3 23,5 28,8 46,1 37,9 43,4 38,6 41 1 0 35,9 52~2
1985 58,2 50,6 43, .3 49,7 48,7 .31,9 38,2 56,1 55 1 5 32~1 49,4 59\7
1986 53,0 62,2 77,6 45, ·3 36, ! 48,9 70,0 60; .3 74,5 88,0 LO (,¿L 1 7 43,1
1987 61,6 64,5 62,5 50,7 49,9 1::.., r¡ ,_1.:.. t";' 69,0 64,7 67,5 77 q . \ .. 85,2 92,4
Table o • Me~n bu)'ing prices ($/kg. ) of sn ap beans from the ea.st Qn
CORABA5TOS, 1984-1987.
Jan Feb Mar Apr May Jun Ju.1 Aug Sep Oct ~l o '/ Dec
(984 25;8 ·37; 6 29 ~.3 21, B 27, 1 46 1 2 33 f 1 41,9 38,0 39;4 34,5 53,7
1985 61 ,7 47,0 42,3 47,0 47,(1 30,2 .36! 4 57,6 55,3 29 ~ !) 49,4 60\8
19B6 52,5 63,8 78,7 44,3 <:'1 ; 46,3 68,5 59;3 73,0 101 ~ 6 60 , ? 40 1 1 -'", , ' 1987 59,2 63,7 62 j 9 40.9 49}3 48,3 68,3 Lo') i ........ lJ. 64,9 80,0 84,7 93\6
Mean buying prjce 01 snap beans from Fusagasuga .n 1987: $ 67,6 per kg.
Mean se111ng price nf snap beans from Fusagasuga in 1987: $ 79 1 8 O er k O.
Me3.n maroin f or snap beans from Fusagasuga in 19B7: $ 12,2 per kg.
Mean buying price of snap beans from the east in 1987 : $ 66,9 per \:g.
Mea.n selllng prlee of snap beans from the east in 1987 : $ 79 s 9 g.or ka.
Mean ma,fQin f ar snap beans fram the east jn 1987: $ 13,0 P er k g,
Mean margin for snao beaos (corrected for quantity per
origiol in 1987: $ 12,3 per kg,
Souree: CECORA-Bogotá
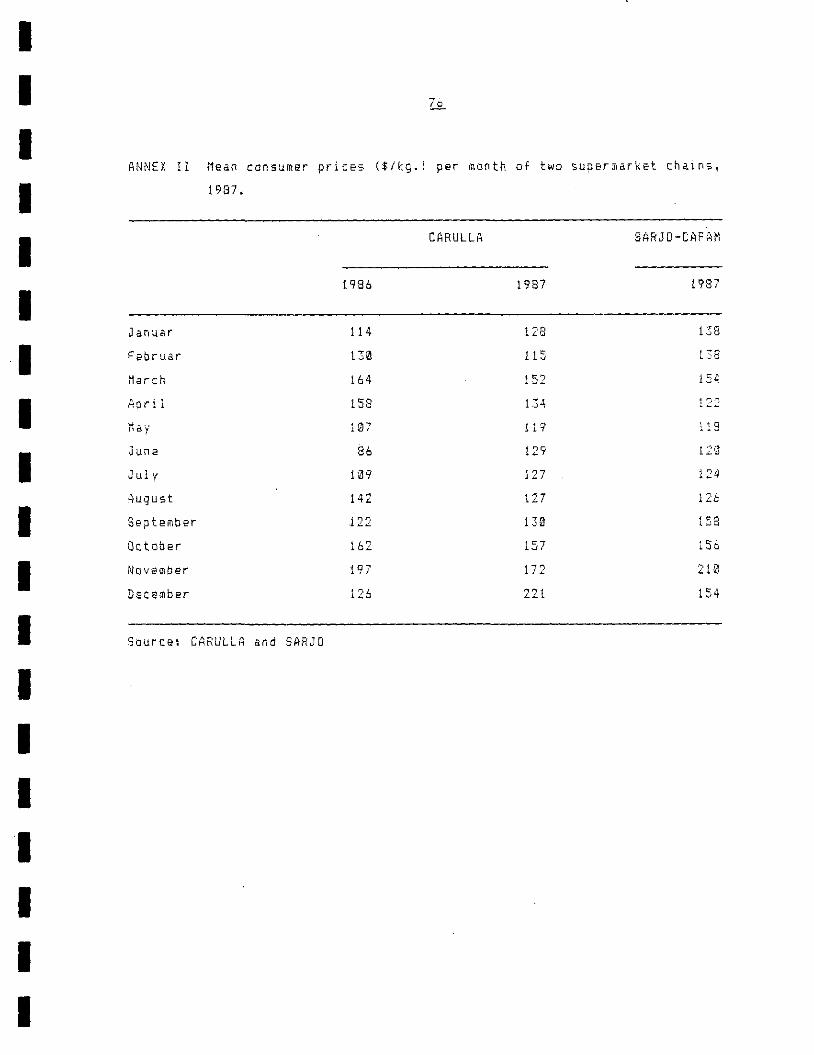
I I I I I I I I I I I I I I I I I I I
ANNEX ! I Mean canSUffie-r prices ($/kg.l per month of two supermarket chains~
1987.
1986
J anuar 114
Februa.r 130
March 164
158
May 107
June 86
J ul y 109
4uqust 142
September 122
Oetober 162
Novem/Jer l q-, ;
D~cember 126
Sauree: CARULLA and SARJO
CARULLA
1987
128
115
152
134
1 1 Q
129
127
·'17 i .;... •
130
1.57
221
SARJO-CAFArl
1987
138
L38
154
122
124
126
158
[56
210
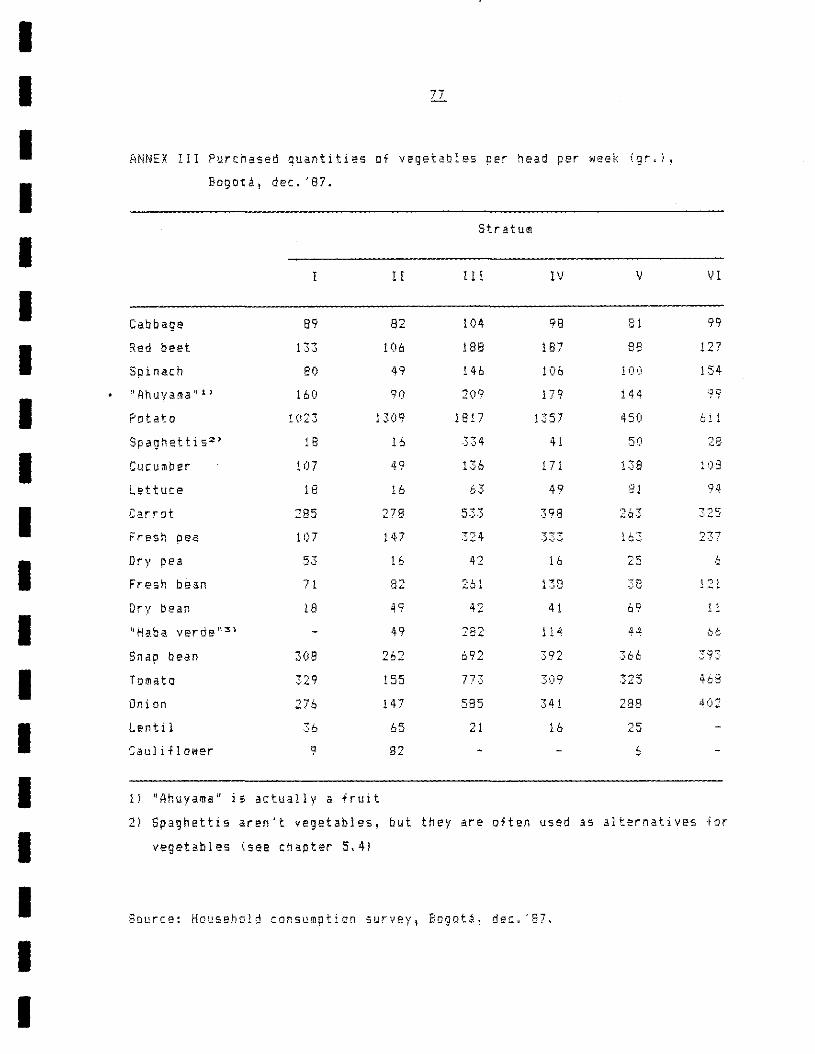
I I I I I I I I I I I I I I I I I I I
ANNEX 1 1 1 Purchased quantities of vegetables per head per week {gr, ) , Bogotá, dec. > 87.
Stratum
1 r lIr IV V VI
Cabbage 89 82 104 98 81 99
Red beet 133 106 188 187 88 127
Spinach 80 49 146 106 100 154
HAhuyama'\ 1) 160 91) 2(i9 179 144 99
Patato 1023 1309 1817 1357 450 6 i 1
Spaghettis 2 ) 18 16 ,334 41 Sí) 28
Curumber 107 49 136 171 138 10:3
Lettuce 18 16 6-) 49 81 94
CarrD! 285 278 533 398 ~'7 .:: C¡.,; 32-5
Fresn pea 107 147 324 333 163 237
Dry pea 53 16 42 16 ·0 "~ 6
Fresh be~n 71 8~ 261 138 38 ' " '':'' .i":' t
Dry bean 18 49 42 41 'o ,. 1 ;.
llHa,ba verde\\:S} 49 282 114 44 ~.;...
Snap bean 308 262 692 392 .366- ,39:,
Tomato 329 155 773 -309 ·325 46-8
Onion 0-' ,;..)0 147 585 341 28B 4ú2
Lentij 36 65 21 lb oC ";:' . .1
Caul 1 fl ower 9 82 " 11 'Ahuyama' 15 actualJv a fr"it
21 Spaghettis aren't vegetabJes, but they are often used as alternativas for
vegetable5 (see chapter 5.41
SOl1rce: Household consumptiofl s!.Jr\'~y, Bogotá 1 der:, '87.
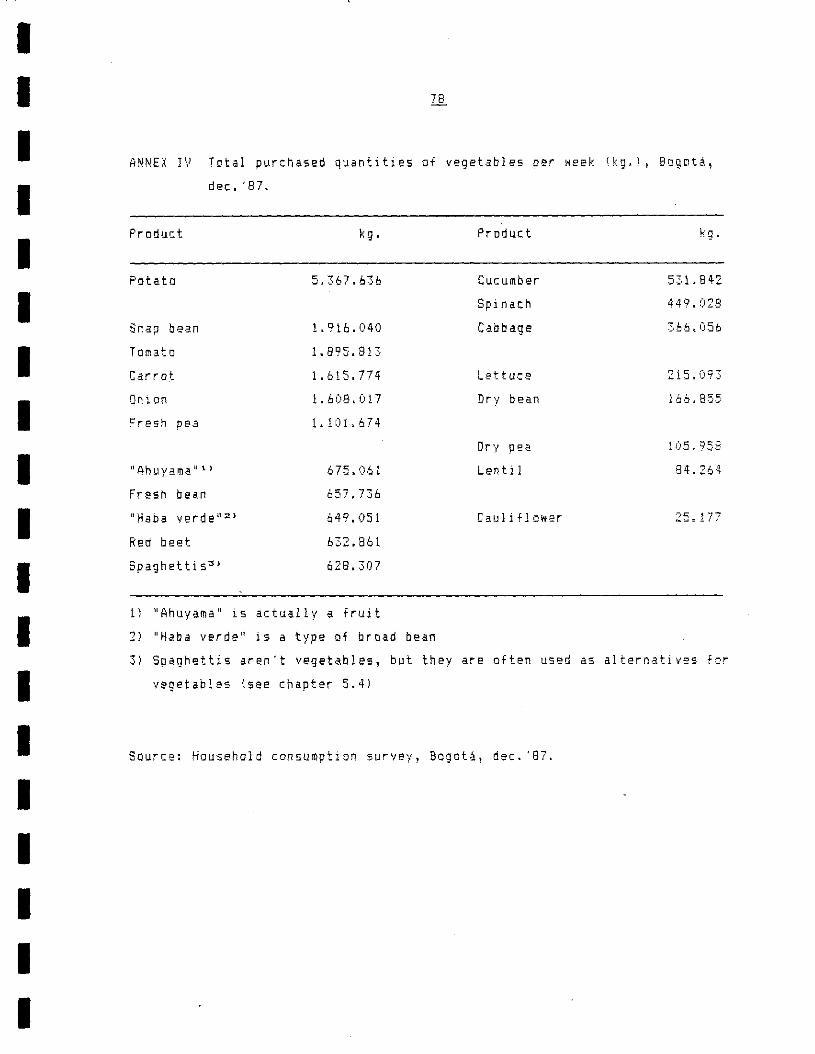
I I I I I I I I I I I I I I I I I I I
ANNEX IV Total purchased quantities of vegetables pee week (kg.!, Bogotá,
dec. '87.
Pr oduct kg. Product kg.
Patato 5.367.636 Cucumber 5~,1. B42
Spinach 449. na Snap bean 1.916.040 Cabbage ~,66.056
Tomato 1. 895:. 813
Carrot 1.615.774 Lettuce 215,093
Onioo 1.608.017 Dry bean 16,~. 85·5
Fresh pea 1.101.674
Dry pea 105.958
nAhuyama" 1 ) 675.<)61 Lentil 84.264·
Fresh bean 657.736
uHaba verde l1;2) 649.051 Cauliflower 25. 177
Red beet 6:,2.861
Spaghet ti 53> 628.307
1) HAhuyama ll is actu.ally d fruit
2) "Haba verde" is a type of broad bean
3) Spaghettis aren't vegetables, but they are afien used as alternatives for
vegetabl~s (see chapter 5.4)
Source; Househald consumptiol1 5urvey, Bogotá, Cee. '87.
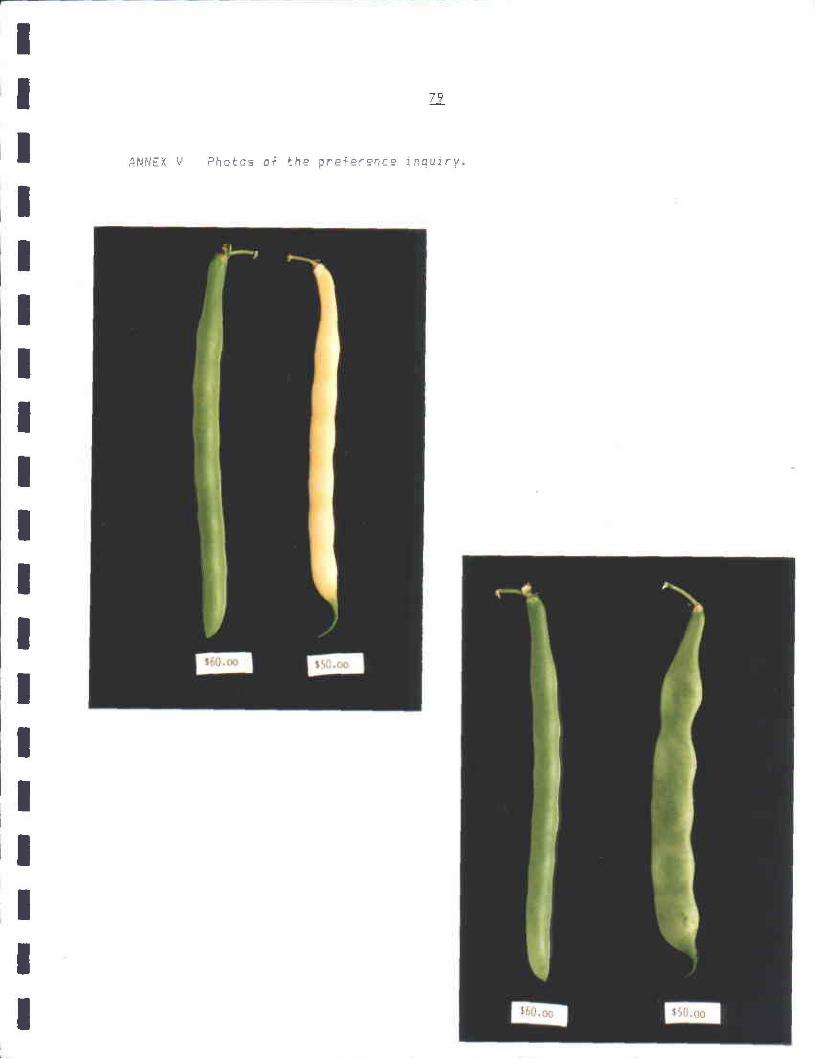
~--------- - _ . - -
I I
1I I I
II I I I I I I I I I
1I
I
1I I I I
ANNEX V Photas of the preference inquiry.
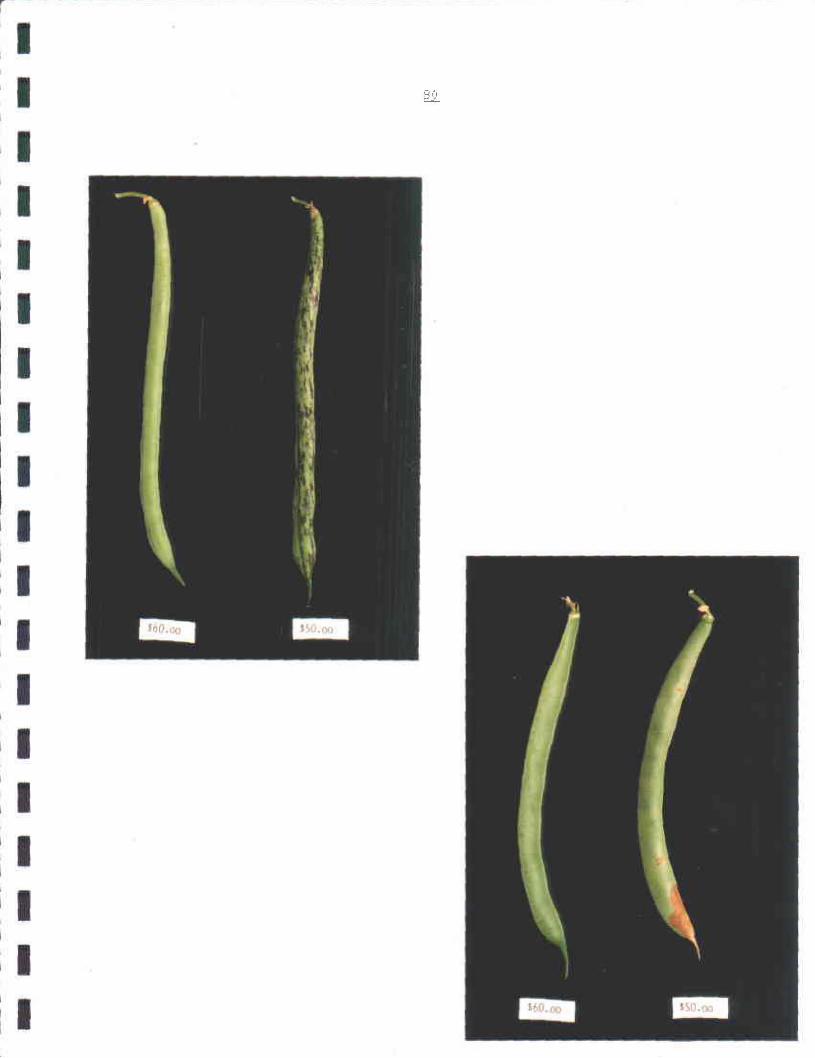
r - -
I
'. ao ,
· 1 I
1 I l. I
II I I I I I
:1 ' 1 I
,
1I :. 1I I l. ,
, 1
il