Embed Size (px)
Citation preview
J. Fluid Mech. (2013), vol. 729, pp. 377–387. c© Cambridge University Press 2013 377doi:10.1017/jfm.2013.295
Topology-induced effect in biomimeticpropulsive wakes
V. Raspa†, R. Godoy-Diana and B. Thiria
Physique et Mecanique des Milieux Heterogenes (PMMH), CNRS UMR7636; ESPCI ParisTech; UPMC(Paris 6); Univ. Paris Diderot (Paris 7), 10, rue Vauquelin, F-75005 Paris, France
(Received 8 February 2013; revised 30 May 2013; accepted 5 June 2013)
It is known that the wake pattern observed in a cross-section behind swimmingor flying animals is typically characterized by the presence of periodical vortexshedding. However, depending on species, propulsive wakes can differ according tothe spatial ordering of the main vortex structures. We conducted a very preciseexperiment to analyse the role of the topology of the wake in the generation ofpropulsion by comparing two prototypical cases in a quasi-two-dimensional view. Oneconfiguration is jellyfish-like, with symmetric shedding of vortex pairs, and the otheris fish-like, with alternating shedding of counter-rotating vortices. Self-propulsion isachieved by the flapping motion of two identical pitching rigid foils, separated by adistance d. By keeping the momentum input unchanged, we compared both symmetricand asymmetric flapping modes. For the entire explored range of parameters, thesymmetric jellyfish-like mode has shown to produce more thrust than the fish-likeasymmetrical one. We show here that this difference is due to a pressure effectrelated to the ability of each wake to produce or not, strong fluctuations of transversalvelocities in the near-wake region.
Key words: swimming/flying, vortex streets, wakes/jets
1. IntroductionLocomotive animal–fluid interactions in the macroscopic scale, such as those birds
and fish have with their natural environments, typically occur in the Reynolds numberregime of Re > 102. This is the Eulerian regime (Childress 1981), where the resultingcomplex flow field is characterized by the formation and periodical shedding ofvortices (Lighthill 1960; Saffman 1992). It is the case for wakes observed behindthe flapping wings of a bird (Hedenstrom, Rosen & Spedding 2006), a fish tail (Fish& Lauder 2006) or other swimming appendages such as for squid or salps (Sutherland& Madin 2010). Depending on the species, propulsive wakes are distinguished by thespatial ordering of their vortex pattern. A main classification can be established byobserving a cross-section of the wake, where the series of counter-rotating vorticescan be arranged either symmetrically (vortex ring configuration) or asymmetrically(staggered vortex street configuration). From the abundant examples found in the
† Email address for correspondence: [email protected]
378 V. Raspa, R. Godoy-Diana and B. Thiria
literature, symmetrical wakes are produced by squid (Anderson & Grosenbaugh2005) or jellyfish (Dabiri et al. 2005), whereas asymmetrical or staggered wakesare produced by swimming fish, eels or watersnakes (Muller et al. 1997).
The way hydrodynamics forces are linked to wake patterns has long been a centralquestion for physicists and engineers. One of the major concerns, for instance, is indrag reduction in the design of cars (Katz 2006) and aircraft (Joslin 1998; Spalart &McLean 2011) where the presence of a wake and its proper structure is known to playa major role for the friction laws. Following the same line of thought, the problem ofdynamic stalls of flying and swimming objects is thus worth investigation, especiallyfor the purposes of biomechanics (Ellington et al. 1996; Birch, Dickson & Dickinson2004). Basically, shed structures created during stroke cycles transport the momentumof displaced fluid by the wings or tail that enable the animal to move. In that case,no specific spatial arrangement is directly involved in the mechanism of thrust forceproduction.
However, a more thorough analysis shows that the way vorticity is distributed inthe wake (i.e. the spatiotemporal characteristics of the velocity field) can have a majorinfluence on the effective propulsion. For instance, it has been shown (Krueger 2005;Ruiz, Whittlesey & Dabiri 2011) that vortex ring propulsion could be more efficientthan its straight jet equivalent (i.e. starting from the same momentum input). On theother hand, for staggered shedding, the strict consideration of momentum can lead to alarge overestimation of the mean force for strongly fluctuating velocity fields (Bohl &Koochesfahani 2009). The effect of shed structures on thrust generation, was recentlyinvestigated using artificial wakes (Raspa, Gaubert & Thiria 2012). The authorsbrought the main conclusion that symmetric wake geometries were more efficientthan the asymmetric ones, based on their ability of generating strong fluctuationson transversal velocities or not. However, the authors were considering a constantmomentum injection provided by a still object, therefore far from a self-propelledflapping animal.
The goal of the present paper is to quantify, for real self-propelled movingobjects, how thrust production can be affected by the wake characteristics (i.e. spatialordering, intensity of the velocity fluctuations) while the momentum available forthrust production is kept constant. The self-propelled swimmer of the presentexperiment does not aim at mimicking a real fish or bird. However, it developscontrolled periodical vortex shedding to the wake, sharing physical key mechanismsfor propulsion with real animals. The main idea is to extract optimal design strategiesfrom the locomotive mechanisms developed by nature in order to transpose them totechnological applications. Indeed, we show in this paper that controlling velocityfluctuations in the near wake can increase significantly thrust production for a givenmomentum input, a result that can be valuable in the design and optimization ofartificial biomimetic propellers.
2. The experimental deviceThe experiment was performed in a free-surface water tank (900 mm × 800 mm× 500 mm) where an artificial swimmer is submerged. Self-propulsion is achievedby the pitching motion of two rigid foils such as that used in Godoy-Diana, Aider& Wesfreid (2008). The foils are separated by a distance d; the chord (c), maximumwidth (D) and span (l) are 24 mm, 5 mm and 100 mm, respectively. The angularposition of each flap is controlled with 0.5◦ of precision, by a small stepper andan adequate driving curve. The set was placed in a cart hanging from a straight
Topology-induced effect in biomimetic propulsive wakes 379
Airbearing
Water surface
Steppermotors
x
x
z
yc
d
Foils
300
mm
Camera
2D PIV
PIV window
Systemcentreline
(a)
(b)
Rail–air bearing
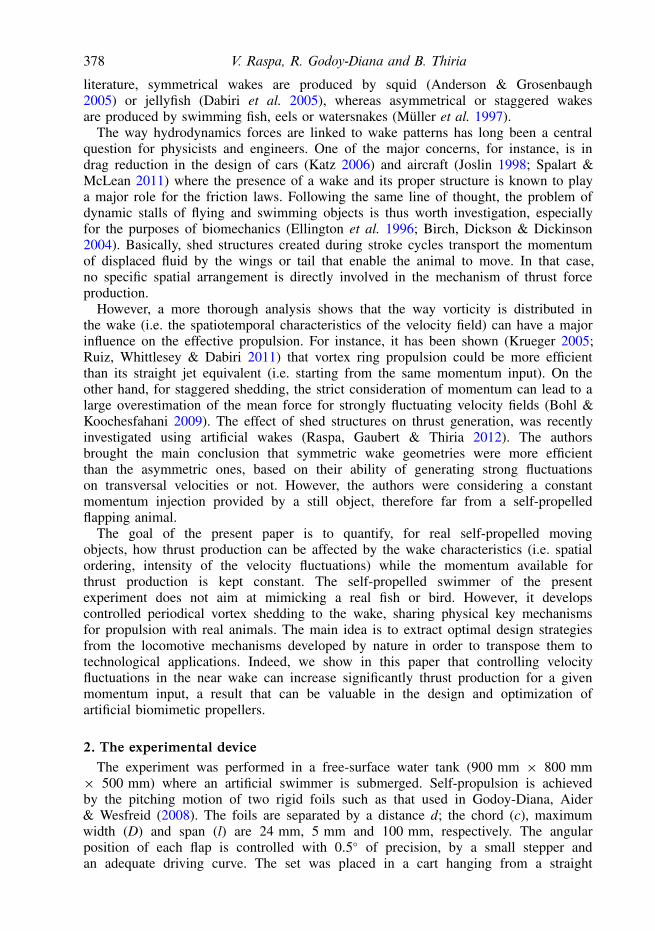
FIGURE 1. (Colour online) Sketches of the experimental device. (a) Side view presenting thegeneral assembling. (b) The camera view showing details on the foil configuration and thedefinition of the geometrical parameters.
rail, allowing it to glide along the longitudinal direction. In order to minimize thefriction, an air bearing was used. Sketches of the experimental set-up are presented infigure 1(a,b).
We considered two different flapping configurations for self-propelled swimming,which we have named symmetrical (S) and asymmetrical (A) after the kind of patternof the resulting wake. The first case is illustrated on the left in figure 2(a): both flapspitch towards each other in phase, producing counter-rotating pairs of vortices thatare simultaneously shed into the wake. On the left, the second case is exemplified.A phase lag (1φ) is introduced between the pitching motion of the two flaps sothat, although each flap independently follows the same motion profile as in thesymmetrical configuration, the resulting wake is no longer symmetric and bears moreresemblance to a fish-like wake (see online movies ESM1 and ESM2 available athttp://dx.doi.org/10.1017/jfm.2013.295). The insets in figure 2(b) illustrate the drivingcurves used to control the angular position of the flaps, θ(t/τ), for both consideredflapping configurations. Time derivatives were tuned in order to minimize vorticityejection during the expansion phase of the flaps’ oscillation. The example correspondsto an amplitude θmax of 60◦. The initial value (θ = 0) of the angular excursion wasset aligning the flaps with the x-direction. It is worth noting that all of the drivingcurves in figure 2(b) are essentially the same, the phase lag being the only difference.Therefore, the momentum input for both flapping configurations is also the same.
380 V. Raspa, R. Godoy-Diana and B. Thiria
x
y
x
y
Foil 1
Foil 2
Foil 1
Foil 2
80
60
40
20
0
–20
–40
–60
0 0.5 1.0 1.5 2.0 2.5 3.0 3.5
S mode
A mode
80
60
40
20
0
–20
–40
–60
0 0.5 1.0 1.5 2.0 2.5 3.0 3.5
10
8
6
4
2
12 14 16 18108642 20
12
0
(a)
(b)
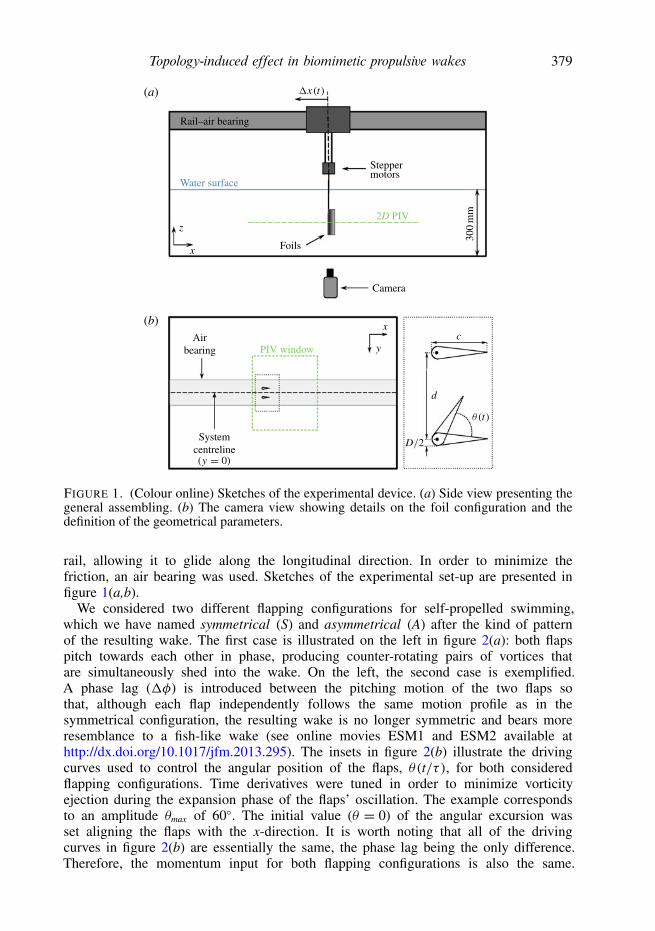
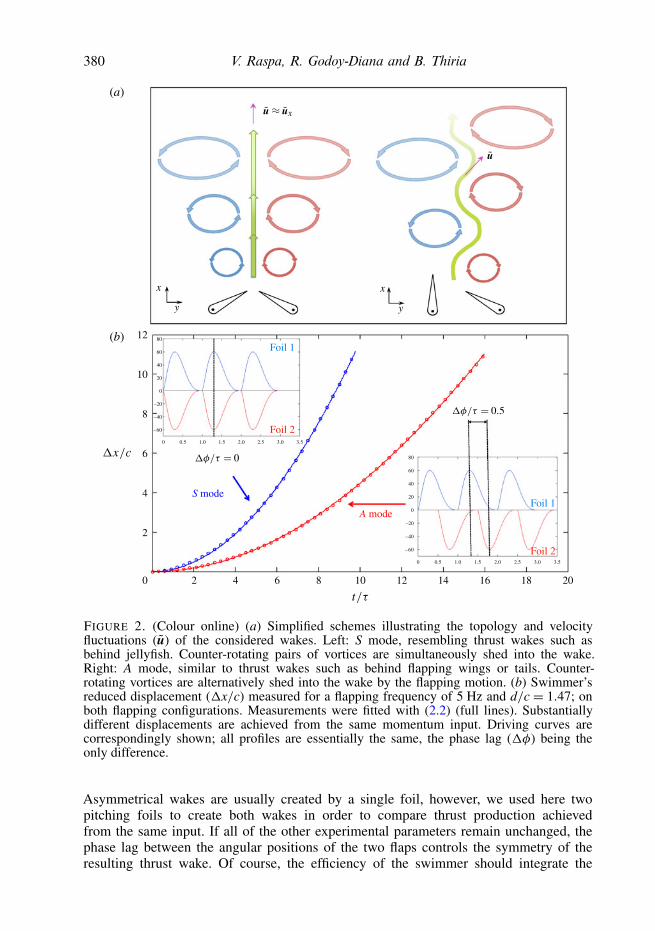
FIGURE 2. (Colour online) (a) Simplified schemes illustrating the topology and velocityfluctuations (u) of the considered wakes. Left: S mode, resembling thrust wakes such asbehind jellyfish. Counter-rotating pairs of vortices are simultaneously shed into the wake.Right: A mode, similar to thrust wakes such as behind flapping wings or tails. Counter-rotating vortices are alternatively shed into the wake by the flapping motion. (b) Swimmer’sreduced displacement (1x/c) measured for a flapping frequency of 5 Hz and d/c = 1.47; onboth flapping configurations. Measurements were fitted with (2.2) (full lines). Substantiallydifferent displacements are achieved from the same momentum input. Driving curves arecorrespondingly shown; all profiles are essentially the same, the phase lag (1φ) being theonly difference.
Asymmetrical wakes are usually created by a single foil, however, we used here twopitching foils to create both wakes in order to compare thrust production achievedfrom the same input. If all of the other experimental parameters remain unchanged, thephase lag between the angular positions of the two flaps controls the symmetry of theresulting thrust wake. Of course, the efficiency of the swimmer should integrate the
Topology-induced effect in biomimetic propulsive wakes 381
knowledge of the torque produced by the motors. Unfortunately, our step motors areunable to give the torque, this is the purpose of a forthcoming paper.
As mentioned above, the pitching motion of the flaps determines the system tobe self-propelled. The reduced displacement, 1x/c, of our artificial swimmer wasmeasured as a function of time on both flapping configurations for frequencies rangingfrom 2 to 5 Hz, setting d between 1.47c and 10c, and θmax = 60◦. Measurements showthat after a clear transitory, the swimmer reaches constant velocity. Even though themomentum input is the same on both configurations, the outcome displacement issignificantly different. Figure 2(b) exemplifies the measurements for a frequency of5 Hz and d/c= 1.47.
The propulsive force was recovered from the swimmer displacement measurements,such as those presented in figure 2(b). The swimmer position was recovered fromimaging processing with 2 mm of accuracy. The following dynamical model wasproposed to describe the measurements:
mx+ γ x2 = FS,Ap (2.1)
where m= 2.8 kg is the total mass of the swimmer, γ x2 is the nonlinear hydrodynamicdrag term and FS,A
p is the effective propulsive force. Both FS,Ap and γ are independent
unknown coefficients to be determined from the measurements. The superscript (S orA), refers to the symmetry of the corresponding flapping mode. Time derivativesare indicated with dots over the variable. For the sake of clarity, the explicittime dependence of the displacement x was ignored in (2.1). Considering as initialconditions that x(0)= 0 and x(0)= 0, (2.1) gives
x(t)= m
γlog
cosh
√γFS,A
p
mt
. (2.2)
To estimate the propulsive force, measurements were fitted with (2.2). An example ofthe data fitting is presented in solid lines on figure 2(b). A Monte Carlo scheme wasused to propagate the displacement uncertainty to the corresponding force and velocitymeasurements.
Fast two-dimensional particle image velocimetry (PIV) measurements wereconducted on a fixed observation window to obtain the velocity field (typicalsequences of vorticity field are shown as supplementary material, see online videosESM3 and ESM4). The air bearing set-up was blocked on a fixed position for thispurpose. Mean flow velocities and fluctuations, 〈u〉 and u, were extracted from them.The set-up was chosen for measurements consistency, considering that the swimmingtransient is needed for data fitting, the stationary state is very short in the accessiblerange and reached in the last part of the trajectory (see figure 2b). Instantaneousvelocity fields generated during tethered and forward swimming could be different;nevertheless, our results (see figure 4) show that if there is any difference, it isnot dramatically changing the mean flow velocities and/or the fluctuations. For adiscussion on how to consider this potential difference see Ramananarivo, Godoy-Diana & Thiria (2011). PIV measurements were performed from pairs of imagessequentially acquired with a Phantom v9.1 high-speed camera at full resolution of1632 × 1200 pixels, controlled by LaVision DaVis 7.2 software. For that purpose, therecord length, the inter-frame time and the record frequency were set to 10 s, 1.2 msand 150 Hz, respectively. Polyethylene particles of 10 µm diameter were used forseeding and a 1 mm thick laser sheet placed at mid-span of the foils was produced
382 V. Raspa, R. Godoy-Diana and B. Thiria
with a Quantronix Darwin-Duo 20 mJ pulsed laser. PIV calculations were performedwith DaVis 7.2, using 16 pixels × 16 pixels interrogation windows with 50 % ofoverlap, giving a final density of 0.75 vectors mm−1. Standard particle/laser sheetvisualizations were made using 50 µm diameter polyethylene seeding particles. Thetwo-dimensional approximation is reasonable in the near wake due to the coherence ofthe forcing along the span (see Poncet (2002) or Thiria, Goujon-Durand & Wesfreid(2006)).
3. Results and discussion3.1. Swimming performance
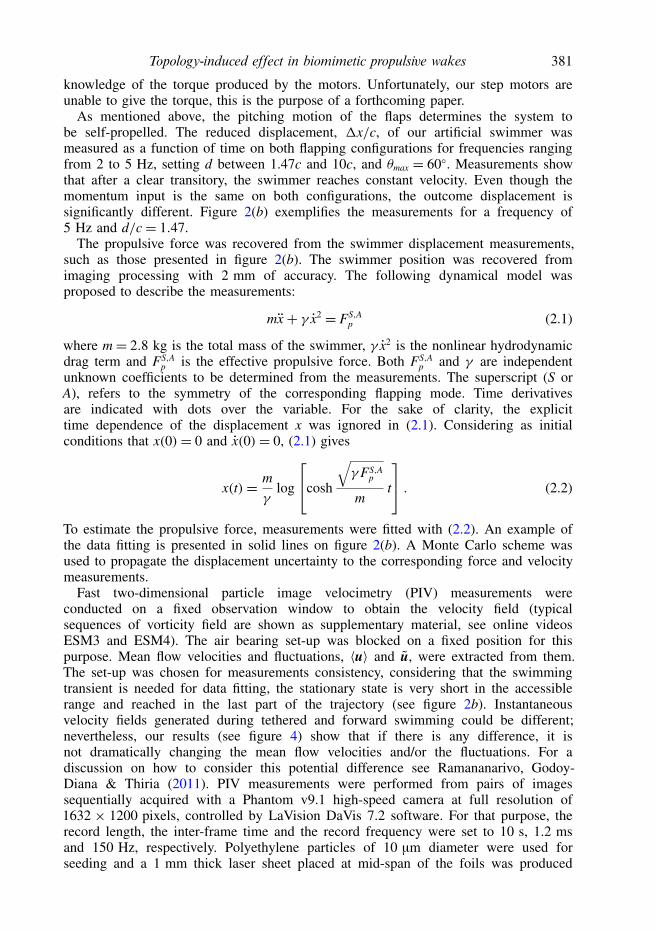
Measurements as in figure 2(b) show that after a clear transitory, the swimmerreaches constant velocity (Uo). Figure 3(a) presents the comparison between thevelocities achieved by both flapping configurations, calculated from the correspondingdisplacement measurements. While the symmetric mode proved to be the fastest for ashort axis separation, no significant difference between the configurations was detectedon the swimming performance if the flaps are separated enough. A similar observation,but on thrust production, can be made from figure 3(d) where the ratio FS
p/FAp is
plotted as a function of d/c for different flapping frequencies. As long as the flaps arenot placed too close to each other, the performance of both flapping modes as thrustgenerators is approximately the same. An average difference between thrust achievedby each configuration, 1o = (2.4 ± 0.3) mN, was estimated from the measurements.However, when the flaps separation distance is short enough, the symmetric modehas proved to generate higher thrust than the asymmetric one. The magnitudes of theforces FS
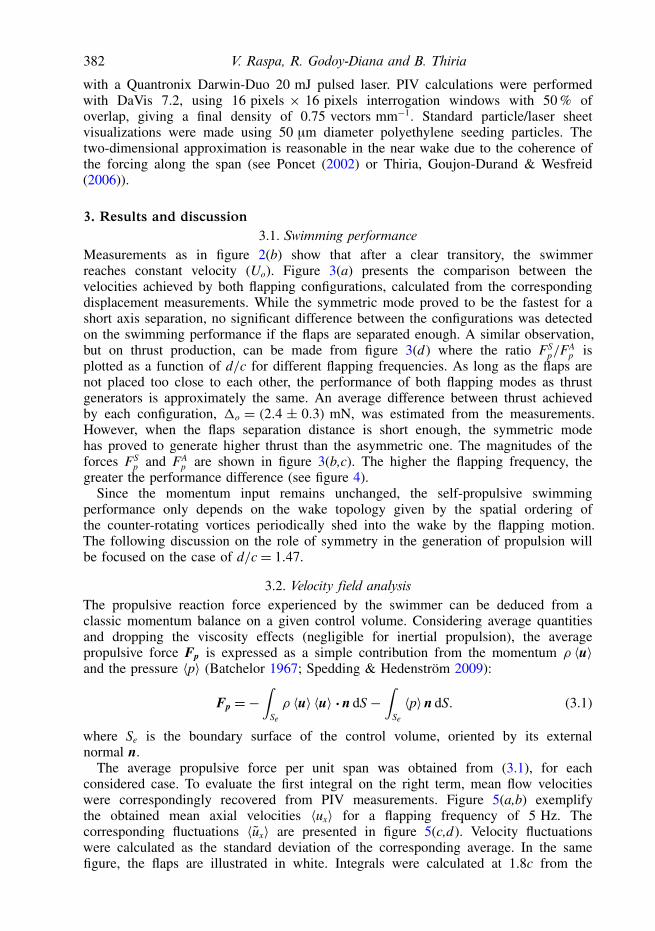
p and FAp are shown in figure 3(b,c). The higher the flapping frequency, the
greater the performance difference (see figure 4).Since the momentum input remains unchanged, the self-propulsive swimming
performance only depends on the wake topology given by the spatial ordering ofthe counter-rotating vortices periodically shed into the wake by the flapping motion.The following discussion on the role of symmetry in the generation of propulsion willbe focused on the case of d/c= 1.47.
3.2. Velocity field analysisThe propulsive reaction force experienced by the swimmer can be deduced from aclassic momentum balance on a given control volume. Considering average quantitiesand dropping the viscosity effects (negligible for inertial propulsion), the averagepropulsive force Fp is expressed as a simple contribution from the momentum ρ 〈u〉and the pressure 〈p〉 (Batchelor 1967; Spedding & Hedenstrom 2009):
Fp =−∫
Se
ρ 〈u〉 〈u〉 ·n dS−∫
Se
〈p〉n dS. (3.1)
where Se is the boundary surface of the control volume, oriented by its externalnormal n.
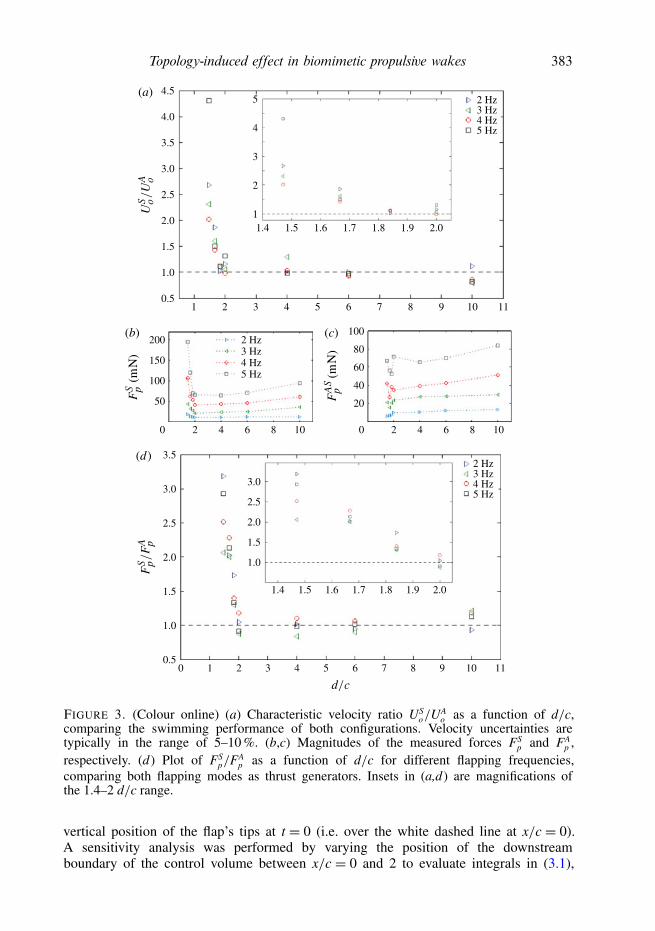
The average propulsive force per unit span was obtained from (3.1), for eachconsidered case. To evaluate the first integral on the right term, mean flow velocitieswere correspondingly recovered from PIV measurements. Figure 5(a,b) exemplifythe obtained mean axial velocities 〈ux〉 for a flapping frequency of 5 Hz. Thecorresponding fluctuations 〈ux〉 are presented in figure 5(c,d). Velocity fluctuationswere calculated as the standard deviation of the corresponding average. In the samefigure, the flaps are illustrated in white. Integrals were calculated at 1.8c from the
Topology-induced effect in biomimetic propulsive wakes 383
4.0
3.5
3.0
2.5
2.0
1.5
1.0
5
4
3
2
11.51.4 1.6 1.7 1.8 1.9 2.0
2 Hz3 Hz4 Hz5 Hz
2 Hz3 Hz4 Hz5 Hz
5 6 7 8 9 10 114321
200
150
100
50
0 6 8 1042 6 8 1042
100
60
40
0
3.5
3.0
2.5
2.0
1.5
1.0
0.50 1 2 3 4 5 6 7 8 9 10 11
3.0
2.5
2.0
1.5
1.0
1.51.4 1.6 1.7 1.8 1.9 2.0
2 Hz3 Hz4 Hz5 Hz
4.5
0.5
(a)
(b) (c)
(d)
80
20
FIGURE 3. (Colour online) (a) Characteristic velocity ratio USo/U
Ao as a function of d/c,
comparing the swimming performance of both configurations. Velocity uncertainties aretypically in the range of 5–10 %. (b,c) Magnitudes of the measured forces FS
p and FAp ,
respectively. (d) Plot of FSp/F
Ap as a function of d/c for different flapping frequencies,
comparing both flapping modes as thrust generators. Insets in (a,d) are magnifications ofthe 1.4–2 d/c range.
vertical position of the flap’s tips at t = 0 (i.e. over the white dashed line at x/c = 0).A sensitivity analysis was performed by varying the position of the downstreamboundary of the control volume between x/c = 0 and 2 to evaluate integrals in (3.1),
384 V. Raspa, R. Godoy-Diana and B. Thiria
300
250
200
150
100
50
0
1 2 3 4 5
Fp measurements
PIV analysis
0 6
f (Hz)
350
–50
Fp
(mN
)
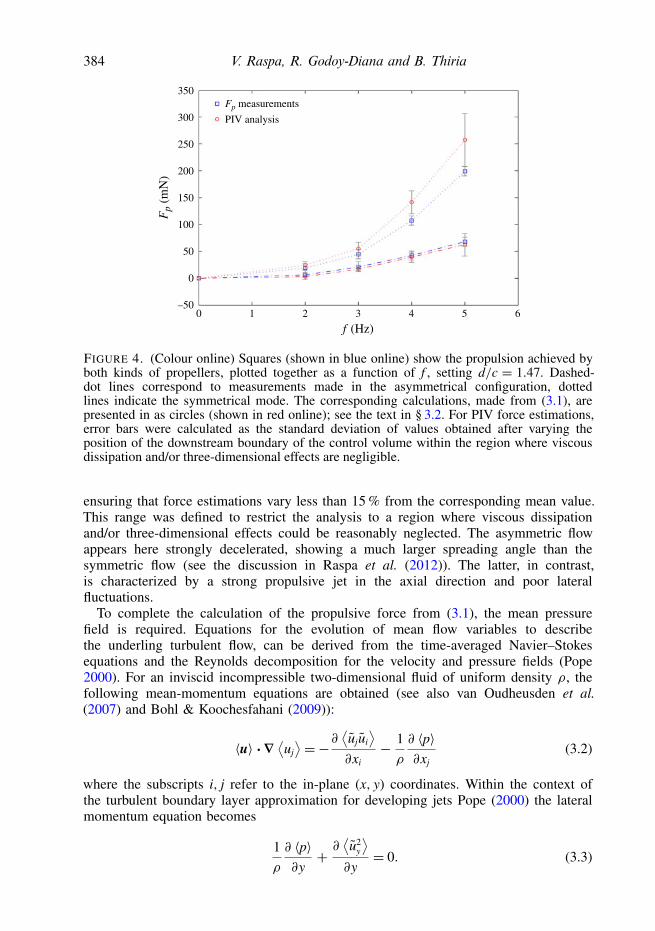
FIGURE 4. (Colour online) Squares (shown in blue online) show the propulsion achieved byboth kinds of propellers, plotted together as a function of f , setting d/c = 1.47. Dashed-dot lines correspond to measurements made in the asymmetrical configuration, dottedlines indicate the symmetrical mode. The corresponding calculations, made from (3.1), arepresented in as circles (shown in red online); see the text in § 3.2. For PIV force estimations,error bars were calculated as the standard deviation of values obtained after varying theposition of the downstream boundary of the control volume within the region where viscousdissipation and/or three-dimensional effects are negligible.
ensuring that force estimations vary less than 15 % from the corresponding mean value.This range was defined to restrict the analysis to a region where viscous dissipationand/or three-dimensional effects could be reasonably neglected. The asymmetric flowappears here strongly decelerated, showing a much larger spreading angle than thesymmetric flow (see the discussion in Raspa et al. (2012)). The latter, in contrast,is characterized by a strong propulsive jet in the axial direction and poor lateralfluctuations.
To complete the calculation of the propulsive force from (3.1), the mean pressurefield is required. Equations for the evolution of mean flow variables to describethe underling turbulent flow, can be derived from the time-averaged Navier–Stokesequations and the Reynolds decomposition for the velocity and pressure fields (Pope2000). For an inviscid incompressible two-dimensional fluid of uniform density ρ, thefollowing mean-momentum equations are obtained (see also van Oudheusden et al.(2007) and Bohl & Koochesfahani (2009)):
〈u〉 ·∇ ⟨uj
⟩=−∂ ⟨ujui
⟩∂xi
− 1ρ
∂ 〈p〉∂xj
(3.2)
where the subscripts i, j refer to the in-plane (x, y) coordinates. Within the context ofthe turbulent boundary layer approximation for developing jets Pope (2000) the lateralmomentum equation becomes
1ρ
∂ 〈p〉∂y+ ∂
⟨u2
y
⟩∂y= 0. (3.3)
Topology-induced effect in biomimetic propulsive wakes 385
2
0
–2
4
2
0
–2
–4
4
2
0
–2
–4
0 0
0.3
0.2
0.1
0
–0.1
–0.2
0.15
0.10
0.05
0
–20
–40
–60
–80
4
–4
0.20
0
(a) (b)
(c) (d)
(e) ( f )
–5 5
S mode
–5 5
A mode
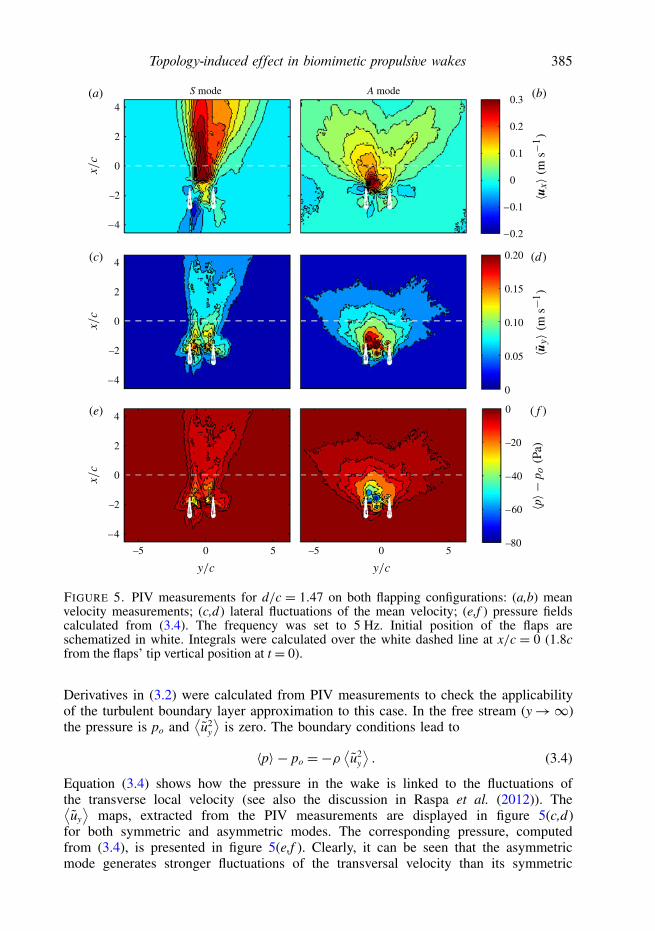
FIGURE 5. PIV measurements for d/c = 1.47 on both flapping configurations: (a,b) meanvelocity measurements; (c,d) lateral fluctuations of the mean velocity; (e,f ) pressure fieldscalculated from (3.4). The frequency was set to 5 Hz. Initial position of the flaps areschematized in white. Integrals were calculated over the white dashed line at x/c = 0 (1.8cfrom the flaps’ tip vertical position at t = 0).
Derivatives in (3.2) were calculated from PIV measurements to check the applicabilityof the turbulent boundary layer approximation to this case. In the free stream (y→∞)the pressure is po and
⟨u2
y
⟩is zero. The boundary conditions lead to
〈p〉 − po =−ρ⟨u2
y
⟩. (3.4)
Equation (3.4) shows how the pressure in the wake is linked to the fluctuations ofthe transverse local velocity (see also the discussion in Raspa et al. (2012)). The⟨uy
⟩maps, extracted from the PIV measurements are displayed in figure 5(c,d)
for both symmetric and asymmetric modes. The corresponding pressure, computedfrom (3.4), is presented in figure 5(e,f ). Clearly, it can be seen that the asymmetricmode generates stronger fluctuations of the transversal velocity than its symmetric
386 V. Raspa, R. Godoy-Diana and B. Thiria
counterpart and that, as a consequence, the near-wake pressure is significantly lower.Thus, the balance of (3.2) is changed through the second integral, modifying theamount of momentum available for propulsion (i.e. the force Fp). This interpretationis consistent with the fact that in the asymmetrical configuration, the lateral leakingof the momentum input applies lateral forces to the propeller (compensated by thephysical constriction on the y-direction) that diminish the projection of the availableforce on the swimming direction respect to the symmetrical case where the leakingis minimized by the wake topology. At last, for each explored experimental condition,Fp can be evaluated through (3.2) from the corresponding velocity and pressure fields;and be compared with measurements obtained in the previous section. This is plottedin figure 4. Both quantities are very consistent in order of magnitude and generalbehaviour with respect to f , which validates PIV measurements to estimate the forcein the two-dimensional approximation, but also strengthens the conjectures made onpressure in this paper.
4. ConclusionsWe have shown that the way wakes are generated from the same momentum input
has a noticeable effect on the swimming (or flying) performance of self-propelledobjects. This dependence is mainly due to a pressure effect that is related to theintensity of the velocity fluctuations in the near wake. Although differences might beexpected between the quasi-two-dimensional model wakes studied here and the realthree-dimensional wakes encountered in nature, the effect of the spatial arrangement ofthe vortex shedding on the propulsive performance should prevail.
On the other hand, our measurements confirm that some wake configurations havethe ability to minimize those fluctuations (here, for the symmetric mode for instance)and save useful momentum. The idea of flapping in a symmetrical configurationto get locomotive advantages in the context of fish schooling was reported byChildress (1981) and Kanso & Newton (2010). Animals are firstly constrained by theirmorphologies and needs, and some of them might spend more energy for the samework than others (Tytell 2007). However, one strategy of optimization for possiblehuman made swimmers or flyers is therefore to control fluctuations in the wake bysetting properly the time dependent momentum inputs to save energy. Further studiesare currently being conducted in this way.
AcknowledgementsWe thank all of the people at the PMMH workshop for their help with the
experimental set-up. This work was supported by the French Research Agency (ANR-08-BLAN-0099) and by EADS Foundation through project ‘Fluids and elasticity inbiomimetic propulsion’.
Supplementary materialSupplementary material are available at http://dx.doi.org/10.1017/jfm.2013.295.
R E F E R E N C E S
ANDERSON, E. J. & GROSENBAUGH, M. A. 2005 Jet flow in steadily swimming adult squid.J. Expl Biol. 208 (6), 1125–1146.
BATCHELOR, G. K. 1967 An Introduction to Fluid Dynamics. Cambridge University Press.
Topology-induced effect in biomimetic propulsive wakes 387
BIRCH, J. M., DICKSON, W. B. & DICKINSON, M. H. 2004 Force production and flow structure ofthe leading edge vortex on flapping wings at high and low Reynolds numbers. J. Expl Biol.207 (7), 1063–1072.
BOHL, D. G. & KOOCHESFAHANI, M. M. 2009 MTV measurements of the vortical field in thewake of an aerofoil oscillating at high reduced frequency. J. Fluid Mech. 620, 63–88.
CHILDRESS, S. 1981 Mechanics of Swimming and Flying. Cambridge University Press.DABIRI, J. O., COLIN, S. P., COSTELLO, J. H. & GHARIB, M. 2005 Flow patterns generated by
oblate medusan jellyfish: field measurements and laboratory analyses. J. Expl Biol. 208 (7),1257–1265.
ELLINGTON, C. P., VAN DEN BERG, C., WILLMOTT, A. P. & THOMAS, A. L. R. 1996Leading-edge vortices in insect flight. Nature 384, 626–630.
FISH, F. E. & LAUDER, G. V. 2006 Passive and active flow control by swimming fishes andmammals. Annu. Rev. Fluid Mech. 38, 193–224.
GODOY-DIANA, R., AIDER, J. L. & WESFREID, J. E. 2008 Transitions in the wake of a flappingfoil. Phys. Rev. E 77, 016308.
HEDENSTROM, A., ROSEN, M. & SPEDDING, G. R. 2006 Vortex wakes generated by robinsErithacus rubecula during free flight in a wind tunnel. J. Royal Soc. Interface 3 (7),263–276.
JOSLIN, R. D. 1998 Aircraft laminar flow control. Annu. Rev. Fluid Mech. 30 (1), 1–29.KANSO, E. & NEWTON, P. K. 2010 Locomotory advantages to flapping out of phase. Exp. Mechs.
50, 1367–1372.KATZ, J. 2006 Aerodynamics of race cars. Annu. Rev. Fluid Mech. 38 (1), 27–63.KRUEGER, P. 2005 An over-pressure correction to the slug model for vortex ring circulation. J. Fluid
Mech. 545, 427–443.LIGHTHILL, M. J. 1960 Note on the swimming of slender fish.. J. Fluid Mech. 9, 305–317.MULLER, U., HEUVEL, B., STAMHUIS, E. & VIDELER, J. 1997 Fish foot prints: morphology and
energetics of the wake behind a continuously swimming mullet (Chelon labrosus risso).J. Expl Biol. 200 (22), 2893–2906.
VAN OUDHEUSDEN, B. W., SCARANO, F., ROOSENBOOM, E. W. M., CASIMIRI, E. W. F.& SOUVEREIN, L. J. 2007 Evaluation of integral forces and pressure fields from planarvelocimetry data for incompressible and compressible flows. Exp. Fluids 43 (2), 153–162.
PONCET, P. 2002 Vanishing of mode b in the wake behind a rotationally oscillating circular cylinder.Phys. Fluids 14, 2021–2023.
POPE, S. B. 2000 Turbulent Flows. Cambridge University Press.RAMANANARIVO, S., GODOY-DIANA, R. & THIRIA, B. 2011 Rather than resonance, flapping wing
flyers may play on aerodynamics to improve performance. Proc. Natl Acad. Sci. U.S.A. 108,5964–5969.
RASPA, V., GAUBERT, C. & THIRIA, B. 2012 Manipulating thrust wakes: a parallel with biomimeticpropulsion. Europhys. Lett. 97, 44008.
RUIZ, L., WHITTLESEY, R. & DABIRI, J. 2011 Vortex-enhanced propulsion. J. Fluid Mech. 668,5–32.
SAFFMAN, P. G. 1992 Vortex Dynamics. Cambridge University Press.SPALART, P. R. & MCLEAN, J. D. 2011 Drag reduction: enticing turbulence, and then an industry.
Phil. Trans. R. Soc. A 369 (1940), 1556–1569.SPEDDING, G. R. & HEDENSTROM, A. 2009 PIV-based investigations of animal flight. Exp. Fluids
46 (5), 749–763.SUTHERLAND, K. R. & MADIN, L. P. 2010 Comparative jet wake structure and swimming
performance of salps. J. Expl Biol. 213 (17), 2967–2975.THIRIA, B., GOUJON-DURAND, S. & WESFREID, J. E. 2006 Wake of a cylinder performing rotary
oscillations. J. Fluid Mech. 560, 123–148.TYTELL, E. D. 2007 Do trout swim better than eels? Challenges for estimating performance based
on the wake of self-propelled bodies. Exp. Fluids 43 (5), 701–712.