Embed Size (px)
Citation preview
J. E. Purkyně University in Ústí nad Labem
Faculty of Science
Department of Physics
Computer Simulations of Atomic Collision
Cascades in Solids
Extended abstract of the Doctoral Thesis
Author: Ing. Pavel Kuba
Supervisor: RNDr. Jan Lorinčík, CSc.
Ústí nad Labem 2014
Contents
1 Overview .......................................................................................................................................... 3
2 Goals of the thesis ........................................................................................................................... 4
3 MD model ........................................................................................................................................ 4
3.1 Visualization ............................................................................................................................ 5
3.1 MD simulation of sputtering yields ......................................................................................... 5
4 The study of collision phenomena above the surface and their effect on ionization ..................... 6
4.1 Analytical ionization models.................................................................................................... 6
4.2 MD model of Ar bombardment of a Cu target ........................................................................ 7
4.3 MD simulations of spectral ionization probabilities ................................................................ 8
5 Simulation of the rupture of a subsurface nanobubble ................................................................ 13
5.1 The central impact ................................................................................................................. 13
5.2 The eccentric impact ............................................................................................................. 19
6 Summary........................................................................................................................................ 23
6.1 Study of collision phenomena above the surface and ionization ......................................... 23
6.2 Simulation of the rupture of a subsurface nanobubble ........................................................ 24
6.3 Conclusion ............................................................................................................................. 24
7 References ..................................................................................................................................... 25
~ 3 ~
1 Overview
If the surface of a solid is bombarded with atoms or ions with primary energy of 100 eV to 30000 eV,
it leads to a number of complex atomic collisions near the surface, and surface atoms can be emitted
from the solid. This phenomenon is named sputtering. The important diagnostic methods (e.g.
Secondary ion mass spectrometry - SIMS) and other contemporary material technologies are based on
this phenomenon.
The main physical mechanism of sputtering is transfer of energy and momentum of the impinging ion
to individual atoms of the target, which gradually develops into a so-called collision cascade from which
are then emitted the atoms, which are near the surface and have sufficient energy and a suitable
direction of movement to overcome the surface bond. A detailed explanation of the collision cascade
at atomistic level can be achieved by computer modeling, whether using Monte Carlo (MC) methods
or molecular dynamics (MD) simulations. The computer simulation of the effect of energetic ion
bombardment of solid surfaces has been in progress for over 40 years [1]. With the improved
performance of computers MD simulation is becoming widespread as a companion of sputtering
experiments. Among successes of MD simulations are quantitative predictions of energy and angular
distributions of particles ejected from the surface [2] and description of cluster ejection [3] to name a
few. There is a great variability in the ion induced sputtering experiments in terms of the primary ions
(large clusters Ar 5000 [4], small clusters Bi3 [5], monoatomic Ar [6], targets (semiconductors [7],
metals [8, 9], polymers [10], molecular solids and other soft matter [11, 12] that are being studied by
MD simulations. We have made our choice in such a way that we could tackle one of the long standing
problems in the field [13] and in addition to that we have tried to find a not fully explored but
practically important system that has not been studied with MD simulations yet.
The former topic is related to the ion formation in sputtering. With regard to the fact that the
enormous majority of sputtered particles are neutrals, and the ions are necessary for detection, the
understanding of the ionization and excitation mechanisms is of great importance. So far the physical
principles of the ionization mechanisms in solids during sputtering have not been fully explained.
Physical models of ionization mechanisms can be divided into two groups: non-adiabatic, which are
strongly velocity dependent and adiabatic, where the ionization probability P+ depends mainly on the
excitation [14]. For empirical fitting parameters, several models can give results in formal agreement
with the experiment, but for realistic parameters, especially for slow ions, which are important for the
SIMS method, none of the models is quantitatively consistent with the experiment. The ion formation
in sputtering is a major unsolved problem in the field of ion beam analysis, and it has been a
controversial topic for decades. The reason is both in the inherent complexity of the ionization process
in sputtering and in the limited availability of experimental data on absolute ionization probabilities.
An increasing role in the study of ion formation is expected from computer simulations, in particular
from molecular dynamic simulations, if they are coupled with the simulation or estimation of electron
exchange processes. We are aware of only one current group that has been attempting to predict
ionization in sputtering by using MD simulations on model system of Ar bombardment of an Ag
monocrystal [15, 16].
Therefore we have attempted to contribute to the controversial debate about the principles of
ionization mechanisms in sputtering of solids by using molecular dynamics simulation of sputtering of
pure metals in combination with analytical models of ionization probability based on Šroubek’s work
[14, 17] and so we tested predictions of these ionization theories for the Ar-Cu system.
~ 4 ~
The second topic is related to the occurrence of microscopic noble gas bubbles in the subsurface region
of solids [18] observed several decades ago and it is of practical interest for the local modification of
material properties. Moreover, the importance of this phenomenon is enhanced by the fact that the
accumulation of inert gases as a product of nuclear reactions in the fuel or in a nuclear reactor pressure
vessel can lead to problems. Franzreb & Williams [19] observed experimentally the ejection of noble
gas ions from subsurface bubbles and suggested that secondary ion formation took place in the gas
phase by a resonant charge exchange between the incoming primary Ar+ ion and the ejected neutral
Ar species. That phenomenon has not yet been studied on atomistic level. Therefore we focused on a
molecular dynamics simulations of the rupture of a subsurface Ar bubble in Cu(100) and the ejection
of Ar atoms, Ar2 dimers and larger clusters Arn. The rupture was initiated by the Ar atom impact.
2 Goals of the thesis
A general goal is to contribute to the progress in the physics of collision cascades through using our in-
house molecular dynamics simulations program.
That goal was divided to several intermediate steps: (i) to design, develop and implement a method
for molecular dynamics (MD) or Monte Carlo (MC) simulation of atomic collision cascades, (ii) to
manage various methods of rendering 3D images of obtained MD results, (iii) to apply the computer
simulation of sputtering to technologically important materials, (iv) to compare the simulation results
(sputtering yield, angular and energy distribution of sputtered atom energy) with experimental data.
3 MD model
An in-house molecular dynamics (MD) code in Fortran 90 has been created for studying the sputtering
and related phenomena. As the results of sputtering simulations are strongly dependent on the initial
configuration of the experiment, it is necessary to perform a large number of simulations and the
results have to be statistically processed. Excluding several situations specified in the text only the
perpendicular impacts, which corresponded to the 𝑧 direction, have been simulated.
The model of the Cu (100) target consisted of 32000 atoms placed in 20 atomic layers, periodic
boundary conditions in directions perpendicular to the surface normal were applied. Results for the
sample of this size were not influenced by the crystal size dependent artifacts. Electronic stopping
effects were applied with the electronic friction coefficient calculated by Lindhard-Scharff model [20 -
22].
Specific important quantities were continually evaluated during the simulations: Kinetic energy,
potential energy, virial, local temperature and local pressure, number of neighbors and others. The
values of local variables were determined for each particle in the volume of a sphere of radius 𝑟𝑐
centered on the particle.
For the analysis of phenomena that occur during the process of sputtering, it is of great importance to
accurately determine the specimen surface, i.e. the position of the surface plane. For this situation, we
designed and implemented the following procedure: In every step it is required to continuously
exclude finally sputtered particles and to calculate the average of corresponding coordinate values of
the remaining particles in a layer surrounding the original surface plane and to correct the original
surface position on the basis of this average.
~ 5 ~
The detection of sputtered particles was performed by comparing their distances from the local
surface with cut-off 𝑟𝑐. As we needed to know the parameters of sputtered particles at the time they
left the surface, the “candidate particles” for sputtering were identified and a broad set of their
attributes has been continuously stored for later processing.
3.1 Visualization
Our in-house C/C++ program was developed to visualize the results. The open graphics library OpenGL
or its extension GLUT was used because of its high-performance multi-platform API1 for development
of computer graphics applications [23].
The developed interactive application allows for the visualization of output files in diverse formats, as
smooth animations or as bitmaps or movie.
3.1 MD simulation of sputtering yields
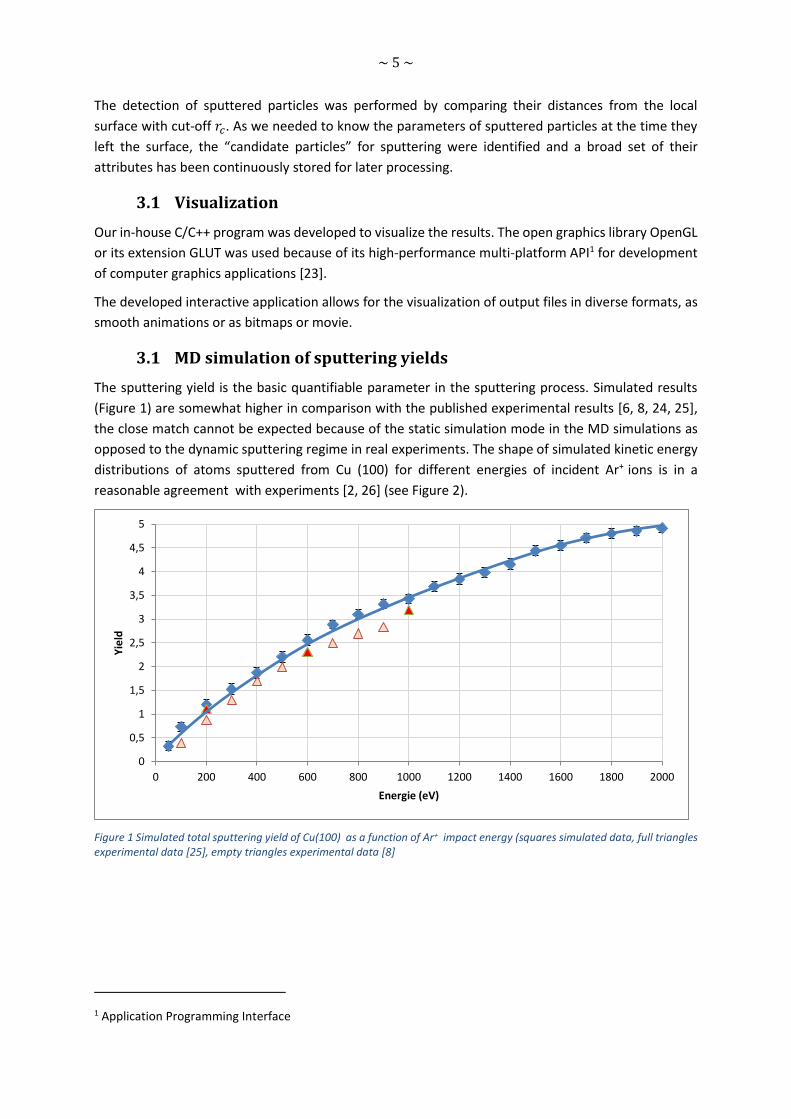
The sputtering yield is the basic quantifiable parameter in the sputtering process. Simulated results
(Figure 1) are somewhat higher in comparison with the published experimental results [6, 8, 24, 25],
the close match cannot be expected because of the static simulation mode in the MD simulations as
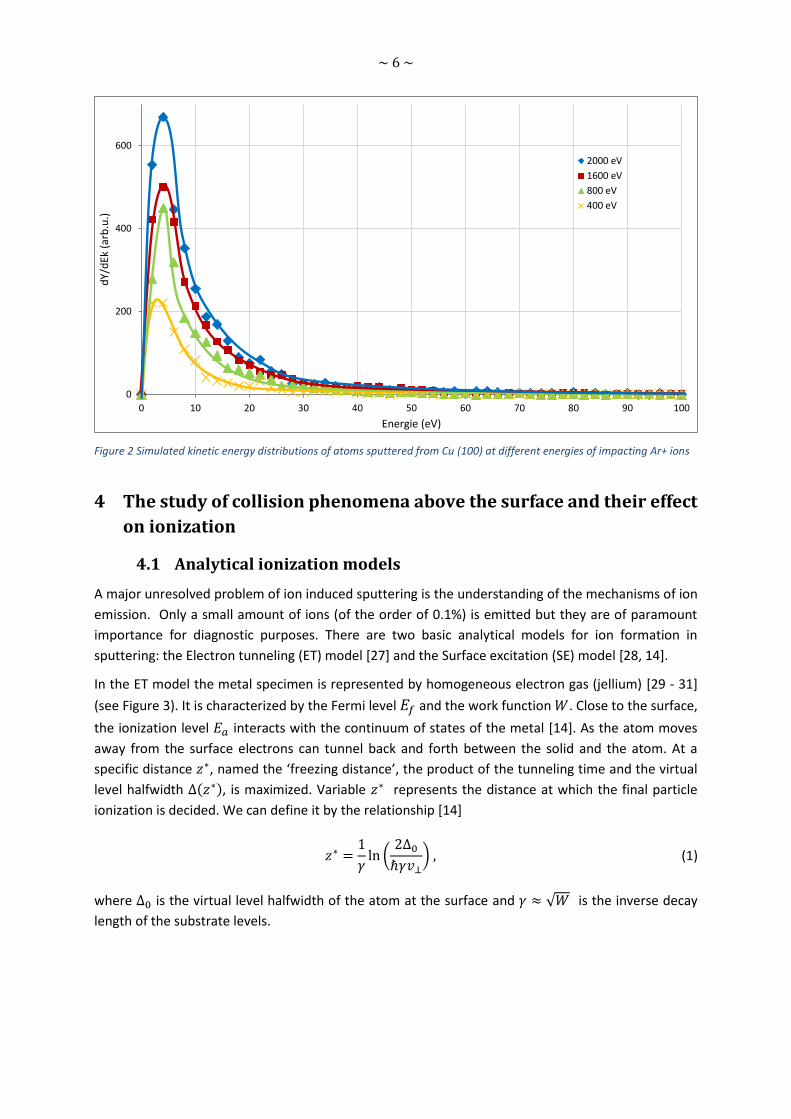
opposed to the dynamic sputtering regime in real experiments. The shape of simulated kinetic energy
distributions of atoms sputtered from Cu (100) for different energies of incident Ar+ ions is in a
reasonable agreement with experiments [2, 26] (see Figure 2).
Figure 1 Simulated total sputtering yield of Cu(100) as a function of Ar+ impact energy (squares simulated data, full triangles experimental data [25], empty triangles experimental data [8]
1 Application Programming Interface
0
0,5
1
1,5
2
2,5
3
3,5
4
4,5
5
0 200 400 600 800 1000 1200 1400 1600 1800 2000
Yie
ld
Energie (eV)
~ 6 ~
Figure 2 Simulated kinetic energy distributions of atoms sputtered from Cu (100) at different energies of impacting Ar+ ions
4 The study of collision phenomena above the surface and their effect
on ionization
4.1 Analytical ionization models
A major unresolved problem of ion induced sputtering is the understanding of the mechanisms of ion
emission. Only a small amount of ions (of the order of 0.1%) is emitted but they are of paramount
importance for diagnostic purposes. There are two basic analytical models for ion formation in
sputtering: the Electron tunneling (ET) model [27] and the Surface excitation (SE) model [28, 14].
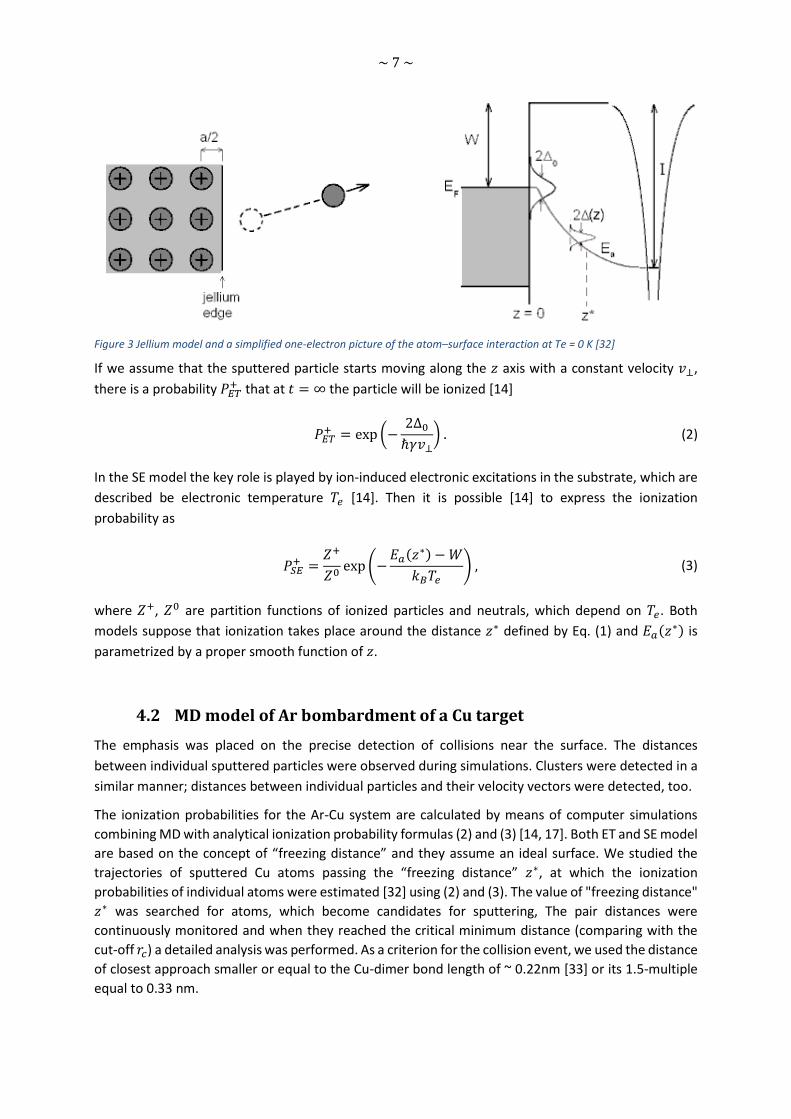
In the ET model the metal specimen is represented by homogeneous electron gas (jellium) [29 - 31]
(see Figure 3). It is characterized by the Fermi level 𝐸𝑓 and the work function 𝑊. Close to the surface,
the ionization level 𝐸𝑎 interacts with the continuum of states of the metal [14]. As the atom moves
away from the surface electrons can tunnel back and forth between the solid and the atom. At a
specific distance 𝑧∗, named the ‘freezing distance’, the product of the tunneling time and the virtual
level halfwidth ∆(𝑧∗), is maximized. Variable 𝑧∗ represents the distance at which the final particle
ionization is decided. We can define it by the relationship [14]
𝑧∗ =1
𝛾ln (
2∆0
ℏ𝛾𝑣⊥) , (1)
where ∆0 is the virtual level halfwidth of the atom at the surface and 𝛾 ≈ √𝑊 is the inverse decay
length of the substrate levels.
0
200
400
600
0 10 20 30 40 50 60 70 80 90 100
dY/
dEk
(ar
b.u
.)
Energie (eV)
2000 eV
1600 eV
800 eV
400 eV
~ 7 ~
Figure 3 Jellium model and a simplified one-electron picture of the atom–surface interaction at Te = 0 K [32]
If we assume that the sputtered particle starts moving along the 𝑧 axis with a constant velocity 𝑣⊥,
there is a probability 𝑃𝐸𝑇+ that at 𝑡 = ∞ the particle will be ionized [14]
𝑃𝐸𝑇+ = exp (−
2∆0
ℏ𝛾𝑣⊥) . (2)
In the SE model the key role is played by ion-induced electronic excitations in the substrate, which are
described be electronic temperature 𝑇𝑒 [14]. Then it is possible [14] to express the ionization
probability as
𝑃𝑆𝐸+ =
𝑍+
𝑍0exp (−
𝐸𝑎(𝑧∗) − 𝑊
𝑘𝐵𝑇𝑒) , (3)
where 𝑍+, 𝑍0 are partition functions of ionized particles and neutrals, which depend on 𝑇𝑒. Both
models suppose that ionization takes place around the distance 𝑧∗ defined by Eq. (1) and 𝐸𝑎(𝑧∗) is
parametrized by a proper smooth function of 𝑧.
4.2 MD model of Ar bombardment of a Cu target
The emphasis was placed on the precise detection of collisions near the surface. The distances
between individual sputtered particles were observed during simulations. Clusters were detected in a
similar manner; distances between individual particles and their velocity vectors were detected, too.
The ionization probabilities for the Ar-Cu system are calculated by means of computer simulations
combining MD with analytical ionization probability formulas (2) and (3) [14, 17]. Both ET and SE model
are based on the concept of “freezing distance” and they assume an ideal surface. We studied the
trajectories of sputtered Cu atoms passing the “freezing distance” 𝑧∗, at which the ionization
probabilities of individual atoms were estimated [32] using (2) and (3). The value of "freezing distance"
𝑧∗ was searched for atoms, which become candidates for sputtering, The pair distances were
continuously monitored and when they reached the critical minimum distance (comparing with the
cut-off 𝑟𝑐) a detailed analysis was performed. As a criterion for the collision event, we used the distance
of closest approach smaller or equal to the Cu-dimer bond length of ~ 0.22nm [33] or its 1.5-multiple
equal to 0.33 nm.
~ 8 ~
4.3 MD simulations of spectral ionization probabilities
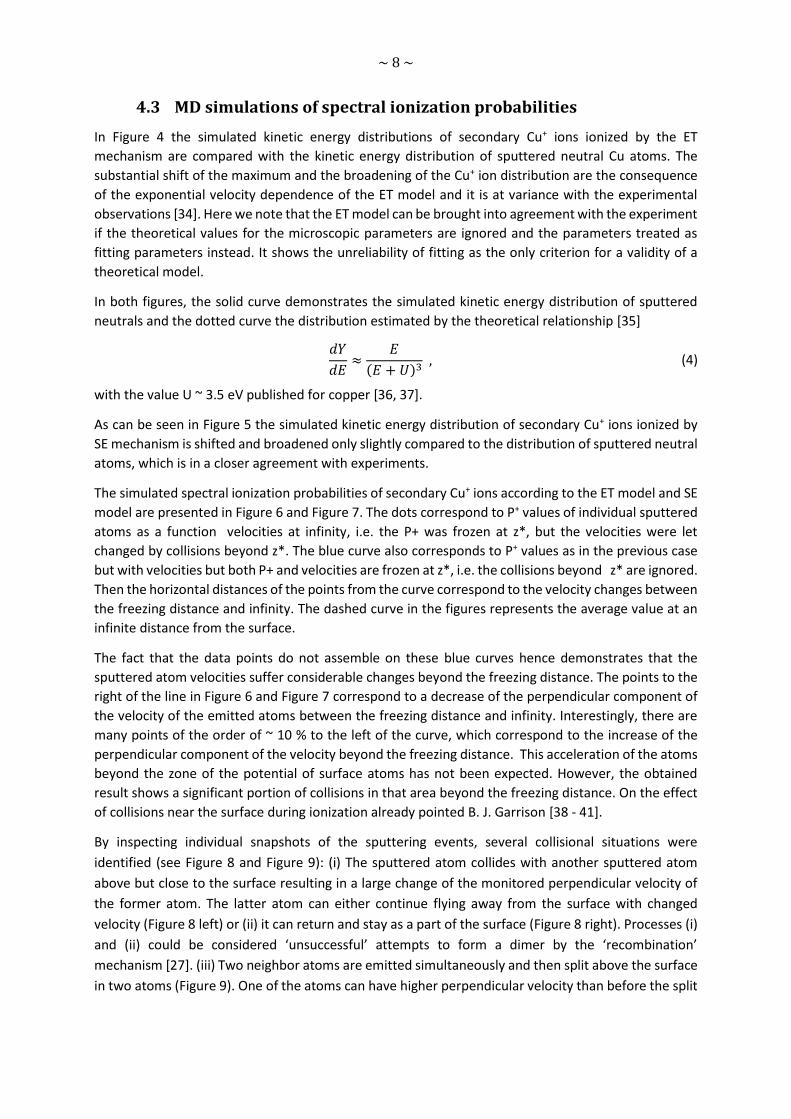
In Figure 4 the simulated kinetic energy distributions of secondary Cu+ ions ionized by the ET
mechanism are compared with the kinetic energy distribution of sputtered neutral Cu atoms. The
substantial shift of the maximum and the broadening of the Cu+ ion distribution are the consequence
of the exponential velocity dependence of the ET model and it is at variance with the experimental
observations [34]. Here we note that the ET model can be brought into agreement with the experiment
if the theoretical values for the microscopic parameters are ignored and the parameters treated as
fitting parameters instead. It shows the unreliability of fitting as the only criterion for a validity of a
theoretical model.
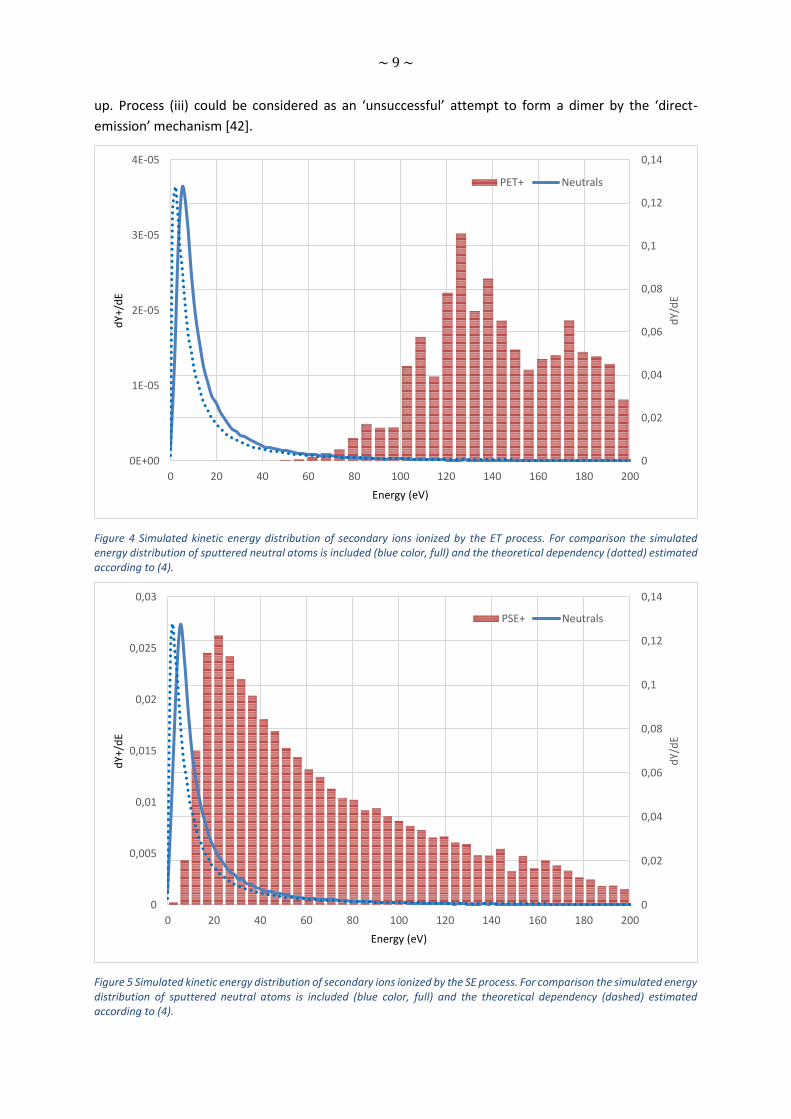
In both figures, the solid curve demonstrates the simulated kinetic energy distribution of sputtered
neutrals and the dotted curve the distribution estimated by the theoretical relationship [35]
𝑑𝑌
𝑑𝐸≈
𝐸
(𝐸 + 𝑈)3 , (4)
with the value U ~ 3.5 eV published for copper [36, 37].
As can be seen in Figure 5 the simulated kinetic energy distribution of secondary Cu+ ions ionized by
SE mechanism is shifted and broadened only slightly compared to the distribution of sputtered neutral
atoms, which is in a closer agreement with experiments.
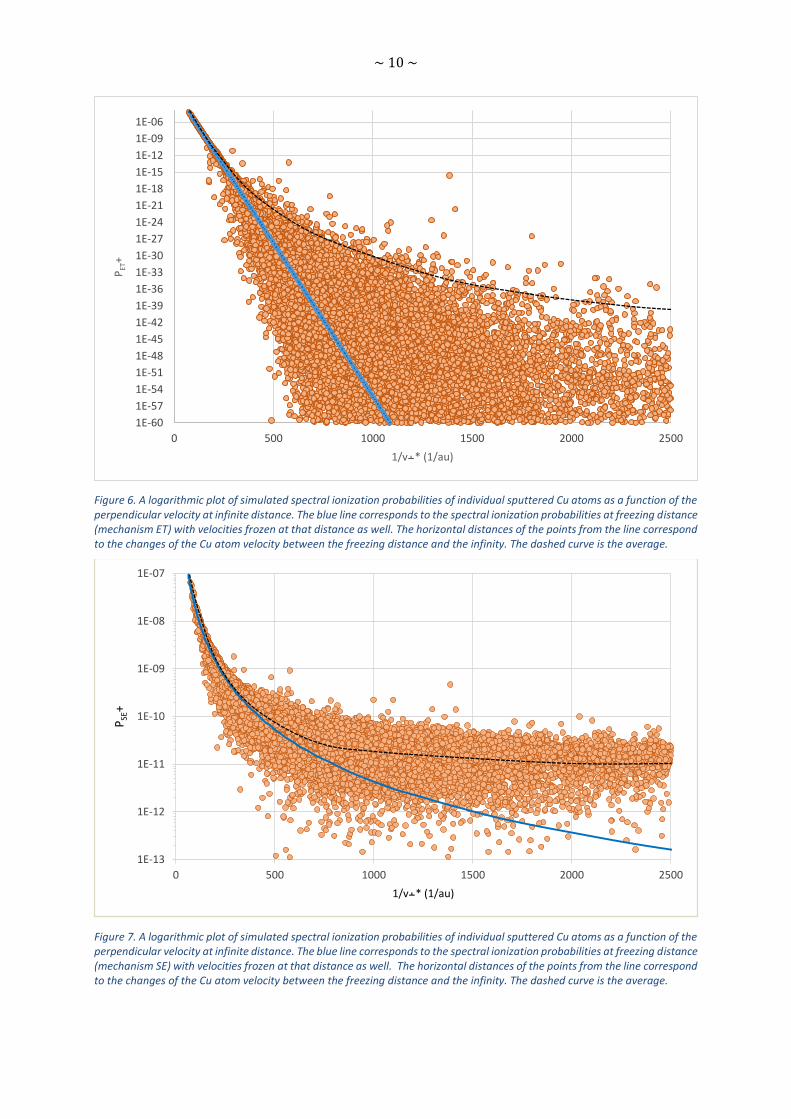
The simulated spectral ionization probabilities of secondary Cu+ ions according to the ET model and SE
model are presented in Figure 6 and Figure 7. The dots correspond to P+ values of individual sputtered
atoms as a function velocities at infinity, i.e. the P+ was frozen at z*, but the velocities were let
changed by collisions beyond z*. The blue curve also corresponds to P+ values as in the previous case
but with velocities but both P+ and velocities are frozen at z*, i.e. the collisions beyond z* are ignored.
Then the horizontal distances of the points from the curve correspond to the velocity changes between
the freezing distance and infinity. The dashed curve in the figures represents the average value at an
infinite distance from the surface.
The fact that the data points do not assemble on these blue curves hence demonstrates that the
sputtered atom velocities suffer considerable changes beyond the freezing distance. The points to the
right of the line in Figure 6 and Figure 7 correspond to a decrease of the perpendicular component of
the velocity of the emitted atoms between the freezing distance and infinity. Interestingly, there are
many points of the order of ~ 10 % to the left of the curve, which correspond to the increase of the
perpendicular component of the velocity beyond the freezing distance. This acceleration of the atoms
beyond the zone of the potential of surface atoms has not been expected. However, the obtained
result shows a significant portion of collisions in that area beyond the freezing distance. On the effect
of collisions near the surface during ionization already pointed B. J. Garrison [38 - 41].
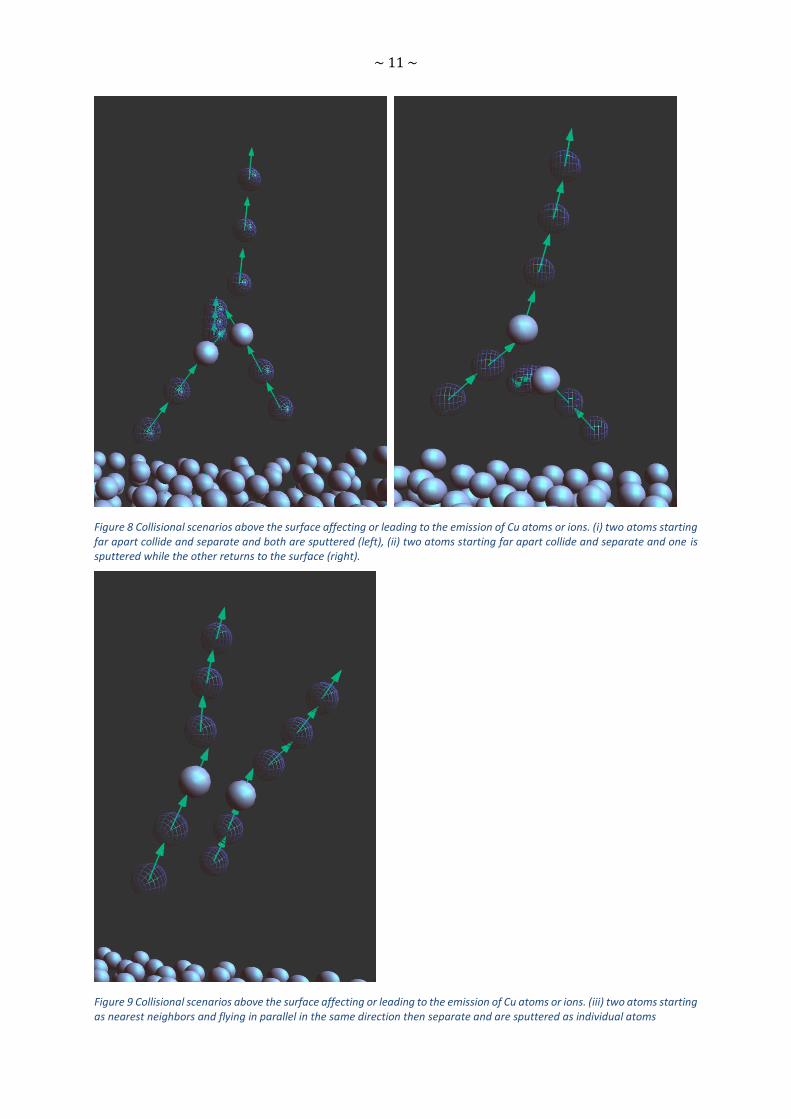
By inspecting individual snapshots of the sputtering events, several collisional situations were
identified (see Figure 8 and Figure 9): (i) The sputtered atom collides with another sputtered atom
above but close to the surface resulting in a large change of the monitored perpendicular velocity of
the former atom. The latter atom can either continue flying away from the surface with changed
velocity (Figure 8 left) or (ii) it can return and stay as a part of the surface (Figure 8 right). Processes (i)
and (ii) could be considered ‘unsuccessful’ attempts to form a dimer by the ‘recombination’
mechanism [27]. (iii) Two neighbor atoms are emitted simultaneously and then split above the surface
in two atoms (Figure 9). One of the atoms can have higher perpendicular velocity than before the split
~ 9 ~
up. Process (iii) could be considered as an ‘unsuccessful’ attempt to form a dimer by the ‘direct-
emission’ mechanism [42].
Figure 4 Simulated kinetic energy distribution of secondary ions ionized by the ET process. For comparison the simulated energy distribution of sputtered neutral atoms is included (blue color, full) and the theoretical dependency (dotted) estimated according to (4).
Figure 5 Simulated kinetic energy distribution of secondary ions ionized by the SE process. For comparison the simulated energy distribution of sputtered neutral atoms is included (blue color, full) and the theoretical dependency (dashed) estimated according to (4).
0E+00
1E-05
2E-05
3E-05
4E-05
0
0,02
0,04
0,06
0,08
0,1
0,12
0,14
0 20 40 60 80 100 120 140 160 180 200
dY+
/dE
dY/
dE
Energy (eV)
PET+ Neutrals
0
0,005
0,01
0,015
0,02
0,025
0,03
0
0,02
0,04
0,06
0,08
0,1
0,12
0,14
0 20 40 60 80 100 120 140 160 180 200
Energy (eV)
dY+
/dE
dY/
dE
PSE+ Neutrals
~ 10 ~
Figure 6. A logarithmic plot of simulated spectral ionization probabilities of individual sputtered Cu atoms as a function of the perpendicular velocity at infinite distance. The blue line corresponds to the spectral ionization probabilities at freezing distance (mechanism ET) with velocities frozen at that distance as well. The horizontal distances of the points from the line correspond to the changes of the Cu atom velocity between the freezing distance and the infinity. The dashed curve is the average.
Figure 7. A logarithmic plot of simulated spectral ionization probabilities of individual sputtered Cu atoms as a function of the perpendicular velocity at infinite distance. The blue line corresponds to the spectral ionization probabilities at freezing distance (mechanism SE) with velocities frozen at that distance as well. The horizontal distances of the points from the line correspond to the changes of the Cu atom velocity between the freezing distance and the infinity. The dashed curve is the average.
1E-60
1E-57
1E-54
1E-51
1E-48
1E-45
1E-42
1E-39
1E-36
1E-33
1E-30
1E-27
1E-24
1E-21
1E-18
1E-15
1E-12
1E-09
1E-06
0 500 1000 1500 2000 2500
PET
+
1/v+* (1/au)
1E-13
1E-12
1E-11
1E-10
1E-09
1E-08
1E-07
0 500 1000 1500 2000 2500
PSE
+
1/v+* (1/au)
~ 11 ~
Figure 8 Collisional scenarios above the surface affecting or leading to the emission of Cu atoms or ions. (i) two atoms starting far apart collide and separate and both are sputtered (left), (ii) two atoms starting far apart collide and separate and one is sputtered while the other returns to the surface (right).
Figure 9 Collisional scenarios above the surface affecting or leading to the emission of Cu atoms or ions. (iii) two atoms starting as nearest neighbors and flying in parallel in the same direction then separate and are sputtered as individual atoms
~ 12 ~
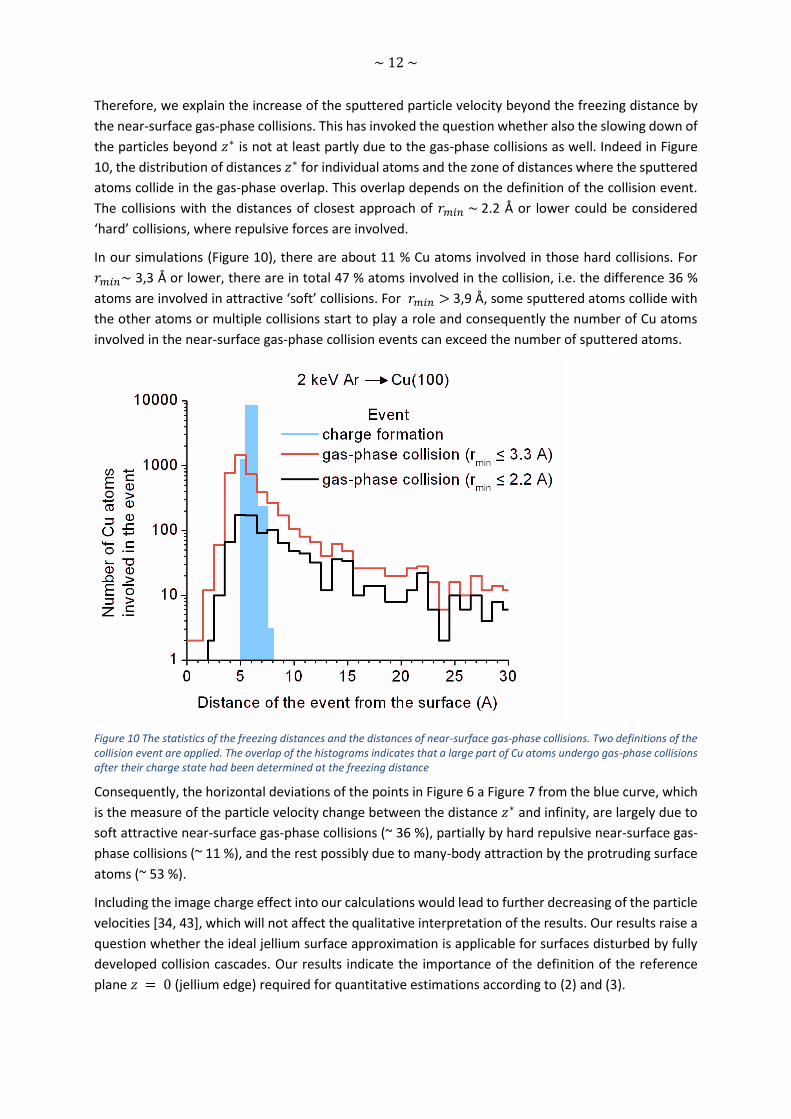
Therefore, we explain the increase of the sputtered particle velocity beyond the freezing distance by
the near-surface gas-phase collisions. This has invoked the question whether also the slowing down of
the particles beyond 𝑧∗ is not at least partly due to the gas-phase collisions as well. Indeed in Figure
10, the distribution of distances 𝑧∗ for individual atoms and the zone of distances where the sputtered
atoms collide in the gas-phase overlap. This overlap depends on the definition of the collision event.
The collisions with the distances of closest approach of 𝑟𝑚𝑖𝑛 ~ 2.2 Å or lower could be considered
‘hard’ collisions, where repulsive forces are involved.
In our simulations (Figure 10), there are about 11 % Cu atoms involved in those hard collisions. For
𝑟𝑚𝑖𝑛~ 3,3 Å or lower, there are in total 47 % atoms involved in the collision, i.e. the difference 36 %
atoms are involved in attractive ‘soft’ collisions. For 𝑟𝑚𝑖𝑛 > 3,9 Å, some sputtered atoms collide with
the other atoms or multiple collisions start to play a role and consequently the number of Cu atoms
involved in the near-surface gas-phase collision events can exceed the number of sputtered atoms.
Figure 10 The statistics of the freezing distances and the distances of near-surface gas-phase collisions. Two definitions of the collision event are applied. The overlap of the histograms indicates that a large part of Cu atoms undergo gas-phase collisions after their charge state had been determined at the freezing distance
Consequently, the horizontal deviations of the points in Figure 6 a Figure 7 from the blue curve, which
is the measure of the particle velocity change between the distance 𝑧∗ and infinity, are largely due to
soft attractive near-surface gas-phase collisions (~ 36 %), partially by hard repulsive near-surface gas-
phase collisions (~ 11 %), and the rest possibly due to many-body attraction by the protruding surface
atoms (~ 53 %).
Including the image charge effect into our calculations would lead to further decreasing of the particle
velocities [34, 43], which will not affect the qualitative interpretation of the results. Our results raise a
question whether the ideal jellium surface approximation is applicable for surfaces disturbed by fully
developed collision cascades. Our results indicate the importance of the definition of the reference
plane 𝑧 = 0 (jellium edge) required for quantitative estimations according to (2) and (3).
~ 13 ~
5 Simulation of the rupture of a subsurface nanobubble
A 3-nm diameter cavity was created two monolayers below the Cu (100) surface. Then Ar atoms were
added until the bubble could not hold more without its spontaneous rupture. The stable conditions for
that bubble size were met for 610 Ar atoms corresponding to the atomic density of 4,3 . 1022 cm-3,
which is close to the experimental values [44].
For the interaction between Cu atoms, we used an EAM potential, splined to the purely repulsive ZBL
[45]. Lennard-Jones potential [46, 47] was used for Ar-Ar and Ar-Cu interactions. We let the crystal
relax until equilibrium between the bubble and the crystal at 300 K was reached. The „bounce-back“
boundary conditions for the relaxation of the system as a whole were used [48].
5.1 The central impact
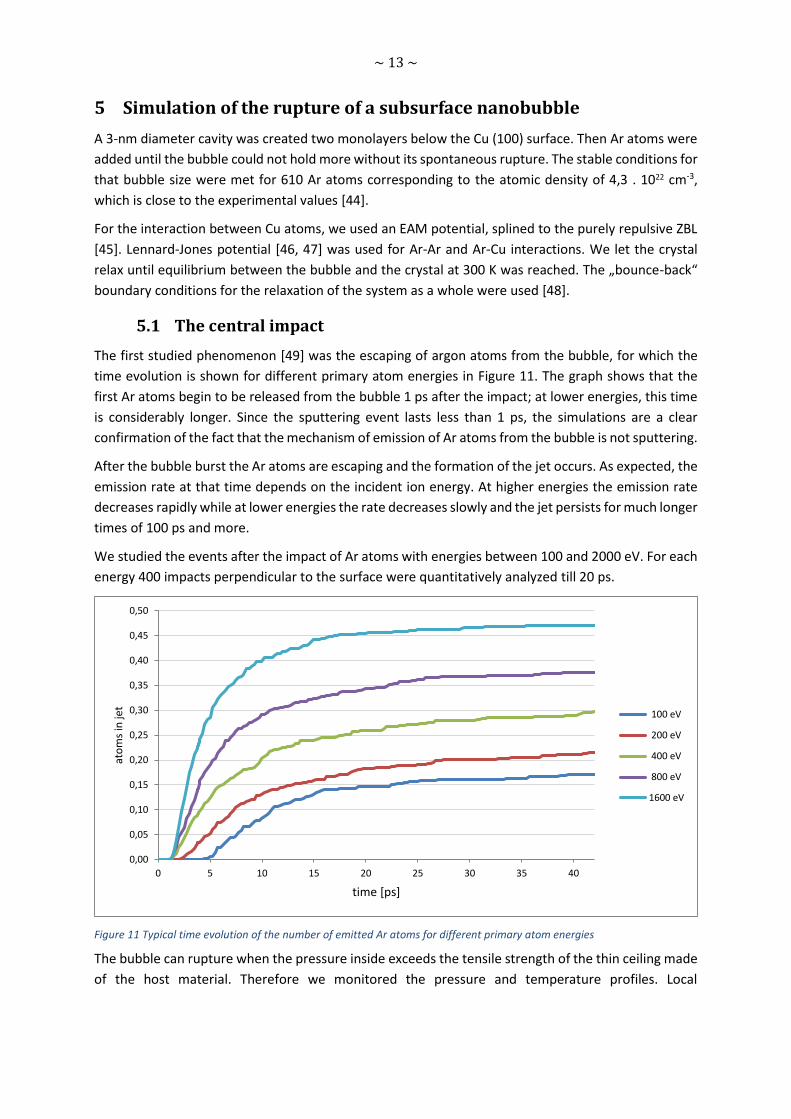
The first studied phenomenon [49] was the escaping of argon atoms from the bubble, for which the
time evolution is shown for different primary atom energies in Figure 11. The graph shows that the
first Ar atoms begin to be released from the bubble 1 ps after the impact; at lower energies, this time
is considerably longer. Since the sputtering event lasts less than 1 ps, the simulations are a clear
confirmation of the fact that the mechanism of emission of Ar atoms from the bubble is not sputtering.
After the bubble burst the Ar atoms are escaping and the formation of the jet occurs. As expected, the
emission rate at that time depends on the incident ion energy. At higher energies the emission rate
decreases rapidly while at lower energies the rate decreases slowly and the jet persists for much longer
times of 100 ps and more.
We studied the events after the impact of Ar atoms with energies between 100 and 2000 eV. For each
energy 400 impacts perpendicular to the surface were quantitatively analyzed till 20 ps.
Figure 11 Typical time evolution of the number of emitted Ar atoms for different primary atom energies
The bubble can rupture when the pressure inside exceeds the tensile strength of the thin ceiling made
of the host material. Therefore we monitored the pressure and temperature profiles. Local
0,00
0,05
0,10
0,15
0,20
0,25
0,30
0,35
0,40
0,45
0,50
0 5 10 15 20 25 30 35 40
ato
ms
inje
t
time [ps]
100 eV
200 eV
400 eV
800 eV
1600 eV
~ 14 ~
temperature and pressure were calculated for each atom as average quantities in the sphere of radius
𝑟𝑐 [50].
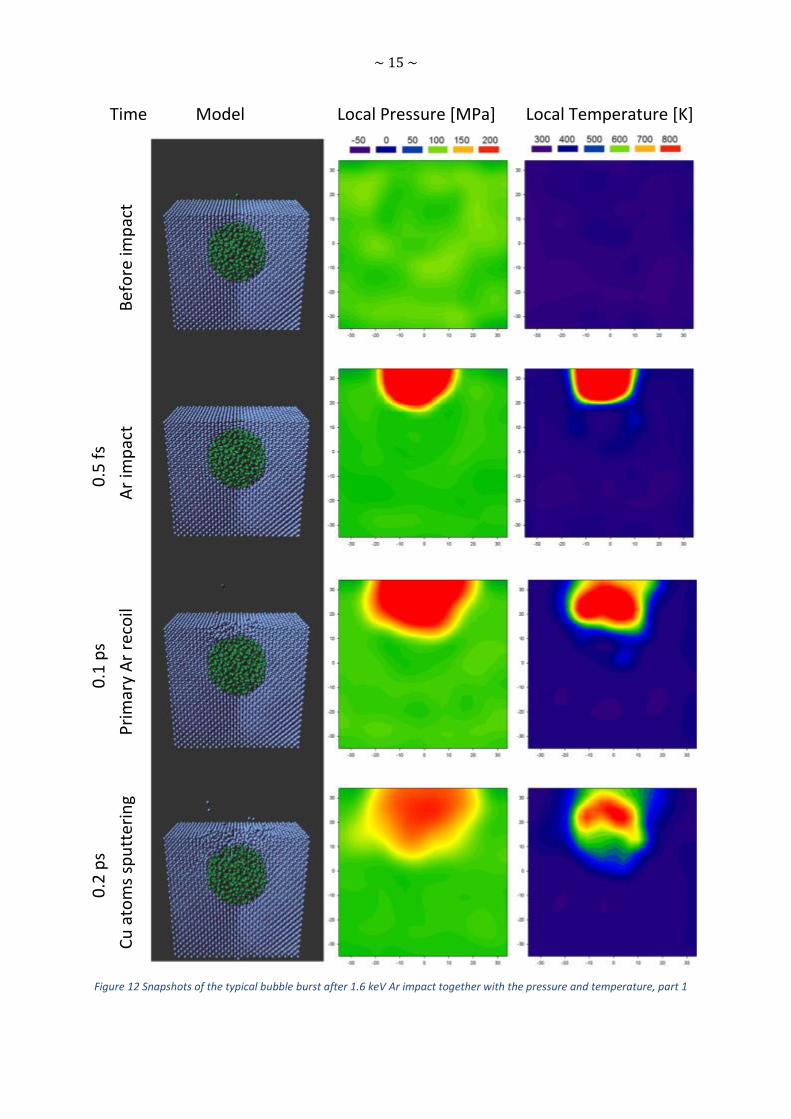
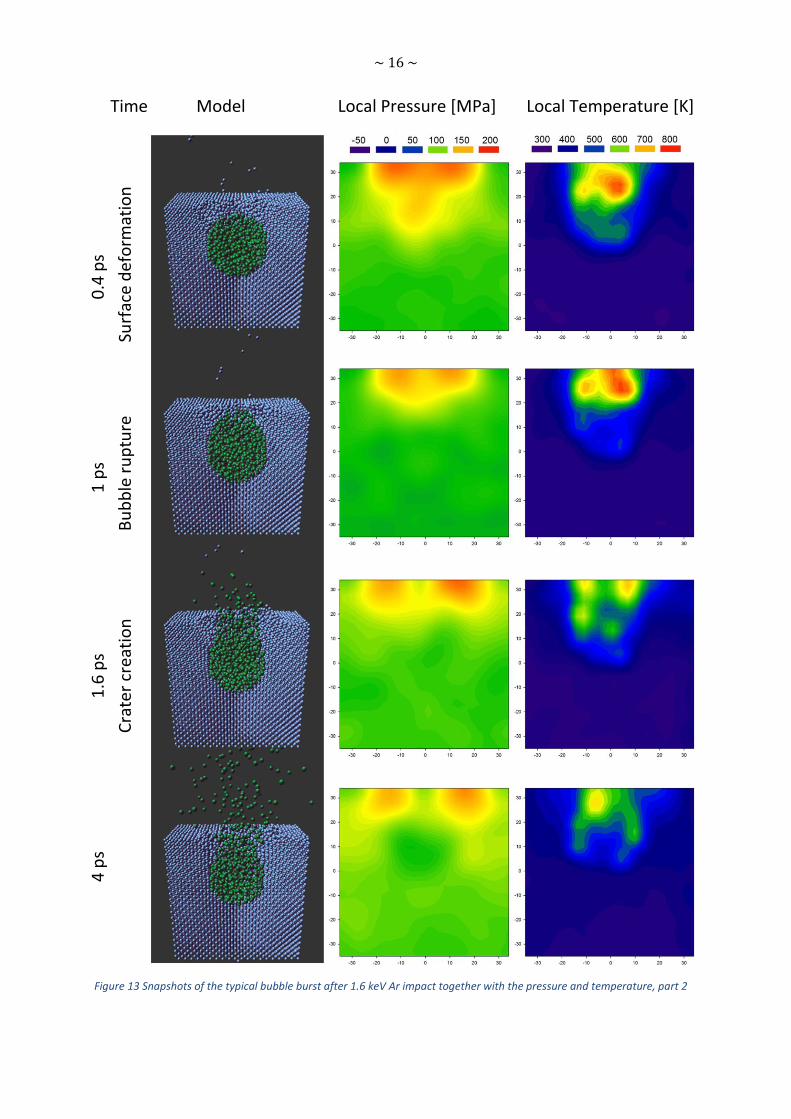
Typical results of bubble rupture simulations are visualized in Figure 12 to Figure 14. The first snapshot
corresponds to the equilibrated Ar bubble inside the host Cu (100) matrix. The high pressure and
temperature contours 0.5 fs after the impact is due to the artificial conversion of the kinetic energies
of the particles to the “temperature” without previous equilibration by mutual collisions. Later on once
the particle ensemble went through a sufficient number of collisions both temperature and pressure
obtain more realistic values. According to [51, 52] three collisions per atom are sufficient for the
thermalisation.
Pressure difference ~ 50 MPa exerts upon the thinnest part of the bubble ceiling, which leads at 0.8 ps
to a bulging of the surface above the bubble. The pressure is concentrated and the temperature is
elevated in the upper part of the bubble. At ~ 2 ps an opening in the bubble forms and at ~ 4 ps the
Ar gas is being released. The spots of higher and lower pressure as a function of time can be observed
in the pressure profiles, which may indicate some kind of Ar gas oscillation. High temperature (higher
than ∼ 800 K in the bottleneck up to ∼ 2 ps) reflects the collision cascade phase. The Ar atoms from
the bubble are released from the bottleneck area when there are maximal temperatures between
∼ 600 and ∼ 700 K, which after ∼20 ps decreases towards the equilibrium 300 – 400 K reached at ∼
40 ps.
The values of the pressure and temperature for the bubble created 4 monolayers below the Cu(100)
surface are similar, except, that the rupture occurred later: 5 ps after impact.
Conversely, at higher energies of incident atom (1600 eV in Figure 12 to Figure 14) the rupture occurs
earlier. This is caused not only by higher levels of local pressure and local temperature near the impact,
but also by altered rupture mechanism. While in the previous case the main effects were the bulging
and the subsequent creation of a narrow neck, at higher energies the sputtering of a few atoms of
copper occurred immediately after the primary particle impact. The surface around the impact point
is strongly disturbed and this leads to the formation of the crater through which Ar atoms escape from
the bubble.
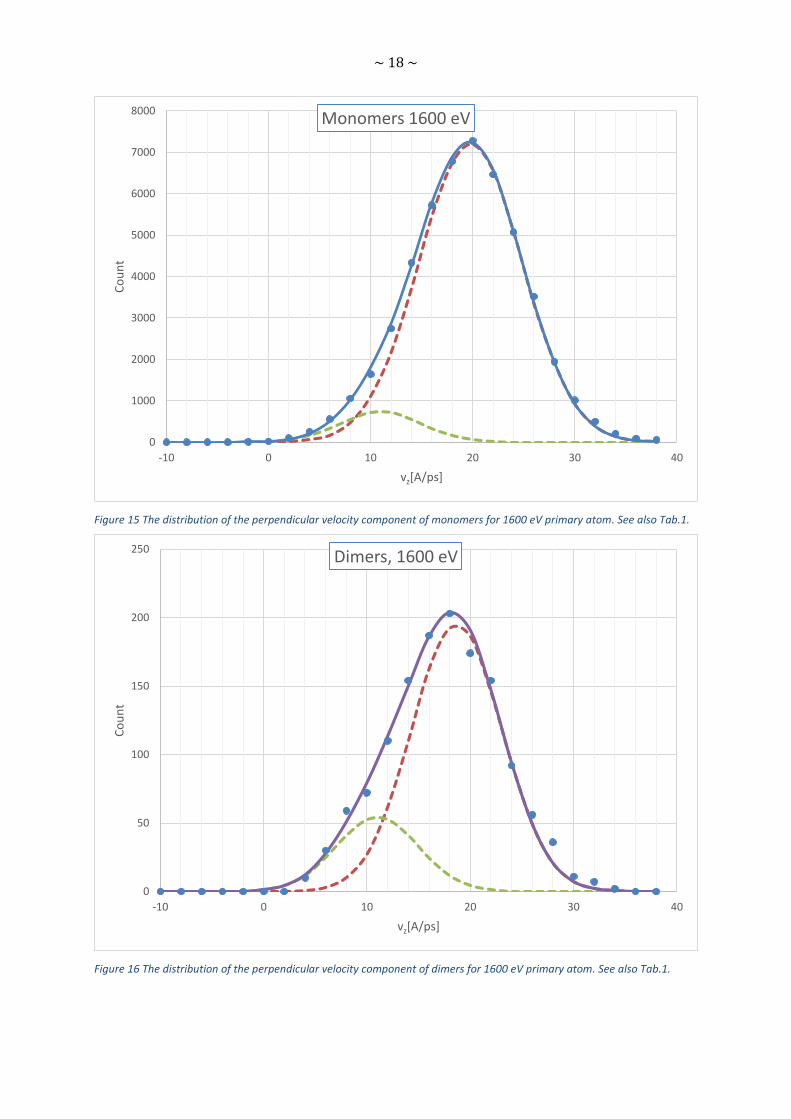
The example of the distribution of the velocity components 𝑣𝑥, 𝑣𝑦, and 𝑣𝑧 of Ar atoms in the jet at 20
ps is displayed in Figure 15 and Figure 16, where the z-direction is perpendicular and x- and y directions
are parallel to the surface. The distributions were fitted with the Maxwell–Boltzmann (MB) function
(solid curves in Figure 15 and Figure 16). The fitting results for monomers and dimers are in Table 1.
The distribution of the perpendicular component 𝑣𝑧 is especially for lower impacting atom energies
asymmetrical and can be written as a sum of two MB functions. While the average velocity of dimers
agrees with that of the gas in which the dimers are entrained, the width of the dimer distribution
(‘temperature’) is narrower. Since Ar dimers are fragile, only atom pairs in a small window of relative
velocity can stay bound or become bound. Thus dimers are colder than the environment gas; otherwise
they would disintegrate. Besides monomers and dimers, several trimers were detected – an
insufficient amount for statistical processing.
~ 15 ~
Figure 12 Snapshots of the typical bubble burst after 1.6 keV Ar impact together with the pressure and temperature, part 1
Time Model Local Pressure [MPa] Local Temperature [K] 0
.2 p
s
0
.1 p
s
0.5
fs
Cu
ato
ms
spu
tter
ing
Pri
mar
y A
r re
coil
A
r im
pac
t
Bef
ore
imp
act
~ 16 ~
Figure 13 Snapshots of the typical bubble burst after 1.6 keV Ar impact together with the pressure and temperature, part 2
Time Model Local Pressure [MPa] Local Temperature [K]
[K]
4 p
s
1.6
ps
1
ps
0
.4 p
s
C
rate
r cr
eati
on
Bu
bb
le r
up
ture
Su
rfac
e d
efo
rmat
ion
~ 17 ~
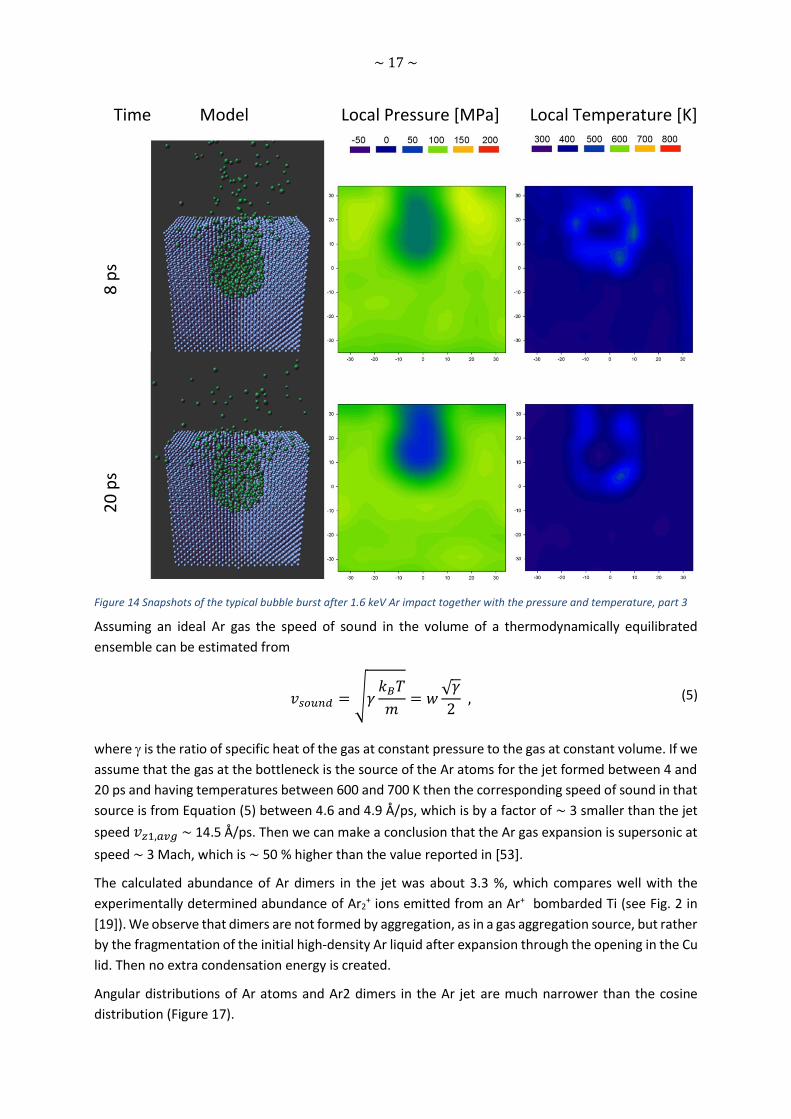
Figure 14 Snapshots of the typical bubble burst after 1.6 keV Ar impact together with the pressure and temperature, part 3
Assuming an ideal Ar gas the speed of sound in the volume of a thermodynamically equilibrated
ensemble can be estimated from
𝑣𝑠𝑜𝑢𝑛𝑑 = √𝛾𝑘𝐵𝑇
𝑚= 𝑤
√𝛾
2 , (5)
where is the ratio of specific heat of the gas at constant pressure to the gas at constant volume. If we
assume that the gas at the bottleneck is the source of the Ar atoms for the jet formed between 4 and
20 ps and having temperatures between 600 and 700 K then the corresponding speed of sound in that
source is from Equation (5) between 4.6 and 4.9 Å/ps, which is by a factor of ∼ 3 smaller than the jet
speed 𝑣𝑧1,𝑎𝑣𝑔 ~ 14.5 Å/ps. Then we can make a conclusion that the Ar gas expansion is supersonic at
speed ∼ 3 Mach, which is ∼ 50 % higher than the value reported in [53].
The calculated abundance of Ar dimers in the jet was about 3.3 %, which compares well with the
experimentally determined abundance of Ar2+ ions emitted from an Ar+ bombarded Ti (see Fig. 2 in
[19]). We observe that dimers are not formed by aggregation, as in a gas aggregation source, but rather
by the fragmentation of the initial high-density Ar liquid after expansion through the opening in the Cu
lid. Then no extra condensation energy is created.
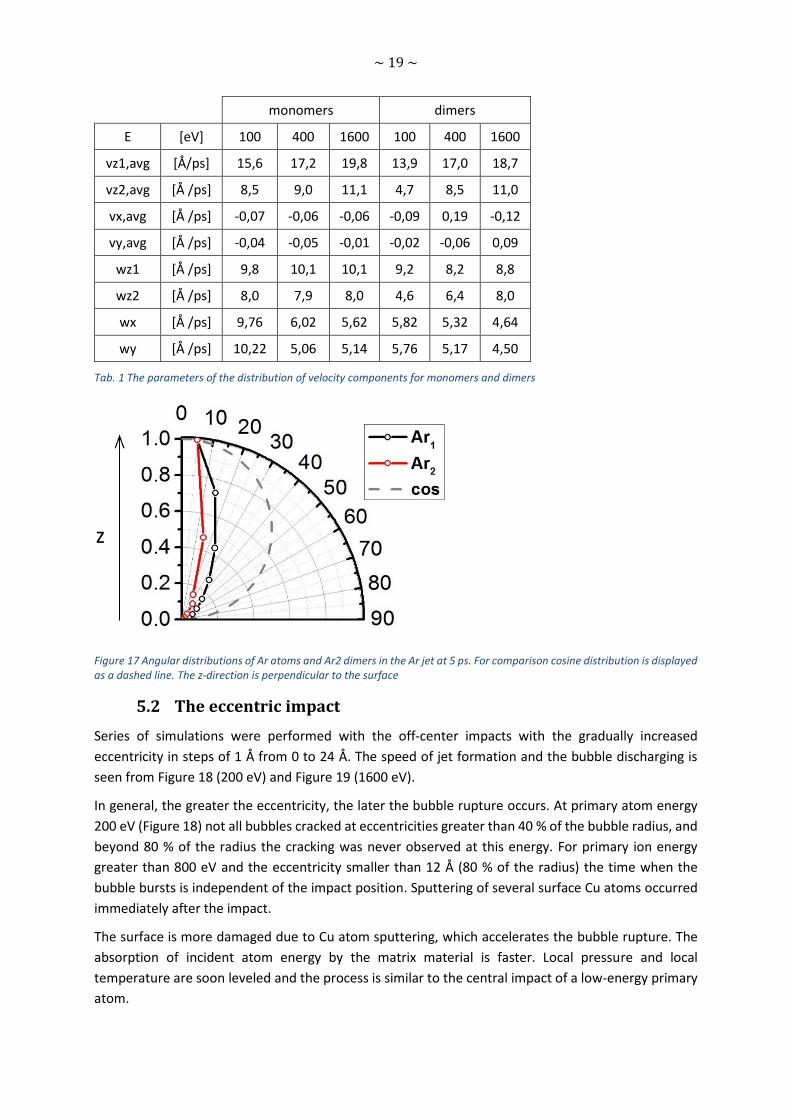
Angular distributions of Ar atoms and Ar2 dimers in the Ar jet are much narrower than the cosine
distribution (Figure 17).
Time Model Local Pressure [MPa] Local Temperature [K]
[K]
20
ps
8
ps
~ 18 ~
Figure 15 The distribution of the perpendicular velocity component of monomers for 1600 eV primary atom. See also Tab.1.
Figure 16 The distribution of the perpendicular velocity component of dimers for 1600 eV primary atom. See also Tab.1.
0
1000
2000
3000
4000
5000
6000
7000
8000
-10 0 10 20 30 40
Co
un
t
vz[A/ps]
Monomers 1600 eV
0
50
100
150
200
250
-10 0 10 20 30 40
Co
un
t
vz[A/ps]
Dimers, 1600 eV
~ 19 ~
monomers dimers
E [eV] 100 400 1600 100 400 1600
vz1,avg [Å/ps] 15,6 17,2 19,8 13,9 17,0 18,7
vz2,avg [Å /ps] 8,5 9,0 11,1 4,7 8,5 11,0
vx,avg [Å /ps] -0,07 -0,06 -0,06 -0,09 0,19 -0,12
vy,avg [Å /ps] -0,04 -0,05 -0,01 -0,02 -0,06 0,09
wz1 [Å /ps] 9,8 10,1 10,1 9,2 8,2 8,8
wz2 [Å /ps] 8,0 7,9 8,0 4,6 6,4 8,0
wx [Å /ps] 9,76 6,02 5,62 5,82 5,32 4,64
wy [Å /ps] 10,22 5,06 5,14 5,76 5,17 4,50
Tab. 1 The parameters of the distribution of velocity components for monomers and dimers
Figure 17 Angular distributions of Ar atoms and Ar2 dimers in the Ar jet at 5 ps. For comparison cosine distribution is displayed as a dashed line. The z-direction is perpendicular to the surface
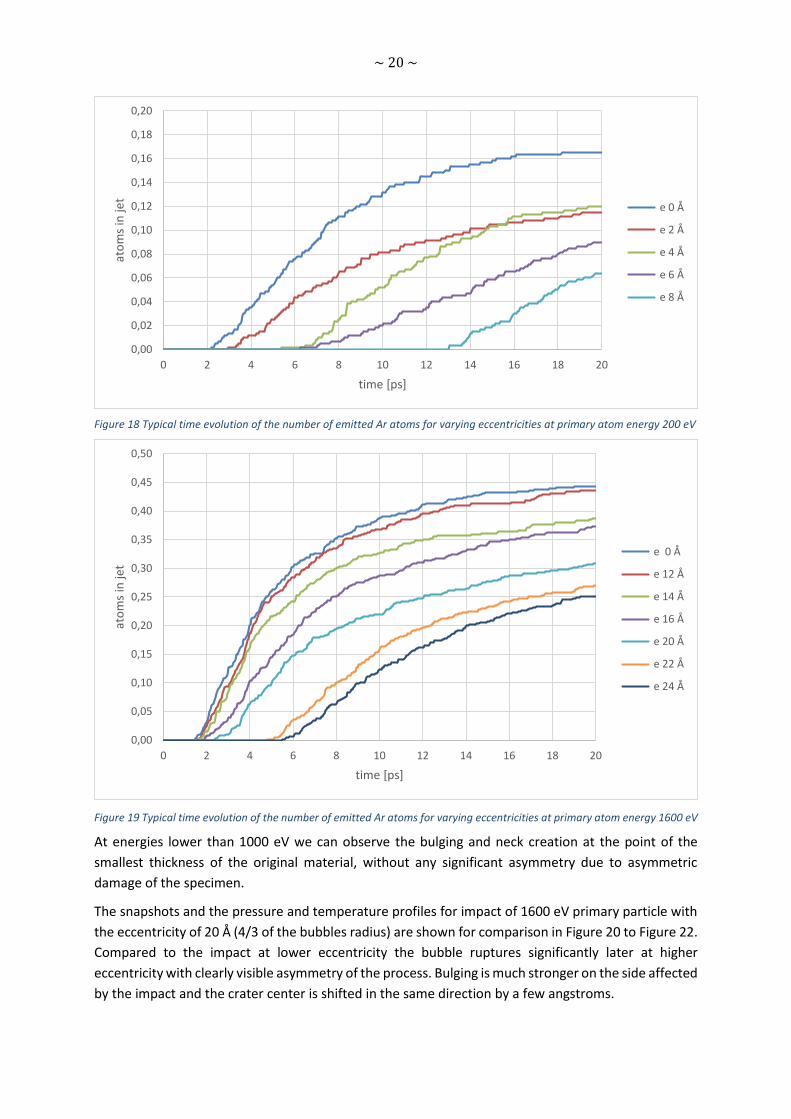
5.2 The eccentric impact
Series of simulations were performed with the off-center impacts with the gradually increased
eccentricity in steps of 1 Å from 0 to 24 Å. The speed of jet formation and the bubble discharging is
seen from Figure 18 (200 eV) and Figure 19 (1600 eV).
In general, the greater the eccentricity, the later the bubble rupture occurs. At primary atom energy
200 eV (Figure 18) not all bubbles cracked at eccentricities greater than 40 % of the bubble radius, and
beyond 80 % of the radius the cracking was never observed at this energy. For primary ion energy
greater than 800 eV and the eccentricity smaller than 12 Å (80 % of the radius) the time when the
bubble bursts is independent of the impact position. Sputtering of several surface Cu atoms occurred
immediately after the impact.
The surface is more damaged due to Cu atom sputtering, which accelerates the bubble rupture. The
absorption of incident atom energy by the matrix material is faster. Local pressure and local
temperature are soon leveled and the process is similar to the central impact of a low-energy primary
atom.
z
~ 20 ~
Figure 18 Typical time evolution of the number of emitted Ar atoms for varying eccentricities at primary atom energy 200 eV
Figure 19 Typical time evolution of the number of emitted Ar atoms for varying eccentricities at primary atom energy 1600 eV
At energies lower than 1000 eV we can observe the bulging and neck creation at the point of the
smallest thickness of the original material, without any significant asymmetry due to asymmetric
damage of the specimen.
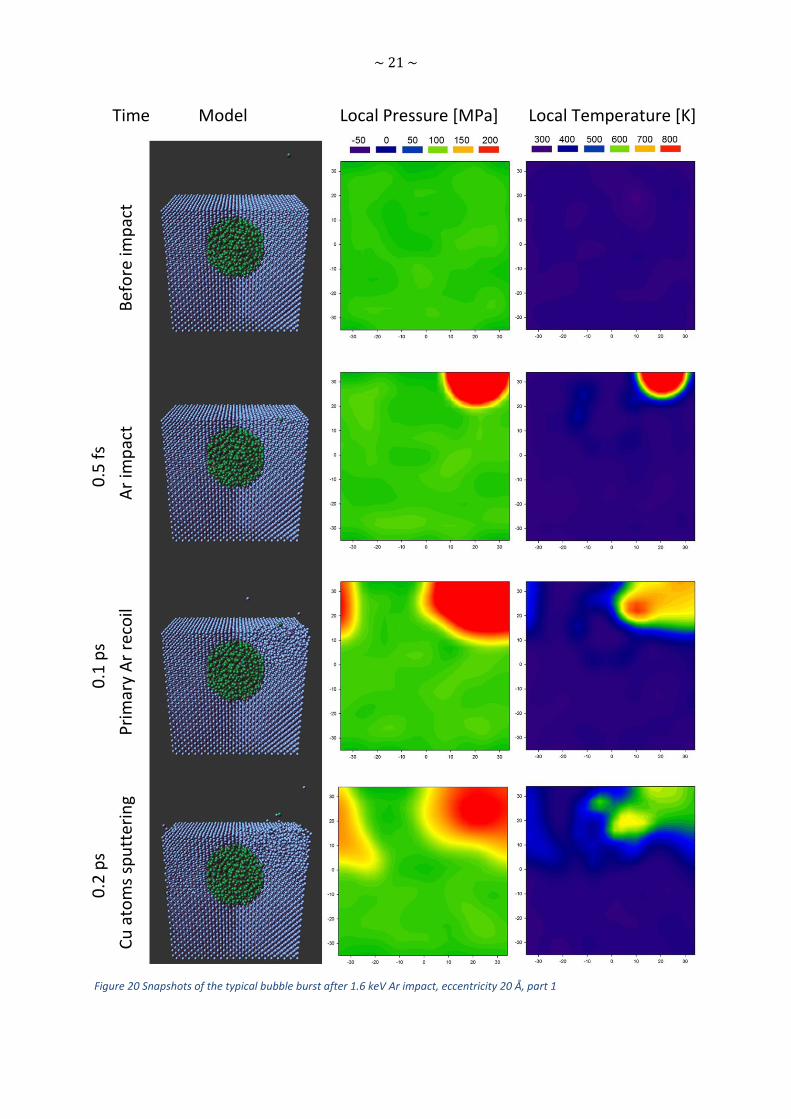
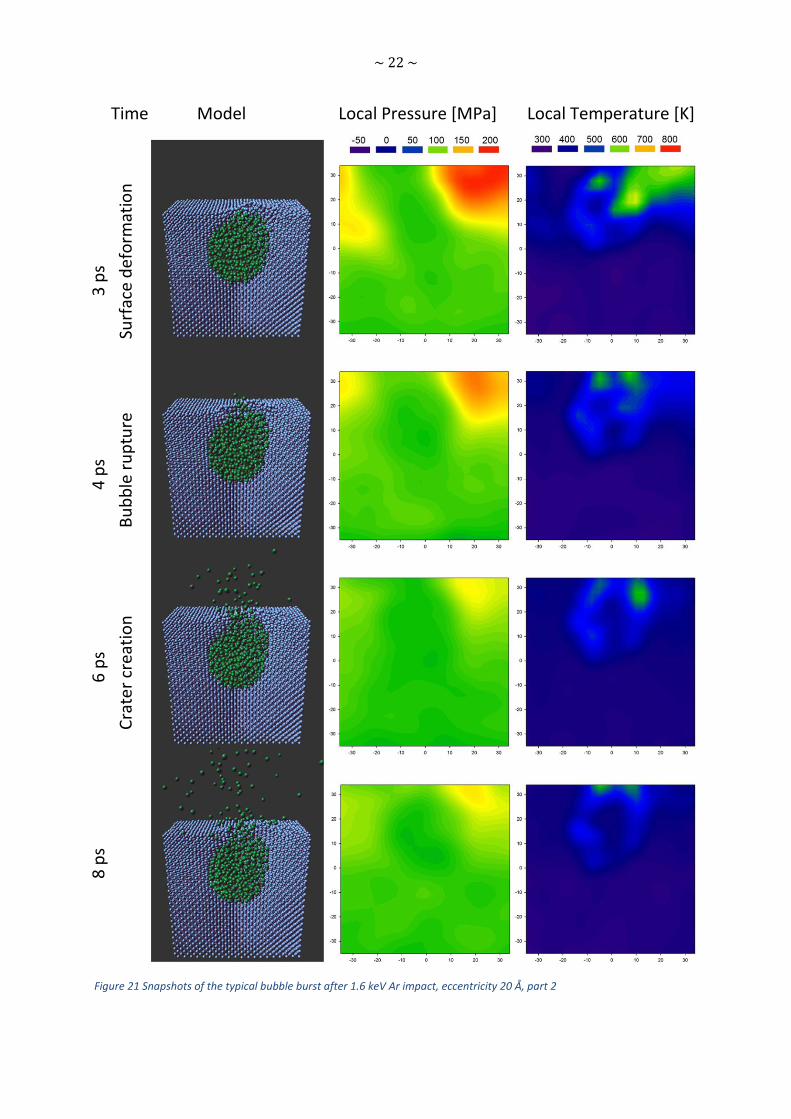
The snapshots and the pressure and temperature profiles for impact of 1600 eV primary particle with
the eccentricity of 20 Å (4/3 of the bubbles radius) are shown for comparison in Figure 20 to Figure 22.
Compared to the impact at lower eccentricity the bubble ruptures significantly later at higher
eccentricity with clearly visible asymmetry of the process. Bulging is much stronger on the side affected
by the impact and the crater center is shifted in the same direction by a few angstroms.
0,00
0,02
0,04
0,06
0,08
0,10
0,12
0,14
0,16
0,18
0,20
0 2 4 6 8 10 12 14 16 18 20
ato
ms
inje
t
time [ps]
e 0 Å
e 2 Å
e 4 Å
e 6 Å
e 8 Å
0,00
0,05
0,10
0,15
0,20
0,25
0,30
0,35
0,40
0,45
0,50
0 2 4 6 8 10 12 14 16 18 20
ato
ms
inje
t
time [ps]
e 0 Å
e 12 Å
e 14 Å
e 16 Å
e 20 Å
e 22 Å
e 24 Å
~ 21 ~
Figure 20 Snapshots of the typical bubble burst after 1.6 keV Ar impact, eccentricity 20 Å, part 1
Time Model Local Pressure [MPa] Local Temperature
[K]
Time Model Local Pressure [MPa] Local Temperature [K]
[K]
0.2
ps
0.1
ps
0
.5 f
s
Cu
ato
ms
spu
tter
ing
Pri
mar
y A
r re
coil
A
r im
pac
t
Bef
ore
imp
act
~ 22 ~
Figure 21 Snapshots of the typical bubble burst after 1.6 keV Ar impact, eccentricity 20 Å, part 2
Time Model Local Pressure [MPa] Local Temperature [K]
[K]
8 p
s
6
ps
4
ps
3
ps
C
rate
r cr
eati
on
Bu
bb
le r
up
ture
Su
rfac
e d
efo
rmat
ion
~ 23 ~
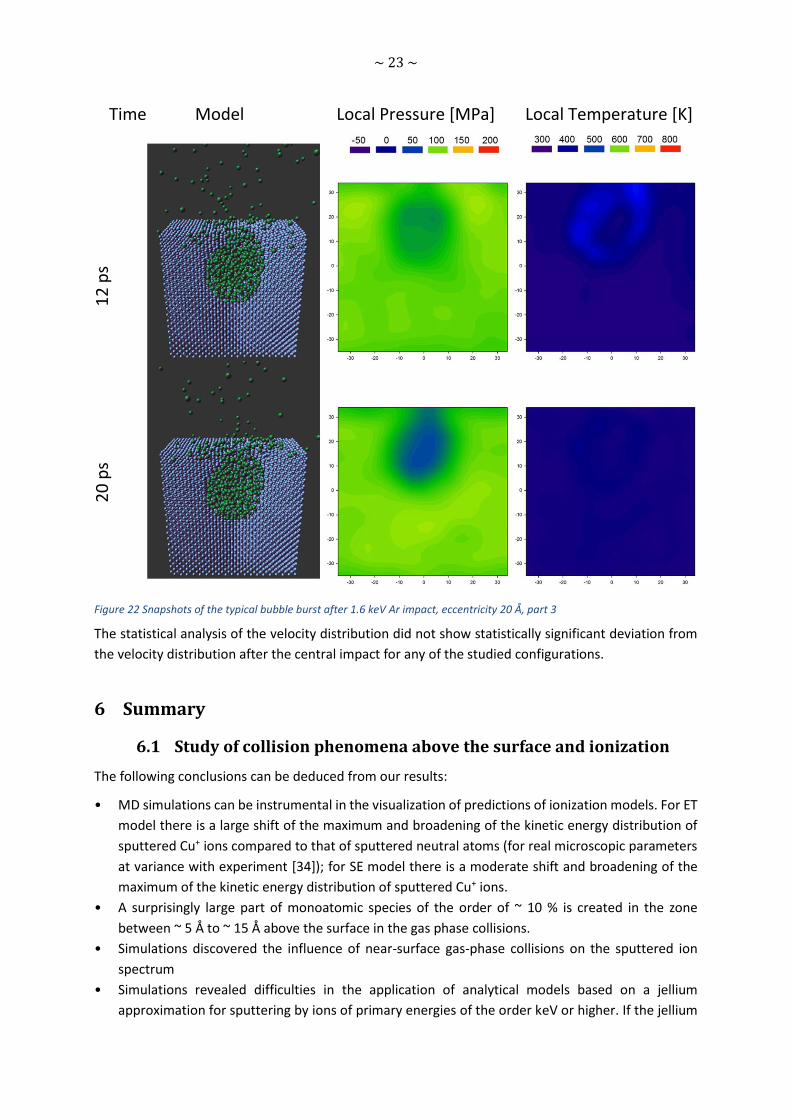
Figure 22 Snapshots of the typical bubble burst after 1.6 keV Ar impact, eccentricity 20 Å, part 3
The statistical analysis of the velocity distribution did not show statistically significant deviation from
the velocity distribution after the central impact for any of the studied configurations.
6 Summary
6.1 Study of collision phenomena above the surface and ionization
The following conclusions can be deduced from our results:
• MD simulations can be instrumental in the visualization of predictions of ionization models. For ET
model there is a large shift of the maximum and broadening of the kinetic energy distribution of
sputtered Cu+ ions compared to that of sputtered neutral atoms (for real microscopic parameters
at variance with experiment [34]); for SE model there is a moderate shift and broadening of the
maximum of the kinetic energy distribution of sputtered Cu+ ions.
• A surprisingly large part of monoatomic species of the order of ~ 10 % is created in the zone
between ~ 5 Å to ~ 15 Å above the surface in the gas phase collisions.
• Simulations discovered the influence of near-surface gas-phase collisions on the sputtered ion
spectrum
• Simulations revealed difficulties in the application of analytical models based on a jellium
approximation for sputtering by ions of primary energies of the order keV or higher. If the jellium
Time Model Local Pressure [MPa] Local Temperature [K]
[K]
20
ps
12
ps
~ 24 ~
edge is defined in a standard way according to Figure 3, the distribution of distances 𝑧∗ for
individual atoms and the distances where the sputtered atoms collide in the gas-phase overlap.
This means that the sputtered atom velocities suffer considerable changes caused by gas-phase
collisions beyond the freezing distance 𝑧∗. Consequently, both the assumption of constant escape
velocity and an ideal surface plane are not sustainable. Similar conclusion was reached by Wucher
et al. [54].
• Our simulations have shown the importance of near-surface gas-phase collisions during sputtering
process. This observation can be perceived as an independent rediscovery of the forgotten
conclusion of B. J. Garrison group [38 - 41].
6.2 Simulation of the rupture of a subsurface nanobubble
Analysis of our MD simulation results allows for making the following conclusions:
• The pressurized subsurface Ar bubble can burst by impact of energetic atoms. Ar atoms from the
bubble are not emitted by the sputtering process, but rather by the expansion of Ar gas from the
ruptured bubble.
• The bubble bursts, when the local pressure at the weakest point of the bubble exceeds the tensile
strength of the host material Cu (100).
• Sputtering of a few Cu atoms occurs immediately after the high energetic atom impact. The surface
is disturbed near the impact, the primary mechanism for bubble bursting, however, remains the
increas of the local pressure.
• The expanding gas forms a forward directed jet that is much narrower than the cosine distribution
(Figure 17).
• Establishment of the jet occurs with a significant time lag from the primary atom impact.
• Dimers are formed by the fragmentation of the hot and dense condensed Ar bubble.
• Both the angular and the velocity distribution of dimers are narrower than those of monomers.
• In the case of the eccentric primary atom impact principally the same phenomena occur without
significant asymmetry of the jet due to the asymmetric disturbance of the original material.
• An eccentric impact has similar effects as the central impact of the primary atom with lower
energy.
• Non-monotonous behavior of local pressure and temperature may indicate the volume oscillation
of Ar gas in the bubble after the impact.
The results show that the process of cracking sub-surface nanobubbles and forming a jet of particles
after the primary particle impact is a complex physical phenomenon that deserves detailed study on
its own, not only in terms of technical applications.
6.3 Conclusion
Our work has brought original contributions in two areas of physics of interaction of ions with solid
surfaces and showed the importance of connecting MD simulations with experiments in search for
explanation of physical phenomena at the microscopic level.
~ 25 ~
7 References
1. Harrison Jr., J. E. Sputtering models – A synoptic view. Radiation Effects. 1983, Vol. 70, 1-4, pp. 1-
64.
2. Harrison, D. E., Kelly, P. W., Garrison, B. J. and Winograd, N. Low Energy Ion Impact Phenomena on
Single Crystal Surfaces. Surface Science. 1978, Vol. 76, pp. 311-322.
3. Wucher, A. and Garrison, B. J. Cluster formation in sputtering: A molecular dynamics study using
the MD/MC-corrected effective medium potential. Journal of Chemical Physics. 1996, Vol. 105, 14, pp.
5999-6007.
4. Rabbani, S., Barber, A. M., Fletcher, J. S., Lockyer, N. P. and Vickerman, J. C. TOF-SIMS with Argon
Gas Cluster Ion Beams: A Comparison with C60+. Analytical Chemistry. 10, 2011, Vol. 83, pp. 3793-
3800.
5. Touboul, D., Kollmer, F., Niehuis, E., Brunelle, A. and Laprévote, O. Improvement of Biological Time-
of-Flight-Secondary Ion Mass Spectrometry Imaging with a Bismuth Cluster Ion Source. Journal of the
American Society for Mass Spectrometry. 2005, Vol. 16, 10, pp. 1608-1618.
6. Colla, Th. J., Urbassek, H. M., Wucher, A., Staudt, C., Heinrich, R., Garrison, B. J., Dandachi, C. and
Betz, G. Experiment and simulation of cluster emission from 5 keV Ar ® Cu. Nuclear Instruments and
Methods in Physics Research B. 1998, Vol. 143, pp. 284-297.
7. McGuire, G. E. Effects of ion sputtering on semiconductor surfaces. Surface Science. 1978, Vol. 76,
1, pp. 130-147.
8. Weijsenfeld, C. H., Hoogendoorn, A. and Koedam, M. Sputtering of polycrystalline metals by inert
gas ions of low energy (100–1000 eV). Physica. Vol. 27, 8, pp. 763-764.
9. Karetta, F. and Urbassek, H. M. The Dimer Sputtering Mechanism of Cu(001) at Low Bombarding
Energy. Applied Physics A. 1992, Vol. 55, pp. 364-371.
10. Pérez-Martín, A. M. C., Domínguez-Vázquez, J. D. and Jiménez-Rodríguez, J. J. A MD study of low
energy boron bombardment on silicon. Nuclear Instruments and Methods in Physics Research B. 2000,
Vols. 164-165, pp. 431-440.
11. Delcorte, A., Restrepo, O. A., Hamraoui, K. and Czerwinski, B. Cluster impacts in organics:
microscopic models and universal sputtering curves. Surface and Interface Analysis. S1, 2014, Vol. 46,
pp. 46-50.
12. Delcorte, A., Bertrand, P. and Garrison, B. J. A microscopic view of organic sample sputtering.
Applied Surface Science. 2003, Vol. 203, pp. 166-169.
13. Urbassek, H. M. Sputter Theory. Matematisk-fysiske Meddelelser. 2006, Vol. 52, pp. 433-463.
14. Šroubek, Z. Formation of ions in sputtering. Spectrochemica Acta. 1989, Vol. 44B, 3, pp. 317-328.
15. Duvenbeck, A., Weingart, O., Buss, V. and Wucher, A. On the role of electronic friction and
electron promotion in kinetic excitation of solids. New Journal of Physics. 2007, Vol. 9, 38, pp. 281-285.
16. Weidtmann, B., Duvenbeck, A. and Wucher, A. Predicting secondary ion formation in molecular
dynamics simulations of sputtering. Applied Surface Science. 2008, Vol. 255, pp. 813-815.
~ 26 ~
17. Garrison, B. J., Diebold, A. C., Lin, J.-H. and Šroubek, Z. Theory of Charge Transfer for Desorption
of Ions from Surfaces. Surface Science. 1983, Vol. 124, pp. 461-488.
18. Fleischer, E. L. and Norton, M. G. Noble Gas Inclusions im Materials. Heterogeneous Chemistry
Reviews. 1996, Vol. 3, 3, pp. 171-201.
19. Franzreb, K. and Williams, P. Inert gas clusters ejected from bursting bubbles during sputtering.
2003, Vol. 91, 1, p. 015501.
20. Lindhard, J. and Scharff, M. Energy Dissipation by Ions in the kev Region. Physical Review. 1961,
Vol. 124, 1, p. 128.
21. Lindhard, J., Scharff, M. and Schiott, H. E. Range Concepts and Heavy Ion Ranges (Notes on Atomic
Coliisions). Matematisk-Fysiske Meddelelser Det Kongelige Danske Videnskabernes Selskab. 1963, Vol.
33, 14.
22. Sigmund, P. Stopping of Heavy Ions - A Theoretical Approach. Berlin Heidelberg New York : Springer,
2004.
23. Khronos Group. OpenGL. The Industry's Foundation for High Performance Graphics.
[http://www.opengl.org]
24. Cheney, K. B., Rogers, E. E. and Pitkin, E. T. Research on Experimental Evaluation of Sputtering
Yield Rates. Van Nuys, California : Aerospace Research Laboratories, 1963.
25. Weissler, G. L. and Carlson, R. W. Methods of Experimental Physics vol. 14 Vacuum Physics and
Technology. New York : Academic Press, 1979.
26. Zhang, Z. L. Comment on “Sputtering transport theory: The mean energy”. Physical Review B. 2005,
Vol. 71, 2, p. 26101.
27. Yu, M. L. and Lang, N. D. Direct Evidence of Electron Tunneling in the Ionization of Sputtered
Atoms. Physical Review Letters. 1983, Vol. 50, pp. 127-130.
28. Williams, P. The sputtering process and sputtered ion emission. Surface Science. 1979, Vol. 90, 2,
pp. 588-634.
29. Blaise, G. and Nourtier, A. Experimental and theoretical approaches to the ionization process in
secondary-ion emission. Surface Science. 1979, Vol. 90, 2, pp. 495-547.
30. Norskov, J. K. and Lundqvist, B. I. Secondary-ion emission probability in sputtering. Physical Review
B. 1979, Vol. 19, p. 5661.
31. Brako, R. and Newns, D. M. Charge exchange in atom-surface scattering: Thermal versus quantum
mechanical non-adiabaticity. Surface Science. 1981, Vol. 108, 2, pp. 253-270.
32. Kuba, P., Lorinčík, J., Anders, C. and Urbassek, H. M. A molecular dynamics simulation of the effect
of near-surface gas-phase collisions on final velocities of sputtered ions. Surface and Interface Analysis.
2013, Vol. 45, 1, pp. 75-78.
33. Huber, K. P. and Herzberg, G. Molecular Spectra and Molecular Structure, vol. IV. New York : Van
Nostrand, 1979.
~ 27 ~
34. Wucher, A. and Oechsner, H. Emission energy dependence of ionization probabilities in secondary
ion emission from oxygen covered Ta, Nb and Cu surfaces. Surface Science. 1988, Vol. 199, 3, pp. 567-
578.
35. Behrisch, R. and Eckstein, W. Sputtering by Particle Bombardment - Experiments and Computer
Calculations from Tresholds to MeV Energies. Berlin, Heidelberg : Springer Verlag, 2007.
36. Hotop, H. and Lineberger, W. C. Binding Energies in Atomic Negative Ions. Journal of Physical and
Chemical Reference Data. 1975, Vol. 4, 3, pp. 539-576.
37. Kudriavtsev, Y., Villegas, A., Godines, A. and Asomoza, R. Calculation of the surface binding energy
for ion sputtered particles. Applied Surface Science. 2005, Vol. 239, pp. 273-278.
38. Winograd, N., El-Maazawi, M., Maboudian, R., Postawa, Z., Bernardo, D. N. and Garrison, B. J.
Energy- and Angle-Resolved Measurements of the Rh(4F9/2) and Rh(4F7/2) Populations from Ion
Bombarded Rh{100}. The Journal of Chemical Physics. 1992, Vol. 96, pp. 6314-6317.
39. Bernardo, D. N. and Garrison, B. J. Production of Excited Rh Atoms via keV Particle Bombardment
of Rh{100}: Simulation of Excitations due to Collisions Above the Surface. The Journal of Chemical
Physics. 1992, Vol. 97, pp. 6910-6916.
40. Bernardo, D. N., El-Maazawi, M., Maboudian, R., Postawa, Z., Winograd, N. and Garrison, B. J.
Angle-Resolved Velocity Distributions of Excited Rh Atoms Ejected from Ion-Bombarded Rh{100}. The
Journal of Chemical Physics. 1992, Vol. 97, pp. 3846-3854.
41. Bernardo, D. N., Bhatia, R. and Garrison, B.J. keV Particle Bombardment of Solids: Molecular
Dynamics Simulations and Beyond. Computer Physics Communications. 1994, Vol. 80, pp. 259-273.
42. Shapiro, M. H. and Tombrello, T. A. Nuclear Instruments and Methods in Physics Research B. 1994,
Vol. 84, pp. 453-464.
43. Mazarov, P., Samartsev, A. V. and Wucher, A. Determination of energy dependent ionization
probabilities of sputtered particles. Applied Surface Science. 2006, Vol. 252, 19, pp. 6452-6455.
44. vom Felde, A., Fink, J., Müller-Heinzerling, Th., Pflüger, J., Scheerer, B., Linker, G. and Kaletta, D.
Pressure of Neon, Argon and Xenon Bubbles in Aluminium. Physical Review Letters. 1984, Vol. 53, p.
922.
45. Gades, H. and Urbassek, H. M. Surface binding energies of alloys: a many-body approach. Nuclear
Instruments and Methods in Physics Research B. 1994, Vol. 88, 3, pp. 218-228.
46. Lv, J., Bai, M., Cui, W. and Li, X. The molecular dynamic simulation on impact and friction characters
of nanofluids with many nanoparticles system. Nanoscale Research Letters. 2011, Vol. 6, 1, p. 200.
47. Lísal, M., Budinský, R. and Vavek, V. Vapour-liquid equilibria for dipolar two-centre Lennard-Jones
fluids by Gibbs-Duhem integration. Fluid Phase Equilibria. 1997, Vol. 135, pp. 193-207.
48. Gallivan, M. A., Noble, D. R., Georgiadis, J. G. and Buckius, R. O. An Evaluation of the Bounce-Back
Boundary Condition for Lattice Boltzmann Simulation. International Journal for Numerical Methods in
Fluids. 1997, Vol. 25, 249-263.
49. Kuba, P., Lorinčík, J., Lísal, M. and Urbassek, H. M. Molecular dynamics simulations of Ar gas
ejection from a ruptured subsurface bubble in Cu(100) induced by impact of 200 eV Ar atoms.
Molecular Physics. 2014, Vol. 112, 15, pp. 2040-2045. DOI: 10.1080/00268976.2014.882522.

~ 28 ~
50. Upadhyay, A. K. and Urbassek, H. M. Effect of laser pulse width on material phenomena in
ultrathin metal films irradiated by an ultrafast laser: molecular-dynamics study. Journal of Physics D:
Applied Physics. 2007, Vol. 40, p. 3518.
51. Weller, R. A. and Weller, M. R. Energy sharing and sputtering in low-energy collision cascades.
Radiation Effects. 1982, Vol. 60, 1-4, pp. 209-222.
52. Waldeer, K. T. and Urbassek, H. M. Thermalization of high energy particles in a cold gas. Physica
A. 1991, Vol. 176, 2, pp. 325-344.
53. Van Zwol, J., De Zwart, S. T., Busquet, C. C. A. and Dieleman, J. Resputtering of low-energy
implanted inert gases: An angle-resolved time-of-flight study. Applied Surface Science. 1989, Vol. 43,
1-4, pp. 363-368.
54. Breuer, L., Kucher, A., Herder, M., Wucher, A. and Winograd, N. Formation of Neutral InmCn
Clusters under C60 Ion Bombardment of Indium. The Journal of Physical Chemistry A. 2014, Vol. 118,
37, pp. 8542-8552.