Embed Size (px)
Citation preview

8/3/2019 J. B. Bdzil and W. C. Davis- Time-Dependent Detonations
http://slidepdf.com/reader/full/j-b-bdzil-and-w-c-davis-time-dependent-detonations 1/39
LA-5926-MSInformal Report
4?2
.— —.—
UC-45
Reporting Date: March 1975
Issued: June 1975
Time-Dependent Detonations
J. B. Bdzil
W. C. Davis
[— -. -—--—--- , .-_— -.
r
1CIC-14 REPORT COLLECTION
REPRODUCTIONi
i
i
1
COPY
sc ient i f ic laborat oryo f t he Un ive rs i t y o f Ca l i fo rn ia
LOS ALAMOS, NEW MEXICO 87544
\An Affirmativectian/EqualOpportunityEmployer
UNITED STATESENERGY RESEARCH AND DEVELOPMENT ADMINISTRATION
CONTRACT W-7405 -ENG. 36

8/3/2019 J. B. Bdzil and W. C. Davis- Time-Dependent Detonations
http://slidepdf.com/reader/full/j-b-bdzil-and-w-c-davis-time-dependent-detonations 2/39
A b
In the interestofprompt distribution,hisreportwas not editedby
the Technical Information staff.
PrfntedntheUnitedkatesfAmerica.vaflableromNationalechnkdIaforrnationervice
U S DepmtmentofCommerce52S5portRoyolRoadSpringfield,A 22151
;Ce: pr in t ed bpy ~.~ Microfiche2.25
T hi s r ep ar l w a . p re pa re d .s qn qc au nt o f w o rk s po nm re d
by t h= U ni ti St at - C-a ve mm en t. N ei the r t he un lt rd SW”n or t he U “ it c d St a ir s En er gy Sr .e sr ch qn d Dev e lo pme n t A d -
m in is tr at io n, n or a ny o f t he ir e mp lo ye q n or a ny o f t h ei r c on .t ra ct or s, m hc .a tt ra ct or s, o r t he ir qm ployees, m .k ” .nyw arrant , qx p re s s . x i m p li e d, o r q $umu qn y l eg al l ia bi li t y o r
te s pcm s i i l ll y f o r t h e s c c u r ac y , c . am 9 1e l t nc g o ,o r u w f ul n es s o f. ny i “ fo m n. ti .n . . II P. mt .S. product.rpews.i s c l o sed , o rrqw esent i t h.t i - m e w ou ld not inf r inge pr iva t ely ow nedr lzh ts .

8/3/2019 J. B. Bdzil and W. C. Davis- Time-Dependent Detonations
http://slidepdf.com/reader/full/j-b-bdzil-and-w-c-davis-time-dependent-detonations 3/39
TIME-DEPENDENT DETONATIONS
by
J. B. Bdzil and W. C. Davis
ABSTRACT
We describe a one-dimensional time-dependentmodel for..—
_F
high-order detonations. In the model most of the available
energy is released instantaneously,while a small fraction
62 = 0.05 is released on a slow time scale l/k2 = 0.5 p.s.~g ~-
An analytic solution of the model in the polytropic gas and.=CO ~ Euler approximations is found as a perturbation series in d.%S1- ,,..
This solution shows that the apparent Chapman-Jouguet pres-
‘k
;Ez - sure increaaes by 0(6) on a time scale 6k2t, while the actual
-m—~— Ch~rnan-Jouguetpressure and detona~~on velocity increase by”~o 5O(LS). Calibrated to the Composition B/dural free-surface
:=: “=–velocity experiments, the model reproduces all of the known
?l-03 L. ‘Wan=mve =Pertients on COmPOsitlon B.<=m I
The model is also
g— ~ calibrated to the PBX-9404/dural data. Although it repro--1=~m=L
duces the free-surfacevelocity data, it does not agree with
all the data on this explosive. The solution of this model
repres~ts the first analyiic solution of the time-dependent. ——. —
detoriationproblem.
I. INTRODUCTION
The Chapman-Jouguet theory of unsupported deto-
nations has met with reasomble success in describing
explosions. This has in large measure been due to
an inability to perform either experiments or calcu-
lations with sufficient accuracy to test the assump-
tions of the theory. This theory makes the following
assumptions: (1) The flow is plane and one-dimen-
sional; (2) the reaction occurs instantaneously
producing discontinuous jumps in the flow variables;
(3) the flow at this shocked state (the Chapman-
Jouguet state) is exactly sonic relative to the ve-
locity of the discontinuity;and (4) the following
flow ia isentropic. During the past 15 years, how-
ever, more sensitive experiments have shown that one
or more of these assumptions are violated. Working
with the gaseous explosive hydrogen/oxygen,Whitel
showed that the flow behind the shock was three-
dinvensional. The time scale for the decay of these
motions was shown to be large with the flow at the
end of the decay being supersonic. Thus, for this
explosive, at least two of the assumptions of the
Chapman-Jouguet theory are violated. For solid and
liquid explosives the situation is much the same.
Davis, Craig, and Ramsay2 have shown that the C,hap-
man-Jouguet theory fails to work for nitromethane
and TNT. Following a procedure described by Wood
and Fickett3 they found that the sonic-plane pres-
sures for these explosives were 10 to 15% below the
Chapman-Jouguetpressure measured by the free-sur-
face technique proposed by Coranson.4 Using free-
5surface velocity measurements, Craig found that
the Chapman-Jouguet pressure increases with the
length of explosive for planewave assemblies of the
solid explosive PBX-9404. In addition, his data
failed to scale,which is contrary to the Chapman-
Jouguet theory. We find similar departures from
the simple theory for Composition B. Another indi-
cation that the simple theory has failed is that
there seems to be little agreement on what the value
of the Chapman-Jouguet pressure is for an explosive.
1

8/3/2019 J. B. Bdzil and W. C. Davis- Time-Dependent Detonations
http://slidepdf.com/reader/full/j-b-bdzil-and-w-c-davis-time-dependent-detonations 4/39
The quoted values for Composition B-3 range from
26.8 to 31.2 GPa.6
More recently it has become possible to do very
accurate calculationson one-dimensionalexplosive
systems using finite-differencemethods and high-
speed computers. These calculationsshow that if
the simple theory is used to describe the explosive,
then the free-surfacevelocity induced into inert
materials by large explosive charges cannot be re-
produced even with the most sophisticated equations
7of state for the inert. The calculated slope of
the free-surfacevelocity induced in aluminum by a
charge of Composition B 203-mm long and 254 mm in
diameter is about half as steep as Deal’sa measured
value. Thus, both experiment and calculation show
that the behavior of solid and liquid explosives is
also considerablymore complex than that allowed by
the Chapman-Jouguettheory.
What we will do in this report is turn the con-
tradictionsof the experiments and theory to our ad-
vantage. In particular,we assume that the experi-
mental results and calculations are meaningful and
that the differences between them and the Chapman-
Jouguet theory must be reconciled by any new theory.
We will limit the scope of our investigation to only
two planewave explosive systems. Composition B will
be examined first because of the great wealth of data
available on it, followed by PBX-9404. The conflict
between data and theory for these explosivessuggests
that any new model must have the following features.
(1) The near constancy of the detonation velocity as
measuredwith rate sticks requires that the greater
part of the energy in a detonation is released in-
stantaneously in the shock rise just as in the Chap-
man-Jouguet theory. (2) Both the increase in the
initial free-surfacevelocity with length of explo-
sive and the steepness of the free-surfacevelocity
curve for large charges Implies the existence of a
weakly-energetic, slow kinetic process following the
initial energy release. (3) This in turn implies
that the detonation is time-dependent. (4) The in-
itial state variation experiments on other explosives
suggest that the pressure at the sonic plane ia con-
siderably lower than those measured by free-surface
velocity techniques. All of these features can be
included in a model by adding two parameters to the
existing theory--one, to give the amount of energy
released in the slow kinetic process, and the second,
3.5
3.3
%~3.1
E‘In
3“
2.9
2.7
I I\ \ , I
o 10 20 30 40 .
Plate Thickness (mm )
Fig. 1.1. A comparison of the free-surfacevelocityinduced in dural plates by a 50.8-mm
(lower) and 203.2-mm (upper) planewave
Composition B system. The solid curve isthe new theory and the dashed curve is the
Chapman-Jouguet theory (y-law calibrated
to produce the correct intercept).
data shown are those of W. E. Deal,8T~;o
used an armored flash gap technique, and
W. C. Davis,6 who used a reflection-change
flash gap technique. Davis’ data are re-
duced by 6% to correct for the effects of
surface fluff. The length to diameter
ratios of the explosives (X/d)
Deal X/d=l .,1 X/d=+ *
Davis X/d+-, +, 1 h
the rate of the process. By calibrating
the remaining constants to the available
are
these and
expertien-
tal data, one can then reproduce all of the plane-
wave experiments on Composition B with one set of
parameters. h example of what can be achiwed with
the new theory as compared to the old is shown in
Fig. 1.1. The agreement between calculation and ex-
periment is good. This improvement over existing
theories is achieved because we have abandoned the
notion that discrepancies between calculation and
experiment can be removed by using an “improved”
equation of state. The experimental data clearly
2

8/3/2019 J. B. Bdzil and W. C. Davis- Time-Dependent Detonations
http://slidepdf.com/reader/full/j-b-bdzil-and-w-c-davis-time-dependent-detonations 5/39
show that the system Composition B/dural does not
scale. Therefore, any calculation which scales is
doomed from the start. To our knowledge, the only
other work which takes into account some aspects of
the failure to scale are calculations performed by
Mader.9,10
The body of this report is divided into six sec-tions. In Section II we discuss the experiments
which are commonly used to characterize high explo-
sives. We then present the experimental data on
planewave Composition B and discuss the inability of
simple theories to describe the data. In Section
III we present our time-dependenttwo-reactionmodel
and obtain a solution to the governing equations.
We discuss the solution of the finite-difference
equations for our model and the accuracy of such a
solution in Section IV. In Section V we calibrate
the model to Composition B and compare the results ofcalculation and experiment. In Section VI we cali-
brate the model to PBX-9404 and compare calculation
and experiment. We summarize our results in the last
section and discuss some of the implications of the
model, and speculate on directions for future work.
II. EmERIMENT AND THE CHAPMAN-JOUGUET TREORY
A. Survey of ExperimentalMethods
Quite early in the study of detonations re-
searchers learned that the detonation velocity could
be measured reproducibly. Their experiments showed
that to within 1 or 2% the detonation velocity in
gases was constant and in good agreement with the
predictions of the Chapman-Jouguet theory. Because
of this the theory gained wide acceptance. Unfor-
tunately, the detonation velocity is probably one of
the least sensitive parameters characterizing an ex-
plosive. For this reason, very little waa learned
about explosives until both the experimental tech-
niques and theory were improved during the 1940s.
The Chapman-Jouguettheory was modified independently
by Zeldovich,von Neumann, and Dnering (zND) to in-
clude a steady-state chemical reaction zone in which
the pressure decreases between the shock disconti-
nuity and the Chapman-Jouguetstate. They reasoned
that the reaction zone was short and, therefore, the
assumption of steadinesswas justified. On the ex-
perimental side the emphasis had shifted to solid
explosives. Goranson4 suggested that for solid ex-
plosives the reaction zone could be probed and its
existence established by measuring the initial free-
aurface velocity imparted to metal plates as a func-
tion of plate thickness. This technique is based on
the fact that the shock and following pressure pro-
file in the explosive are transmitted into the inert.
In the inert the flow following the shock is sub-
sonic and therefore degrades the shock aa it runs.
Since plate thickness is directly related to run in
the inert, we can sample different parts of the det-
onation profile by varying the plate thickness. If
an equation of state for the inert is available the
data can be deconvoluted (at least approximately)
to get the wave profile in the explosive and the
Chapman-Jouguet pressure.
The first published work in which this tech-
nique was used to study an explosive was that of
11 (1955) on Composition B.uff and Houston They
interpreted their results as showing the existence
of the reaction zone spike predicted by the 2ND
theory. A few years later Deal8’12 (1957, 1958)
published the results of an exhaustive series of
free-surface velocity experiments on 203.2-mm long
planewave systems of Composition B, RDX, TNT, and
Cyclotol Initiated by planewave lenses of 203-mm
aperture. His work on Composition B, which included
a number of different materials as witness plates,
constitutes the largest single source of data on
this explosive. In addition to this work, Deal also
studied some shorter planewave systems.13 All of
these measurements were made using a rotatin&mirror
smear camera to time the free run of the witness
plate over a predetermined distance. This distance
(2.5 mm) was chosen so as to exclude the possibility
of any reverberationsof the witness plate. The
arrival times were measured using armored (steel)
flash gaps (0.089 mm) at both ends of the free run
distance. Some 10 years later, Davis14
also per-
formed free-surface velocity measurements on Compo-
sition B. The free run time in these experiments
was determined by first optically measuring the
time that the reflectivity of the witness plate
changed and then the time at which a luminous
shock was generated when the flying plate collided
with a Plexiglas flasher at the end of the run.
This technique has the advantage of allowing one to
resolve any differences in plate motion that may
occur over the surface of the plate, thereby pro-
viding some measure of the one-dimensionalityof
3

8/3/2019 J. B. Bdzil and W. C. Davis- Time-Dependent Detonations
http://slidepdf.com/reader/full/j-b-bdzil-and-w-c-davis-time-dependent-detonations 6/39
the system being studied. Using an electrical pin
technique,Warnes15
alao measured the free-surface
velocity in an independent set of sxperimenta. The
experiments described here are just a few of the
free-surfacevelocity measurements that have been
made on Composition B. However, we wI1l restrict
our attention to the aforementioned experiments be-
cause we lack specific details of the experimental
conditions under which the remaining work was per-
formed.
Other techniques have also been used to cali-
brate liquid and solid explosives. The shock-veloc-
ity technique developed by Hayes16 (1967) has en-
joyed widespread use. This technique is based on
the experimentalobservation that a shock crossing
a material interface produces a characteristic elec-
trical signal which is detectable with suitably ar-
ranged antenna and amplifier aystema. Such a sig-
nal is produced when two pieces of the same material
are separated by a vanishingly thin insulating layer.
Therefore, if a stack of such sandwiches is placed
on top of a planewave explosive charge, the transit
times of the induced shock over the known distances
between the insulating layers can be measured. If
the equation of state of the inert is known, these
transit times can be used to infer the Chapman-Jou-
guet pressure in the explosive. l%is method has the
advantage of yielding more than one measurement per
experiment. Receutly, Finger and Kurrle17
used this
method to measure the Chapman-Jouguetpressure ofComposition B, PBX-9&04, plus a number of other com-
mon solid explosives.
Both of the methods described above are indirect
methods in that one must infer the behavior of the
explosive by measuring features of the pressure wave
induced into inerts by the explosive. Direct methods
for studying explosives are also available. Of these
flash radiography is probably used the most frequent-
ly,18
A high-flux x-ray machine, such as PH.EKMEX,
provides one with a snapshot of the density distri-
bution in the explosive products at any time. TWOexperiments which have been performed using flash
radiography are of particular interest. In the firat
experiment a number of very thin (12.5 pm) high-con-
trast metal (Ta) foils are embedded in between pieces
of explosive creating a multi-layered sandwich.
These foils are all parallel to the detonation front
and their initial positions are known prectsely.
Assuming that the foils have a negligible effect on
the flow, acting merely as fluid particle labels,
then a radiograph of the assembly taken after the
detonation has run some distance yields the density
distribution at that time. If then a series of such
experiments is performed, with radiographs taken
after different lengths of run, the flow field in
the explosive gases can be determined without any
assumptions about the equation of state. Using
this technique, Rivard et al.19
determined the fol-
lowing flow in a 101.6-mm planewave system of Compo-
sition B. ‘he second experiment uses flash radiog-
raphy to follow the rarefaction head reflected into
the explosive gases when a plane detonation wave in-
teracts with a low impedance inert. The advantage
of this experiment is that is does not require the
use of foils,and,therefore,the foil perturbations
are eliminated. From a series of such experiments,
the position of the rarefaction head in the explo-
sive products can be determined as a function of
time and in turn these data can be deconvoluted to
give the flow Ln the explosive. Davis and,Venable6
have published the results of such a series of ex-
periments on Compoai.tionB.
Another technique which gives a direct measure
of the flow behind the detonation front i.arhe mag-
20netic probe technique introduced by Hayes. By
embedding a highly conductive metal foil in the ex-
plosive, the velocity of the foil, which serves as
a particle marker, can be measured directly. Un-
fortunately the data on Composition B obtained with
this method are too limited to be useful.
Before discussing the experimentaldata we pre-
sent a brief summary of the methods and give some
indications of their sensitivity. The methods are
of two basic types: (1) the indirect type in which
the experimenter infers properties of the explosive
by observing the inert in an explosive inert system;
(2) the direct type in which the experimenter probea
the explosive directly. In each of these categories
the sensitivity of the experiments varies. Those
providing the particle velocity u directly give a
more sensitive description of the flow following the
detonation front than those which give only an inte-
gral of u (see Fig. 2.1). The ahock velocity ex-
periments determine the upper limit of the integral
4

8/3/2019 J. B. Bdzil and W. C. Davis- Time-Dependent Detonations
http://slidepdf.com/reader/full/j-b-bdzil-and-w-c-davis-time-dependent-detonations 7/39
Indirect
A. Free-surfacevelocity vs plate thickness
Determine u
B. Shock velocity using stacked plates and
electrical pick up
Determine U1
Direct
A. X-ray technique
Determine ~=~+sudtof embedded foile
B. X-ray technique
Determine rarefaction wave velocity
c. Magnetic probe
.Fig, 2.1. Experimentalmethods used in studying
solid explosives.
‘2AXS =f U1(u)dt ,
‘1
where AXS is the distance traveled
the inert and 01 is its velocity.
foil experiments give
(2.1)
by the shock in
The embedded
(2.2)
3.4 – A
%\
E
~m3.2 –
=“
3.0 -
q
2.8 –
I 1 Io 10 20 30
Plate Thickness(mm)
Fig. 2.2. A plot of the free-surface velocity vs
thickness for a 101.6-mm-long x 101.6-mm
diam (X/d=l) planewave Composition B/
dural system. The explosive was initiat-ed by a planewave lens of 203.2-mm aper-
ture.
Deal q Davis A
where ~ and ~ are the initial and final foil posi-
tions, respectively, and u is the particle velocity
in the explosive. Similarly the rarefaction head
experiments give
~= X-~(c-u)Rdt , (2.3)
where ~ is the position of the rarefaction head, X
is the length of the explosive, and c is the local
speed of sound. Therefore, data from free-surface
velocity and magnetic probe experiments provide us
with the most detailed view of the profile following
the detonation wave. Since we have no data obtained
using the magnetic probe, our work will rely heavily
on the free-surfacevelocity measurements. This k
unfortunate for two reasons. First, the data on
free-surfacevelocities only probe back 10 mm into
the explosive gases. Second, we cannot be certain
that we fully understand how to interpret the data.
B. Free-Surface Velocities
The free-surface velocity measurements on Com-
position B were made over a period of 14 years.
During that time the formulation changed from 64%
RDX/36% TNT (by weight) P. = 1.71 Mg/m3 at the time
of Deal’s8 measurements, to 60% RDX/40% TNT, P. =
1.73 Mg/m3 at the time of Davis,14
measurements.
To first order the changes in the energy and density
are just compensating and we will not make any dis-
tinctions between these two formulations. The tech-
niques used by Deal and Davis to measure the free-
aurface velocity are sufficientlydifferent to war-
rant some comment. Both techniques employ a rotat-
ing-mirror smear camera to time the flight of the
free surface over a fixed free-run distance. Deal’s
technique is symmetric in that he used armored argon
flash gaps (0.089 mm) at both ends of the run. On
the other hand, Davis equated the change in reflec-
tivity of the free surface with the start of the
free run and the appearance of a luminous air shock
5

8/3/2019 J. B. Bdzil and W. C. Davis- Time-Dependent Detonations
http://slidepdf.com/reader/full/j-b-bdzil-and-w-c-davis-time-dependent-detonations 8/39
generated by the arrival of the plate at a plaatic
flasher with the end of the run. Figure 2.2 shows
that the two techniquesproduce different results
for a 101.6-mm-longx 101.6-mm-diam (X/d = 1) plane-
wave Composition B/dural system. Although Davis’
data have the same slope as Deal’s, his values are
consistently higher by about 6%. This difference
is probably attributable to the greater sensitivity
of Davis~ technique to surface fluff. However, it
would be difficult to judge which technique is the
more accurate. In lieu of such a judgement, we will
reduce Davis’ data by 6% to bring them into agree-
ment with Deal’s. We choose this alternative be-
cause Deal’s method is used in calibrating the equa-
tion of state of inerts which we will require in our
calculations, and because he collected more data over
a wider range of materials and plate thicknesses.
Before we proceed with an analysis of the data,
we must determine which if any data sets belong to
the family of plane one-dimensionalexperiments. The
3.4
3.2
L
xx
0 10 20 30 40 50
Plate Thickness(mm)
Fig. 2.3a. A plot of the free-surfacevelocity vs
thickness for some 101.6-mm-longplaDe-
wave CompositionB/dural systems show-
ing the dependence on X/d.
Deal X/d=%X X/d=l q X/d=2 t
Davis/1.06 X/d=l h
3.5
3.3
2
,*
E s-lE
Inu-
3
2.9
2.7,
T
I I II
o 10 20 30 40 50
Plate Thickness (mm)
Fig. 2.3b. A plot of the free-surface velocity vs
thickness for some 203.2-MM long plane-
wave CompositionB/dural systems show-
ing the dependence on X/d.
Deal X/d=ll X/d-l@ X/d=2 s
Davis/1.06 X/d=l A
precise definition of a one-dimensional system is
relaxed somewhat in this report to include the three-
dimensional structure of the planewave driver and
the reaction zone, but still reject any gross multi-
dimensionality resulting from side rarefactions. We
can get some measure of the effect that side rare-
factions have on the data by comparing free-surface
velocity data for charges of the same length but of
different diameters. Figures 2.3a and 2.3b show the
free-surfacevelocity for a number of different
length-to-diameterratios (X/d) for both 101.6-mm
and 203.2-mm-long charges. The data for the 101.6-nnn-
long experiments show that the data taken for sys-
tems with X/d=b and X/d=l belong to the same set,
while the two data points for X/d=2 are significant-
ly lower. Examining the data for the 203.2-mm-long
experiments shows that the data for X/d=l and X/d=2
are clearly distinguishable. ~us, these data sug-
gest that systems with a length-to-diameterratio of
6

8/3/2019 J. B. Bdzil and W. C. Davis- Time-Dependent Detonations
http://slidepdf.com/reader/full/j-b-bdzil-and-w-c-davis-time-dependent-detonations 9/39
the explosive less than or equal to one and dural
plate thickness up to about 40 or 50 mm can properly
be classed as one-dimensional. The technique used
by Davis is especially well suited to judge the di-
mensionality of the experiment since it givea the
local values of the free-surfacevelocity over the
surface of the witness plate. Figure 2,4 shows that
the free-surface velocity is reasonably constant over
the central region of the plate and falls rapidly in
the region that has been influenced by side rarefac-
tions. By extrapolating the length of this plateau
to zero plate thicknesswe get the dimension of the
region of one-dimensional flow in the explosive.
Experiments on Composition B show that the ratio of
the velocity of the side rarefaction in the explo-
sive to the detonation velocity is about 1/4.21 That
is, the outer 13 mm of a 50.8-mm-long charge and the
outer 50 mm of a 203.2-mm-long charge induce free-
surface motions into dural that show the effects of
side rarefactions for all plate thicknesses. The
effect that side rarefactions have on the flow in
the inert is greater owing to the absence of an ex-
othermic process there. This difference leads to a
flow in the inert which is strongly subsonic for
some distance behind the shock as compared to the
flow in the explosive which is sonic at the shock
and supersonic thereafter. Figure 2.4 shows the
results of a series of experiments on 50.8-mm-long x
3.2
3.0
2.8
2.6
2.4
1 \2.21 I I 1 I I J-60 -40 -20 0 20 40 60
DistonceAlongplote(mm)
Fig. 2.4. The free-surfacevelocity vs distance
along the plate for a charge of Composi-
tion B 50.8-mm long x 101.6Jmm diam driv-
ing 11OOF A1.22 The plate thicknesses are
2.54 mm, 5.08 mm, 10.16 mm, and 20.32 mm.
TABLE II-1
THE LIMITS OF
FOR PIANEWAVE
Composition B
Length (mm)
50.8
101.6
203.2
ONE DINENSIONALTY
COMPOSITION B/Al
Maximum Al
~ Thickness (mm)
1/2 40
1 15
1/2 75
1 25
1 50
101.6-mm-diam charges of Composition B driving 11OOF
Al plates of 4 different thicknesses, These experi-
ments show that the ratio of the velocity of the side
rarefaction to the velocity of the shock is about
equal to the theoretical maximum of one. Therefore,
the region of one-dimensional flow in the Al is
bounded by a right equilateral triangle whose base
rests on the Composition B/Al interface. Applying
these results we obtain an estimate of the maximum Al
plate thickness that can be used with various lengths
of explosive (see Table II-l). Using the criteria
established here we must reject Deal’s 38-mm dural
point for X/d=l and 101.6 mm of explosive. Exami–
nation of Fig. 2.3a confirms this conclusion. There-
fore, in light of the experimental evidence, the
greater part of the free-surface velocity data on
Composition B/dural must be considered as one-dimen-
sional. The number of experiments which have been
directed to the question of multi-dimensional flow
in these systems is not large.and perhaps all of
the interesting questions have not been answered.
Nevertheless we feel that our conclusion is substan-
tially correct.
All of the one-dimensional free-surface veloc-
ity data on 24.5-mm, 50.8-mm, 101.6-mm, and 203.2-mm-
long charges of Composition B/dural are shown in
Fig. 2.5. A linear fit to each of the data sets
suggests that the initial free-surface velocity in-
creases with the length of the charge. Although the
scatter in the data is large, the intercept for the
25.4-mm and 203.2-mm-long charges differ by 0.3 mm/
US, which is well outside of experimental error.
If we interpret this increase in the initial free-
1urface velocity Ufs ~ as showing an increase in
pressure in the explosive, then the flow of explo-
sive gases does not
the Chapman-Jouguet
scale, which is in violation of
theory.
7

8/3/2019 J. B. Bdzil and W. C. Davis- Time-Dependent Detonations
http://slidepdf.com/reader/full/j-b-bdzil-and-w-c-davis-time-dependent-detonations 10/39
3.5I I I I I
q
s
:*
E 3.]–
E-i
3“
2.7-v
Io
Fig. 2.5.
Mo8t
that have
motivated
10 20 30 40 50
Plate Thickness (mm )
Free-surfacevelocity vs plate thickness
data (Deal, Davis) for a one-dimensional
Composition B/dural system, The chargelengths are 203.2mm (0), 101.6mm (n),
50.8mm (A), and 25.4mm (~). The dash-
ed lines are the result of calculations
made using y-law equations of state for
the explosive gases and a Mie-Gr~neisen
equation of state (LA-4167-MS)for the
dural data. (See Fig. 1.1)
of the free-surfacevelocity measurements
been made on explosive-driveninerts were
by a desire to measure the Chapman-Jouguet
pressure of the driving explosive. The explosive
pressure ia calculated by extrapolating the free-
surface velocities to zero plate thickness and then
performing an impedance match into the explosive
gases with this value. A check on the self-consf.s-
tency of this procedure can be made by taking the
pressure so measured and a reasonable equation of
state for the gases and then computing the free-sur-face velocity curve. Such a series of calculations
was done using a y-law equation of state for the ex-
plosive gases with y selected so as to reproduce the
‘easured ‘alue ‘f “fslo”The results of these cal-
culations (the dashed lines) are shown in Fig. 2.5.
The agreement between calculation and experiment
ia good for the 50.8-mm-long charge. However, one
finds that the calculation and experiment are in
gross disagreement for the 203.2-mm-long charge.
One possible explanation for the poor agreement is
that our description of the inert (Mie-Gr~neisen
fluid) is not adequate. Modifying our calculation
to include an elastic perfectly plastic description
23of dural steepens the free-surface velocity curves.
Unfortunately, the increaae is small and the slopes
are increaaed by the same percentage for both charge
lengtha.
Since all of the above calculations are based
on the assumption that the explosive gases can ade-
quately be described by a constant y equation of
state, it is worthwhile to aak whether any other
equation of state for the explosive gases will pro-
duce better agreement between the calculated and ex-
perimental slopes for long charges. If one assumes
that the curvature of the free-surfacevelocity
curves is not large, he can answer this question with
a simple analytical calculation. The success of this
calculation hinges on one’s knowing the gradient in “
the following flow at the Chspman-Jouguet point for
any equation of state at any time. Our starting
point is the one-dimensional Euler equations
(E)h+~$%)t0,
(%),+(E)h09
(2.4)
(2.5)
(2.6)
where v is the specific volume of our fluid, p. the
initial density, u the particle velocity, P the pres-
sure, E the internal energy, t the tim~ and h the
material coordinate. The Eulerian space variable
L = L(h,t) ia related to the Lagrangian variable by
()c
Eh=” “
(2.7)
(2.8)
8

8/3/2019 J. B. Bdzil and W. C. Davis- Time-Dependent Detonations
http://slidepdf.com/reader/full/j-b-bdzil-and-w-c-davis-time-dependent-detonations 11/39
If we assume that the flow is non reactive then
Eq. (2.6) can be rewritten as
which expresses the conservation of mass. The bal-
ance of momentum implies that
($,+2($., (2.9 [P] =pou [u] . (2.16)
Making use of the formalism presented above, it is
a relatively simple matter to derive equations which
[1
audescribe the evolution of [P], ~ , etc. If we
assume that all derivatives are zero in the unshock–
ed state, then application of the jump conditions to
Eqs. (2.9), (2.5), and (2.4), along with Eq. (2.13),
yields
where z = PC is the impedance of the fluid. Since
we are aasuming a Chapman-Jouguet detonation, the
detonationwave is a singular surface across which
u, P, v,and E suffer jump discontinuities. The wave
velocity as seen by an observer fixed to a material
point is
u(t) .8 , (2.10)
where ~ is the material point, labeled by its posi-
tion in the reference configuration,at which the
wave is tO be found at time t. An observer at rest
sees the wave velocity
If a constitutive relation is available for the fluid,
then the total differentials of [P] and [u] on theHugoniot curve are related
d[u] = (&)Hd[P] ,
and Eq. (2.17) canbe used
[P] provided[1
is known.
Hor 8 E $ we begtn with
A =+(%- [~1) $
by
(2.18)
u(t) =* .
Following Truesdell
across the singular
(2.11)
we denote the jump in a variable
surface by
to give the evolution of
To derive an equation
(2.12)(2.19)
where the superscripts + and - refer to states
Hp
where A ~ZK’
which, after differentiation, becomes4,25ahead of and behind the surface, respectively.
If W&l and _ are everywhere continuous in
~+A$=~ -[~] +&] . (2.20)
dt2
h except at the singular surface where they suffer
jump discontinuities, then
(2.13) Applying the jump conditions to Eq. (2.5), taking
the total time derivative of the result and then add-
w here~ .1s the rate of change of [$] seen by an
observer riding on the wave front. When [~] = O we
elds
(2.21)
ing the derived equation to Eq. (2.20) y
2Uj$+A$=~-
dt2
[+] -P:U2[+]24get the Maxwell compatibility relation
(2.14)
is continuous
Eq. (2.9) withow, taking the partial derivative of
respect to time and then applying the jump conditions
Since the Eulerian
at the wave front,
position coordinate
Eq. (2.14) yields
gives
+]->(%)’ ,0
12p 22—. -
at2[u] =-upo [v] , (2.22)2.15)
9

8/3/2019 J. B. Bdzil and W. C. Davis- Time-Dependent Detonations
http://slidepdf.com/reader/full/j-b-bdzil-and-w-c-davis-time-dependent-detonations 12/39
( )z
‘here Gis the change of impedance with volume at
constant~ntropy. Substituting Eq. (2.22) into
(2.21) givea the desired result
explosive before and the inert after the match. The
slope of the free-surfacevelocity is then given by
(2.29)
(2.23)
where D2 is wave velocity in the inert. Specializ-
ing this result to 203 mm of Composition B (y =
2.72, p. = 1.73 Mg/m3, VI = 7.9 mmlps) and dural
(Walsh: LA-4167-MS) giveshere we have used the identity
aufsaul
-ai- ‘0”25m=o”5 +)+ (2030)
(2.24)
This excursion into the formalism of singular
surfaces was motivated by our need to know the grad-
ient of the particle velocity immediately behind the
classical Chapman-Jouguetstate. Now, [P] and [u]
are constant at the Chapman-Jouguet state. There-
fore, it follows from Eq. (2.17) that the flow is
sonic and from Eq. (2.16) that U is constant. With
these restrictions Eq. (2.23) becOmes
where X
stant y
-1ps as
merical
this system7-1
of 0.0052 PS . This is only half
as steep as Deal’s experimentalvalue of 0.0108
-1ps . In order for the calculation to agree with
Deal’s experimental slope we must have
is the length of the explosive. For a con-
equation of state, Eq. (2.30) gives 0,0053
compared to the result obtained by a nu-
integration of the difference equations for
()dB&s z
x=—8
2POZ2
( —)9.ny
Wnv s= 1.89 . (2.31)
(2.25)
The value of this derivative calculated from the
BKW-HOM and JWL isentropes is -0.23 and 0.76, respec-
tively. Although the JWL isentrope is better than
the BKW-HOM at producing a slope of the desired
steepness, neither of these calibrated iaentropee
agrees with the data. It is possible to adjust the
parameters in an equation of state so that Eq. (2.31)
is satisfied. The
is possible is the
which integrates to
(2.26)
()cJ=l=%i?i@ ‘
(2.27) simplest example
Tait equation of
for which this
state,
()+a v ‘n— . .
Po+a v ‘o
2ywhere y E z p . To get the initial value of the
particle velocity gradient in the dural we need per-
form only a simple acoustic impedance match.
(2.32)
where a and n are adjustable parameters. Adjusting
these parameters to get both the proper intercept
and slope we get n = 0.83 and a = 66.1 GPa. If this
calibration of the Tait isentrope for 203 mm of Com-
position B is used to calibrate the match pressure
into hexane, we get
$=2AMJAP ‘(2.28)
where z12
E zl/z2, c is the sound speed, the sub-
script c denotes the value at the interface after
the match, and 1 and 2refer, respectively, to the ~hexane)Tait = “o’ ‘pa (2.33)
10

8/3/2019 J. B. Bdzil and W. C. Davis- Time-Dependent Detonations
http://slidepdf.com/reader/full/j-b-bdzil-and-w-c-davis-time-dependent-detonations 13/39
as compared to the experimental
~hexane)Deal =1409Gpa .
Therefore, a calibration of the
value12 of
(2.34)
Tait isentrope to
the Composition B/dural U
fs
intercept and slope
fails badly at reproducing the match pressure in an-
other inert. All of this suggests that the observed
slope of Uf~ in a 203-mm-long Composition B/dural
planewave experimentcan probably not be reproduced
by equation of state modifications. Also, Eq. (Z,31)
requires that y be a strongly decreasing function of
density at the Chapman-Jouguet point, a result which
is counter to one% intuition.
Reviewing our work to this point, we find that
the Ufs
measurements on Composition B/dural show an
‘nCrease ‘n Ufslo
with charge length and that the
slope of the Ufs
curve for large charges Is steeper
than can be calculatedwith any reasonable equation
of state. If our interpretationof the experimental
results is correct, i.e., the inert and explosive/
inert interaction are treated properly, then these
measurements show that the Chapman-Jouguet theory
cannot adequately describe Composition B.
c. Ad Hoc Models
In the preceding section we showed that the
simple theory fails to reproduce the measured free-
surface velocity for the system Composition B/dural.
Here we discuss some ad hoc methods that have been
tried to produce improved calculations. We begin by
considering a model for reproducing the dural Ufs
slope for long charges. Introducing a resolved
steady-state reaction zone ahead of the sonic plane
provides us two additional parameters which can be
adjusted to give both the loading pressure and slope
of the detonation wave. Modifying Eq. (2.17) so as
to include the effects of reactions, the gradient of
the particle velocity at any point in the steady re-
action zone is given by
au P SL”L
Z=% p ~2 2 ‘
(-z
o )
(2.35)
where g and r are the energy and reaction rate vec-—
tors,
()
?IErespectively, and E ~
P Wv”Specializing
this equation to a single irreversible exothermic
reaction and a y-law equation of state, we get
(2.36)
The initial density and shock velocity of the explo–
sive are considered as given. The rate rl, at least
its average value, is constrained so as to produce
the reaction zone length needed to reproduce the Ufs
curve in dural. For the sake of simplicity, we as-
sume the rate law
(2.37)
where k. and Ai are the rate constant and progress1
variable (Ai = O, no reaction; Ai = 1, complete re-
action), respectively. We take ki as
-1equal to 2 us . The pressure at the
2pou2
‘=Y+l ‘
constant and
shock,
(2.38)
is adjusted by selecting Y (P = 29 GPa, y = 6.44).
Lf the value of the scaled energy release is set toql
= 0.002 at the shock front, then the observed~
‘nitial ‘fsslope for 203-mm Composition B/dural is
q~obtained. Further, assuming that both y and > are
ufunctions of Ai, a reaction zone profile suitable to
‘reduce ‘he ‘ntire ‘fscurve in dural can be generat-
ed. To achieve this, y must be decreased monotoni-ql
tally from 6.4 to 3.0 while ~ is increased.u
This
change In stiffness of the equation of state pro-
duces partial reaction Hugoniota that cross in the
P vs u plane. In turn this leads to an unphysical
shock match into low impedance materials such as
Plexiglas, with the match pressure rising instead of
falling as we pass through the reaction zone.
This deficiency can be corrected by expanding
our concept of a reaction zone to include two rateprocesses: a very fast and energetic process follow-
ed by a slow,weak.lyenergetic process. The first
reaction is tailored so that its reaction zone thick-
ness is vanishingly short and its energy release is
equal to that necessary to produce the initial pres–
sure measured by the free-surface velocity technique.
The second is tailored to produce a pressure ramp of
the desired slope and length. Becauae of the added
11

8/3/2019 J. B. Bdzil and W. C. Davis- Time-Dependent Detonations
http://slidepdf.com/reader/full/j-b-bdzil-and-w-c-davis-time-dependent-detonations 14/39
number of degrees of freedom introducedby the sec-
ond reaction, the heat-release coefficient can be
constant and Y can be selected with equation-of-state
considerationsbeing of prime importance. Assuming
a constant Y equation of state (y = 3.15), Eq. (2.37)
With k = 2 ps-1 as a rate law, a ratio of the heat
42re ease in the second reaction to the total of
‘= 0,018, and a pressure of 29.4 GPa at the
end of the first reaction zone, we can reproduce the
initial free-surfacevelocity of dural plates driven
by 203 mm of Composition B. This is achieved without
introducing anomalous impedance matches for other
inerte. Therefore, it appears that what could not
be achieved with purely equation-of-stateconsidera-
tions is attainable if we follow the instantaneous
chemical reaction of the Chapman-Jouguet theory by a
weakly energetic reactive flow with a long relaxation
time. Clearly, if any rate process in our model is
slow, the assumption of steadiness cannot be satis-
fied for any reasonable size explosive charges.
Therefore, if these concepts are to be applied to
real explosive systems, then we must face up to the
problem of time-dependentdetonations. The increase
in Ufslo with length of explosive shows that some
relatively slow relaxation process must be important
to a description of the detonationprocess. Thus, it
would appear that a time-dependentflow, in basic
character like that described here, could bring theo-
ry and experiment into better agreement.
The phenomenon of increasing Ufslo
with explo-
sive length has been modeled by Meder.9’10 As in the
Chapman-Jouguet theory, he considered that all the
chemical energy is released instantaneouslyacross
the shock jump with the flow at the shocked state
being sonic.‘o produce a Ufslo ‘ntacept ‘hat ‘n-
cresees with explosive length, the amount of chemical
energy released by the explosive was taken to in-
crease with time. Since the detonation velocity is
related to the amount of energy released ahead of
the sonic plane, he decreased the y of the explosive
with run so as to agree with the experimental obser-
vation of a nearly constant detonation velocity.
‘sing *e ‘fslodata generated by Craigs for dural
plates driven by different lengths of the solid ex-
plosive PBX-9404, Msder calibrated y (his only avail-
able parameter) so as to reproduce the observed
‘fs10“So calibrated,his model is capable of re-
producing the free-surfacevelocity curves for PBX-
9404/dural for charges up to 50 mm in length. For
longer charges the calculated and experimental free-
surface velocity slopes differ by a factor of two.
Since one is reasonably certain that the longer sys-
tems are one-dimensional, this result suggests that
his model is incomplete.
All of the proposed changes of the Chapman-Jou-
guet model that have been discussed are based on dis-
crepanciesbetween calculation and experimental meas-
urements of dural free-surface velocities. It iS,
therefore, of some interest to compare the simple
theory with some of the altered versions of the the-
ory at reproducing different types of experiments.
Unfortunately, the other experimental results that
are available do not provide a test which is as
TABLE II-2
SHOCK TRANSIT TIMESa
A@
0.025
0.050
0.075
0.100
0.125
&
0.025
0.050
0.075
0.100
0.125
X=25mm
t(ps)/2
0.085 t 0.005b
0.171
0.259
0.347
0.439
X=slmm
t(Lls)/4
O.085C
0.168
0.254
0.341
0.427
X=slmm
t(us)/4
O.085b
0.170
0.256
0.344
0.432
x=lo2mm
t(ps)/8
0.08+
0.169
0.253
0.339
0.424
x=lo2mm
t(~s)/8
0.084b
0,169
0.254
0.341
0.427
x=lo2mm
t(~s)/8
o.086e
0.173
0.256
0.341
0.428
aTransit times for Composition B induced shocks in
dural. The length of the plate and explosive are
x and X, respectively. The diameter of the explo-
sive is 101 mm. The deviation tO.005 represents an
estimate of the magnitude of the error in the ex-
perimental measurement. A.U calculationswere done
with dural as an elasti~ perfectly plastic fluid(see Fig. 4.6).
bFinger and Kurrle
17
cMader’s model (PO = 1.73 Mg/m3, V = 7.85 mm/ps,y= 2.98)
dChapman-Jouguet model (p. = 1.73 Mg/m3, D = 7.85
~/PS, y = 2.76)
‘Steady two-reactionmodel
12
8/3/2019 J. B. Bdzil and W. C. Davis- Time-Dependent Detonations
http://slidepdf.com/reader/full/j-b-bdzil-and-w-c-davis-time-dependent-detonations 15/39
sensitive as that provided by the free-surfaceveloc-
ity measurements. Table II-2 shows some tranait times
for Composition B induced shocks in dural. The exper-
imental values are the result of measurements per-
formed by Finger and Kurrle.17
The calculated values
are those obtained with the Chapman-Jouguet theory,
Mader’s model, and a steady-state two-reactionmodel
adjusted so as to produce the experimentallyobserved
free-surfacevelocity curve for a 101-mm-long charge.
As is apparent, the transit times do not change sig-
nificantly in going from model to model and all of
the calculatedvalues agree with experiment. What
this exercise suggests is that all of the remaining
experiments are sufficiently insensitive so as to
permit considerable flexibility in modeling the free-
surface velocity measurements.
III. A TIME-DEPENDENT TWO-REACTIONDETONATION
Our examination of the Composition B/dural free-
surface velocity measurements showed that a two-re-
action detonation model would produce better agree-
ment between calculation and experiment than was
possible with existing theories. The apparent con-
stancy of the detonation velocity and the fair qual-
itative description of explosions given by the Chap-
man-Jouguet theory imply that most of the available
chemical energy in the explosive is given up very
rapidly. For these reasons we assume that the first
reaction is both very exothermic and instantaneous
as in the simple theory. It is followed by a slow
process of arbitrary thermicity. A number of possi-
ble mechanisms for the slow process present them-
26selves. Erpenbeck has shown that even the simplest
steady-state one-dimensional reaction zone models
are not stable to small perturbations. Considering
the complexity of real reaction zones, it seems un-
likely that the flow will be laminar in any real ex-
plosive. This in turn implies that some of the chem–
ical energy of the explosive is used to drive veloc-
ity fluctuations that are transverse to the mean
flow. If these-motionsdecay relatively slowly, as
they do in gaseous explosives, then their decay might
27well serve as the second rate process. For Compo-
sition B another candidate for the slow process is
carbon coagulation. The explosive products of Com-
position B are known to contain a considerable amount
of solid carbon. Since the agglomeration of carbon
atoms to form particles is probably limited by dif-
fusion, such a process could also be a relatively
slow kinetic step. Unfortunately, the available
data do not permit us to determine the nature of the
second rate process. For the purposes of modeling,
however, it is sufficient to know that such a pro-
cess probably exists.
The detonation model we propose makes the fol-
lowing assumptions: (1) The energy release is a
linear function of the n variables Ai which describe
the progress of n parallel reactions (Ai= O, all re-
actants; A. = 1, all products). (2) The energy ql1
“releasedby the first reaction is most of the totaln
energy;.i.e., if q = i~lqi$ then
q-ql= 0(10-2)
q(3.1)
where
q>o. (3.2)
(3) The first reaction is irreversible and its time
scale is sufficiently short compared to the times
over which measurements are made on the explosive
to allow us to assume it is instantaneous. (4) The
other reactiona are slow compared to measurement
times. (5) The flow is governed by the one-dimen-
sional Euler equations (for a discussion of the mean
flow equations for a turbulent fluid see Ref. 27),
with Eq. (2.9) replaced by
(6) The region of reactive flow is followed by an
isentropic release wave. Equations (3.3),(2.37),(2.5),
and (2.4) together with a suitable equation of state
for the fluid provide a complete description of the
flow in any region of the fluid in which the flow
variables and all of their derivatives are continuous.
At the detonation front (the only surface of discon-
tinuity we consider), the flow variables must satisfy
the three Rankine-Hugoniot conditions. These three
boundary conditions, a suitable set of initial condi-
tions, and the governing equationa constitute a com-
patible system if, and only if, the shock front (the
front pressure, etc.) follows a prescribed curve in
13

8/3/2019 J. B. Bdzil and W. C. Davis- Time-Dependent Detonations
http://slidepdf.com/reader/full/j-b-bdzil-and-w-c-davis-time-dependent-detonations 16/39
the [P] vs t plane. For our model to be of any use,
this curve,which is implicitly contained in the gov-
erning equations and boundary conditions, must be
obtained. This can be done by solving the ordinary
differential equations which describe the time rate
of change of the jump discontinuities across the det-
onation front.
Following the procedure used in Sec. II B we
readily obtain
Jm”’- ‘)[*l ‘i[ii’=]dt -
(,+’.,(%))
, (3.4)
( )
&lwhere
dP ~is the total derivative along the partial
reaction Hugoniot curve corresponding to Al = 1 and
Al = O. As before, we assume that the fluid ahead of
the shock is quiescent and the reaction ratea there
are zero. Equation (3.4) is an ordinary differential
equation involving the two dependent variables [P]
and [ ~ 1‘ i n c e~ 1s not known a priori we must
also formulate an equation for it. Equations (2.21)
and (2.24) serve as the starting point for such a
development. In place of Eq. (2.22)we need the
analogous expression for a reactive fluid, Taking
the partial derivativewith respect to time of Eq.
(3.3) and then applying the jump conditions gives
If the flow at the high-pressure side of the
discontinuity is sonic, then the equationa uncouple.
[1
nSince we require [P] to be bounded, Z qiri must
i=’be equal to zero. There are a number of ways that
this can be achieved. A single reversible chemical
reaction which is at equilibrium at the discontinu-
ity satisfies the above condition. Wood and Parker28
have shown that the slope at the discontinuity de-
creases more rapidly with time than it doea for a
nonreactive fluid and that at long times (compared
with the relaxation time) a growing region of con-
stant state develops behind the frozen sonic point.
Another possibility is two irreversible reactions of
opposite thermicity,whose rates at the sonic point
are adjusted so that q2r2 + q3r3 E 0. No different
types of behavior are possible depending on whether
the system is basically endothermic q2 + q3 < 0 or
exothennic q2 + q3 > 0. For the endothermic case
the slope A reaches a steady state positive value
corresponding to the establishment of a steady weak
detonation. For the exothermic case A decreases
until at some finite time it approaches negative
infinity at which time a shock develops, thereby
restoring the coupling between Eqs. (3.4), (3.5),
etc.
Although the assumption of sonic flow at the
shock simplifies the analysis of Eqs. (3.4), (3.5),
etc., it restricts [P] to be constant. Since our
aim is to construct a model which allows [P] to
increase with run we must proceed differently. For
the sake of simplicity we limit our discussion to
the following constitutive relations: one irrevers-
ible slow kinetic step obeying Eq. (2,37), and a
polytropic equation of state
PvE= ~- qA1+q2(Al-A2) , (3.6)
[
)132 n 2
E;
E qiri ,
i=2
where q2 > 0 and Y is a free adjustable parameter.(3.5)
The assumption that the first reaction occurs instan-l’L J
taneously places the detonation wave on the Al = 1,
uhereJ1 a’p 12 = O Hugoniot curve. Specifying any one of*the. Againwe find that an additional un-h’
variables [P], [p], [u], or U on this Hugoniot curveknown, J, has been introduced. Continuing this
determines the others.procedure (i.e.,deriving an equation for J) only
If we take the CJ point of
leads to more new unknowns
[]
a3p~ being introduced,
the detonation with energy release ql as a reference
and eventually leads to the ?!e tion of an infinitepoint (the asterisk being used to denote this ref-
hierarchy of differential equations.erence state), and define
8/3/2019 J. B. Bdzil and W. C. Davis- Time-Dependent Detonations
http://slidepdf.com/reader/full/j-b-bdzil-and-w-c-davis-time-dependent-detonations 17/39
E=m.lP*
(3.7a) ,,(Q-y 628+3/$-)62, (3.11)
then
[u] = U*(1 + 2c)~ (3.7b)
[P] = P*(1 i-E)
( )
- P. (3.7C)l+y E
“=”= s(3.7d)
where we have assumed that u and P in the unahocked
material are zero and
* POD*2.—
p – y+l
* ~u
= y+l
p’=po(~) .
(3,8a)
(3.8b)
(3.8c)
The total differential of any of these variables
along the Hugoniot curve is directly related to dc
through Eqs. (3,7). At this point it ia convenient
to introduce the scaled variablea
t 1=
u’ =
Al =
J! =
B, =
z! =
where p/pO and U are given by Eqs. (3.7c) and (3.7d)
and A and 8 are related by Eq. (2.24). Progress
can be made at finding a solution to these coupled
equations by taking advantage of the smallness of
the energy fraction 6. A simple perturbation ex-
pansion in d of the solution of this set reduces the
problem to more managable proportions. It is a sim-
ple matter to show that
E = 0(6)
A=o(6), B=O(6)
J =0(62)
U=1+O(152) ,
*ere we assume
&(t) = &cl(t) +
expansions of the form
#E2(t) + ... (3.13)
(3.9a)2= (R)~ - 2.,,,)
~=,(~)(, - 4,:).k2t (3.9b)
u/p* (309C)
(D*/k2P*)A (3.9d)
(U*2/k22P*)J (3.9e)
(Po~*2/P*k2)8 (3.9f)
z/(pou*) . (3.9g)
Written in terms of these variables Eqs. (3.4) and
(3.5) become (dropping the primes)
‘~=‘(%)-) (=’ -‘2),@4+ ~A&l .
dt dt
62 & }-J2-0
2
(;(F) ( )1* B2
o
(3.12a)
(3.12b)
(3.12c)
(3.12d)
for all of the dependent variables. Substituting
these expansions into Eqs. (3.10), (3.11) and re-
taining only higheat order terms gives
(3.10)
(3.14a)
(3.14b)
If we assume that initially E = O and limit B + w
t+o
the solution to these equations is
c 1= tanh (* T) ,
where
()~t‘=4y “
(3,15a)
(3.15b)
(3.16)
Equations (3.15a) and (3.15b) give the pressure and
auslope — at the shock to first order in the smallness
ah
parameter 6. Since J and all higher order deriva-
tives are of higher order in 6, these equations rep-
resent the complete solution to order 6. What these
solutions show is that the pressure on the A = 1,1
15

8/3/2019 J. B. Bdzil and W. C. Davis- Time-Dependent Detonations
http://slidepdf.com/reader/full/j-b-bdzil-and-w-c-davis-time-dependent-detonations 18/39
A2 = O Hugoniot curve increaaes from an initial val-
ue of P* to a final ateady value that ia greater than
this value (q2 > O). The time required to reach 90%
of the steady-state value of [P] - P* ia of order
(10/6) reaction times. For early times the slope
begins by being equal to the value for a Chapman-
Jouguet detonation in a y-law fluid and for late
times it approaches a constant steady value which is
characteristicof the steady-state two-reaction (ql
> 0> %2 > O) detonation. This slope is always grest-
er than or equal to that of the y-law Taylor wave in
the Chapman-Jouguetdetonation.
Figures 3.la and 3.lb show the early and late
time behavior for our two-reactionmodel. At early
times the first reaction is nearly frozen and the
flow behavea much as a Chapman-Jouguet detonation
with a pressure P*, At very late times the reaction
zone structure becomes apparent with the pressure on
P
NEorlytime
—Po/P~ o
Fig. 3.la
[
Pn
*2P.o
P*= —y+ I
II*
l’-
A schematic representationof the early
time behavior of our time-dependentdet-
onation model.
/
P
I
—Po/P~ ‘%o 0,0
/
~
P
/
;RZ,#2
Pp,Taylorwove
II
- P“
-“P” “P”=P*(I+O (8))
P= P*(I+O(85)
-P* ?.4=D*(I+O(82))
Fig. 3.lb A schematic representationof the late
time behavior of our tire-dependentdet-
onation model.
the Al = 1, A2 = O Hugoniot increasing to “P” - P*
[1 + 0(6)] while the pressure at the sonic plane re-
mains nearly equal to the initial value P = P*[1 +
0(62)]. If the second reaction zone is reasonably
large then the pressure “P” is the value inferred
*from free-surfacevelocity measurements. Therefore,
we have ahown that by including a second slow exo-
thermic process in our detonation model we can at
least qualitatively account for both the steep slope
of the free-surface velocity curves for large charges
and the increase in the apparent Chapman-Jouguet
pressure “P” with run.
For purposes of calculation we need to include
higher order terms (in 6) in our shock jump relationa.
16
8/3/2019 J. B. Bdzil and W. C. Davis- Time-Dependent Detonations
http://slidepdf.com/reader/full/j-b-bdzil-and-w-c-davis-time-dependent-detonations 19/39
TO do this additional equations must be added to our
system, in particular an equation for J if we are to
go up to order 62, Proceeding as we did in the der-
ivation of Eq. (3.11)we readily obtain
(3.17)
where J~ is the leading term in J. This equation
is easily solved yielding
()2=~ cech2T . (3.18)
Using this result we can go on and obtain the second
order corrections to c and B
()2 . - & tanh (%T) (3.19)
‘2 = ‘1 ()+ ~ sech (%T) [sech (4T)
(3.20)
- k csch (%T)] .
Us~gMs. (3.15), (2.28), (2.29) and Fig.
2.5 it is possible to get a good estimate of the pa-
rameter values (Y, D*, 6, k2) needed to reproduce
both the intercepts and the initial slopes of the
Composition B/dural experiments. However, the cal-
culations on other experiments would be prohibitively
difficult without the aid Of a one-dimensional hydro-
dynamic code. In the next section we discuss the
numerical solution of the hydrodynamic equations for
our model obtained by using a Lagrangisn mesh code.
IV. NUMERICAL SOLUTION OF THE FLOW EQUATIONS
A. Programming the Shock
All of the numerical solutions of the partial
differential equations describing our model were ob-
tained with the one-dimensional Lagrangian mesh code
PAt13.9 The differencing scheme used by this codeemploys a net on which all variables are centered in
time and the pressure, density, internal energY, and
composition are cell-centered quantities while the
position and particle
right cell boundary.
be performed a simple
to be made.
velocity are those of the
Before any calculations could
modification of the code had
We recall that our two-reactiondetonation model
assumes that the relaxation time for the first reac-
tion is many orders of magnitude shorter than that
of the second reaction. The disparity in times makes
it impossible to resolve the very fast reaction zone
and still retain a sufficient number of mesh cells
for the remainder of the reactive flow and the Taylor
wave. This difficulty can be circumvented if the
first reaction zone is replaced by a sharp shock
burn, thereby leaving the entire mesh for the second
reaction zone and the Taylor wave. A special pro-
grammed shock advance package written by Wildon
Fickett and Jack Jacobson30
was used to accomplish
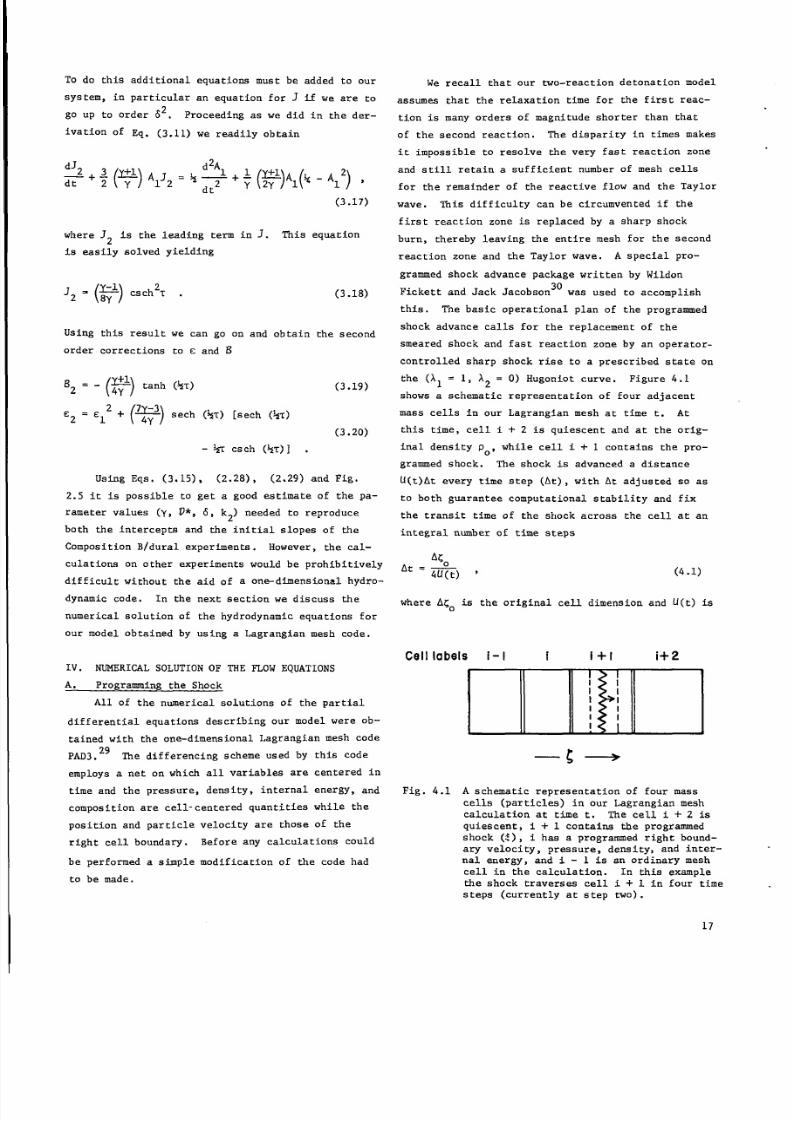
this. The basic operational plan of the programmed
shock advance calls for the replacement of the
smeared shock and fast reaction zone by an operator-
controlled sharp shock rise to a prescribed state on
the (Al = 1, 12 = O) Hugoniot curve. Figure 4.1
shows a schematic representation of four adjacent
mass cells in our Lagrangian mesh at time t. At
this time, cell i + 2 is quiescent and at the orig-
inal density PO, while cell i + 1 contains the pro–
grammed shock. The shock ia advanced s distance
U(t)At every time step (At), with At adjusted so as
to both guarantee computational stability and fix
the transit time of the shock acroaa the cell at an
integral number of time steps
q
At=— 4u&) ‘ (4.1)
where ACO is the original cell dimension and U(t) is
Cell labels i-1 i i+l i+ 2
mIKlFig. 4.1 A schematic representation of four mass
cells (particles) in our Lagrangian mash
calculation at time t. The cell i + 2 is
quiescent, i + 1 contains the programmed
shock (:), i has a programmed right bound-
ary velocity, preeaure, density, and inter-nal energy, and i - 1 is sn ordinary mesh
cell in the calculation. In this example
the shock traverses cell i + 1 in four time
steps (currentlyat step two).
17

8/3/2019 J. B. Bdzil and W. C. Davis- Time-Dependent Detonations
http://slidepdf.com/reader/full/j-b-bdzil-and-w-c-davis-time-dependent-detonations 20/39
held constant in each cell but may vary from cell to
cell. To produce the desired compression associated
with the passage of the shock,the right boundary of
cell i is advanced at the particle velocity on the
(Al = 1, 12 = O) Hugoniot curve, [u]. When the ahock
arrivea at the right boundary of cell i + 1, the
density of this cell at that time is given by
-1
Pi+l= f’o ()+ , (4.2)
while the pressure and internal energy are given by
their respective shock conservation conditions. The
“snapshot” shown in Fig, 4.1 has cell i with its
right boundary velocity, pressure, density, and com-
position programmed at the values [u],[P],[p]~o, and
(Al = 1, A2 = O) respectively. Therefore, it is the
cell whose state corresponds to the high-pressure
side of the shock discontinuity between the (Al = O,
12 = O) and (Al = 1, AZ = O) partial reaction Hugon-
iots. The evolution of cell i - 1 and all of its
neighbors to the left is controlled by the standard
mesh code integration, subject to the boundary condi-
tions being imposed in cell i and at the left bound-
ary of our system plus the initial conditions. As
time passes the special cell designation is advanced
to cell i + 2, etc.
It is important that the specification of cell
i’a state be as consistent as is possible if the
amount of numerical noise in these calculations is
to be kept to a minimum. If the time-dependent0(62)
jump conditions derived in the previous section are
used to set the state of cell i, the perturbations
introducedby imperfections in the shock jump condi-
tions will be minimized. Figures 4.2 show the parti-
cle velocity vs distance profiles generated using the
sharp shock burn and PAD3. The parameter values used
in the reaction zone are those describing Composi-
tion B (see Sec. V) while a JWL equation of state
as calibrated by Rivard19 (.JWLR)was used for the
isentropic release wave. These “snapshots” show the
final form of the detonation wave profiles that de-
velop in explosive charges which are approximately
50-mm, 100-mm, and 200-mm long. Since as a general
rule the quality and accuracy of a calculation de-
pends to a large measure on the number of mesh cells
used per unit particle velocity gradient, 512 cells
were used in each of the above calculations. Owing
2.0
$1.5
&
==
: 1.0>
0.510 20 30 40
Distance (mm)
Fig. 4.2a
2.0
z<* 1.5
&
==
;S 1.0
0.510 30 50 70 90
Olstance{ (mm)
Fig. 4.2b
2.0
G
<: 1.5
&
==
~1.0
3
0.520 60 100 140 200
Oistance (mm)Fig. 4.2c
Figs. 4.2 The computer-generatedparticle velocity
vs distance (L) profiles for our two-
reaction detonation model. The parame-
ter used in the reaction zone are those
describing Composition B (D* = 7.85 mml
llS,y= 3.15, 6 = 0.16, k2 = 2 ~S-l,
P. = 1.73 Mg/m3).
18

8/3/2019 J. B. Bdzil and W. C. Davis- Time-Dependent Detonations
http://slidepdf.com/reader/full/j-b-bdzil-and-w-c-davis-time-dependent-detonations 21/39
to the non self-similar nature of the flow, this does
not lead to strictly equivalent calculations. Never-
theless, if we disregard this difference it is clear
that the overall quality of each of the wave profiles
is good and comparable to the others. Momentarily
returning our attentiona to the physical aspects of
the problem, we see that the passage of time brings
with it the development of a reaction zone profile
which is distinct from that of the Taylor wave, and
in keeping with the results of experiments.
‘he wave profiles shown in Fig. (4.2)were all
obtained by solving a set of difference equations for
the model and not the partial differential equations
themselves. Presumably, if the mesh were made finer
and finer the solutions of the difference equations
would approach the solutions of the parent differen-
tial equations. Unfortunately, the computation time
increases as the square of the number of mesh cells.
Therefore, as a practical matter one would like to
use as few cells as possible and yet be able to ob–
tain, by extrapolation if necessary, solutions of
high quality, Although the number of cells necessary
to get acceptable numerical errors for such experi-
ments as the integratedmotion of embedded foils in a
piece of explosive (as well as the other less sensi-
tive experiments) is not large, an accurate calcula-
tion of the explosive-inducedfree-surfacevelocity
of an inert plate requires substantially more cells.
B. Accuracy of the Difference Equation SolutionsThe calibration of our time-dependentdetonation
model and in fact the very need for such a model is
based on the inability of the Chapman-Jouguet theory
to reproduce free-surfacevelocity measurements. It
is for this reason that we now examine the numerical
solution to the explosive/inert interaction problem
with a special interest in achieving high accuracy
with a minimum number of computational cells. For
the purposes of this study we use 25 mm of the fol-
lowing ideal (Chapman-Jouguet)explosive
P. = 1.84 Mg/m3 (4.3a)
O = 8.8 mmlpsec (4.3b)
y = 3.276 (4.3C)
and a constant-y equation of atate. The explosive
burn is via the Hot Start option in PAD3, As in
the programmed burn discussed earlier this burn also
generates a sharp shock detonationwave thus making
it ideal for our purposea. The calculations invOlv-
ing the inert are somewhat different. Since we
choose to have the code generate the shock there,
this requires that an artificial viscosity be added
to the calculation. In our work we use the Lands–
hoff2’ form of the artificial viscosity, with the
multiplier selected so that our shock waves are
neither strongly overdamped nor underdamped.
Our chief concern with inerts and the explosive/
inert interaction is the calculation of the initial
free-surfacevelocity of these plates. Given an
equation of state for the inert, the initial free–
surface velocity of a plate of thickness x can be
calculated once the particle velocity at the head of
shock (us) located at x is known. If the deacrip–
tion of the inert is via a Walsh equation of state,
we simply have
Ufs= 2U
s“
For any other perfect fluid equation of state
/+cdl~,
‘fs = s
(4.4)
(4.5)
where the Riemann integral is to be performed along
the release isentrope of the inert. Tables giving
Ufs(us) for inerts characterized by a Mie-Gr~neisen
31equation of state are available. The simplicity
of the conversion between us and ‘fs
is especially
convenient because it allows one to calculate the
‘ntire ‘fs(x) curve from one explOsive/inert calcula-
tion. Now us(x) can be obtained from the standard
PAD3 output in two different ways. The more conven–
tional of these is simply to locate the mesh cell
with the maximum particle velocity at some time and
record its position and particle velocity as those
of the shock (reading the cycle prints). In addition
to this method, a Shock Save routine is available
which assigns the value of x for which the artificial
viscosity is a maximum as the position of the shock,
and us(x) by linearly extrapolating the following
rarefaction to this point. Figure 4.3 is a schematic
representation of these two methods for a shock fol-
lowed by a rarefaction wave. The smearing of the
wave front by the viscous forces is apparent. Read-
ing the cycle print, one tends to underestimate the
value at the shock, while the Shock Save, which ia
19

8/3/2019 J. B. Bdzil and W. C. Davis- Time-Dependent Detonations
http://slidepdf.com/reader/full/j-b-bdzil-and-w-c-davis-time-dependent-detonations 22/39
Fig. 4.3. A schematic representation of a shock and
following rarefaction in an inert. Theticks represent cell boundaries, and (x)
denotea the particle velocity maximum
while (~) ia obtained from Shock Save.
an attempt to remove the effects of viscosity, prob-
ably overeatimatea the value.
The overall quality and value of code-generated
reaulta depends in large measure on such parameters
as the magnitude of the artificial viscosity in the
inert and the number of mesh cells used in the cal-
culation. Particularly important is the selection
of a viscosity multiplier for the inert. In general,the optimal value is not constant but changes in
going from one inert to another. The optimization
of the calculation with respect to the viscosity
multiplier can most convenientlybe carried out by
studying the viscosity dependence of a square-topped
shock. Figures 4.4 show the history of a mass cell
in PMMA (LA-4167-MS) which has been shocked up to
pressures typical of those produced by the inter-
action of an explosive with a low impedance inert.
The Landahoff viacoaity multiplier assumea the values
0.5, 0.75, and 1.0 in these calculations. Examina-tion of these figures clearly shows that a value of
0.75 is the best choice for PMMA, since it produces
a shock which is neither strongly underdamped (0.5)
nor overdamped (1.0). Optimizationof the viscosity
multiplier value is considerablymore important for
the wave ahown in Fig. 4.4 than for
shock. Clearly if the oscillations
20
the square-topped
characteristic of
an underdamped shock are present in the calculation,
neither the cycle print nor the Shock Save will be
of any value. Proceeding in a similar faahion for a
higher impedance inert (dural, LA-4167-Ms) we find
that the somewhat lower value of 0.5 is more satis-
factory for
Fig. 4.4a
Fig. 4.4b
Fig.
the viscosity multiplier.
3.0
A
25 IF;
=
-;2.0~
=’IJ1.5=~
I.o-
0.5-
0
1,35 1.40 1.45 1.50 L55mmo (p a)
4.4C
~
1.35 1.45 1.50 I55l ima [pa)
L I J
2.0-
1,5
1.0
0.5-
0
1.35 1.40 1,45 1.50 1.55Tlma (p)
Fig. 4.4. The history of a particle in shocked PUMA
calculated using a Landshoff viscosity.
The viscosity multiplier is set at 0.5
(underdamped),0.75 (neutral), and 1.0(overdamped)in Fig. 4.4a,b, and c respec-
tively.

8/3/2019 J. B. Bdzil and W. C. Davis- Time-Dependent Detonations
http://slidepdf.com/reader/full/j-b-bdzil-and-w-c-davis-time-dependent-detonations 23/39
I.73
ru, (0.13) 1.66
rUt(0.26)
‘:= ‘:K.002 0.004 0.002 0.004
Fig.4 .50 Flg.4.5b
‘“55P1.50
1.45 b0.002 0.004
Flg.4.5c
1.40
r us(l)
1.35
<
0.002 0.004FIo.4.50 -1
1.48
1.43
1.38
u, (0.73)
k
m
F19.4.5d0.002 0.004
Fig. 4.5
—N ‘~
The dependence of u-(x/X)
size and output rou~ine.
q cycle print
Having selected optimal values
in dural on mesh
m Shock Save
for the viscosity
multipliers we turn our attention to the effect of
mesh size an the quality of our calculation. ‘ihe
problem we examine consists of 25 mm of the ideal
explosive described by Eq. (4.3) driving 25 mm of
dural. A comparison is made of both output routines
for systems with a total of 250, 500, and 1000 mesh
cells. In each case the values of us(x) obtained
from the code were smoothed. Figure 4.5 shows us(x/X)
vs the reciprocal of the total number of cells-1
in the system (N ) for various values of the ratio
x/X, where X is the length of the explosive. It
shows that the Shock Save output is consistently
above that obtained from the cycle print and, except
for the shortest plate (x/X = 0.13), both extrapolate
to the same intercept for an infinite number of cells.
The failure of the extrapolation for x/X = 0.13 is
probably a result of the considerable amount of noise
at the explosive/inert interface that is characteris-
tic of the Hot Start explosive burn. Interpreting
the infinite N intercepts as the solution of the
governing differential equations, we find that read-
ing either of the output routines without proper ex-
trapolation will produce unacceptably large errors
in the free-surface velocities. However, if an av-erage of the output from the cycle print and Shock
Save is taken,-1<
any reasomble number of cells (N
0.005) will yield the sought-after solution. The
excessive calculation noise for small values of x/X
can easily be overcome. Since us(x) is a smooth
function of x a good value for uS(O) can be obtained
by extrapolation. Doing such an extrapolation we
get us(0) = 1.773 mm/ha as compared to the calcu-
lated interface match uS(O) = 1.776 mm/ps. The re-
sults obtained here for 25 mm/25 mm of explosive/
dural are of course valid for any size system with
the same xIX and total number of cells.
A similar set of calculations for PMMA, using
0.75 as a viscosity multiplier, gives reSdtS identi-
cal to those for dural. From the results obtained
here we conclude that the best value to use for us(x)
is the average of the cycle print and Shock Save out–
puts. In the free–surface velocity calculations
that we report in the following sections this pre-
scription is used.
c. Equation of State of the Inert
All of the explosive/inert calculations that we
have considered to this point have assumed that the
inert behaved as a perfect fluid. It is well known
that materials such as dural also have an elastic
contribution to the total stress. Although the dis-
cussion of such a phenomenon may be somewhat out of
place in a section devoted to the numerical solution
of differential equations, we will briefly examine
the importance of material strength on our free-sur-
face calculations. The elastiq perfectly plastic mod-
el of VOIIMises32 will be used to describe the inert.
In Sec. II. B we mentioned that because elas-tic unloading proceeds more rapidly than the hydro-
dynamic unloading, adding material strength to our
calculation has the effect of increasing the sound
velocity in the rarefaction. This increase in the
sound velocity at”the shock leads to a steeper us(x)
vs x curve.
Eq. (4.3) as
free-surface
Using 25 mm of the ideal explosive of
a driver we calculate and compare the
velocities produced in purely plastic
21
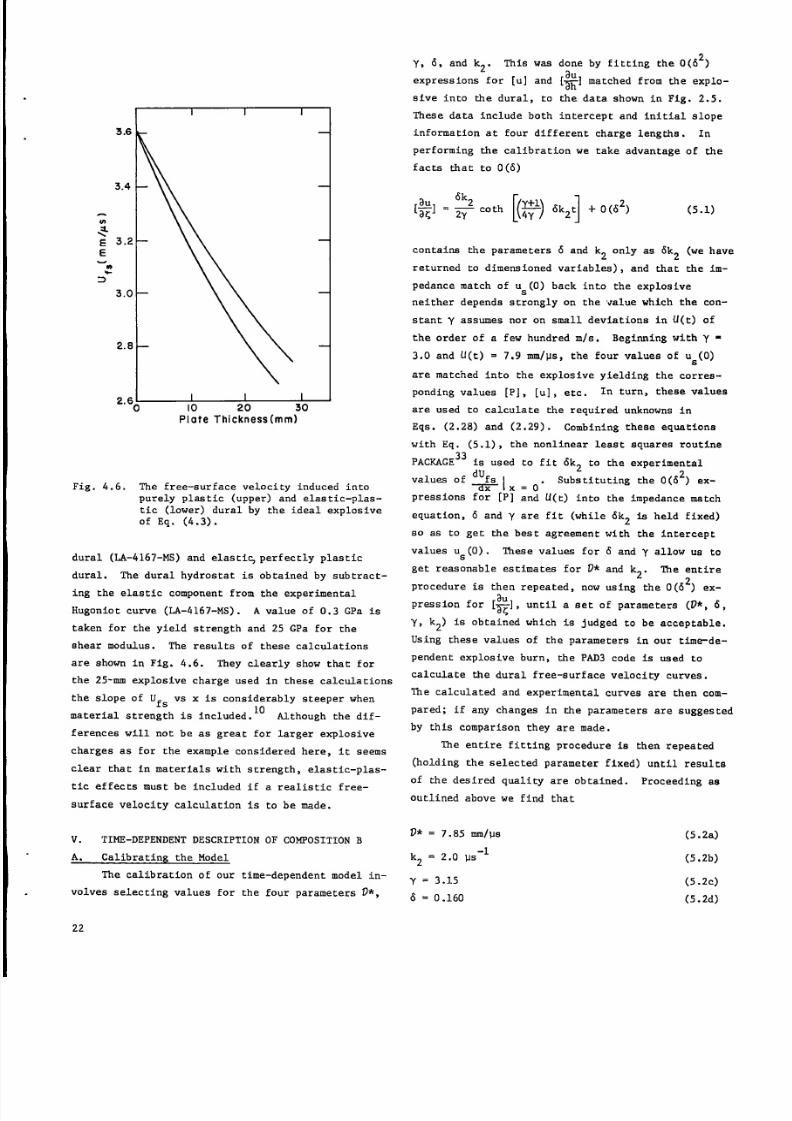
8/3/2019 J. B. Bdzil and W. C. Davis- Time-Dependent Detonations
http://slidepdf.com/reader/full/j-b-bdzil-and-w-c-davis-time-dependent-detonations 24/39
Y, 6, and ko. This was done by fitting the O(62)
,..o~Plate Thickness(mm)
Fig. 4.6. The free-surfacevelocity induced into
purely plastic (upper) and elastic-plas-
tic (lower) dural by the ideal explosive
of Eq, (4.3).
dural (LA-4167-MS)and elastiq perfectly plastic
dural. The dural hydrostat is obtained by subtract-
ing the elastic component from the experimental
Hugoniot curve (LA-4167-MS). A value of 0.3 GPa is
taken for the yield strength and 25 GPa for the
shear modulus. The results of these calculations
are shown in Fig. 4.6. They clearly show that for
the 25-mm explosive charge used in these calculations
the slope of Ufs vs x is considerably steeper when
10material strength is included. Although the dif-
ferences will not be as great for larger explosive
charges as for the example considered here, It seems
clear that in materials with strength, elastic-plas-
tic effects must be included if a realistic free-
surface velocity calculation is to be made.
v. TIME-DEPENDENT DESCRIPTION OF COMPOSITION B
A. Calibrating the Model
The calibration of our time-dependentmodel in-
volves selecting valuea for the four parameters V*,
L
expressions for [u] and [~1 matched from the explo-
sive into the dural, to the data shown in Fig. 2.5.
These data include both intercept and initial slope
information at four different charge lengths. In
performing the calibration we take advantage of the
facts that to 0(6)
‘* ]‘%cothH‘kfl0(’2) (5.1)
contains the parameters 6 and k only as 6k2 (we have2
returned to dimensioned variables), and that the im-
pedance match of us(0) back into the explosive
neither depends strongly on the value which the con-
stant y assumes nor on small deviations in U(t) of
the order of a few hundred m/s. Beginning with y =
3.0 and u(t) = 7.9 mm/I.Is,he four values of us(0)
are matched into the exploslve yielding the corres-
ponding values [P], [u], etc. In turn, these values
are used to calculate the required unknowns in
Eqs. (2.28) and (2,29). Combining these equations
with Eq. (5.1), the nonlinear least squares routine
PACKAGE33 is used to fit 6k, to the experimental
valueaof~lx=o. eubstituting the 0(62) ex-
pressions for [P] and U(t) into the impedance match
equation, 6 and y are fit (while 6k2 b held fixed)
so as to get the best agreement with the intercept
values us(0). These values for 6 and y allow us to
get reasonable estimates for D* and k2. The entire
procedure is then repeated, now using the 0(62) ex-
pression for [~], until a set of parameters (O*, 6,
Y, k2) is obtained which is judged to be acceptable.
Using these values of the parameters in our time-de-
pendent explosive burn, the PAD3 code is used to
calculate the dural free-surface velocity curves.
The calculated and experimental curves are then com-
pared; if any changes in the parameters are suggested
by this comparison they are made.
The entire fitting procedure is then repeated
(holding the selected parameter fixed) until results
of the desired quality are obtained. Proceeding as
outlined above we find that
k2 = 2.0 ~S-1
y= 3.15
6 =0.160
(5.2a)
(5.2b)
(5.2c)
(5.2d)
22

8/3/2019 J. B. Bdzil and W. C. Davis- Time-Dependent Detonations
http://slidepdf.com/reader/full/j-b-bdzil-and-w-c-davis-time-dependent-detonations 25/39
I.———.————————————
30
t,4 ~
50 I00 150 200
Charge Length (mm )
Fig, 5.1. The apparent “Chapman-Jouguetpressure”
[P] vs the charge length for Composition
B. The dashed line represents the infin-
ite medium asymptote, whileq
representsthe pressures corresponding to the data
on Fig. 2.5.
provide a reasonable fit to all of the dural free-
surface velocity data. The canstants of Eq. (5.2)
were obtained by using the turbulence model27 in
place of the reactive fluid model discussed in Sec.
III. However, since the differences between
these two models are not large for the calculations
that we will report, the results we obtain apply
equally well to either a slow chemical or slow
physical exothermic second rate process. Figure 5.1
shows the apparent “Chapmsn-Jouguetpressure” [P],
2calculatedwith the 0(6 ) shock jump condition, as
a function of the charge length (time). The agree-
ment between the fit function and the data (.) is
good.
B. Calculated Free-Surface Velocities
The real test is of course how well our model
reproduces the measured free-surface velocities,
Using the calibration given by Eq. (5.2) we obtain
the results shown in Fig. 5.2. The agreement be-
tween calculation and experiment is excellent. It
is clear that the Chapman-Jouguet theory, even after
calibration to the appropriate intercept, reproduces
the observed data only for charge lengths less than
or equal to 50 mm. Therefore, we find that unlike
the Chapman-Jouguet theory, our time-dependentmodel
is consistent with the data used in its calibration.
Considering the simplicity of our model (constant-
3.31
3.2
3.I
3.0
:*
: 2.9
In
3-
2.8
2.7
2.6
AA
I I,\
0 10 20 30
Plate Thickness (mm)
Fig. 5.2a. The free-surface velocity of dural platesinduced by a 50.8-mm charge of Composi-
tion B.
Elastic-plastic dural
Hydroatat; IA-4167-Ms
Yield Strength.23 0.3 GPaShear Modulus;23 25 GPa
Our model
Composition B of Eqs. (5.2)Chapman-Jouguet Model ——
P. = 1.73 Mg/m3, D = 7.85 mm/us,
y= 2.98The data A
y reaction zone, simple decay law, etc.) the agree-
ment is remarkably good.
A limited amount of data is also “availablefor
76 mm of Composition B (X/d = 1) driving perfectly
plastic 11OOF Al (LA-4167-MS). These data are in-
teresting because they were obtained using a pin
34~technique (Warnes . Since our model was calibrat–
ed to Deal?s measurements,this result suggests that
the values obtained with the pin technique are in
excellent agreement with Deal’s technique.
23

8/3/2019 J. B. Bdzil and W. C. Davis- Time-Dependent Detonations
http://slidepdf.com/reader/full/j-b-bdzil-and-w-c-davis-time-dependent-detonations 26/39
3.4’
3.3
3.2
3.I
:*
EE 3.o
m
3“
2.9
2.8
2.7
q
1 I 1 I 7
0 10 20 30 40 5(
Plate Thickness(mm)
Fig. 5,2b. The free-surface velocity of dural
plates induced by a 101-mm charge ofComposition B.
Dural Fig. 5.2a
Our model
Chapman-Jouguetmodel ——
PO = 1.73 Mdru3, v = 7.85 W/W,y= 2.76
The data .
In a series of experiments designed to measure
the reflected shock Hugoniot curve of the “reactive12
products” of Composition B, Deal measured the free-
surface velocities of a number of other inerts.
These experiments,which were performed using a 203-
mm-long charge of Composition B as a driver, provide
us with UfS(X) for inerte ranging from Plexiglas to
uranium, This spectrum of inerts gives us a range
of shock propertieswhich is sufficient to noticeably
expand and contract the image of the reaction zone
in the inert. For example, Deal’s uranium data probe
the flow well beyond the reaction zone. Figure 5.3
3.5
3.4
3.3
:X 32
E“
4!?
= 3.1
3.C
2.9
2.8
1I I I I 1’
10 20 30 40 5C
Plate Thickness (mm)
Fig. 5.2c. The free-surface velocity of dural
plates induced by a 203-mm charge ofComposition B.
Dural Fig. 5.2a
Our model
Chapman-Jouguetmodel ——
PC!= 1.73 Mg/m3, D = 7.85 mm/Ps,
Y = 2.64
The data ., I
compares our calculation with the experimental data.
Examination of this figure shows that the slope of
the experimental data changes at about 15 mm of plate
thickness. Comparing our calculated curve to this
data we find the agreement to be good. The break in
the calculated curve is a result of the change in
slope in going from the reaction zone to the Taylor
wave. Considering that the location of this break
is determined by the calibration of our model to the
dUfs(0)
Ufs(0) anddx
data for dural, theap,reementwith
this data ia indeed good. These data are also valuable
24

8/3/2019 J. B. Bdzil and W. C. Davis- Time-Dependent Detonations
http://slidepdf.com/reader/full/j-b-bdzil-and-w-c-davis-time-dependent-detonations 27/39
3
3.3 -
3.2-“
3.I -
3.0-
2.9–
I 1
0 10 20 30Plate Thickness (mm )
Fig. 5.2d. The free-surfacevelocity of 11OOF Al
plates induced by a 76-mm charge of
Composition B.
Perfectly plastic 11OOF AlHydrostat; LA-4167-MS
~n:92’data (average); 1
Some of the experiments had Ta foils
in the last 25 mm of explosive and
in the 11OOF Al. The preeence of
the foils does not appear to signif-
icantly effect the measured values.
because they clearly show thst side rarefactions
are not an important consideration in these experi-
ments. If, as has been argued, the steepness in the
slope of Ufs(x) for long (101 mm and 203 mm) charges
was a result of the influence of side rarefactions
on the flow, then the change in slope observed in
the uranium data would not have been seen. The data
on (60/40)brass also support our model. Figure 5.4
shows that our model is also consistentwith these
data, whereas the Chapman-Jouguetmodel is not.
The situation for magnesium is quite different.
Although the calculation shown in Fig. 5.5 is in
1.6
1.5
$
E
km 1.4
3“
l.?
1.2
\
~o 10 20 40
Plate Thickness (mm)
Fig. 5.3. The free-surfacevelocities induced intouranium by 203-mm of Composition B.
Elastic-plastic uranium
Hydrostat; Mie-Gr~neisen PO = 18.96
~p; ,Zco = 2.487 mnl/PS,S = 1.62,
Yield Strength;35
0.12 GPa
Sheer Mndulus;35 84.4 GPaChapman-Jouguetmodel ——
PO = 1.73 M.g/m3,D = 7.85 mm/vs,Y= 2.64
good agreement for plates lese than 12-mm thick, the
data and calculation are in considerable disagree–
ment for thicker plates. The data suggest that the
rarefaction in magnesium degrades the shock more
slowly than is the case in our calculation. Consid-
ering the agreement obtained for the other inerts
it seems unlikely that our calculation of the deto-
nation wave in the explosive is incorrect. Also,
since the time required to generate the reaction zone
profile is reasonably long, it is not likely that
25

8/3/2019 J. B. Bdzil and W. C. Davis- Time-Dependent Detonations
http://slidepdf.com/reader/full/j-b-bdzil-and-w-c-davis-time-dependent-detonations 28/39
2.I
2.0
EE
1.8
I.7
i,\
I
I I
I I I I I
10 20 30 40 ’50
Plate Thickness (mm )
4.6
4.5
4.4
; 4.3
,*
EE-m 4.2
3“
4.I
4.0
3.9
3.8
\
\
I \
I
Fig. 5.4. The free-surface velocities induced into Fig. 5.5.
(60/40) brass by 203-mm of Composition B.
Brass Hydrostat; LA-4167-MS
Yield Strength”36 0,08 GPaS~ear~od~W;~6 38.o GPa
Chapmsn-Jouguetmodel ——
PO = 1.73 Ms/m3, O = 7.85 mm/vs,y= 2.64
1 I I
10 20 30 40
forces acting at the interface (or their absence)
could produce a significant change in the wave shape
(speeding or quenching of the reactionby a shock or
rarefaction). Nevertheless, it seems worthwhile to
determine whether the impedance of the inert has any
unexplained effect on Ufs(x), since magnesium ia al-
most a perfect match to the explosive whereas the
other inerts reflect shocks into the explosive. One
way of proceeding is to compare the results of cal-
culation and experiment for an inert which reflects
a rarefaction into the explosive as opposed to a
Plate Thickness (mm)
The free-surface velocities induced into
magnesium by 203-mm of Composition B.
Magnesium Hydrostat: LA-4167-MS
Yield Strength.35 0.17 GPa
Shear Modulus;~5 16.5 GPa
Chapman-Jouguet model ——
P. = 1.73 Mg/m3, D = 7.85 mm/ps,y= 2,64
shock. Figure 5.6 providea such a,comparison using
Plexiglaa. Although the agreement leaves something
to be desired, it is clear that the shape of the
calculated curve and the data are in qualitative
agreement. Considering that all of our calculations
for the 203-mm long Composition B experiments are
high compared to the experimental results, it would
not be unreasonable to expect that a modified cali-
bration (for example, an increase in y) would yield
better calculations not only for Plexiglss but for
dural, brass, and uranium as well. All of this
26

8/3/2019 J. B. Bdzil and W. C. Davis- Time-Dependent Detonations
http://slidepdf.com/reader/full/j-b-bdzil-and-w-c-davis-time-dependent-detonations 29/39
5.7
5.5
5.3
<*
E 5.1
g
In
3“4.:
4.7
4.:
4.?
~ 1“------
\
I I
q
I
II
11
I
1
I 1 I t I
o 10 20 30 40 50
Plate Thickness (mm)
Fig, 5.6. The free-surface velocities induced into
Plexiglas by 203-mm of Composition B.
Plexiglaa Hydrostat; LA-4167-MS
Chapman-Jouguetmodel ——
PO = 1.73 Mg/m3, ~ = 7.85 mmlps,y = 2.64
The data was obtained by Desl using
Plexiglas of density 1.179 Mg/m3.
suggests that Plexiglas is consistent with our model
and that the form of the incoming detonation wsve is
not sensitive to whether a shock or rarefaction is
reflected into the explosive by the inert. There.
fore, we are led to the conclusion that either our
description of magnesium is not adequate or perhaps
the data are in error.
Reviewing the results of these calculationswe
find that, with the exceptionof magnesium, our time–
dependent model of Composition B is in agreement
with the free-surface velocity measurements for a
wide range of inerta and explosive lengths. This
model is the simplest possible one which is consis-
tent with both these measurements and the conserva-
tion laws. Since one expects that both the equations
of state and the rate law(s) are in reality more
complex than those used here, it is perhaps surpris-
ing that the agreement of calculation and experiment
is as good as it is. In the next subsections we
will show that this model is also consistent with a
number of other (less sensitive) experiments that
have been performed on Composition B.
c . The X–ray Experiments
The first set of experimentswe will consider
19 in whichwere those performed by Rivard et al.
the equation of state for Composition B products was
determined. In these experiments a sandwich of 12.5
~ Ta foils and 6.35-mm pieces of Composition B was
built up to a total height of 101 mm. Ten individu-
al shots were fired with radiographs being taken of
the initial foil positions and the foil positions
at times corresponding to detonation runs ranging
from 48 mm to 101 mm. Their analysis of these data
demonstrated that no statistically significant dif-
ferences could be resolved among the following
possibilities: (1) a Chapman-Jouguet detonation, (2)
a slightly time-dependent detonation, (3) a steady
slightly weak detonation. Therefore, they assumed a
Chapman-Jouguet detonation and showed that the fol-
lowing flow (Taylorwave) could be described by the
two-parameter function
Y
()+ a-lln ~
rv (5.3a)
a = 0.634 (5.3b)
b = 0.709 , (5.3C)
where y and Y are the final and initial foil posi-
tions scaled with respect to the instantaneous loca-
tion of the detonation front. Since the derivation
of Eq. (5.3) requires no assumptions concerning an
equation of state, they used it to check the ability
of the standard calibrated equations of state at re–
producing the radiographic data. Figure 5.7 shows
Ay5y-y vs Y for both our model and a number of
the standard equation-of-state calibrations. Thisplot clearly shows that the standard calibration
of the y-law (PCJ = 29.2 GPa) agrees with the data
over the widest range while our model agrees only
over a comparatively short range. Considering that
the free-surface velocity measurements used to cali-
brate our model provide information on only the lead-
ing portion of the wave profile, some improvement
27
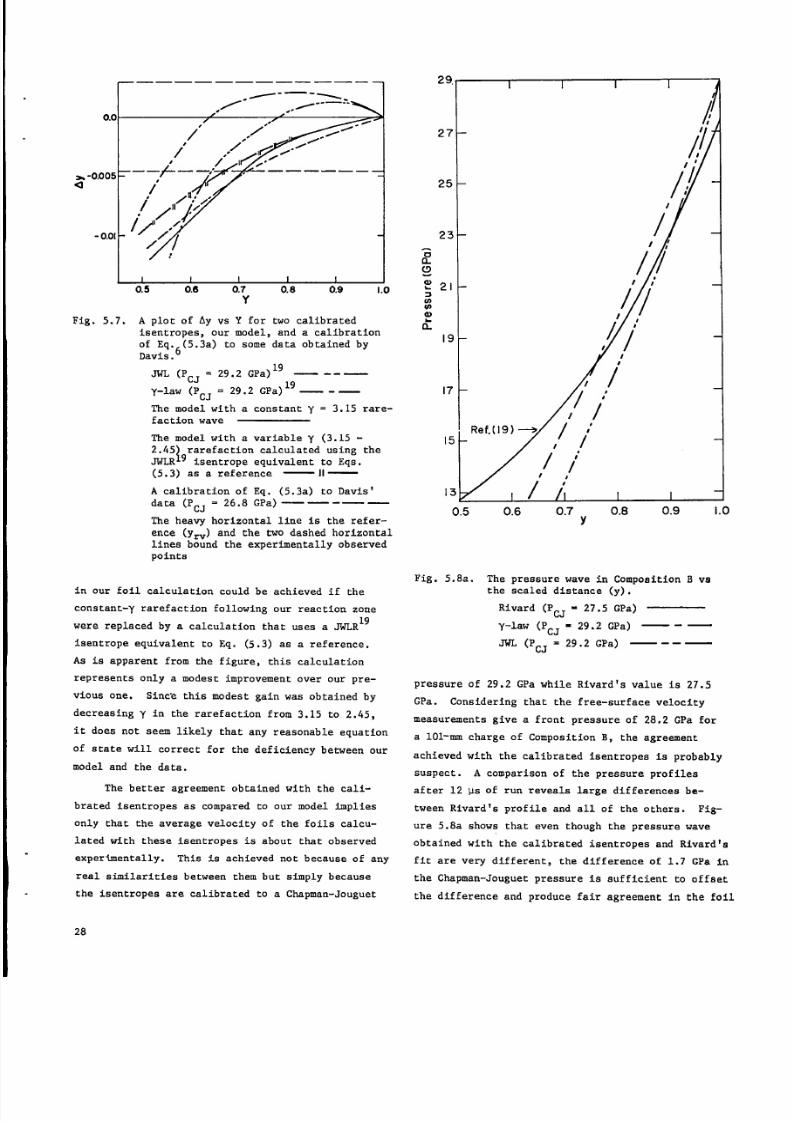
8/3/2019 J. B. Bdzil and W. C. Davis- Time-Dependent Detonations
http://slidepdf.com/reader/full/j-b-bdzil-and-w-c-davis-time-dependent-detonations 30/39
_—— ——— ——— ———.—.
,/” ~ ../-=’-0.0 /
/’——————
a -0.005 -
a ,/8
I I 1 I 1 I I0.5 0.6 0.7 0.8 0.9 1.0
Y
Fig. 5.7. A plot of Ay vs Y for two calibrated
isentropes, our model, and a calibration
of Eq.6(5.3a) to some data obtained by
Davis.
~ (l’cJ= 29.2 GPa)19 —--—
y-law (PCJ = 29.2 GPa)19—-—
The model with a constant y = 3.15 rare-
faction wave
The model with a variable y (3.15 -
2.45 rarefaction calculated using the{JWLR 9 isentrope equivalent to Eqs.
(5.3) as a reference —11—
A calibration of Eq. (5.3a) to Davis’
data (PCJ = 26.8 GPa)——-——
The heavy horizontal line is the refer-
ence (yn) and the two dashed horizontal
lines bound the experimentally observed
points
in our foil calculation could be achieved if the
constant-y rarefaction following our reaction zone
19were replaced by a calculation that ueea a JWLR
isentroPe equivalent to Eq. (5.3) as a reference.
As ia apparent from the figure, this calculation
represents only a modest improvement over our pre-
vious one. Since this modest gain was obtained by
decreasing y in the rarefaction from 3.15 to 2.45,
it doea not seem likely that any reasonable equation
of state will correct for the deficiency between our
model and the data.
The better agreement obtained with the cali-
brated iaentropes as compared to our model implies
only that the average velocity of the foils calcu-
lated with these iaentropes ia about that observed
experimentally. This is achieved not because of any
real similaritiesbetween them but simply because
the isentropes are calibrated to a Chapman-Jouguet
28
I
I
I
0.5 0.6 0.7 0.8 0.9Y
1.0
Fig. 5.8a. The pressure wave in Composition B vsthe scaled distance (y).
Rivard (PCJ = 27.5 GPa)
y-law (PCJ
= 29.2 GPa) —-—
~ (pCJ=29.2GPa) —-–—
pressure of 29.2 GPa while Rivard’s value is 27.5
GPa. Considering that the free-surface velocity
measurements give a front pressure of 28.2 GPa for
a 101-mm charge of Composition B, the agreement
achieved with the calibrated isentropes ia probably
suspect. A comparison of the preasure profiles
after 12 us of run reveals large differences be-
tween RivardVs profile and all of the others. Fig-
ure 5.8a shows that even though the pressure wave
obtained with the calibrated isentropes and Rivardls
fit
the
the
are very different, the difference of 1.7 GPa in
Chapman-Jouguet pressure is sufficient to offset
difference and produce fair agreement in the foil

8/3/2019 J. B. Bdzil and W. C. Davis- Time-Dependent Detonations
http://slidepdf.com/reader/full/j-b-bdzil-and-w-c-davis-time-dependent-detonations 31/39
?ef.( 19) ~
0.5
Fig. 5,8b,
positions.
0.6 0.7 0.8 0.9 1.0
Y
The pressure wave in CompositionB vs
the scaled distance after the detonation
has run for 12 pa.
The model ([P] = 28.3 GPa) —
The model with JWLR Taylor wave — —
Similarly, Fig. 5.8b showa that although
the agreement between our model and Rivard’s flow is
good close to the front, the steepness of our pro-
file (being similar to that of the JWL) brings about
the rather poor agreement at the low-pressure end.
The comparatively shallow gradient in their
fit nressure wave is a result of the rapid decrease.
()lnpofY=-~5 ‘rem 20” [PO(%): ‘ 4 a t‘ h efront tol.’’”l~o(%)511 alla’ l’Gpa. ‘Ven
though no physical constraints are violated in their
fit, the rapid change in Y which it predicts is in-
tuitively very unappealing. Considering that nearly
2% of the total mass of the explosive charges used
in these experiments consists of layers of Ta foils,
one has no assurance that the results obtained by
Rivard et al. are not influenced by this nontrival
perturbation.
Another relatively new x-ray technique37
prO-
vides us with an independent check of the applicabil-
ity of Rivard’s flow field. This method is especial-
ly attractive because foils are not used. Instead
a series of three parallel small rectangular paral-
lelepipeds 1.5-mm square by 101-mm long and lbmm
apart are machined into the explosive with their
major axis aligned parallel to the detonation front.
‘i’hearefactions generated when the detonation wave
encounters these voids are of sufficient strength
so that their location at any time can be resolved
on a radiograph. In themselves these radiograph
are of little value because the location of the two-
dimensional wave fronts generated by the voids la a
complicated function of the time-dependent flow field
which the wavea experience. Assuming that the sig-
nals generated by the voids obey the laws of geo-38
metrical acoustics, Engelke has shown that the
wave patterns can be calculated once the flow field
ia known. Of particular intereat to us is the com–39
parison of some calculations of Engelke on Composi-
tion B with the experimental radiographs. Figure 5.9
shows the calculation using the flow of Eq. (5.3)
and the experimental data. The calculation produces
wave fronts which are different from the data. Most
striking is the lag of the backward-going ray for the
largest acoustic ring. Although the location of the
wave is a complicated function of the gradients of
the flow variables as well as the variables them-
selves, the observed lag is in large measure due to
the rapidly decreasing value of the sound speed in
Rivard’s flow. Considering that the theoretical
analysis is probably an adequate description of
reality and that the perturbations that have been
introduced are considerably less than those intro-
duced by the foils, there is some reason to question
the results of the foil experiments. Replacing the
flow field by the 0(6) approximation to our time-
depandent detonation model,we find that the agree-
ment between
Fig. 5.10).
calculation and experiment is good (see
Therefore, these experiments support our
29

8/3/2019 J. B. Bdzil and W. C. Davis- Time-Dependent Detonations
http://slidepdf.com/reader/full/j-b-bdzil-and-w-c-davis-time-dependent-detonations 32/39
20
-iigo
=
-20
40 60 80 100
Fig. 5.9.
model and
u Sourcesx (mm)
- Computed
o Experimental
A calculation of the wavefronts in a 101-
mm-long charge of Composition B using
Eqs. (5.3) for the flow field. The error
bars represent the thickness of the rare-
faction wave observed on the radiograph.
imply that the flow determined by the foil
experiments may not
A third set of
our model. Using a
against a Plexiglas
properly describe Composition B.
x-ray experiments also supports
101-mm-long charge abutted
plate, Davis and Venable6 meas-
ured the location with time of the plane backward-
facing rarefaction generated at the material inter-
face. his experiment has certain advantages as
well as disadvantages. Its primary advantage is that
it does not introduce any perturbations on the orig-
inal detonation wave as the other x-ray techniques
do. The chief disadvantage is that the wave velocity
being measured (c-u) does not yield very much infor-
mation about the flow. The average value of (c-u)
obtained in the experiment as well as those calcu-
lated with our model and Eq. (5.3)
(C-u)exp = 4.00 ? 0.08 UUU/PS (5.4a)
‘c-u)Eq. (5.3) = 3“80 “us(5.4b)
20
Ego
=
-20
40 60 80 100
n Sources
- Computed
o Experimental
x (mm)
Fig. 5.10. A calculation of the wavefronts in a
101--long charge of Composition B
using the 0(6) approximation to our
time-dependentdetonation model with
D*= 7.85mm/LLEI, y= 3.15, 6 = 0.16,
k2 = 2 US-l. The flow in the Taylor
wave uses a constant y equation of state.
(C-u)model = 4.02 lUU1/~S
provide additional support
(5.4C)
for our model. Again we
find that the result obtained from the foil experi-
ment is significantly different from the experiment-
al value. The deficiency of 0.2 mmfps from the ex-
perimental value is in agreement with the results
of the calculation displayed in Fig. 5.9. This
serves to further corroborate our argument that the
flow field obtained from the analysis of the foil
experimentsmay in some way be perturbed by the foils.
Summarizing,we find that these experiments show
that the wave profiles obtained with the foil.experi-
ments do not agree with those obtained with the other
x-ray techniques. The region of reactive flow which
our model postulates is in agreement with all of the
direct measurements of the flow that have been made
using all three x-ray techniques, and a y = 3.15
30

8/3/2019 J. B. Bdzil and W. C. Davis- Time-Dependent Detonations
http://slidepdf.com/reader/full/j-b-bdzil-and-w-c-davis-time-dependent-detonations 33/39
TA8LE V-1
SHOCK TRANSIT
X=25mm
xl2x~
0.025 0.085 t 0,005b
TIMES IN DUKALa
x=51mm x=lo2mm
t (lls)/4 t(ps)/8
0.085b 0,084
0.088C 0.085
0.085d 0.085
0.050 0.171 0.170 0.1690.172 0.171
0.168 0.169
0,075 0.259 0.256 0.254
0.257 0.254
0.254 0.253
0.100 0.347 0.344 0.341
0.343 0.340
0.341 0.339
0.125 0.439 0.432 0.427
0.429 0.427
0.427 0,424
aTransit times for Composition B induced shocks in
dural. X is the length of explosive and x thethickness of the plate. The diameter of the explo-
sive is 101 mm. The deviation is our estimate of
the errors. All calculationswere done with elas-
tic-plastic dural (see Sec. IV-C).
bFinger and Kurrle
17
cOur model
dChapman-Jouguetmodel
X= 51 mmPCJ = 26.8 GPa (PO = 1.73 Mg/m3,
~= 7.85mm/us, y= 2.98)
x ~ ~“~.~ ~~p~ 2~”~ ~~6~po ‘ 1.73 Mg/m39
,
rarefaction wave is consistentwith all but the foil
experiments. Therefore, we conclude that our model
is also consistent with all of the x-ray data on
Composition B.
D. Shock Transit Times
The last set of experiments on Composition B
that we consider are the shock transit time data ob–
tained by Finger and Kurrle.17
Using the electrical
16probe technique devised by Hayes, they measured
the transit time of a Composition B induced shock
in both dural and PMMA. Their results are compared
to values obtained with our model and the Chapman-
Jouguet model in Tables V-1 and V–2. For the case
of dural the values are indistinguishable. The situ-
ation for Plexiglas is not as good. A comparison of
the experimentaldata and calculation reveals that
the experimental shock velocity is considerably
higher than the calculated values. Kurrle’s meas-
ured value of the shock velocity in PMMA is 6.955
mmlvs. If we assume the equation of state for
TABLE V-2
SHOCK TRANSIT TINES IN PleXiglaSs
X=25mm X=slmm x=lo2mm
xl2x t (Ps)/2 t (ps)14 t (Ps)/8
0.025 0.089 t 0.005b o.091b 0.092
0.090C 0.092
0.050 0.1860.186 0,188
0.191 0.193
0.075 0.285 0.285 0.286
0.289 0.294
0.100 0.384 0.384 0.385
0.394 0.396
0.125 0.484 0.483 0.489
0.497 0.503
aTransit times for Composition B induced shocks in
Plexiglas. The diameter of the explosive is 101 mm.
The calculations used Plexiglas (LA-4167-MS). The
experiments were done with 76.2-mm-diameter cast
acrylic plastic bar (clear), product code 2101,
Cadillac Plastic Co, The product specification
sheet gives a specific gravity range of 1.17 -1.20. Its equation of state is unknown.
bFinger and Kurrle
17
cOur model
Plexiglas given in (LA-4167-MS)then uS(O) ? 2.88
mm/!.Ishich in turn implies that ufs[o 2 5.95 mm/ps.
Comparing this with Deal’s measured value for a 203-
mm-long charge of Composition B, we find it to
be incompatiblewith his result (U < 5.66 mlfslo -
ps). Part of the problem may stem from the fact
that Kurrle used a commercial grade cast acrylic bar
and not Plexiglas Type 11 (see the caption accompany-
ing Table V–2). Considering the large discrepancies
between the measured and computed shock velocity and
the lack of a precise specification of their inert,
a valid comparison of the model with this experiment
cannot be made for PMMA.
E. Overview
The results that we have just presented demon-
strate that our model successfully describes a vari-
ety of different types of experiments that have been
performed on Composition B. Particularly significant
is its ability to reproduce the free-surface veloci-
ties of dural plates driven by both short (25 mm)
and long (203 mm) charges of explosive. In addition,
it also reproduces the free-surfacevelocities in-
duced by long charges into other inerts ranging from
uranium to Plexiglas. The modifications of the sim-
ple theory which lead to these improvementswere
shown to also be consistent with the results of some
31

8/3/2019 J. B. Bdzil and W. C. Davis- Time-Dependent Detonations
http://slidepdf.com/reader/full/j-b-bdzil-and-w-c-davis-time-dependent-detonations 34/39
of the more insensitive experiments (x-ray tech-
niques, shock transit times).
All of this was the result of our assumption that
the detonation ia driven by a very fast and exother-
mic reaction which is then followed by a relatively
slow,weakly energetic (exothermic)one. This leads
to the following picture of detonating Composition B.
Because it is slow, at early times (short charges)
the second reaction contributes little to the process
and consequently the flow at the end of the first
reaction zone (which is taken to be infinitesklly
thin) is sonic with the pressure there being 25.6
GPa, With the paasing of time the heat liberated by
the second reaction begins to make a positive contri-
bution to the detonation. The sonic plane falls be-
hind the end of the first reaction zone and the pres-
sure at the end of the first reaction increases. In
the limit of long times the reactive flow reaches a
steady state. The sonic plane is then located at the
end of the second reaction, where the pressure (the
Chapmsn-Jouguet pressure) is equal to 26.3 GPa while
at the end of the first reaction it is up to 30.4
GPa. Therefore, the Chapmsn-Jouguetpressure of
Composition B (as determined by our model) is approx-
imately 26 GPa. Also, since the detonation velocity
depends on the amount of energy released ahead of
the sonic plane, our model predicts that it will in-
crease 100 mfs in going from short to the very long-
est charges (70 mfs in going from 12.7 mm to 203 mm).
The Chapman-Jouguet pressure of Composition B
determined from our model is the lowest value that
has yet been reported. Perhaps it is fortuitous,
but this value is in excellent agreement with the
value ~ickett40obtained with his LJD calculation of
the equation of state of Composition B detonation
products
Fickett:
Model:
P. = 1.714 Mg/m3
‘CJ= 25.9 GPa
u- 7.987 lM1l/VS
y= 3.22
P. = 1.73 Mg/m3
‘CJ= 26.3 GPa
u= 7.95 mmlps
y= 3.15 .
(65%/35%) (5.5a)
(5.5b)
(5.5C)
(5.5d)
(60%/40%) (5.6a)
(5.6b)
(5.6c)
(5.6d)
Since Fickett’a theory is based on first principles
(equation of state derived from forces of intermolec-
ular interaction) the agreement of our model with
his theory is an encouraging result. Perhapa even
more interesting are the results of some experiments
that were recently performed by Davis.41
Using an
optical technique he was able to measure the detona-
tion velocity to within t 20 mfs in a planewave
Composition B assembly. He found that, aa predicted,
the detonation velocity increased (86 m/a) in going
from a 12.7-mm charge (7.869 mm/us) to a 203-mm
charge (7.955mmfps). Considering that the free-
aurface velocity data used in the calibration of
our model was somewhat noisy and that the calibration
is not sensitive to small changes in V* and Y, the
calculated‘valuesof 7.85 mm/ps and 7.92 mm/ps are
in excellent agreement with experiment.
These results are all very encouraging. They
imply that not only are we able to model the results
of a few experiments, but more importantly that real
progress has been made at underatanding the basic
underlying physical processes. Such an understand-
ing is particularly important if one is interested
in performing calculations on explosives in geome-
tries that are very different from those on which
calibrations are made. We have not attempted to de-
fine precisely the nature of the second rate process
in our model. However, now that a few properties
of the process are knowns Progress in this direc-
tion becomes a more realistic possibility.
VI. CALIBRATION OF OUR MODEL TO PBX-9404
The plastic-bonded solid explosive PBX-9404-03
also exhibits nonideal behavior. Craig5 ahowed
that the free-surface velocity curves which result
when PBX-9404 interacts with either dural or Plexi-
glas show both an increasing Ufslo
with run and an
anomalous slope (too steep) for long runs. Since
our time-dependentmodel successfully accounts for
similar behavior in Composition B, we recalibrated
it to Craig’s PBX-9404 data. We obtain
O* . 8.60 mm/ps
-1k2 = 2.0 U?,
y= 3.30
d = 0.258 .
(6.la)
(6.lb)
(6.lc)
(6.ld)
32

8/3/2019 J. B. Bdzil and W. C. Davis- Time-Dependent Detonations
http://slidepdf.com/reader/full/j-b-bdzil-and-w-c-davis-time-dependent-detonations 35/39
t4. I
h3.9 s
3.7 k
l ’ i \.5 K
<*
EE 3.
3.1!- x \
\ I\
2.51 I I I
-o 10 20 30 40 50
Plate Thickness (mm)
Fig. 6,1. The PBX-9404/dural free-surface veloci-
ties. Calculated curves 2,3,4,5 corres-
pond to explosive lengths of 101 mm,
50.8 mm, 25.4 mm, and 12.7 mm respective-
ly, Equations (6.1) describe the explo-
sive and the dural is
Hydrostat; LA-4167-MS
Yield Strength; 0.3 GPa
Shear Modulus; 25 GPa
‘ 5 dataraig s
N - 101 mm long PBX-9404
A - 50.8mm
* - 25.4 mm
X - 12.7mm
Comparing these constants to Eqs. (5.2) we find that
the most significant change is the Increase of 0.1
irl&. This corresponds to an increase in the energy
of the second reaction from 2.5% in Composition B to
6.2% in PBX-9404. In turn this results in a second
reaction zone which is more subsonic at late times,
and a larger increase in the detonation velocity
with run (12.7 mm - 8.61 mm/us, 101 mm - 8.74 mmj
)JS, w - 8.87 ~f~s).
Figures 6.1 and 6.2 compare the results of cal-
culation and experiment. The overall agreement is
good for both dural and Plexiglas. AS for Composi-
tion B, the shock transit times computed with ourmodel agree with the experimentalvalues of Finger
and Kurrl~7 (see Tables VI-1 and VI-2). Because
of the excellent agreement between these calculations
4.8 –
4.4 –
4.0–
Plate Thickness (mm)
Fig. 6.2. The PBX-9404/Plexi.glasfree-surface ve-locities. Calculated curves 2,4,5 cor-
respond to explosive lengths of 101 mm,
25.4 mm, and 12.7 mm respectively. Equa–
tions (6.1) describe the explosive. The
Plexiglas hydrostat is found in LA-4167-
Ms.
Craig’s5 data
~ - 101 mmlong PBX-9404
~ - 25.4mm
X - 12.7mm
33

8/3/2019 J. B. Bdzil and W. C. Davis- Time-Dependent Detonations
http://slidepdf.com/reader/full/j-b-bdzil-and-w-c-davis-time-dependent-detonations 36/39
Detonation wave _20 1 I I 1 f I 1 1 11 1 I
40 60 80 100
0 sources x (mm)
- Computed
0 Exoerlmentol
Fig. 6.3. A calculation of the wavefronts in a 101-
mm long charge of PBX-9404 using the 0(6)approximation to our time-dependentdet-
-{nation model with O* = 8.60 mm us,
Y= 3.30, 6 = 0.258, k2 = 2 ps . Theflow in the Taylor wave uses a constant
y equation of state.
and experiment one might be tempted to conclude that
our model also provides an accurate description of
PBX-9404. The following results show that our ex-
pectations have exceeded our grasp. Calculations
made with our 0(6) model for PBX-9404 are in strik-
ing disagreement
(see Fig. 6.3).
SHOCK
X= 12.7
xl2x t (us)
with the experimental radiographs
The experimentaldata show no ring
TABLE VI-1
TRANSIT TIMES IN DURALa
mm X=25mm X=51mmX =102mm
~ —t_@lf4 t (us)/8
0.025 0.077 2 0.007b o.077b 0.079 0,078
0.081 0.079C 0.080 0.082
0.050 0.159 0,166 0.161 0.162
0.160 0,159 0.161 0.161
0.075 0.241 0.249 0.245 0.244
0.242 0.242 0.242 0,242
0,100 0.325 0.339 0.329 0.328
0.323 0.324 0.324 0.323
0.125 0.410 0.426 0.415 0.412
0.407 0.408 0.407 0.405
aTransit times for PBX-9404 induced shocks in dural.
X is the length of explosive and x the thickness of
the plate. The diameter of the explosive is 101 mm.
bFinger and Kurrle
17
cOur model
TABLE VI-2
SHOCK TRANSIT TIMES IN Plexiglass
X=12.7mm X=25mmX =51mm X=102mm
xl2x t (us) t.(us)/2 t (US)14 t (us)18
0.025 0.085 o.088b 0.089 0.089
0.087 0.086? 0.090
0.050 0.179C 0.180C 0.179C
0.075 0.274 0.277 0.273
0.100 0.371 0.372 0.366
0.125 0.469 0.470 0.464
aTransit times for PBX-9404 induced shocks in Plexi-
glas. X is the length of explosive and x the thick-
ness of the plate, The diameter of the explosiveis 101 mm.
bFinger and Kurrle
17
COur model
opening (indicating that we have a sonic plane very
near the front), whereas the calculations show a
substantial opening. Also, recent measurements of
the detonation velocity in PBX-940441
show that it
does not increase with run, as predicted, but is
constant at 8.735 ? 0.02 mm/pus. Therefore, although
our model reproduces the free-surface velocity and
shock transit times for PBX-9404, its reaction zone
structure is not consistentwith all of the existing
data.
This negative result is of considerable value.
First, it serves to warn the model user that any
model which does not provide an accurate picture of
the physics of the detonation must be considered
nothing more than an empirical fit to a restricted
set of data. As such, ita use should be limited to
interpolation. Second, our modelfs inability to
produce simultaneouslya pressure buildup with run
and a constant detonation velocity suggests certain
modifications. The constancy of the detonation ve-
locity imp}ies that the flow must be sonic at the
end of the first reaction zone. The ~bserved build-
up suggests that some relatively slow exothermic
process must occur behind this sonic plane. A model
capable of yielding the desired behavior was dis-
cussed in Sec. 111.A. This is achieved by follow-
ing the first chemical reaction by two parallel re-
actions that satisfy the condition
q2r2 + q3r3 -0
at the end of the first reaction and
(6.2)
34

8/3/2019 J. B. Bdzil and W. C. Davis- Time-Dependent Detonations
http://slidepdf.com/reader/full/j-b-bdzil-and-w-c-davis-time-dependent-detonations 37/39
—
q2+q3’o . (6.3)
The two-wave structure that is produced by this
reaction scheme is currently being studied.
VII. SUMMARY
It has been
surface velocity
known for some time that the free-
data on planewave Composition B do
not scale, Experiments show that the intercepts
‘fsIoincreasewith the length of the charge and
that the slopesdufs for long charges are too steep
Fcompared to those obtained with the Chapman-Jouguet
theory. Our review of these data showed that side
rarefactions must be ruled out as the cause for the
observed discrepancies between the data and calcu-
lation and that the observed differences are a re-
sult of the failure of the Chapman-Jouguet theory.
By assuming that Composition B obeys the following
one-dimensional time-dependentmodel we were able
to bring the calculated and experimentalUfS(X)
curves into agreement.
(1)
(2)
(3)
(4)
The detonation in Composition B is controlledby two rate processes.
The first process is irreversible, very fast
(instantaneous)and releasea 97.5Z of theavailable energy.
The second step is slow (k2 = 2.O PS-l) and
yields the remaining 2.5% of the energy.
The regicn of reactive flow is followed by a
y-law (y = 3.15) Taylor wave.In ad~ition to reproducing the Ufs(x) data, this mod-
el was also shown to be consistentwith all of the
other data on this explosive. Implicit in the as-
sumptions of our model is that the detonation veloc-
ity increases with run (70 mls in going from 12.7
mm to 203 mm of explosive). Recent experiments con-
firm this prediction. In light of all these results
we conclude that our time-dependentmodel provides a
reasonable physical description of Composition B.
Using this model to interpret the Ufs(x) data we
find that the Chapman-Jouguetpressure for Composi-
tion B ‘s ‘CJ= 26.3GPa (Po = 1.73Mg/m3, U = 7.95
mmlps).
This model was alao calibrated to PBX-9404. By
releasing 6.2% of the total energy in the slow ki-
netic step we were able to reproduce all of the free-
surface velocity data for this explosive. However,
since the predicted increase in the detonation ve-
locity was not observed experimentally, this model
waa judged to be unacceptable for PBX-9404. There
are indications that this model will be useful for
TATB and nitroguanidine. Radiographs of these Ex-
plosives show that the flow behind the detonation
front is quite subsonic. This in turn suggeacs the
presence of a long second reaction zone similar to
that used in our model, Unfortunately the limited
data which are available for these explosives do
not permit us to test our theory.
This study probably raises more questions than
it answera. One is presented with the problem of
identifying the nature of the second rate process
in Composition B. Calculations on both the probable
rate of carbon coagulation and turbulence dissipa-
tion should be carried out to determine if either
of these processes are likely candidates. Of even
more intereat is the result that the slow processes
which are responsible for the detonation wave struc-
ture in Composition B and PBX-9404 are apparently
quite different. Calculations are currently under
way to determtne if the two–wave structure alluded
t o in Sec. VI might not account for the observed
behavior in PBX-9404.
ACKNOWLEDGEMENTS
The authors would like to thank B. G. Craig,
R. P. Engelke, W. Fickett, J. D. Jacobson, and
C. L. Mader for their valuable suggestions concern-
ing this work.
REFERENCES
1.
2.
3.
4.
5.
6.
7.
8.
D. R. White, Phys. Fluids ~, 465 (1961).
W. C. Davis, B. G, Craig, and J. B. Rsmsay, phys.
Fluids ~, 2169 (1965).
W. W. Wood and W. Fickett, Phys. Fluids 5, 648
(1963).
R. W. Goranson, Los AIemos Scientific Laboratory,
internal report, 194S.
B. G. Craig, Los Alamos Scientific Laboratory,
unpublished data, 1965.
W. C. Davis and Douglas Venable, “Pressure
Measurements for Composition B-3,” Fifth SPPOS- .
iumon Detonation, 1970. ACR-184. U. S. Govtt
Printing Office.
W. C. Davis and W. C. Rivard, Los Alamos Scien-
tific Laboratory, unpublished data, 1970.
W. E, Deal, J. Chem. Phys. ~, 796 (1957).
35

8/3/2019 J. B. Bdzil and W. C. Davis- Time-Dependent Detonations
http://slidepdf.com/reader/full/j-b-bdzil-and-w-c-davis-time-dependent-detonations 38/39
9.
10.
11.
12.
13.
14.
15.
16.
17.
18.
19.
20.
21.
22.
23.
24.
25.
26.
C. L. Mader and B. G. Craig, Los Alamos Report,
LA-5865 (1975].
C. L. Mader, Los Alamos Scientific Laboratory,
internal report, 1968.
R. E. Duff and E. Houston, J. Chem. Phys. ~,
1268 (1955).
W. E. Deal, Phys. Fluids ~, 523 (1958).
W. E. Deal, Private Communication.
W. C. Davis, Los Alamos Scientific Laboratory,
unpublished data, 1970.
R. H. Warnes, Los Alamos Scientific Laboratory,
unpublished data.
B. Hayes, J. Appl. Phys. 3&, 507 (1967).
M. Finger and J. Kurrle, Private Communication,
J. E. Kurrle, et al., Progress Report for
Lawrence Radiation Laboratory,SANL No. 813-002
(1970).
D. Venable and T. J. Boyd, Jr., Fourth Sympos-ium on Detonation, 19650 ACR-126. U. S.-Gov’t
Printing Office.
W. C. Rivard, D. Venable, W. Fickett, and W. C.Davis, !!FlashX-ray Observation of Marked Mass
Points in Explosive Products,” Fifth Symposium
on Detonations 1970. ACR-184. U. S. Govtt
Printing Office.
B. Hayes and J. N. Fritz, “Measurement of Mass
Motion in Detonation Products by an Axially-
Symmetric Electromagnetic Technique,” Fifth
Symposium on Detonation, 1970. ACR-184. US
Gov’t Printing Office.
W. C. Davis and A. Vigil, Los Alamos Scientific
Laboratory,unpublished data.
W. C. Davis, Los Alamos Scientific Laboratory,
unpublished data.
M. L. Wilkins, Lawrence Livermore Laboratory
Report UCRL-7322 (1963).
C. Truesdell and R. A. Toupin, The Encyclopedia
of Physics, Vol. 111/1, p. 491, S. Fltigge,Ed.
Springer Verlag, Berlin (1960).
R. M. Bowen, Arch. Rat. Mech. Anal. ~, 169
(1969).
Jo J. Erpenbeck, !!Theoryof Detonation Stabil-
ity,llTwelfth Symposium on Combustion, TheCombustion Institute, Pittsburgh,July 1968.
27.
28.
29.
30.
31.
32.
33.
34.
35.
36.
37.
38.
39.
40.
41.
J. Bdzil and W. C. Davis, Los Alamos Scientific
Laboratory, unpublished data.
W. W. Wood and F. R. Parker, Phys. Fluids ~,
230 (1958).
Wildon Fickett and Jack D. Jacobson, PAD3 1-D
Hydro Code, Private Communication.
Wildon Fickett and Jack Jacobson, Private Com-
munication.
R. Kinslow, Ed., High Velocity Impact Phenomena,
Academic Press, New York, 1970, p. 530-68.
William Prager and P. G. Hedge, Theory of Per-
fectly Plastic Solids, Wiley, New York, 1951.
R. Moore and R. K. Zeigler ‘!PACKAGE,!!oS
Alamos Report IA-2367 (19S9).
R. C. Warnes, Los Alamos Scientific Laboratory,
unpublished data.
David J. Steinberg and Michael W. Guinan,!lConstitutiveRelations for the Kospall Code,”
Lawrence Livermore Laboratory Report, UCID-16226(1973).
Estimates.
W. C. Davis, Los Alamos Scientific Laboratory,
unpublished data.
R. P. Engelke, Los Alamos Scientific Laboratory,
unpublished data.
J. B. Bdzil and Ray Engelke, Los Alamos
Scientific Laboratory, unpublished data.
Wildon Fickett, Los Alamos Report, LA-2712,
(1962).
W. C. Davis, Los Alamos Scientific Laboratory,
unpublished data.
I t US00VEI !NMENT PRINTINGOFFICE 107G877 .18vM
36
8/3/2019 J. B. Bdzil and W. C. Davis- Time-Dependent Detonations
http://slidepdf.com/reader/full/j-b-bdzil-and-w-c-davis-time-dependent-detonations 39/39