Embed Size (px)
Citation preview
University of ConnecticutOpenCommons@UConn
Honors Scholar Theses Honors Scholar Program
Spring 5-10-2009
Fort Richardson Ordnance Detonations and theHarbor Porpoise: A Case Study in MarineMammal BioacousticsHeather HeenehanUniversity of Connecticut - Avery Point, [email protected]
Follow this and additional works at: https://opencommons.uconn.edu/srhonors_theses
Part of the Aquaculture and Fisheries Commons, Environmental Indicators and ImpactAssessment Commons, and the Other Animal Sciences Commons
Recommended CitationHeenehan, Heather, "Fort Richardson Ordnance Detonations and the Harbor Porpoise: A Case Study in Marine MammalBioacoustics" (2009). Honors Scholar Theses. 108.https://opencommons.uconn.edu/srhonors_theses/108
Fort Richardson Ordnance Detonations and the Harbor Porpoise: A Case Study in Marine Mammal Bioacoustics
Heather Heenehan
University of Connecticut
1
I. Introduction: Project Goal
II. Literature Review
a. Focus on the Harbor Porpoise
b. Cook Inlet Harbor Porpoise
c. Marine Mammal Hearing
d. Marine Mammal Sound Production
e. Sound
f. Effects of Sound on Marine Mammals
g. Other Threats to the Harbor Porpoise
h. Federal Noise Regulations Protecting Marine
Mammals
i. Cook Inlet
j. Fort Richardson and the Eagle River Flats
k. Howitzer Cannons
III. Methods
a. Methods for Data Collection
b. Methods for Current Investigation
IV. Results
V. Discussion and Conclusion
VI. Acknowledgments
VII. References
2
Outline of Figures and Tables
Figure 1: Artist’s rendering of the harbor porpoise as displayed by
the American Cetacean Society
Table 1: Number of individuals of different groups of marine
mammals in the Gulf of Alaska as presented by Laidre et
al.
Figure 2: Audiograms for marine mammals as presented by Bradley
et al. 2008
Figure 3: Audiogram for baleen whales (Mysticetes), toothed whales
(Odontocetes)
Figure 4: Sounds in the environment of a harbor porpoise as
depicted by Bradley et al. 2008
Figure 5: Concentric Circle model as presented by Bradley et al.
2008
Figure 6: Possible responses to noise as presented by Jenkins (n.d.)
Figure 7: Facts about the Harbor Porpoise in the Northwest
Training Range Complex Area as presented in Table 3.9-
1.
Figure 8: Facts about the Harbor Porpoise and their hearing and
sound production as presented in Table 3.9-2.
Figure 9: Map of the Area of Alaska in the study
Figure 10: The Cook Inlet and the Eagle River Flats of Alaska
Table 2a: The calculated intensities at different distances from the
detonation site for Broadband Frequency.
Table 2b: The calculated intensities at different distances from the
detonation site for 100 Hz.
Table 2c: The calculated intensities at different distances from the
detonation site for 1,000 Hz
Figure 11: Broadband Frequency Intensity across the Knik Arm
Figure 12: 100 Hz Frequency Intensity across the Knik Arm
Figure 13: 1000 Hz Frequency Intensity across the Knik Arm
Figure 14: Intensity of the detonation as compared to the Harbor
Porpoise Hearing Threshold Curve. Modified from
Bradley et al. (2008)
3
Introduction
Hearing is extremely important for cetaceans because it is their “principal sense”
(Weilgart, 2007) thus the harbor porpoise and other marine animals are highly dependent
on sound for survival. This is why we should care about the impact of noise on animals
like the harbor porpoise. Since sound travels so well in water, an explosion, sonar, boat
noise, etc. can affect a very large area and thus many different species of marine
mammals. Although military actions such as low frequency sonar have made recent
news, noise has been affecting cetaceans, especially beaked whales, since at least 1991
(Weilgart, 2007).
This study is an investigation of the possible impacts of artillery detonated on
land on harbor porpoise hearing and covers some of the history of Fort Richardson, the
legal and historical aspects and history of this type of concern, the science and physics of
sound, marine mammal hearing and general biology of the harbor porpoise. Data were
collected at the Fort Richardson Army base during June of 2007 by researchers from the
University of Connecticut and the University of Rhode Island and will be used to
determine the possible impacts that these detonations could have on the harbor porpoise.
By approaching the issue from many different points of view and taking the
relevant research into consideration, a reasonable decision can be made about future
detonations. The data were collected to determine if the activity on the base will have a
significant impact on the marine mammals in the area. It is difficult to determine what
the exact response will be as every animal is different.
Knowledge of previous research conducted on the harbor porpoise, on how sound
carries in water and how the animals respond to sound can result in a better
4
understanding of the possible effects of these types of noise issues on marine mammals.
This type of research is important because marine mammals are facing issues with sound
(noise) in many areas of the world, not just near Fort Richardson. These types of
concerns involving marine mammals, noise and the possible effects of the noise on the
animals have been increasing since the early 1990’s (Richardson et al., 1995). It is
important to understand the types of noise that these animals are subjected to and
determine if they are negatively impacting marine mammals.
The Knik Arm Geophysical Survey, conducted during the month of June of 2007,
had a goal of determining whether sound intensities created by simulated artillery
detonations would impact marine life in the area. One thing to note about these
detonations is that they were on land while the measurements were taken underwater. The
National Marine Fisheries Service (NMFS) and National Oceanic Atmospheric
Administration (NOAA) have established “Take” regulations to help protect marine
mammals. In terms of broadband frequency, 180 decibels re 1 µpa is the Level A take.
This is the level that sound should not exceed because sound at this level is believed to
cause temporary threshold shifts (NOAA, 2004). The Level B take is at 160 decibels re 1
µpa and sound at this intensity is believed to change marine mammal behavior (NOAA,
2004). These regulations are the reason that the University of Connecticut and the
University of Rhode Island scientists were consulted to gather data during the summer of
2007. The scientists were consulted to determine if the sound would in fact be in
violation of this law. This information would then be used to determine specific impacts
on marine animals such as Beluga Whales, Harbor Porpoises, Salmon, and Harbor Seals.
5
According to Keith Jenkins (n.d.), federal agencies must abide by the Endangered
Species Act and the Marine Mammal Protection Act. The Endangered Species Act
(ESA) protects government listed species from harm and harassment. This legislation
states that it protects marine mammals from being harassed, hunted, captured, or killed
(Jenkins n.d.).
Therefore, the purpose of this paper is to determine if the sound intensity
produced by these detonations might impact Harbor Porpoise (Phocoena phocoena)
hearing. Data collected was analyzed to determine if the sound would be in violation of
the NOAA NMFS take regulations. I present the data along with a review of the literature
and other information on the harbor porpoise to apply the data to Phocoena phocoena to
determine what the impacts of artillery detonations might be on this species of marine
mammal.
6
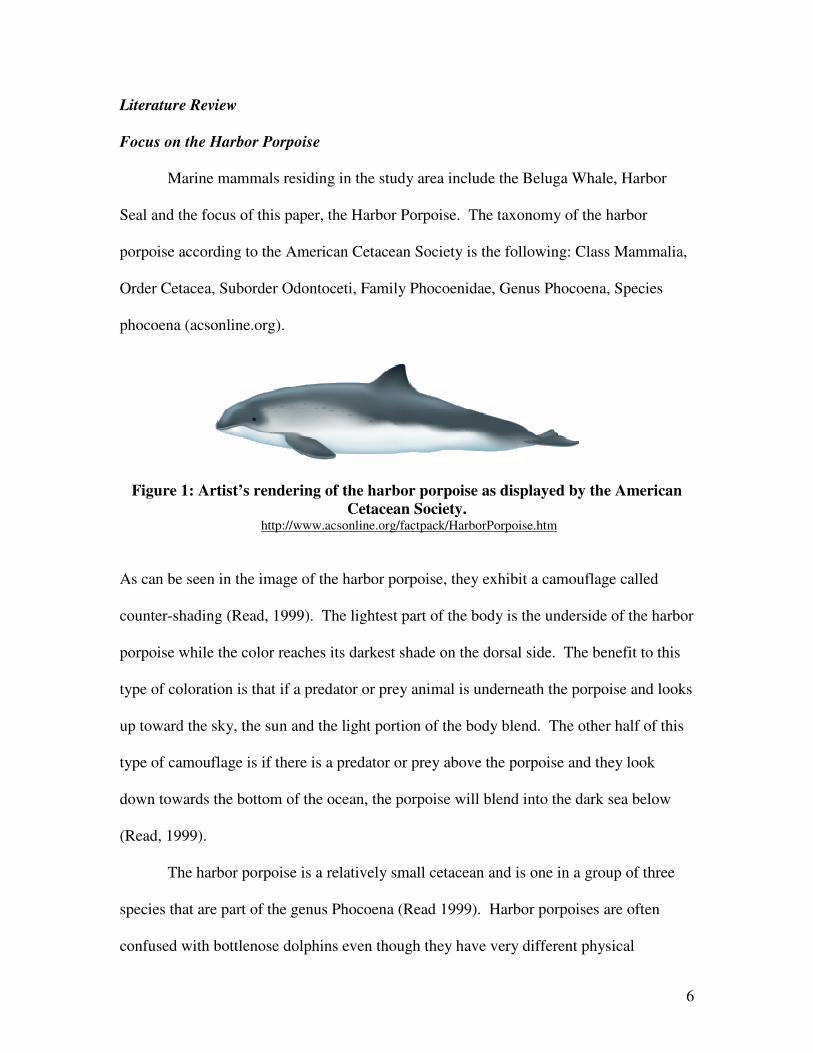
Literature Review
Focus on the Harbor Porpoise
Marine mammals residing in the study area include the Beluga Whale, Harbor
Seal and the focus of this paper, the Harbor Porpoise. The taxonomy of the harbor
porpoise according to the American Cetacean Society is the following: Class Mammalia,
Order Cetacea, Suborder Odontoceti, Family Phocoenidae, Genus Phocoena, Species
phocoena (acsonline.org).
Figure 1: Artist’s rendering of the harbor porpoise as displayed by the American
Cetacean Society. http://www.acsonline.org/factpack/HarborPorpoise.htm
As can be seen in the image of the harbor porpoise, they exhibit a camouflage called
counter-shading (Read, 1999). The lightest part of the body is the underside of the harbor
porpoise while the color reaches its darkest shade on the dorsal side. The benefit to this
type of coloration is that if a predator or prey animal is underneath the porpoise and looks
up toward the sky, the sun and the light portion of the body blend. The other half of this
type of camouflage is if there is a predator or prey above the porpoise and they look
down towards the bottom of the ocean, the porpoise will blend into the dark sea below
(Read, 1999).
The harbor porpoise is a relatively small cetacean and is one in a group of three
species that are part of the genus Phocoena (Read 1999). Harbor porpoises are often
confused with bottlenose dolphins even though they have very different physical
7
characteristics and personality. Generally they are shy and do not approach a boat, while
I have had experience with bottlenose dolphins surfing in the wake of both small and
large boats. The main physical differences are the rounded off snout and triangle shaped
dorsal fin (acsonline.org).
According to the American Cetacean Society (2008) the maximum length is 1.9
meters (6 feet) and maximum weight is 90 kg (200 lbs). Females are larger than males.
The diet of the harbor porpoise can consist of herring, cod, whiting, squid, pollock and
sardines. According to Westgate et al. (1998) and Andrew J. Read in the Handbook of
Marine Mammals (1999), harbor porpoise eat mostly herring. The weight of the food
consumed by the harbor porpoise every day is about ten percent of its body weight
(Westgate et al., 1998).
Harbor porpoises reach sexual maturity at different ages depending on the sex of the
animal, with females maturing earlier than males by a few years (Read, 1999). At birth
the harbor porpoise is an average of 80 cm long and 8 kg. Gestation is eleven months
and mothers can have calves every two years, partially due to the fact that harbor
porpoise calves nurse for eight months (acsonline.org).
The habitat that they prefer is shallow coast and waters less than 100 meters deep
(Department of Commerce, 2008). They utilize the shallow shelf coast waters especially
during the summer (Read 1999) and also inhabit bays and rivers. The harbor porpoise
can be spotted alone, in a pair, or in a small or a large group. Some have claimed that the
porpoises use larger groups when they’re feeding while other scientists claim that these
animals do not feed cooperatively (Read 1999). Little is known about the social behavior
of these animals. In the summer, harbor porpoises are seen in small groups but scientists
8
are unsure if these groups are year-round. There is also doubt about the relationship
between mothers and their calves (Read 1999).
Like other cetaceans they have similar skull shape to facilitate echolocation and
communication (Read 1999). They also possess an insulating layer called blubber. This
layer is similar to the one present in other colder water cetaceans.
Cook Inlet Harbor Porpoise
Due to the fact that marine mammals spend much of their time under water, it is
difficult to determine the magnitude of their population. The studies that have been done
attempted to determine the best estimate possible for a population. The exact population
of harbor porpoises isn’t known for the Cook Inlet; however, estimates have been made.
The Department of Commerce (2008) recognizes three different stocks or groups
of harbor porpoise in Alaska. These include the following: Southeast Alaska, Gulf of
Alaska, and the Bering Sea. The minimum population estimated by the Department of
Commerce (2008) in the Alaska Marine Mammal Stock Assessments is 34,740 animals.
Another study observed a group size of 1.33 animals with 0.54 groups every 100
kilometers squared (NASA, 2009). Speckmann et al. (2000) observed a sighting rate of 1
to 1.06 animals per kilometer.
The Gulf of Alaska was surveyed between 1975 and 1977 (Laidre et al., 2000)
and one thousand cetaceans were seen during the survey with 31 of these being belugas
in the Cook Inlet. This study and others mentioned by Laidre et al. (2000) confirm that
there is a large cetacean presence in the area excluding the beluga whale. For example
one study spotted 3,000 cetaceans in the Prince William Sound and the Gulf of Alaska
9
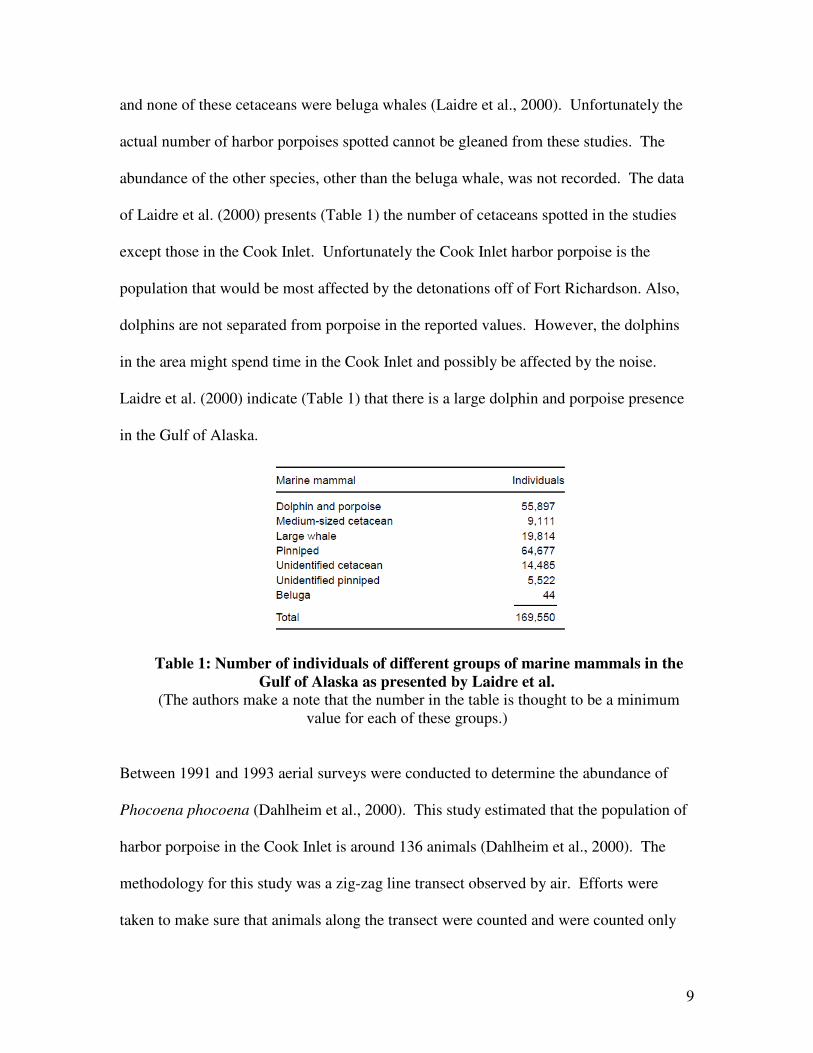
and none of these cetaceans were beluga whales (Laidre et al., 2000). Unfortunately the
actual number of harbor porpoises spotted cannot be gleaned from these studies. The
abundance of the other species, other than the beluga whale, was not recorded. The data
of Laidre et al. (2000) presents (Table 1) the number of cetaceans spotted in the studies
except those in the Cook Inlet. Unfortunately the Cook Inlet harbor porpoise is the
population that would be most affected by the detonations off of Fort Richardson. Also,
dolphins are not separated from porpoise in the reported values. However, the dolphins
in the area might spend time in the Cook Inlet and possibly be affected by the noise.
Laidre et al. (2000) indicate (Table 1) that there is a large dolphin and porpoise presence
in the Gulf of Alaska.
Table 1: Number of individuals of different groups of marine mammals in the
Gulf of Alaska as presented by Laidre et al.
(The authors make a note that the number in the table is thought to be a minimum
value for each of these groups.)
Between 1991 and 1993 aerial surveys were conducted to determine the abundance of
Phocoena phocoena (Dahlheim et al., 2000). This study estimated that the population of
harbor porpoise in the Cook Inlet is around 136 animals (Dahlheim et al., 2000). The
methodology for this study was a zig-zag line transect observed by air. Efforts were
taken to make sure that animals along the transect were counted and were counted only
10
once. Three different models were used to estimate harbor porpoise numbers (Dahlheim
et al., 2000). The Cook Inlet surveys covered 1,873 kilometers and predicted that the
density was 136 with a 95 percent confidence interval of 11 to 1,645 animals.
The Associated Press stated in the article, “Setnetters tote beached baby porpoise
to camp, render care” that harbor porpoises are “Common in upper Cook Inlet,” and are
estimated to be a population of around 31,000 animals in the western part of the Gulf of
Alaska. The State of Alaska (1999) stated that there were 422 harbor porpoise in the
Cook Inlet.
Marine Mammal Hearing
Marine mammal hearing is similar to human hearing but the two have their
differences. For example, the harbor porpoise has a much greater range in terms of
frequencies that it can hear. The hearing range of Phocoena phocoena is roughly 1,000
Hz to 100,000 Hz (Bradley et al, 2008, Figure 8). In comparison, human hearing range is
20 Hz to 20,000 Hz (Durrant and Lovrinic, 1995). Sound is extremely important for
marine mammal survival. Marine mammals use different sounds for the following:
determine what is in their environment, to communicate with each other, to find their
food, for protection, mating and reproduction, and maintaining complicated social
systems and activities (Dosits.org). Marine mammals are extremely reliant on their sense
of hearing and sound production. This is the main reason we should worry about marine
mammals and noise.
Something common to human and marine mammal hearing is that the animal has
a greater chance of hearing a sound if the duration of the sound is longer. This fact is
11
important when looking at the sounds produced by the detonations to determine its effect
on the harbor porpoise.
Richardson et al. (1995) state that marine mammal hearing is dependent on six
different factors. First is the absolute threshold, which is the hearing of the animal with
very little ambient noise present. Second is the individual variation. Third is the
motivation, which essentially means that a marine mammal, like humans, can have
selective hearing. Fourth is masking which again is distinguishing sounds among ambient
noise. Fifth is localization, or determining where the sound comes from. Finally sixth is
discriminating between sounds and their frequency and intensity (Richardson et al.,
1995).
An audiogram (Figure 8 and Figure 9) is a visual display of the hearing curve of a
marine mammal. The hearing threshold curve marked on the audiogram discriminates
between sounds that can and cannot be heard. A sound with frequency and intensity such
that it falls above the curve, will be heard and a sound that falls below the curve is not
heard. The audiogram makes it easier to determine what sounds are loud enough for a
harbor porpoise to hear (Bradley et al., 2008).
12
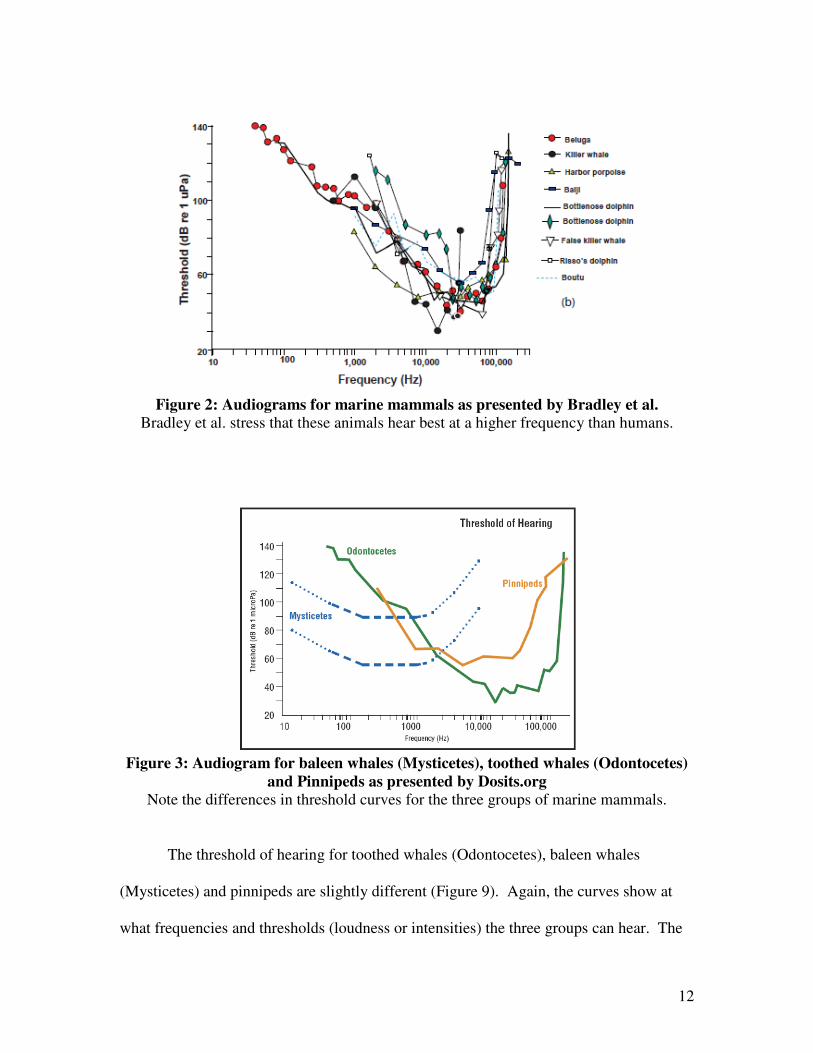
Figure 2: Audiograms for marine mammals as presented by Bradley et al.
Bradley et al. stress that these animals hear best at a higher frequency than humans.
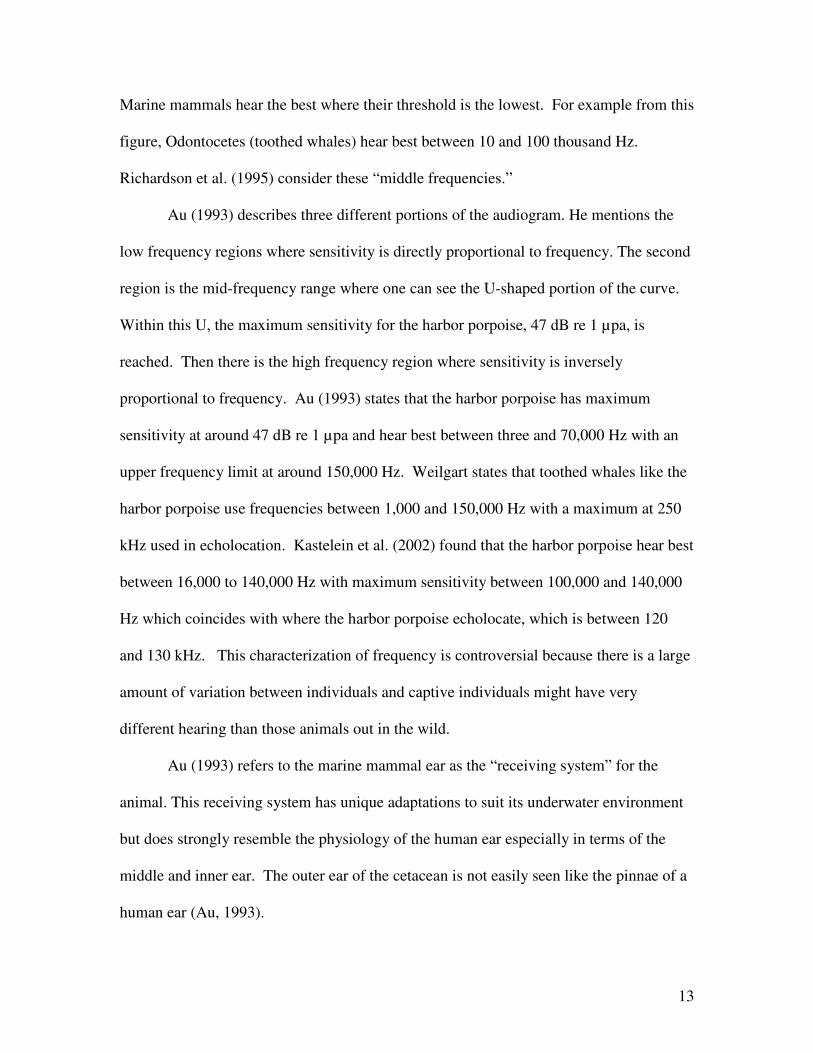
Figure 3: Audiogram for baleen whales (Mysticetes), toothed whales (Odontocetes)
and Pinnipeds as presented by Dosits.org Note the differences in threshold curves for the three groups of marine mammals.
The threshold of hearing for toothed whales (Odontocetes), baleen whales
(Mysticetes) and pinnipeds are slightly different (Figure 9). Again, the curves show at
what frequencies and thresholds (loudness or intensities) the three groups can hear. The
13
Marine mammals hear the best where their threshold is the lowest. For example from this
figure, Odontocetes (toothed whales) hear best between 10 and 100 thousand Hz.
Richardson et al. (1995) consider these “middle frequencies.”
Au (1993) describes three different portions of the audiogram. He mentions the
low frequency regions where sensitivity is directly proportional to frequency. The second
region is the mid-frequency range where one can see the U-shaped portion of the curve.
Within this U, the maximum sensitivity for the harbor porpoise, 47 dB re 1 µpa, is
reached. Then there is the high frequency region where sensitivity is inversely
proportional to frequency. Au (1993) states that the harbor porpoise has maximum
sensitivity at around 47 dB re 1 µpa and hear best between three and 70,000 Hz with an
upper frequency limit at around 150,000 Hz. Weilgart states that toothed whales like the
harbor porpoise use frequencies between 1,000 and 150,000 Hz with a maximum at 250
kHz used in echolocation. Kastelein et al. (2002) found that the harbor porpoise hear best
between 16,000 to 140,000 Hz with maximum sensitivity between 100,000 and 140,000
Hz which coincides with where the harbor porpoise echolocate, which is between 120
and 130 kHz. This characterization of frequency is controversial because there is a large
amount of variation between individuals and captive individuals might have very
different hearing than those animals out in the wild.
Au (1993) refers to the marine mammal ear as the “receiving system” for the
animal. This receiving system has unique adaptations to suit its underwater environment
but does strongly resemble the physiology of the human ear especially in terms of the
middle and inner ear. The outer ear of the cetacean is not easily seen like the pinnae of a
human ear (Au, 1993).
14
Cetaceans enclose their middle and inner ear in a bony structure called the
tympanic bulla (Au, 1993). The bulla is what transfers the sound from the mandible
(lower jaw) to the ear behind the jaw. The tympanic membrane is the eardrum and
transfers sound to the three bones of the ear. It receives the signal from the bulla and
transfers energy to the inner ear (Au, 1993). As pointed out by Au (1993) the cetacean
middle and inner ear lends itself to receiving high frequency, low intensity sounds. There
are three bones of the middle ear and these bones are the malleus, incus and stapes (Au,
1993). The inner ear houses the cochlea, a structure that resembles a snail shell, and is
important because it houses the auditory nerve endings (Au, 1993). The cochlea has two
membranes the basilar membrane and the spiral laminae. When acoustic energy enters
the cochlea, the basilar membrane begins to vibrate along with the hair cells along this
membrane. The basilar membrane is much more varied in cetaceans compared to
humans. The basilar membrane’s shape and length as well as the ganglion and hair cells
of the ear lend itself to hearing those high frequency sounds and being able to
discriminate between all of these sounds. Because the basilar membrane is longer in
cetaceans, cetaceans as compared to humans can distinguish between more frequencies
(Scheifele, Underwater Acoustics 2008).
Scheifele in the Marine Mammal Bioacoustic Overview, discusses four zones of
influence. They include zone of audibility, zone of responsiveness, zone of masking and
zone of auditory pathology. The zone of audibility is where the sound is barely heard and
largely defined by the ambient noise present as well as what the animal can actually hear
(Richardson et al., 1995). The zone of responsiveness is where there is a behavioral or
physiological reaction (Richardson et al., 1995). The definition of these zones is very
15
hard to determine because of the variability in responses among individuals of the same
species. The zone of hearing loss, discomfort or injury is where temporary threshold
shifts, permanent threshold shifts and other damage occur.
Marine Mammal Sound Production
The purpose for sound production is finding food, navigation, communicating
with conspecifics, keeping groups together and staying away from predators (Richardson
et al, 1995). Richardson et al. (1995) classify odontocete sounds into three categories:
tonal whistles, pulsed short sounds and less distinct pulsed sounds (Richardson et al.,
1995). Pulsed short sounds are used in the type of echolocation used by the harbor
porpoise, called Type 1 Echolocation. This echolocation is the highest frequency of the
three types (Richardson et al., 1995). Richardson et al. (1995) refer to two or three
different types of echolocation clicks: orientation which investigate their surroundings,
discrimination which works to gather information about a prey item, obstacle, etc., and
nonfunctional collateral acoustic behavior (Richardson et al., 1995).
Echolocation is the production of sound by a marine mammal to essentially see
with sound (dosits.org). A harbor porpoise would be able to determine obstacles in its
path, a school of herring, etc. and plan accordingly. The process of echolocation and re-
capturing the sound that bounces off of the object is complicated but very effective. A
dolphin has the capability of locating a golf ball a football field away (dosits.org).
According to Au (1993), all Odontocetes in the same family as the harbor porpoise,
Phocoenidae, produce high frequency sounds at low intensity. Echolocation of a harbor
porpoise is around 130 Hz (Bibikov, 2004).
16
A difference that lies between the signals of harbor porpoise and the signal of a
bottlenose dolphin is that harbor porpoise signals are longer in duration and the
bandwidth is much less (Au, 1993). The reason for this difference is thought to be due to
their smaller size. Harbor Porpoises are essentially compensating for this by emitting for
a longer time and within a smaller bandwidth (Au, 1993).
Akamatsu et al. (1994) explored when and how cetaceans use their ultrasonic
clicks for echolocation. The study used a click light which measured above 150 db re 1
µpa in the 28-180 kHz range. This would capture the 120 to 140 kHz range for
echolocation found by Au (1993) and Bibikov (2004). Echolocation rates can vary with
location as they were higher in a net enclosure than the pool.
A relatively recent theory on production of sound, and one that many scientists
have agreed with, is that sound is produced by the Monkey Lips Dorsal Bursae (MLDB)
(Cranford et al., 1987; Au, 1993). Marine mammals do not use the larynx to produce
sound but instead use it to prevent food from entering their lungs. The MLDB is a major
part of sound production in marine mammals. This is a collection of air sacs, muscles
and tissue. The pressure created in this area and thus the sound produced near the nasal
plugs will proceed forward through the melon or the blowhole. The melon is a very fatty,
lipid rich area. The MLDB is an important structure because it allows the harbor porpoise
to reuse air without having it leak to the ocean (Bradley et al., 2008) and again actually
produces the sound.
All of these values are controversial as they can vary widely between individuals
of the same species. Scientists also believe that there could be significant differences
between wild and captive animals. Sounds produced by animals in captive environments
17
versus those that are free-ranging could be very different (Richardson et al., 1995). They
can also vary between individuals of the same species.
Sound
Sound is very important to understand because it can carry information and also
have major effects on the animals that are exposed to it (Bradley et al. 2008). According
to Bradley and Stern (2008) these effects can be behavior modification, tissue damage,
injury, and death. Sound is a “mechanical disturbance” (Bradley et al. 2008) and
according to Scheifele (2007) can be thought of physically and perceptually. Physically,
sound is a wave created by vibrations while perceptually it is what we hear.
Sound is made up of a series of longitudinal waves. There are changes in air
pressure that occur as the sound moves and this is what the eardrum senses. Hearing
again is when the eardrum senses this movement.
It is also important to understand that an environment is never silent. The sound
in the background is referred to as ambient noise. This is not the useful part of the sound
in terms of this study. Ambient noise can be natural or anthropogenic. Anthropogenic
noise is that created by humans (Bradley et al., 2008). Some possible sources of ambient
noise include currents and tides, seismic noise, waves, rain, vessels, aircrafts,
construction, mining, fishing, acoustic devices, etc.
Sound travels faster in water (1500 m/sec) versus air (340 m/sec) (Au 1993). Not
only does sound travel faster in water, it also travels farther due to the different density of
the mediums (Bradley et al. 2008). An important piece in understanding sound is that it
requires a medium. Sound requires two things. It requires the source (whatever produces
18
it) and a medium (what it travels through) (Bradley et al., 2008). Because of the density
difference of the medium, sound traveling in water is very different than sound traveling
in air. This can be demonstrated if one is to dive underwater. The direction that a sound
comes from is difficult to determine while underwater while the direction of a sound in
air is easier to pinpoint. Since the sound is traveling faster there is less of a difference in
the time the sound arrives at each ear. If the sound is on the right side of the head, the
right ear will “hear” the sound first and we are able to determine the sound is coming
from the right. In water the difference between hearing it in the right ear versus the left
ear is much smaller. Sound travels so quickly it is difficult to determine the direction of
a sound underwater.
The reference for sound especially in water is extremely important to state. This
reference is 1 µPa (micro pascal). The reference for every sound in this case study has
the 1 µPa reference as this is the reference for sound in water. A Pascal according to
Richardson (1995) is the resulting pressure from a Newton of force over one square meter
(Richardson et al. 1995, 16). The reference in air is dB SPL or 20 µPa.
Sound and sound speed are affected by many factors including temperature,
salinity and depth. Since sound travels so well in water, marine mammals fall victim to
noises that might have originated very far from where they are. These sounds can include
earthquakes, explosions, precipitation, shipping noise, industrial noise, sea ice, waves,
bubbles, etc. (Bradley et al., 2008). Movement of water molecules also creates noise
called molecular agitation (Bradley et al., 2008). The environment of a marine mammal
is a very noisy place (Figure 6). Sounds can either be prevailing or intermittent.
Prevailing sounds are those that are constantly in the sound environment while
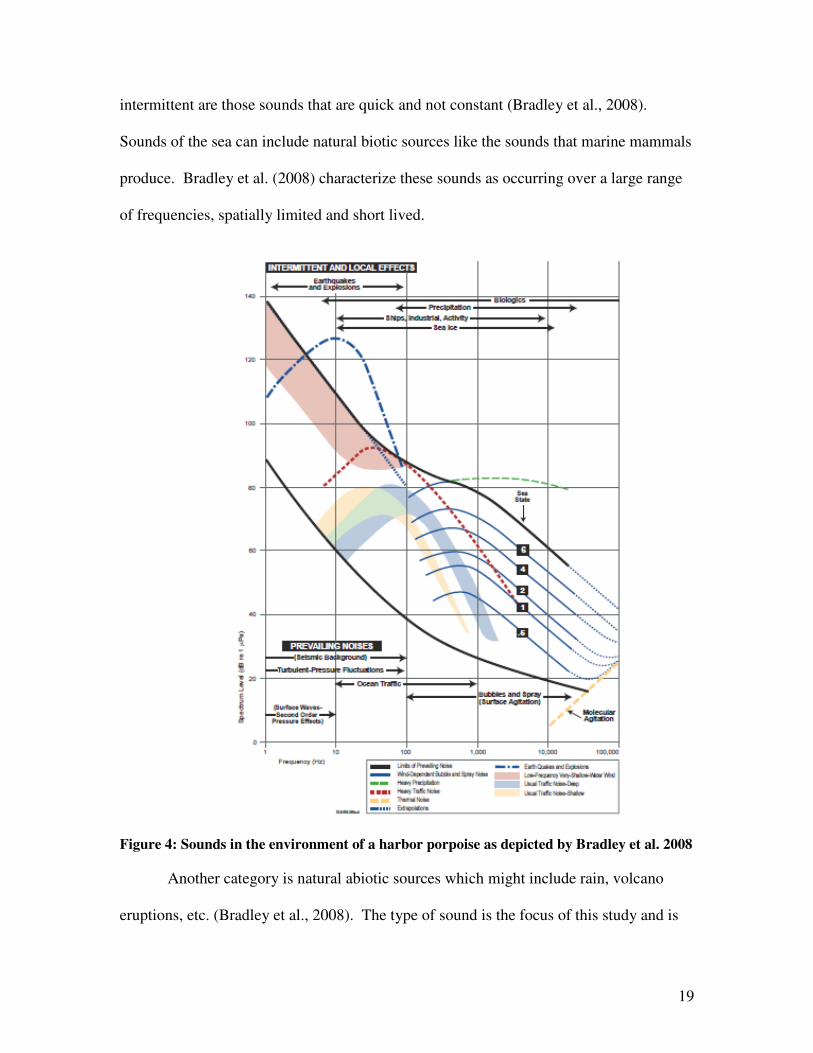
19
intermittent are those sounds that are quick and not constant (Bradley et al., 2008).
Sounds of the sea can include natural biotic sources like the sounds that marine mammals
produce. Bradley et al. (2008) characterize these sounds as occurring over a large range
of frequencies, spatially limited and short lived.
Figure 4: Sounds in the environment of a harbor porpoise as depicted by Bradley et al. 2008
Another category is natural abiotic sources which might include rain, volcano
eruptions, etc. (Bradley et al., 2008). The type of sound is the focus of this study and is
20
an anthropogenic or man-made sound. Bradley et al. (2008) mention “test firing of
weapons” as another source of sound that could make an impact on the sound
environment.
When describing sound it is common to use parameters such as intensity and
frequency to describe certain characteristics of the sound that we can hear. One of these
characteristics is how loud the sound is. The term for this characteristic is intensity and is
measured in decibels (Scheifele, 2007). As previously mentioned, a decibel always has a
reference; this reference in water is dB re. 1 µpa while in air this reference is dB SPL or
20 µpa (Scheifele, 2007).
Another characteristic is the frequency of a sound. We perceive this as the pitch
of the sound. Wavelength is the distance between two peaks and two troughs on the
sound wave (dosits.org). Some other physical characteristics of a sound are energy,
velocity and phase (where the wave starts) (Bradley et al., 2008).
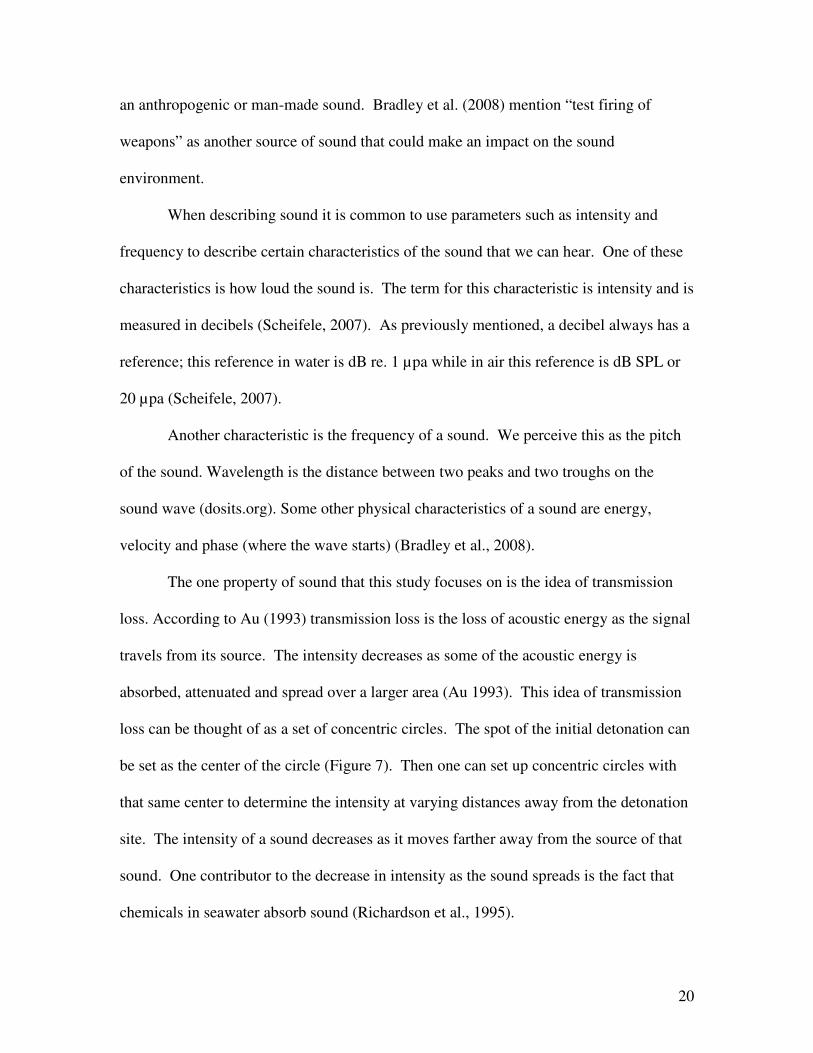
The one property of sound that this study focuses on is the idea of transmission
loss. According to Au (1993) transmission loss is the loss of acoustic energy as the signal
travels from its source. The intensity decreases as some of the acoustic energy is
absorbed, attenuated and spread over a larger area (Au 1993). This idea of transmission
loss can be thought of as a set of concentric circles. The spot of the initial detonation can
be set as the center of the circle (Figure 7). Then one can set up concentric circles with
that same center to determine the intensity at varying distances away from the detonation
site. The intensity of a sound decreases as it moves farther away from the source of that
sound. One contributor to the decrease in intensity as the sound spreads is the fact that
chemicals in seawater absorb sound (Richardson et al., 1995).
21
Figure 5: Concentric Circle model as presented by Bradley et al. 2008
(Note that the black circle is the initial source of the sound and as the sound radiates
away from the source it radiates in circles or spheres.)
Effects of Sound on Marine Mammals
Sonar can change behavior of marine mammals that make deep dives (Parsons et
al., 2008). One of the more well known displays of the effects noise has on marine
mammals is the 16 animals that stranded in 2000 in the Bahamas in response to use of
navy sonar in the area (Parsons et al., 2008). In this case the animals that stranded were
found; however, scientists believe that there are animals that do not wash ashore. Thus,
all animals affected by the noise are not found and the effects are likely much greater
than what we can glean from those animals that strand. Harbor porpoises in particular
have been observed to exhibit “abnormal behavior” during times of navy sonar activity
(Parsons et al., 2008).
Bubble-like lesions have been found in animals that strand in response to noise
since many will change their diving behavior with noise disturbances. These lesions
suggest decompression sickness much like the sickness scuba divers are subjected to
when they change their depth quickly (Parsons et al., 2008). It is thought that the sonar
22
essentially brings the nitrogen bubbles out of the blood or creates behavioral responses as
seen in the Harbor Porpoise. It is unclear what actually happens in these marine
mammals but most scientists agree on the behavioral response hypothesis. More research
is needed to determine the physiological response that causes these bubble lesions.
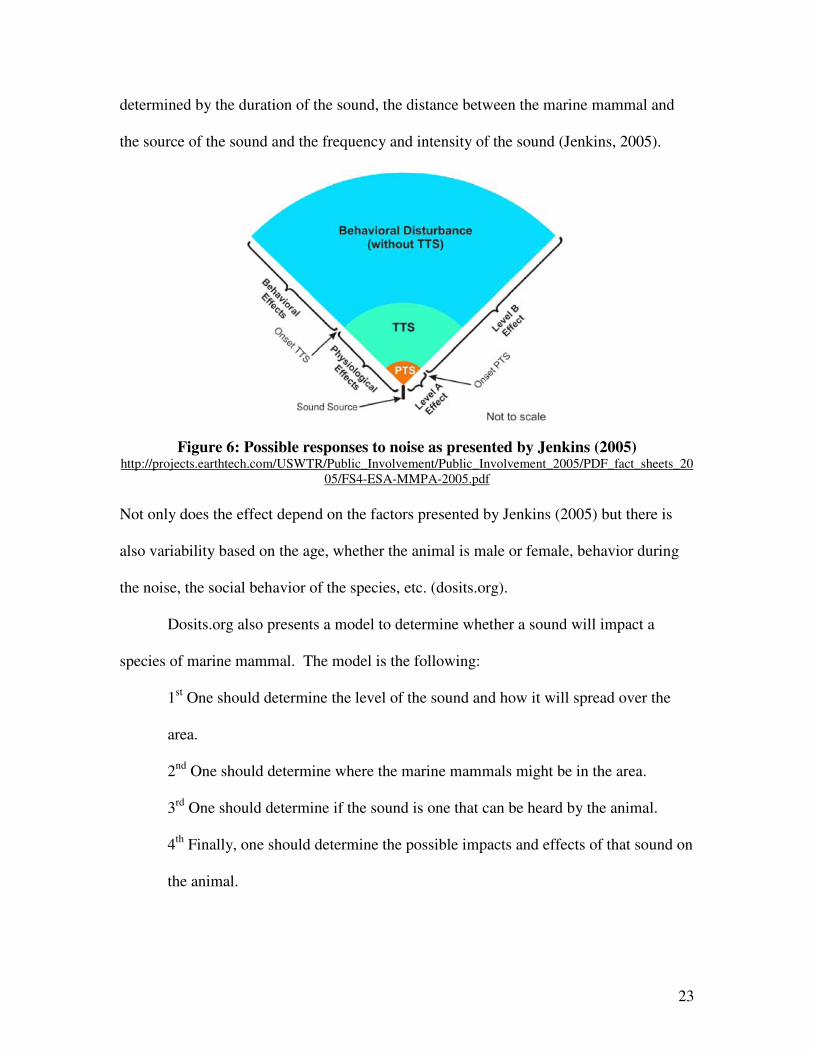
Effects on the animal can be behavioral or physiological (Jenkins, 2005). The
physiological effects include temporary and permanent threshold shifts, TTS and PTS
respectively. Threshold shifts elevate the threshold of hearing either temporarily or
permanently. A PTS can be a very serious problem for a marine mammal and might
actually kill it (Bradley et al., 2008). Jenkins (2005) presents the possible effects on
marine mammals from proposed Navy sonar (Figure 10). These effects are common
responses to noise disturbances. These same types of effects could potentially result from
the noise being analyzed in this study. There is little known about threshold shifts in
cetaceans as there have only been a handful of studies done to determine these shifts
(Finneran et al. 2000). It is important to study these shifts in cetaceans to make sure that
effects from anthropogenic noise are minimized.
Temporary threshold shifts have been studied by Finneran et al. (2000) in
bottlenose dolphins (Tursiops truncatus) and beluga whales (Delphinapterus leucas).
The study by Finneran et al. (2000) was the first that aimed to determine these types of
effects. Again, the same type of effect that Finneran studies could occur because of the
detonations at Fort Richardson. It is important to understand any and all possible effects
before a decision can be made about future detonations.
It is also important to understand the characteristics of the noise in question. The
reason for focusing on the sound is that the impact a noise has on a marine mammal is
23
determined by the duration of the sound, the distance between the marine mammal and
the source of the sound and the frequency and intensity of the sound (Jenkins, 2005).
Figure 6: Possible responses to noise as presented by Jenkins (2005)
http://projects.earthtech.com/USWTR/Public_Involvement/Public_Involvement_2005/PDF_fact_sheets_20
05/FS4-ESA-MMPA-2005.pdf
Not only does the effect depend on the factors presented by Jenkins (2005) but there is
also variability based on the age, whether the animal is male or female, behavior during
the noise, the social behavior of the species, etc. (dosits.org).
Dosits.org also presents a model to determine whether a sound will impact a
species of marine mammal. The model is the following:
1st One should determine the level of the sound and how it will spread over the
area.
2nd
One should determine where the marine mammals might be in the area.
3rd
One should determine if the sound is one that can be heard by the animal.
4th
Finally, one should determine the possible impacts and effects of that sound on
the animal.
24
This study focuses on the effects due to the introduced noise. However, it should
be pointed out that a noise, even if it is out of the hearing range of the cetacean, could
still impact the animal (Weilgart, 2008). This implies that noises not within their hearing
curves could still have a significant impact on them. For example, noise has been known
to cause large mass strandings of beaked whales (Weilgart, 2008). Scientists determined
that noise was the cause of these strandings because of the hemorrhaging in the brain,
inner ear and acoustic fat (Weilgart, 2008). This fat is involved in transmitting sound and
thus the scientists determined that noise was the cause. The noise responsible for these
strandings is naval sonar (Weilgart, 2008). Weilgart (2008) explains why noises can
strand marine mammals. There may be direct behavioral responses to the noise that
might include attempting to get away from the sound, swimming into shallow water
because of disorientation, changing their dive behaviors and staying under water for too
long (Weilgart 2008). Harbor porpoises have also been known to strand due to noise
events (Weilgart 2008).
Two principles exhibited by the two harbor porpoises studied by Akamatsu et al.
(2004) were masking and the Lombard response. Scheifele et al. (2004) demonstrated
that beluga whales exhibit what is known as the Lombard Response. This is a reflex that
in humans causes your voice to become more or less intense as external noise becomes
more or less intense (Scheifele, 2004). The data collected from the study served to
support this same type of response in beluga whales. This study also confirms that noise
has a significant impact and effect on marine mammals, in particular their
communication (Scheifele et al., 2004). In the Akamatsu study (2004), the higher
25
background noise in the net enclosure location resulted in masking of the normal
echolocation and thus an increase in the rate and a change in the level for echolocation.
Masking by definition, according to Scheifele in Underwater Acoustics, is a
process where one sound essentially covers another. For example, a noise from a boat
could possibly mask the sounds of echolocation. Masking can have serious consequences
on the survival of the marine mammal. The two noises do not need to have the same
frequency to have masking (Scheifele, 2007). Low-frequency noise can mask a much
wider range of frequencies than can mid- or high-frequency noise (Richardson et al.,
1995). Surrounding sound of the same frequency can also block the auditory system from
receiving the sound. Masking can be very serious when the sound being produced masks
communication with conspecifics, echolocation, food location and other behaviors and
processes required for survival (Richardson et al., 1995). According to dosits.org,
masking has the potential to make the most significant impact on a marine mammal.
The changes in marine mammal communication that might occur because of noise
include the Lombard shift, changing the frequency so they do not compete with the noise,
repeating their signals and longer duration signals than usual (Tyack et al., 2008)
Another option to deal with the noise is waiting until it stops (Tyack et al. 2008). All of
these options have been observed in other species (other marine mammals, birds,
primates, etc.). Using these options is potentially dangerous for the animals and could
impact social systems, mating, reproduction, prey capture and many of the functions
necessary for survival (Tyack et al. 2008). Many of these options also increase the cost
of making the call to a conspecific (Tyack et al. 2008).
26
Some other responses include changes in vocalization including but not limited to
stopping vocalizations, and increasing or decreasing vocalizations (Weilgart, 2008).
Some also leave their habitat and go to a lower quality habitat. Harbor Porpoises have
done this to avoid the noise (Weilgart, 2008). Noise is speculated to have forced gray
whales out of Baja California. Scientists believe that the cause was dredging and
shipping (Tyack et al. 2008). Some supporting evidence for this speculation is that when
the activity ceased the whales came back into the area (Tyack et al., 2008). Two studies
have shown that bottlenose dolphins have also moved out of areas where there is high
boat traffic and thus noise from dolphin watching boats (Tyack et al., 2008).
There are other more subtle responses as well as those that are stress induced. It
is important to try and determine what kinds of responses a species will show. Again this
is difficult because of the variability between individuals but it is important to investigate
not only short term but also long term responses.
Threshold shifts are another possible impact of noise (Jenkins, 2005). These
types of changes are very variable between individuals and species. It is hard to
determine the impacts on the harbor porpoise as a whole. There might be greater impacts
on some as opposed to others. TTS and PTS are both serious impacts on an animal and
can greatly affect the animal (Jenkins, 2005). TTS and PTS are when marine mammals
have shifts in their hearing threshold curves. These shifts can be temporary (TTS) or
permanent (PTS) (Jenkins, 2005). If a marine mammal permanently shifts the range it
hears it can have terrible consequences. The animal might not be able to hear some of the
sounds needed for their survival. Physical damage as well as changes in where they live,
27
how they behave, grow, etc. can occur due to a noise disturbance and a threshold shift
(Jenkins, 2005).
There has been recent concern about this species and their response to noise
(Skov et al. 2008). Since the harbor porpoise spends time in shallow coastal water they
are subject to many anthropogenic threats. The worry is that noise could alter the
behavior of marine mammals or have an impact on their physiology (Tyack et al., 2008).
At this point, there is only speculation about what the long term effects of this increase in
noise will be (Wright, 2008). Wright (2008) states that the intensity of this underwater
noise, especially in lower frequency ranges, has been doubling every single decade. If
there aren’t steps toward making ships quieter and reducing the noise pollution put into
the ocean, noise could be even more threatening than originally thought. However, one
promising thing to note about noise pollution is that once steps are taken to reduce the
noise, it is immediately lowered. Noise pollution is unlike chemical pollution in that it
doesn’t linger and disappears without a trace (Wright, 2008). This past April a
conference was held to discuss reducing shipping noise. The conference decided that a
three decibel decrease in shipping noise in ten years and a 10 decibel decrease in thirty
years would be a step towards decreasing this harmful noise (Wright, 2008).
Wright (2008) uses an example to help readers understand the danger of this
increasing noise. He creates the situation that you are a blind person in a restaurant with
a young child. You let the child play and walk around the table listening carefully to
make sure you know where the child is at all times. This works at the beginning of the
meal but as the lunch rush comes into the restaurant the noise increases and it gets harder.
Imagine how much closer you need to be to continue hearing where the child is. The
28
child would have to play and talk louder to communicate where he or she is to you.
Imagine not being able to find the young child in the noise of the restaurant (Wright,
2008).
Other Threats to the Harbor Porpoise
Because the harbor porpoise prefers to inhabit shallow coastal areas it is prone to
stranding (American Cetacean Society, 2007). Another threat to harbor porpoise
populations is hunting. Although they are not as commonly hunted as the beluga whale
in the Cook Inlet, there is some hunting of the harbor porpoise. Cetaceans in the Cook
Inlet have been subject to Alaska native hunters. Belugas are the main target for this
hunting but it is thought that harbor porpoises might be affected as well (Laidre et al.
2000). Like most wildlife they are also threatened by habitat destruction, development,
human presence and pesticide use.
The greatest threat to the harbor porpoise is fishery bycatch (Skov et al., 2008).
The harbor porpoise is severely threatened by being bycatch for commercial fisheries,
and in particular, gillnet fisheries. Bycatch is an animal caught by the commercial fishery
without being targeted. The harbor porpoise is thus in danger as being caught in these
nets is often fatal. In the Gulf of Maine bycatch can be between one and two thousand
animals annually. Westgate et al. (1998) were studying harbor porpoises in the Bay of
Fundy and found that harbor porpoises move farther and dive deeper than originally
thought. This puts them in danger in multiple areas and by gillnets in all points of their
deployment. The average annual mortality level in a salmon fishery of the Cook Inlet is
calculated to be 15.6 animals per year (Department of Commerce, 2008).
29
Federal Noise Regulations Protecting Marine Mammals
In a highly publicized case in California from August 2008, a US district court
came to the decision that the navy would forego low sonar testing and training in areas
where marine mammals are present (Environment News Service, 2008). This decision
comes as a landmark in connecting conservation and politics and helps protect marine
mammals that would be otherwise affected. Some have stated that environmentalists are
standing in the way of homeland security (Environment News Service, 2008). The court
in San Francisco has not completely halted the navy’s low sonar submarine surveillance
program but has reduced the amount of the ocean that this kind of low frequency sonar
can be deployed (Environment News Service, 2008). The navy was deploying this sonar
in more than 70 percent of the world’s oceans (Environment News Service, 2008).
Included in the court’s decision are certain limitations on when and where the sonar can
be deployed depending on habitat and breeding season. Environmentalists say that this
decision is essential for whale and other marine mammal survival. The Environmental
News Service (2008) states the sound can be heard as far 300 miles away; the intensity of
the sound can still be around 140 decibels (dB), a level known to have a behavioral affect
on whales.
The main issue in this controversy is whether the military and exercises related to
national security are or should be exempt from laws like the Marine Mammal Protection
Act (Kaufman, 2008). The Navy and environmentalists have not been able to agree on
this subject and have not been able to agree on what each believes will be safe for the
marine mammals in the area. As recent as March 9, 2009 there have been articles about
30
the South California coast issue. With the creation of protected areas along the coast the
Navy is worried that they might not be able to perform their training operations. This
could also set a precedent for future concerns about military action and the impact on
marine mammals. The Supreme Court allowed the Navy to continue their training but
soon after, the state began compiling a list of areas they hope to set aside as protected
areas. The Navy claims that they already have measures to protect the environment
(Kaufmann, 2008).
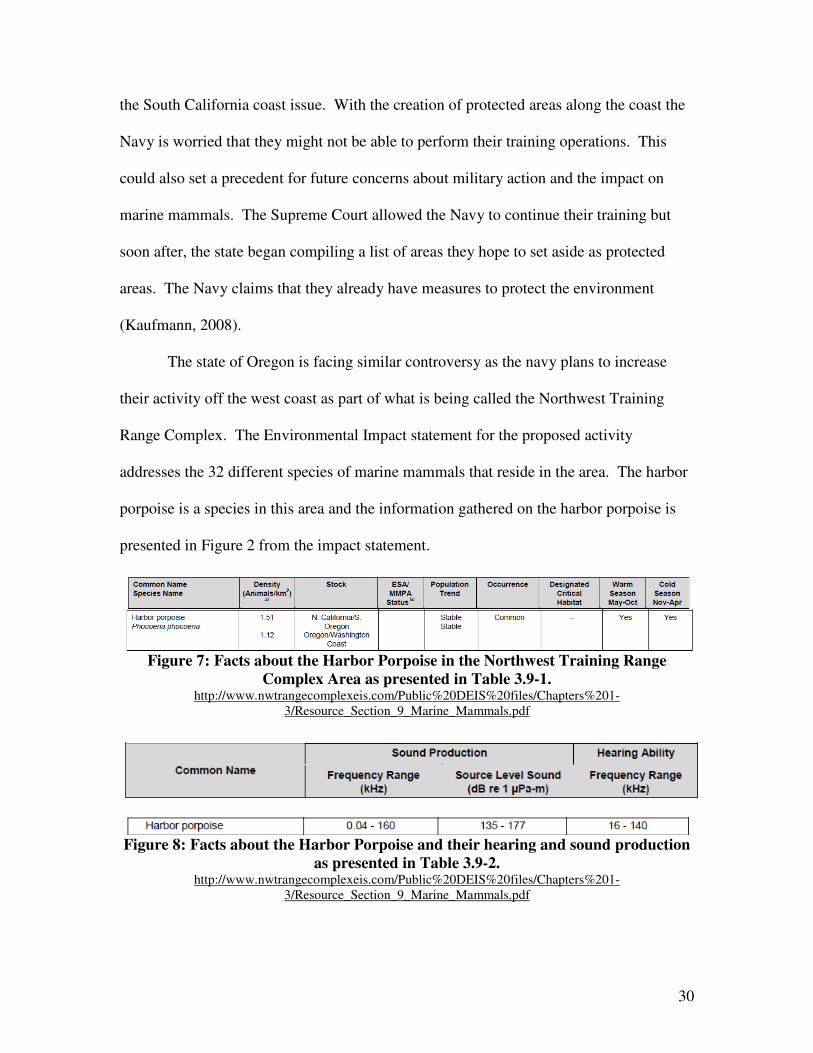
The state of Oregon is facing similar controversy as the navy plans to increase
their activity off the west coast as part of what is being called the Northwest Training
Range Complex. The Environmental Impact statement for the proposed activity
addresses the 32 different species of marine mammals that reside in the area. The harbor
porpoise is a species in this area and the information gathered on the harbor porpoise is
presented in Figure 2 from the impact statement.
Figure 7: Facts about the Harbor Porpoise in the Northwest Training Range
Complex Area as presented in Table 3.9-1. http://www.nwtrangecomplexeis.com/Public%20DEIS%20files/Chapters%201-
3/Resource_Section_9_Marine_Mammals.pdf
Figure 8: Facts about the Harbor Porpoise and their hearing and sound production
as presented in Table 3.9-2. http://www.nwtrangecomplexeis.com/Public%20DEIS%20files/Chapters%201-
3/Resource_Section_9_Marine_Mammals.pdf
31
In this case the impact statement helped the navy determine that there would in fact be
noise that fell into the level A and level B take criteria. The impact statement then
assures the reader that they will work with the National Marine Fisheries Service to
ensure that their actions would comply with the Marine Mammal Protection Act.
The established safe standards for marine mammals and noise are also disputed.
Scientists believe that the decibel level for the event in the Bahamas was 160 to 170
decibels, twenty decibels less than the established safe standards (Parsons et al., 2008).
Parsons et al.(2008) stress creating a more accurate standard for noise exposure.
Establishing this standard will be difficult as there is a high degree of individuality
between species and a large number of possible effects that noise can have on them. It
will be difficult to encompass all possible effects and the different species of marine
mammals but more effort is needed to make sure that marine mammals are being
protected from possible damaging noise.
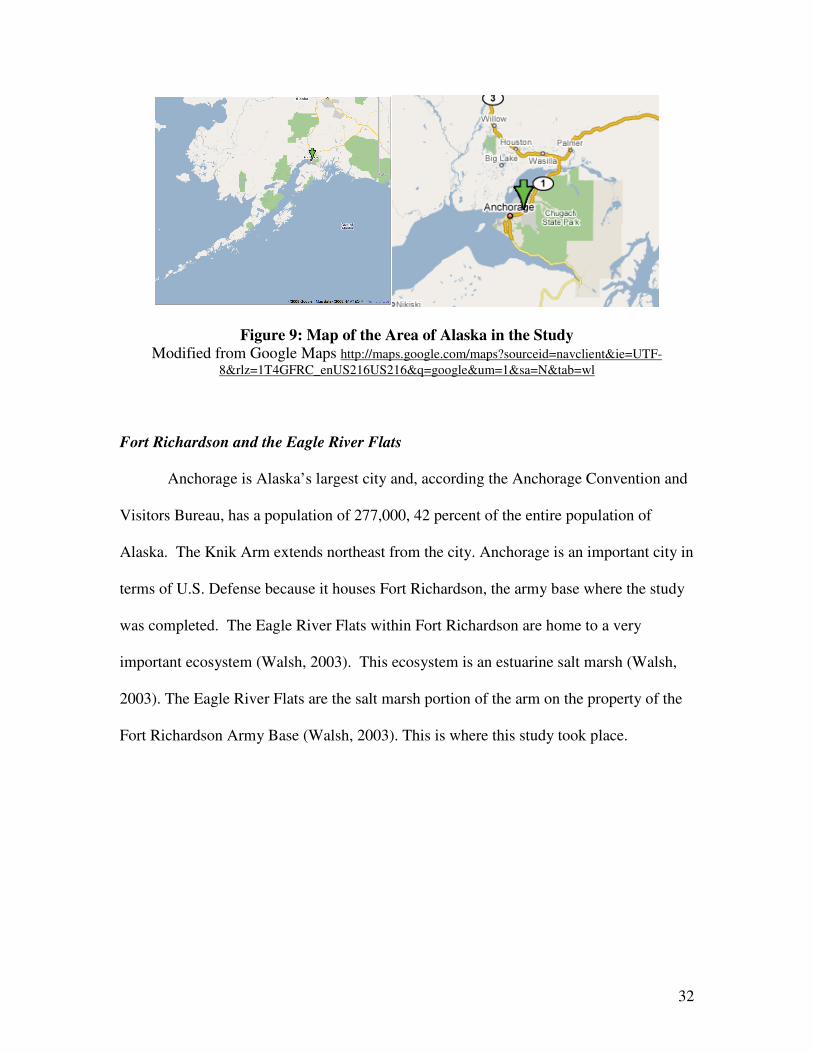
The Cook Inlet and Knik Arm of Alaska
The present study area was the part of Alaska known as the Knik Arm of the
Cook Inlet. The Cook Inlet is a branch of the Gulf of Alaska bordered by the Kenai
Peninsula. The Knik Arm watershed includes the following rivers: Susitna, Matanuska,
and Kenai. The difference between high and low tide can be as great as 30 feet with the
normal tidal range of the area being 8-10 meters. The Cook Inlet is extremely important
as it has a vast 50,000 square mile watershed that spans a wide variety of types of
ecosystems (Encyclopedia Brittanica, 2008).
32
Figure 9: Map of the Area of Alaska in the Study
Modified from Google Maps http://maps.google.com/maps?sourceid=navclient&ie=UTF-
8&rlz=1T4GFRC_enUS216US216&q=google&um=1&sa=N&tab=wl
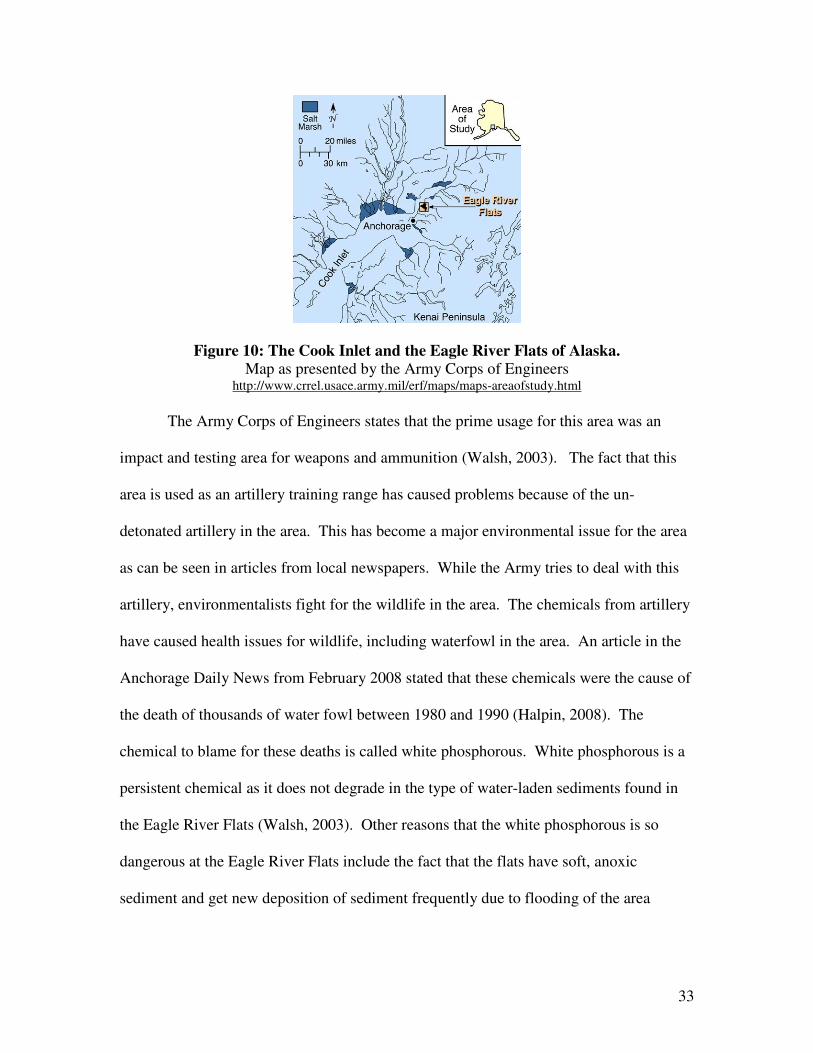
Fort Richardson and the Eagle River Flats
Anchorage is Alaska’s largest city and, according the Anchorage Convention and
Visitors Bureau, has a population of 277,000, 42 percent of the entire population of
Alaska. The Knik Arm extends northeast from the city. Anchorage is an important city in
terms of U.S. Defense because it houses Fort Richardson, the army base where the study
was completed. The Eagle River Flats within Fort Richardson are home to a very
important ecosystem (Walsh, 2003). This ecosystem is an estuarine salt marsh (Walsh,
2003). The Eagle River Flats are the salt marsh portion of the arm on the property of the
Fort Richardson Army Base (Walsh, 2003). This is where this study took place.
33
Figure 10: The Cook Inlet and the Eagle River Flats of Alaska. Map as presented by the Army Corps of Engineers
http://www.crrel.usace.army.mil/erf/maps/maps-areaofstudy.html
The Army Corps of Engineers states that the prime usage for this area was an
impact and testing area for weapons and ammunition (Walsh, 2003). The fact that this
area is used as an artillery training range has caused problems because of the un-
detonated artillery in the area. This has become a major environmental issue for the area
as can be seen in articles from local newspapers. While the Army tries to deal with this
artillery, environmentalists fight for the wildlife in the area. The chemicals from artillery
have caused health issues for wildlife, including waterfowl in the area. An article in the
Anchorage Daily News from February 2008 stated that these chemicals were the cause of
the death of thousands of water fowl between 1980 and 1990 (Halpin, 2008). The
chemical to blame for these deaths is called white phosphorous. White phosphorous is a
persistent chemical as it does not degrade in the type of water-laden sediments found in
the Eagle River Flats (Walsh, 2003). Other reasons that the white phosphorous is so
dangerous at the Eagle River Flats include the fact that the flats have soft, anoxic
sediment and get new deposition of sediment frequently due to flooding of the area
34
(Walsh, 2003). The un-detonated artillery left this harmful chemical in the bottom
sediment (Walsh, 2003).
This is why the chemical has been pervasive and poses such a threat to the
wildlife in the area. The issue now lies in whether or not to open the Eagle River Flats to
shelling activity throughout the year as reported in the news article “Army shells Eagle
River Flats as prelude to year-round operation.” This article from February 13, 2008 in
the Anchorage Daily News stated that environmentalists are fighting for not only the
species of birds but also the marine mammals in the area. All of these concerns will be
included in an Environmental Impact Statement (EIS). An EIS stems from an assessment
used to determine what environmental impacts will ensue and what changes will occur in
the environment due to the project. A section of the EIS for this proposed project will
focus on Biological and Ecological Impact Statements and will help determine the
impacts to birds and marine mammals. The concern for this project is that the chemicals
leach out into the water. The possible issues stemming from beginning the detonations
again include possible water pollution and the focus of this study, noise pollution (Walsh,
2003).
Howitzer Cannons
The charges used during this study were 6.8 kg C4 plastiques to simulate
Howitzer cannon shells. Fort Richardson has been used for mortar shots and light
ordnance but not cannons. Fort Richardson has seen no significant use since the Korean
War and has stopped using cannons as of the Korean War. The howitzer is a cannon
currently being used by the military and something the base might fire in the future.
35
Methods
Methods for Data Collection
As mentioned in the previous section, 6.8 kg C4 plastique charges were used in
this study. Charges were used to simulate a detonation by a Howitzer cannon shell
(Tremblay, 2008). Data was collected on 20 June 2007. Nine charges were detonated on
the day of the study; however, only shot nine will be used in this study (Tremblay, 2008).
Hydrophones were used to detect the sound produced by the detonation at a
distance of 530 m from the detonation site. The charges were detonated on land at a
distance of 500 m from the shore (Tremblay, 2008). The hydrophones were situated
three meters under water (Tremblay, 2008). According to Richardson et al. (1995),
hydrophones take acoustic pressure and convert it into electrical voltages (Richardson et
al., 1995). These hydrophones can be very sensitive to ambient or background noise.
When taking the measurements during low tide this effect of ambient noise was
tremendous (Tremblay, 2008). The sound of the waves and the currents in the shallow
water created a situation where the sound of the detonations could barely be heard during
that low tide (Tremblay, 2008).
The calculations for intensity were calculated with reference to broadband, 100
and 1000 Hz (Tremblay, 2008). The values calculated for 1000 Hz is the most applicable
to actually determining the effect of this noise on the animal because 1,000 Hz or 1 kHz
is where the harbor porpoise begins to hear. 100 Hz is a more appropriate value for
beluga whale, harbor seals and for the fish in the area as well.
The hydrophone detected up to 350 kHz (Tremblay, 2008), the reason why we
could determine the intensity at the frequencies used. Nine charges were set off at high
36
tide in the morning and nine charges were set off at low tide in the afternoon (Tremblay,
2008). The charges in the afternoon were not significant. Again, the hydrophone was set
up 30 meters from the shore and thus 530 meters from where the shot was detonated.
The hydrophone used was the ITC-1089 hydrophone (Tremblay, 2008). The data was
then analyzed by the scientists from URI using Matlab 7.1 to calculate intensities at the
frequencies chosen for analysis (Tremblay, 2008).
Methods for Current Investigation
The intensities calculated by Matlab 7.1 were used to produce maps of the
intensity levels across the Knik Arm (Tremblay, 2008). The calculations were done in
Microsoft Excel and the maps were created with Microsoft Powerpoint. The use of
concentric circles around the sound source is how the maps in this study were created.
Intensities were calculated for 530, 600, 1,000 1,500, 2,500, 3,500, 4,500 5,500 and 6,500
meters from the detonation site. The intensity level at any distance away from the point
source can be determined using the following equation (Tremblay, 2008):
SIL (range r) = I – 10 log 10 (r/d)
In this equation I is the intensity recorded by the hydrophone, d is the 530 meter distance
to the boat and r is the distance to calculate. SIL is the intensity calculated at each of the
distances from the shot (Tremblay, 2008). The maps were created for broadband
frequency intensity, 100 Hz intensity and 1,000 Hz intensity across the area.
37
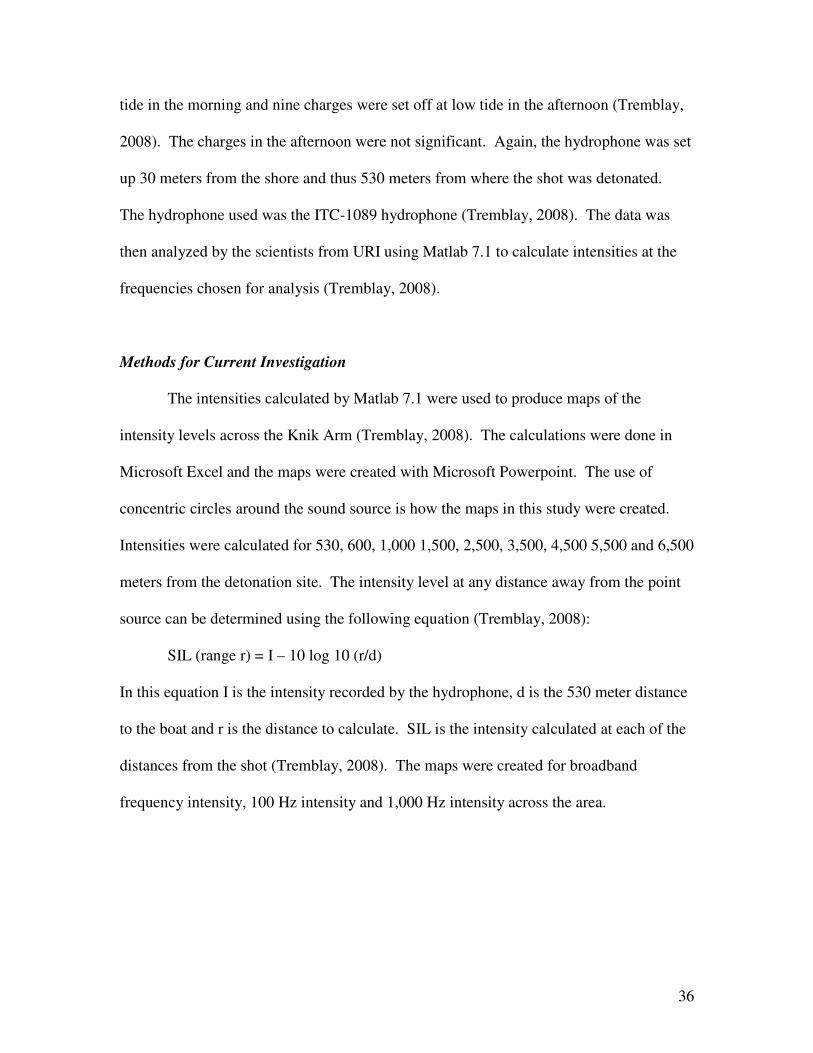
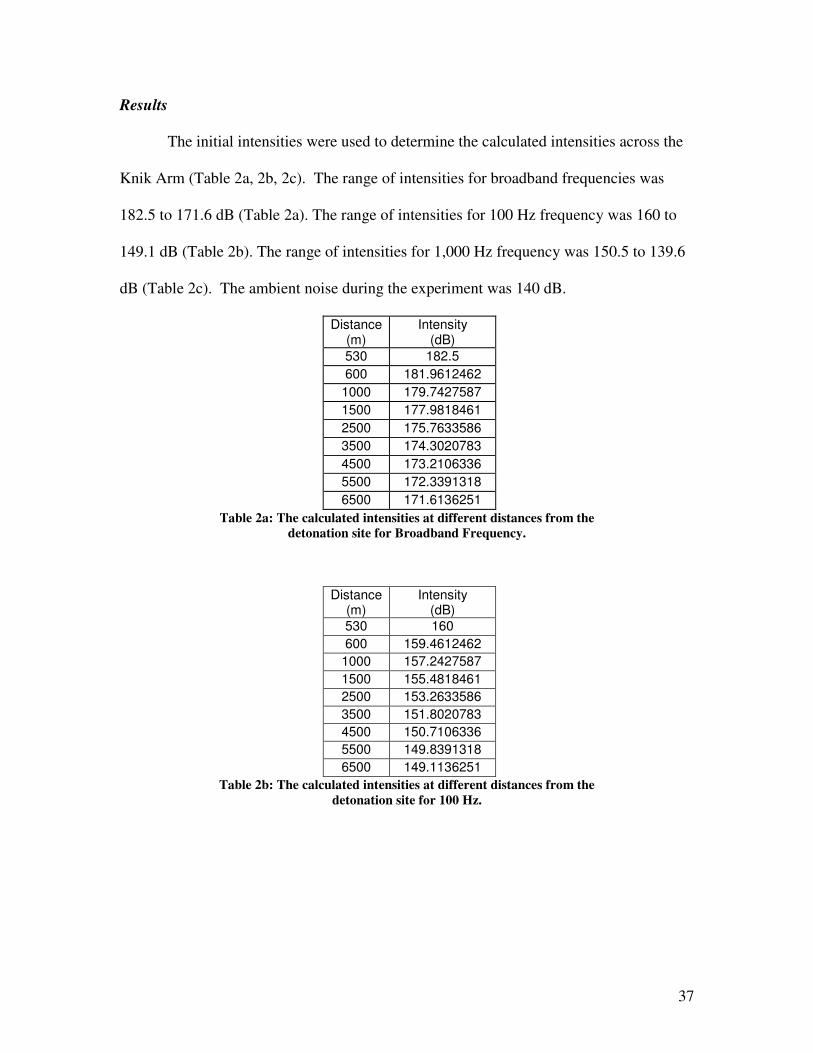
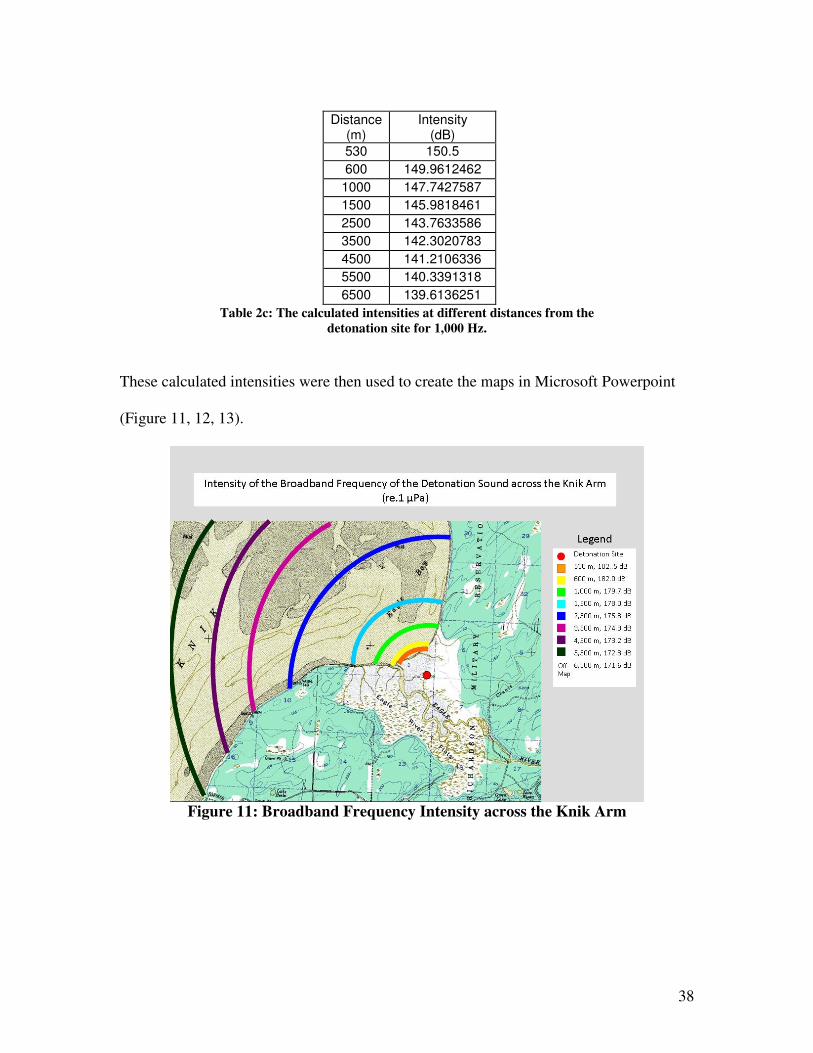
Results
The initial intensities were used to determine the calculated intensities across the
Knik Arm (Table 2a, 2b, 2c). The range of intensities for broadband frequencies was
182.5 to 171.6 dB (Table 2a). The range of intensities for 100 Hz frequency was 160 to
149.1 dB (Table 2b). The range of intensities for 1,000 Hz frequency was 150.5 to 139.6
dB (Table 2c). The ambient noise during the experiment was 140 dB.
Distance (m)
Intensity (dB)
530 182.5
600 181.9612462
1000 179.7427587
1500 177.9818461
2500 175.7633586
3500 174.3020783
4500 173.2106336
5500 172.3391318
6500 171.6136251
Table 2a: The calculated intensities at different distances from the
detonation site for Broadband Frequency.
Distance (m)
Intensity (dB)
530 160
600 159.4612462
1000 157.2427587
1500 155.4818461
2500 153.2633586
3500 151.8020783
4500 150.7106336
5500 149.8391318
6500 149.1136251
Table 2b: The calculated intensities at different distances from the
detonation site for 100 Hz.
38
Distance (m)
Intensity (dB)
530 150.5
600 149.9612462
1000 147.7427587
1500 145.9818461
2500 143.7633586
3500 142.3020783
4500 141.2106336
5500 140.3391318
6500 139.6136251
Table 2c: The calculated intensities at different distances from the
detonation site for 1,000 Hz.
These calculated intensities were then used to create the maps in Microsoft Powerpoint
(Figure 11, 12, 13).
Figure 11: Broadband Frequency Intensity across the Knik Arm
39
Figure 12: 100 Hz Frequency Intensity across the Knik Arm
Figure 13: 1000 Hz Frequency Intensity across the Knik Arm
40
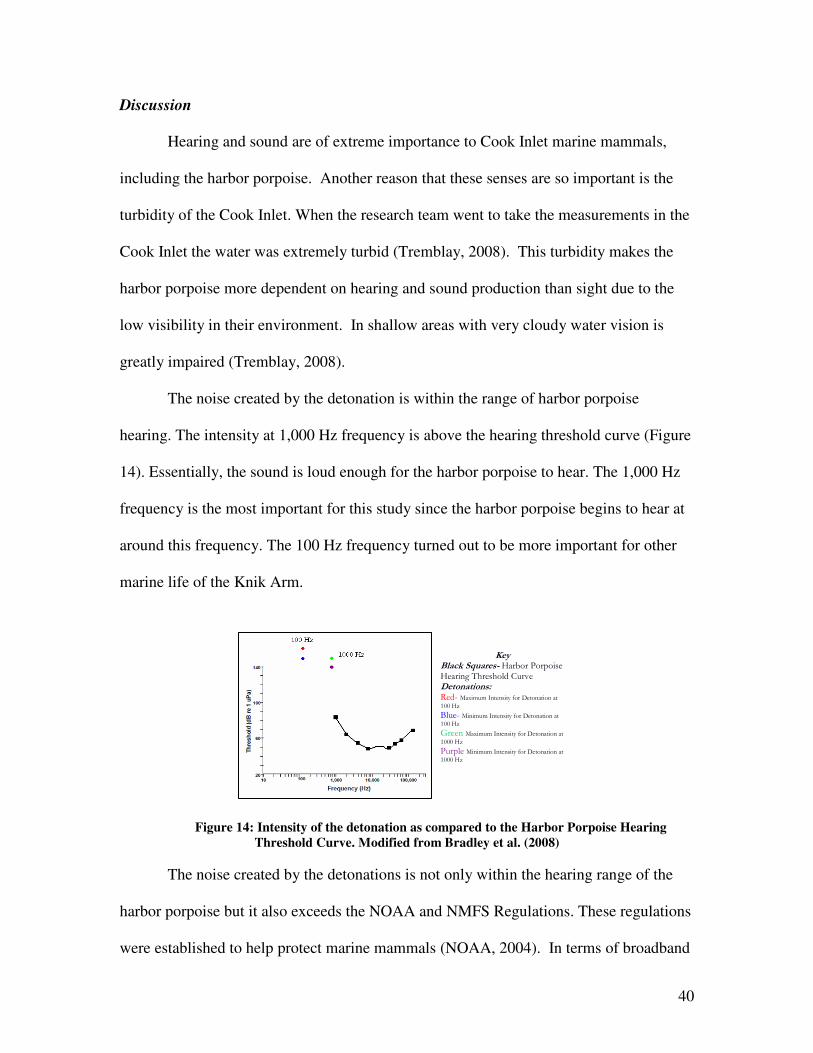
Discussion
Hearing and sound are of extreme importance to Cook Inlet marine mammals,
including the harbor porpoise. Another reason that these senses are so important is the
turbidity of the Cook Inlet. When the research team went to take the measurements in the
Cook Inlet the water was extremely turbid (Tremblay, 2008). This turbidity makes the
harbor porpoise more dependent on hearing and sound production than sight due to the
low visibility in their environment. In shallow areas with very cloudy water vision is
greatly impaired (Tremblay, 2008).
The noise created by the detonation is within the range of harbor porpoise
hearing. The intensity at 1,000 Hz frequency is above the hearing threshold curve (Figure
14). Essentially, the sound is loud enough for the harbor porpoise to hear. The 1,000 Hz
frequency is the most important for this study since the harbor porpoise begins to hear at
around this frequency. The 100 Hz frequency turned out to be more important for other
marine life of the Knik Arm.
Figure 14: Intensity of the detonation as compared to the Harbor Porpoise Hearing
Threshold Curve. Modified from Bradley et al. (2008)
The noise created by the detonations is not only within the hearing range of the
harbor porpoise but it also exceeds the NOAA and NMFS Regulations. These regulations
were established to help protect marine mammals (NOAA, 2004). In terms of broadband
Key Black Squares- Harbor Porpoise Hearing Threshold Curve Detonations: Red- Maximum Intensity for Detonation at
100 Hz
Blue- Minimum Intensity for Detonation at
100 Hz
Green Maximum Intensity for Detonation at
1000 Hz
Purple Minimum Intensity for Detonation at
1000 Hz
41
frequency, 180 decibels re 1 µpa is the Level A take (NOAA, 2004). This is the level
that sound should not exceed because sound at this level is believed to cause temporary
threshold shifts. The sound created by the detonation at Fort Richardson exceeds this
level within 1000 meters (Table 2a, Figure 11). The Level B take is at 160 decibels re 1
µpa (NOAA, 2004). Sound at this level is believed to change marine mammal behavior.
This level is exceeded across the entire Knik Arm (Table 2a, Figure 11).
I have established with the calculations and the research done on the harbor
porpoise that the harbor porpoise would be able to hear the sound. I have also established
that the intensity exceeds the current regulation. I now turn to how the noise might
actually impact the harbor porpoise. The noise created by the C4 plastique charge would
probably not cause a vocal response like the Lombard Shift. The noise is not continuous
and thus probably wouldn’t create this effect. For a Lombard shift to occur a temporary
threshold shift is needed (Richardson et al., 1995). The noise created by the charge
would probably not cause a serious masking situation either.
Although the noise exceeds the regulations set by NOAA and NMFS I cannot
state that the noise will in fact result in temporary threshold shifts or behavior changes.
The reason for this is that the sound is a pulse sound. It is not a continuous sound at this
intensity. The Department of the Navy (2008) states that a short sound even at the levels
like the one produced by the charge at Fort Richardson would not cause severe damage to
marine mammal hearing. Although the Navy states that the sound won’t be harmful to
the animals, more research on pulse sounds is necessary to confirm this. Harbor porpoise
have documented responses to noise. In response to aircraft and boat traffic, the animals
attempt to avoid the noise by rapidly changing direction and rapidly diving deeper into
42
the water (Richardson et al., 1995). With this, I cannot say that the Cook Inlet harbor
porpoise will have no response to the noise. However, I believe that the sound will not
cause severe damage or create severe behavioral responses. The effects on other animals
like Harbor seals and fish might be more severe due to differences in hearing thresholds.
The effects on these animals and possible behavioral or physiological responses might
have indirect effects on the harbor porpoise.
Explosions are sound sources that have the potential to kill marine mammals, all
research on explosions thus far have been conducted on underwater explosions
(Richardson et al., 1995). The explosions in this study were done on land and the effects
were measured underwater. The explosions are different but the general properties still
apply. Because of the threat that underwater explosions pose to marine mammals it is
important to continue trying to determine what is safe for the animals (Richardson et al.,
1995). Again, the reason that this study is different is that the detonation was above
water with the measurements taken under water.
Richardson et al. (1995) also investigated what is called a Damage Risk Criteria.
The definition is the, “Maximum permissible peak pressure during exposure to 100
impulses over an interval of at least 4 minutes on one day” (Richardson et al., 1995). The
DRC for a marine mammal according to Richardson et al. (1995) might be between 178
and 208 dB re 1 µpa (Richardson et al. 1995). This value is just an estimate but it gives
insight into the sound produced by the charge. The intensity of the broadband
frequencies (Figure 11) is around this intensity. The DRC suggests that if the animal
was exposed to 100 sound impulses of this intensity in four minutes then damage would
43
occur (Richardson et al., 2008). As long as Fort Richardson allows significant time in
between charges, the DRC would not be an issue.
If Fort Richardson plans their activities carefully the effects can be minimized
(Richardson et al., 1995). This careful attention applies to equipment and facility design,
the timing of the activity, the location of the activity and operational procedures
(Richardson et al., 1995). It would be advisable for Fort Richardson to think about the
last three of these factors. To carefully time the activity, more information about when
the animals are in the area is necessary. Information on when the animals are more
vulnerable to a noise disturbance would also be important to know. The location of the
activity can be slightly modified in this case. If an activity was absolutely necessary then
it could be moved as far inland on the flats as possible. Operational procedures include
things like monitoring for marine mammals around the time of the activity. This is an
obvious precaution that can be taken by Fort Richardson. When the scientists traveled to
the area they made sure that there were no visual observations of any marine mammals in
the area. Obviously, the animals will not always be spotted but careful observation for a
set period of time before the activity begins would be advisable.
It is likely that even if the sound doesn’t have a very large impact on the animal if
it is added to other stressors there might be a rather large cumulative effect. These other
stressors can include being bycatch in fisheries, habitat destruction and degradation,
interactions with boats, along with other stressors (Weilgart 2008). If all of these
stressors act together on an animal they have the potential to have a fatal effect on the
animals
44
In addition, the feeding habits of a population are important in understanding their
dynamics. The response of harbor porpoise prey to a noise could also have an effect on
the harbor porpoise. If fish are disturbed then there can be a disturbance to those animals
that prey upon the fish. The State of Alaska states that the harbor porpoise feed on
herring, capelin, pollock and eulachon which come to the area in very large numbers.
The number of salmon in the Cook Inlet is estimated to be around 10 million (State of
Alaska, 1999). Since the hearing threshold is different for fish, they are more apt to be
impacted by the type of noise created by the detonation from Fort Richardson. If the
harbor porpoise eat the salmon or cohabitate with the fish they might be secondarily
affected by the noise. If a species in their environment changes behavior or location then
the harbor porpoise might be affected as well. They too might have to change their
behavior and might be disturbed and adversely affected by the noise. In a study by
Hawkins and Johnstone (1978), Salmon had behavioral responses to frequencies below
350 Hz. The Department of the Navy also states that fish exposed to 300 Hz at 180 dB
for an hour have experienced physiological damage. The type of sound produced by the
C4 plastique would not create a sound with the same duration but could impact the fish in
the area.
The cumulative effects on the harbor porpoise have the potential to cause the most
damage. As long as Fort Richardson takes the proper precautions and pledges to be alert
to changes in marine mammal behavior and migration patterns I think that the charges
can continue. There are other issues that accompany using Fort Richardson for artillery
including the chemical pollution in addition to the noise pollution. I think it is important
to start monitoring and surveying the marine mammals in the area to attempt to establish
45
a baseline. If monitoring continues then scientists can understand how the animals
respond to the activities.
One area for future research is coming up with a better understanding of the four
zones of influence of the noise in the Knik Arm. Richardson et al. (1995) state that there
are different pieces of information needed to determine these zones that include: source
levels and characteristics of the noise, how the sound attenuates as it moves through the
medium, the ambient noise level and the hearing and response thresholds for the harbor
porpoise (Richardson et al., 1995). We have this information but it would be useful to
determine these zones of influence.
Another topic for future research is to study the harbor porpoise population in the
area. Most of the research in the area has focused on the beluga whales, much less is
known about the harbor porpoises. Skov et al. (2008) agree that more information needs
to be gathered about the actual population dynamics and distribution of this species.
Without a better understanding of where these animals actually spend time one cannot
avoid these areas and protect the harbor porpoise.
There are many options for a study of harbor porpoise population. A study that
involves the technique and tagging of Westgate et al. (1998) would give scientists a better
idea of when the harbor porpoises spend time in the area, the range of the population and
the behavior of the porpoises. Skov et al. (2008) used models and data collected from
surveys to understand the population of harbor porpoise in the Horns Reef area of
Denmark. Another method to determine population size and variability through space and
time is using acoustic data (Akamatsu et al., 2007). Surveys can record the acoustic data
and thus be used to monitor the population of harbor porpoises. Acoustic data has been
46
used in the past to monitor harbor porpoise density as it was used to monitor density as a
wind farm was built (Carstensen et al. 2006).
If one of these studies determined that a population migrates from another area
and spends time at Fort Richardson only during certain seasons, detonations could be
planned accordingly to minimize the impact on this mammal. It would also be important
to understand the movement of the population to understand the dangers the animals face
in all of their metapopulations. It is important to look at populations and their
conservation throughout their range and determine potential negative impacts. Westgate
et al. (1998) found that the harbor porpoises from the Bay of Fundy had a much wider
range than what was previously thought. This group of porpoises also mixes with
porpoises throughout the range (Westgate et al., 1998). In the case of the Bay of Fundy
population this range makes management more difficult as it involves both the United
States and Canada.
This type of study applied to the harbor porpoises of the Cook Inlet would help
scientists learn about their long term movement (Westgate et al., 1998). Skov et al.
(2008) determined with their study that the species preferred areas of upwelling which
confirmed results from previous studies. This study was an important attempt to
understand how the distribution of harbor the porpoise varies through space and time
(Skov et al., 2008).
Research on the actual effects and responses of marine mammals to noise are
extremely important to this field and will aid government agencies and environmentalists
in creating restrictions and regulations for marine mammal protection (Richardson et al.
1995).
47
Acknowledgments
Thanks to Dr. Michael Darre of Animal Science at the University of Connecticut and
former graduate student Sara Tremblay for advising me on this thesis. Also thanks to Dr.
Pete Scheifele of the University of Cincinnati who started me on the project, was part of
the team to collect the data and continued to answer questions as I completed my thesis.
48
References
Akamatsu, T., Hatakeyama, Y., Kojima, T. and Soeda, H. 1994. Echolocation rates of
two harbor porpoises (Phocoena phocoena). Marine Mammal Science, 10(4), 401-
411.
Akamatsu, T., Teilmann, J., Miller, L.A., Tougard, J., Dietz, R., Wang, D., Wang, K.,
Siebert, U., Naito, Y. "Comparison of Echolocation Behaviour between Coastal
and Riverine Porpoises." Deep-sea research. Part II, Topical studies in
oceanography 54.3-4 (2007): 290.
American Cetacean Society: Harbor Porpoise Fact Sheet. 2007. 10 March 2009.
<http://www.acsonline.org/factpack/HarborPorpoise.htmPhocoena phocoena>.
"Anchorage." Encyclopædia Britannica. 2008. Encyclopædia Britannica Online. 14 Apr.
2008 <http://www.britannica.com/eb/article-9007403>.
"Anchorage and Alaska Fun Facts." Anchorage Convention and Visitors Bureau. 2009. 7
Mar. 2009. <http://www.anchorage.net/686.cfm>.
Associated Press. "Setnetters tote beached baby porpoise to camp, render care."
Anchorage Daily News. 3 Aug. 2006. 10 Mar. 2009 <http://www.adn.
com/news/alaska/wildlife/marine/story/184024.html>.
Au, Whitlow W.L. The Sonar of Dolphins. 1993. Springer. New York NY.
Bibikov, N.G. "What do Evoked Potentials Tell Us about the Acoustic System of the
Harbor Porpoise?" Acoustical physics 50.3 (2004): 295.
Bradley, David. Stern, Richard. July 2008. “Underwater Sound and the Marine Mammal
Acoustic Environment: A Guide to Fundamental Principles.” US Marine Mammal
Commission.
49
"Court Restricts Navy's Use of Low-Frequency Active Sonar." Environment News
Service 12 Aug. 2008. 7 Mar. 2009 <http://www.ens-newswire.com/ens/aug
2008/2008-08-12-094.asp>.
Culik, Boris. "CMS: Phocoena phocoena, Harbor porpoise." Whales and Dolphins. 2003.
CMS. 10 Mar. 2009. <http://www.cms.int/reports/small_cetaceans/data/P_phocoe
na/p_phocoena.PDF>.
Dahlheim, M., York, A., Towell, R., Waite, J., Brewick, J. 2000. "Harbor Porpoise
(Phocoena Phocoena) Abundance in Alaska: Bristol Bay to Southeast Alaska,
1991-1993." Marine mammal science 16.1 (2000): 28-45.
Department of the Navy (2008). “Northwest Training Range Complex Draft
Environmental Impact Statement / Overseas Environmental Impact Statement.”
<http://www.nwtrangecomplexeis.com/Public%20DEIS%20files/Chapters %201-
3/Resource_Section_9_Marine_Mammals.pdf>.
Downey, Dave. "REGION: Military wants to be exempt from reserves." The Californian
9 Mar. 2009. 10 Mar. 2009 <http://www.northcountytimes.com/articles/2009/03/
09/news/sandiego/z8b30e6273d535b80882575710064b967.txt>.
Durrant, J., and J. Lovrinic. (1995). Bases of Hearing Science. 3rd
Ed. Baltimore:
Williams and Wilkins.
Finneran, . "Auditory and Behavioral Responses of Bottlenose Dolphins (Tursiops
Truncatus) and a Beluga Whale (Delphinapterus Leucas) to Impulsive Sounds
Resembling Distant Signatures of Underwater Explosions." The Journal of the
Acoustical Society of America 108.1 (2000): 417.
Google Maps. 2009. <http://maps.google.com/maps?sourceid=navclient&ie=UTF-
8&rlz=1T4GFRC_enUS216US216&q=google&um=1&sa=N&tab=wl>.
50
Halpin, James. “Army shells Eagle River Flats as prelude to year-round operation.”
Anchorage Daily News. 13 Feb. 2008. 7 Mar. 2009.
<http://www.adn.com/military/story/313477.html>.
"Harbor Porpoise (Phocoena phocoena)." NOAA Fisheries Office of Protected Resources
. 10 Mar. 2009 <http://www.nmfs.noaa.gov/pr/species/mammals/cetaceans
/harborporpoise.htm>.
Hawkins, A.D. and A.D.F. Johnstone (1978). The hearing of the salmon, Salmo salar.
Journal of Fish Biology 13 (6), 655-673.
Jenkins, Keith. Department of the Navy: Proposed Undersea Warfare Training Range.
“Fact Sheet No. 4: Understanding Effects on Marine Mammals.” 2005. 7 Mar.
2009. <http://projects.earthtech.com/USWTR/Public_Involvement/Public_
Involvement_2005/PDF_fact_sheets_2005/FS4-ESA-MMPA-2005.pdf>.
Kastelein. "Audiogram of a Harbor Porpoise (Phocoena Phocoena) Measured with
Narrow-Band Frequency-Modulated Signals." The Journal of the Acoustical
Society of America 112.1 (2002): 334.
Kaufman, Marc. "Navy, Environmentalists Await Sonar Ruling ." The Washington Post
1 Jan. 2008: A3. 10 Mar. 2009 <http://www.washingtonpost.com/wp-
dyn/content/article/2007/12/31/AR2007123101760.html>.
Laidre, K.L., Shelden, K.E.W., Rugh, D.J. and Mahoney, B.A. 2000. Beluga,
Delphinapterus leucas, distribution and survey effort in the Gulf of Alaska. Marine
Fisheries Review 62(3): 27-36.
NASA. Government Change Master Directory. NMML Harbor Porpoise Aerial Survey,
Cook Inlet 1991 . Ed. Lola Olsen. Mar. 2009. 10 Mar. 2009.
<http://gcmd.nasa.gov/records/GCMD_seamap131.html>.
NOAA. (2004). Report of the NOAA Workshop on Anthropogenic Sound and Marine
Mammals. NOAA-TM-NMFS-SWFSC-361.
51
Parsons, E.C.M. et al. 2008. "Navy Sonar and Cetaceans: Just how Much does the Gun
Need to Smoke before we Act?" Marine Pollution Bulletin 56.1248-1257.
Read, Andrew J. 1999. Handbook of Marine Mammals Volume 6: Chapter 12 Harbor
Porpoise. Academic Press.
Richardson, W. John. Marine Mammals and Noise. San Diego: Academic Press, 1995.
Scheifele, P. "Indication of a Lombard Vocal Response in the St. Lawrence River
Beluga." The Journal of the Acoustical Society of America 117.3 (2005): 1486.
Scheifele, Peter. Marine Mammal Bioacoustics Overview. University of Connecticut.
Animal Science Department. Fall 2007.
Scheifele, Peter. Sound Intensity and the Decibel. University of Connecticut.
Communications and Animal Sciences Department. Fall 2007.
Schiefele, Peter. Underwater Acoustics. University of Connecticut. Animal Science
Department and Neuroaudiology/Otology Departments. Fall 2007.
Scheifele, P., Andrew, S., Cooper, R.A., Darre, M., Musiek, F.E., Max, L. 2005.
Indication of a Lombard vocal response in the St. Lawrence River beluga. J.
Acoust. Soc. Am. 117:1486–1246.
Skov, . "Resolving Fine-Scale Spatio-Temporal Dynamics in the Harbour Porpoise
Phocoena Phocoena." Marine Ecology Progress Series 373 (2008): 173-186.
Speckmann, Suzann, and John F. Piatt. "Historic and Current use of Lower Cook Inlet,
Alaska, by Belugas, Delphinapterus Leucas." Marine fisheries review 62.3 (2000):
22. .
State of Alaska. Department of Natural Resources . "Chapter Three: Habitat, Fish and
Wildlife ." Cook Inlet Areawide 1999, Final Finding of the Director . By Lynn
Blessington. 30 July 1999. 10 Mar. 2009 <http://www.dog.dnr.state.ak.us/oil/
52
products/publications/cookinlet/ cia1999_final_finding/chap3.htm#b%20
Marine%20Mammals>.
Tremblay, Sara K. (2008). Master of Science Thesis. The Relationship of Land Based
Explosions Mimicking 155 mm Artillery on Offshore Beluga Whale Hearing
Threshold.
Tyack, P.L. 2008. "Implications for Marine Mammals of Large-Scale Changes in the
Marine Acoustic Environment." Journal of Mammalogy 89.3: 549-558.
United States of America . Department of Commerce . "Harbor Porpoise (Phocoena
phocoena): Gulf of Alaska Stock." Alaska Marine Mammal Stock Assessments,
2007. By R.P. Angliss and R.B. Outlaw. 122-126. Feb. 2008. National Oceanic
and Atmospheric Administration, National Marine Fisheries Service, Alaska
Fisheries Science Center. 10 Mar. 2009 <http://www.nmfs.noaa.gov/pr/pdfs/
sars/ak2007.pdf>.
United States of America . Department of the Navy. Selection of 180 dB as the Upper
Reference Point in the Risk Continuum for SURTASS LFA Sonar Signals.
SURTASS LFA . 10 Mar. 2009 <http://www.surtass-lfa-eis.com/docs/
180dBCriteria.pdf>.
Walsh, Michael. Eagle River Flats History. 21 May 2003. 7 Mar. 2009.
<http://www.crrel.usace.army.mil/erf/history/>.
Walsh, Michael. Eagle River Flats Maps: Area of Study. 21 May 2003. Eagle River
Flats Remediation Project Comprehensive Bibiliography – 1993 to 2003. ERDC-
CREEL. Hanover, NH: Technical Report.
Weilgart, L.S. 2007. "The Impacts of Anthropogenic Ocean Noise on Cetaceans and
Implications for Management." Canadian Journal of Zoology 85: 1091-1116.
Westgate, A.J. and A.J. Read. 1998. The application of new technology to the conservation
of porpoises. Marine Technology Society Journal 32: 70-81.

53
Wright, Andrew J. "What's All the Noise About? A Call for Lowering Underwater Noise
from Ships." Marine Technology Reporter (June 2008): 22-25.