Embed Size (px)
Citation preview
‘j’ and the Future of Commodity Price Forecasting
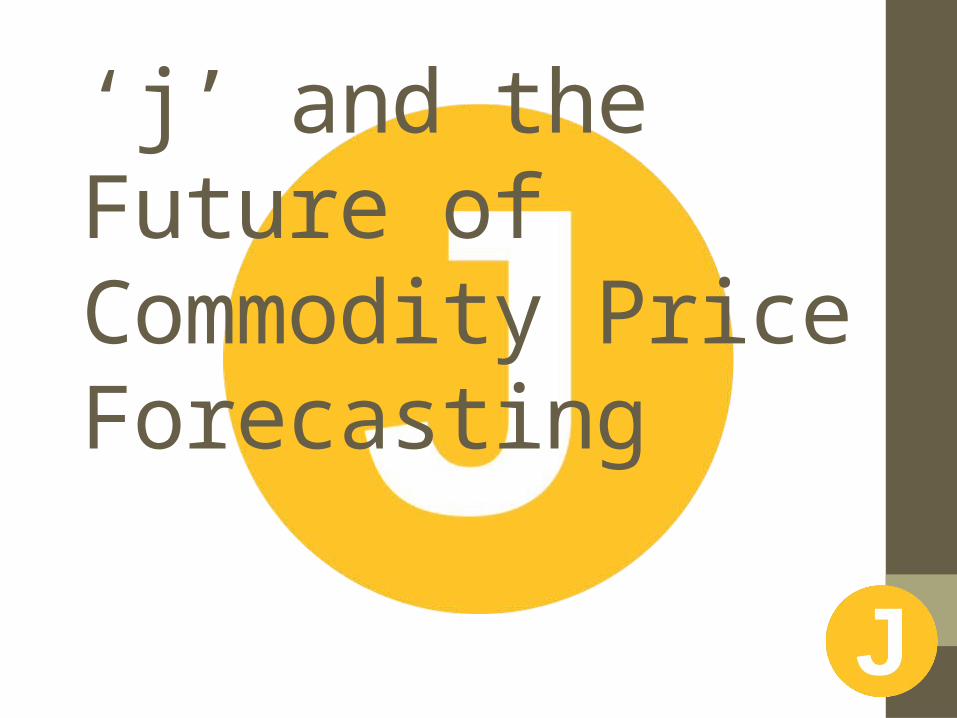
How Good are We at Forecasting Commodity Prices?
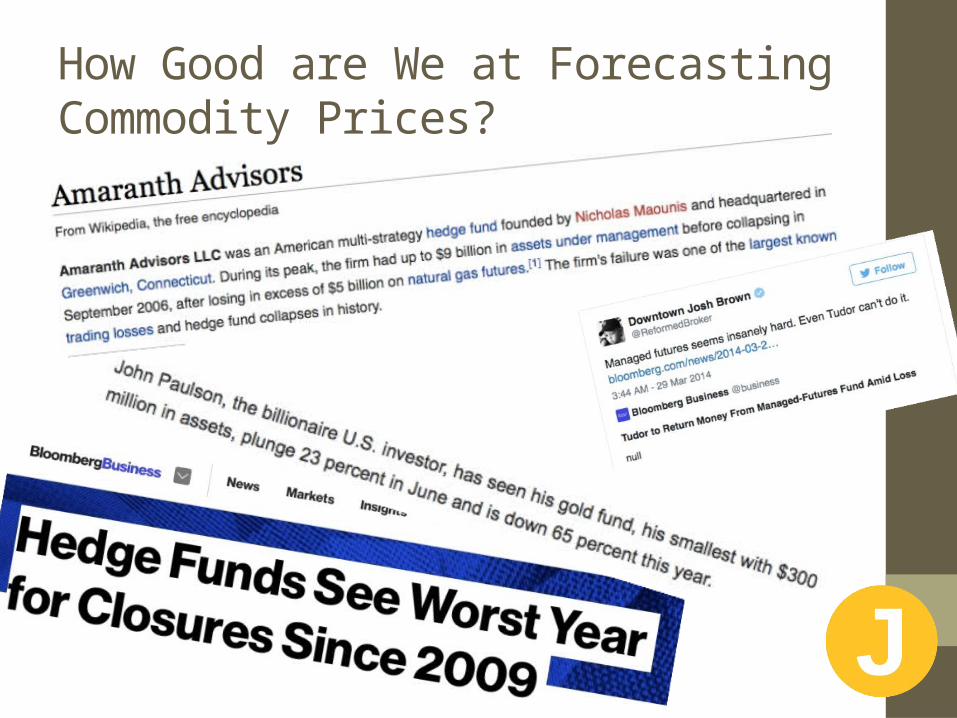
Most Upstream Commodity Producers Focus Elsewhere
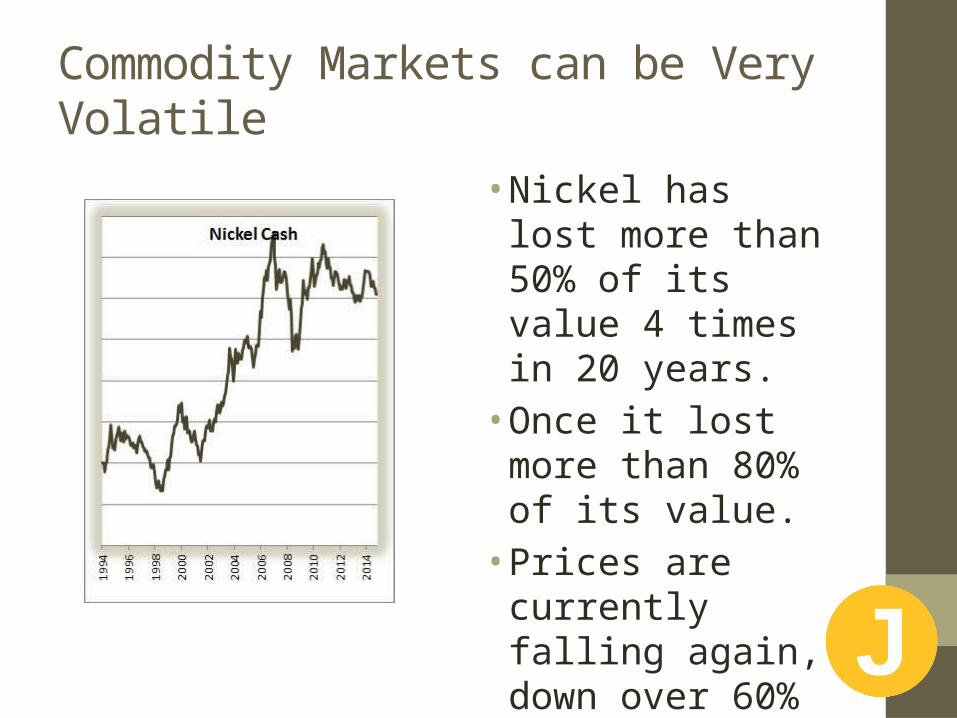
Commodity Markets can be Very Volatile
• Nickel has lost more than 50% of its value 4 times in 20 years.• Once it lost more
than 80% of its value. • Prices are currently
falling again, down over 60% from May 2014.
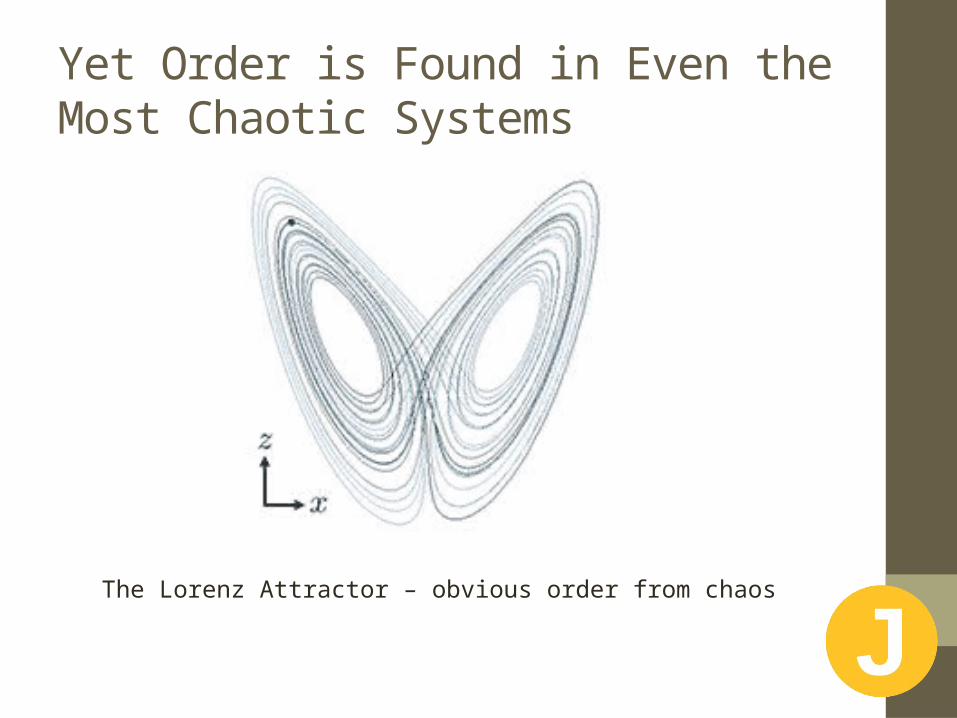
Yet Order is Found in Even the Most Chaotic Systems
The Lorenz Attractor – obvious order from chaos
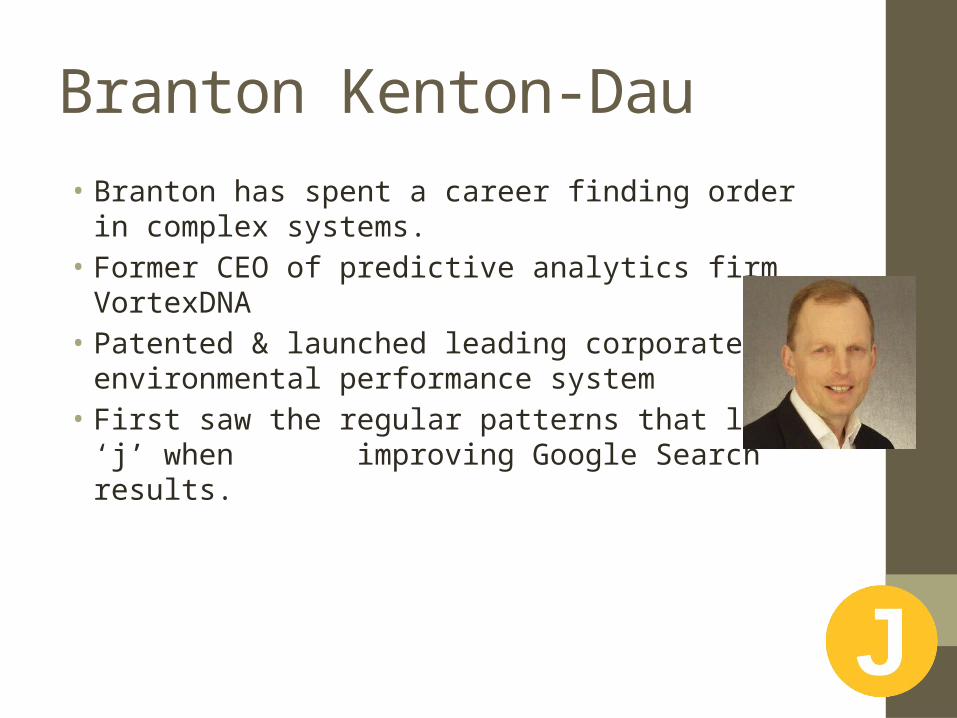
Branton Kenton-Dau• Branton has spent a career finding order in complex systems.• Former CEO of predictive analytics firm VortexDNA• Patented & launched leading corporate environmental
performance system• First saw the regular patterns that led to ‘j’ when improving
Google Search results.
The ‘j’ Discovery• The journey began in 2005 with the discovery of regular
patterns in Google Search click rates.• During the 2008 GFC regular patterns in the S&P500
capitalised on the 48% fall.• In 2010 Branton began working full time on the algorithm• August 2014: the ‘j’ algorithm was formalised and live signals
provided to a group of private and institutional investors.• A recent forecast: 25% rise in Rbob Gasoline between 30th
March – 24th April 2015.
What is ‘j’• ‘j’ is an algorithm that uses complex numbers to discover
order in the price movements of commodities.• The ‘j’ symbol is often used to denote the imaginary number
of a complex number equation.• Complex numbers are used to model data in other fields such
as electrical engineering, fluid dynamics and signal analysis.• ‘j’ sees order where other forms of analysis cannot.
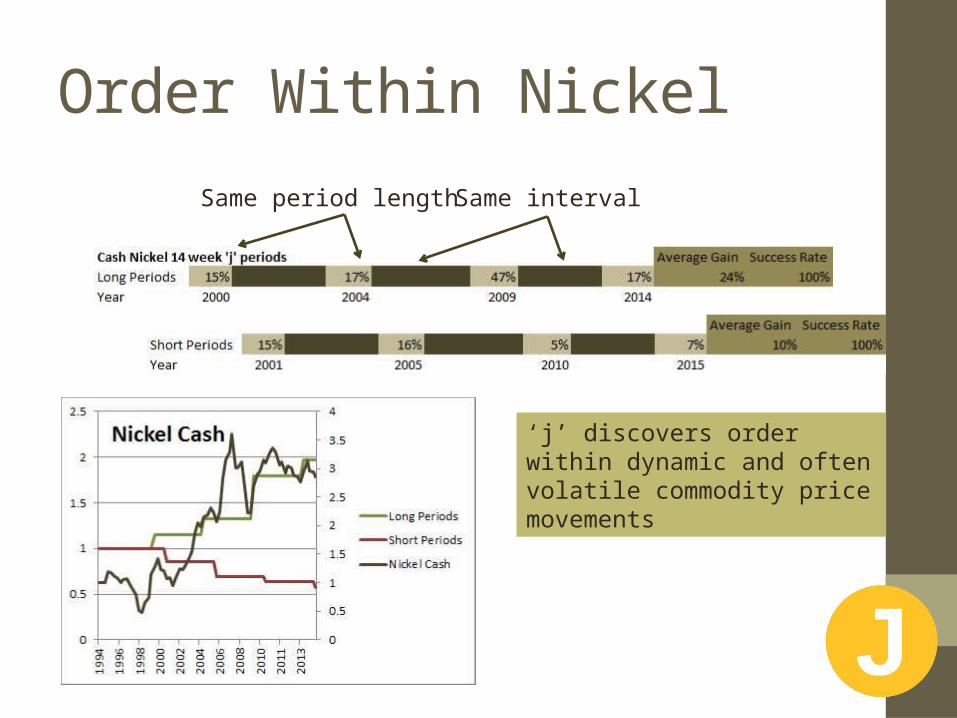
Order Within Nickel
Same intervalSame period length
‘j’ discovers order within dynamic and often volatile commodity price movements
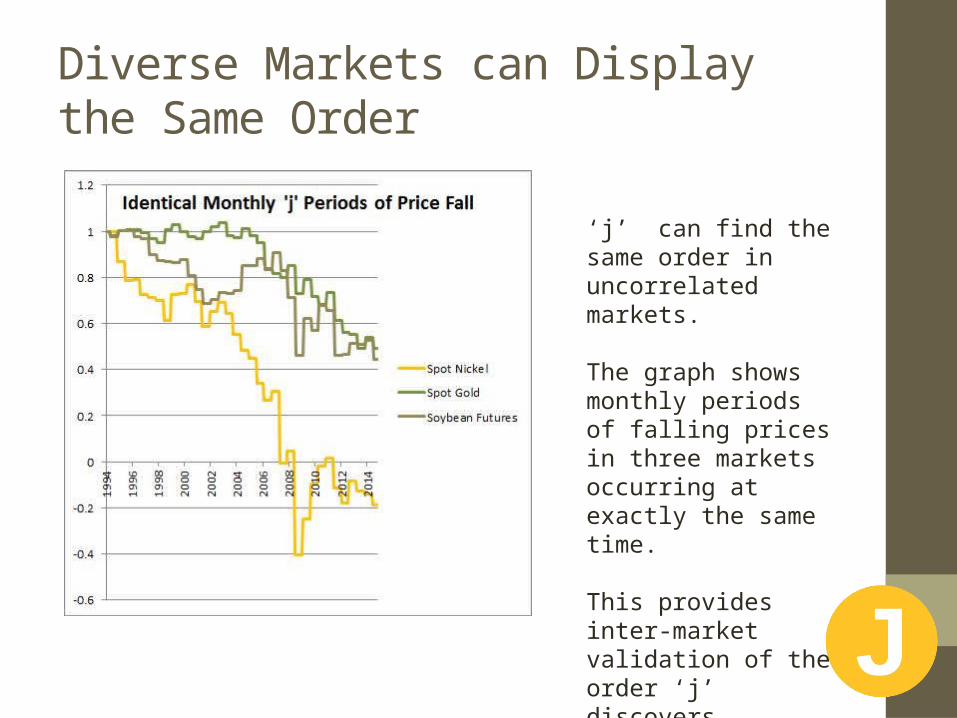
Diverse Markets can Display the Same Order
‘j’ can find the same order in uncorrelated markets.
The graph shows monthly periods of falling prices in three markets occurring at exactly the same time.
This provides inter-market validation of the order ‘j’ discovers.
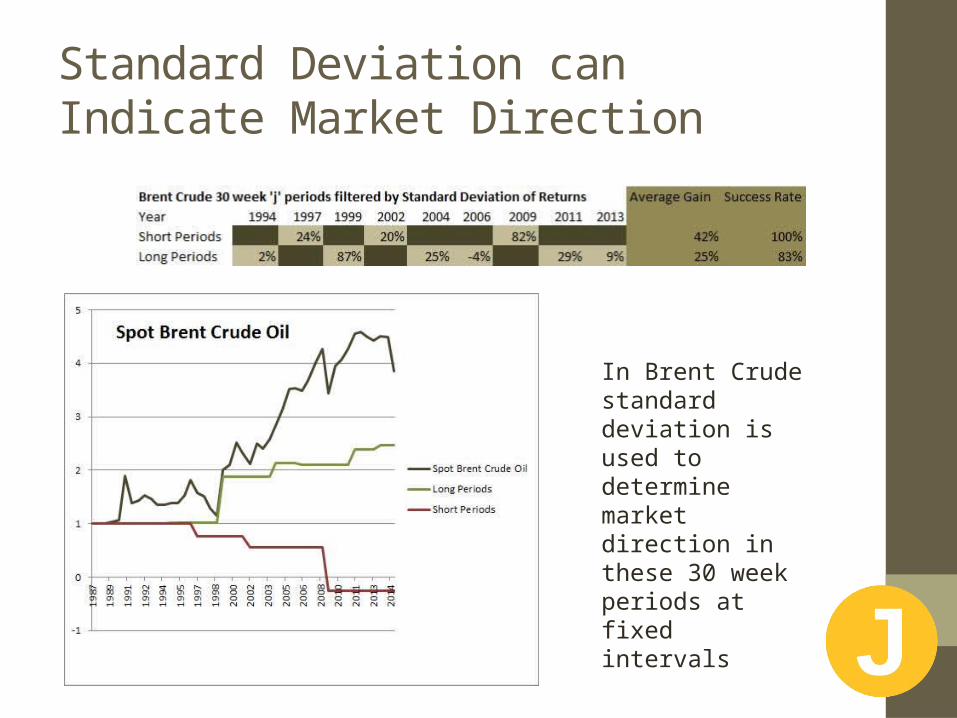
Standard Deviation can Indicate Market Direction
In Brent Crude standard deviation is used to determine market direction in these 30 week periods at fixed intervals
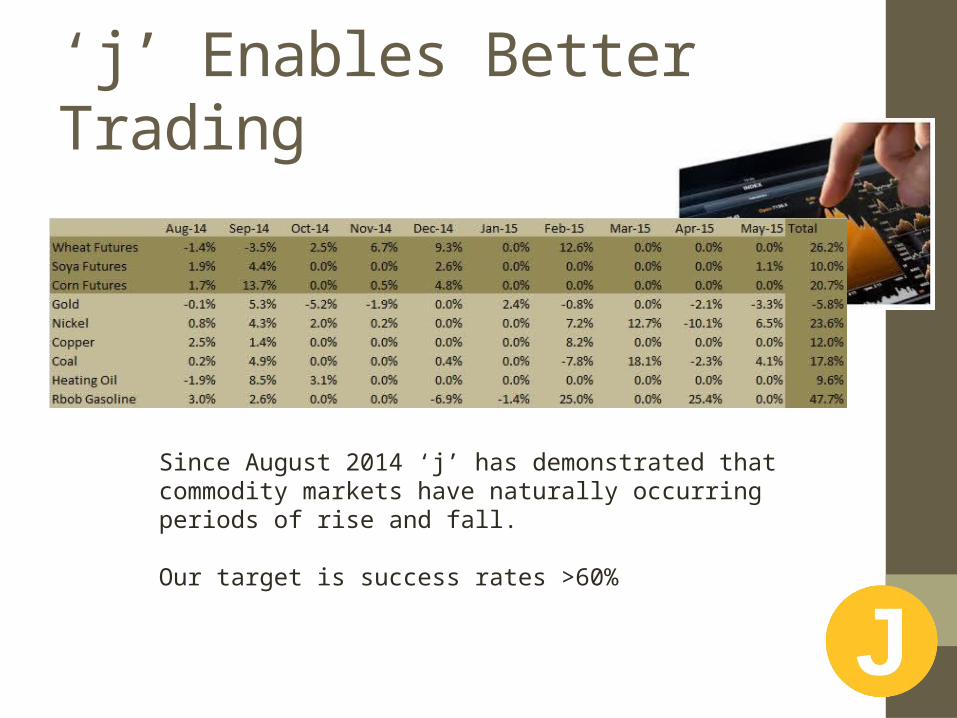
‘j’ Enables Better Trading
Since August 2014 ‘j’ has demonstrated that commodity markets have naturally occurring periods of rise and fall.
Our target is success rates >60%
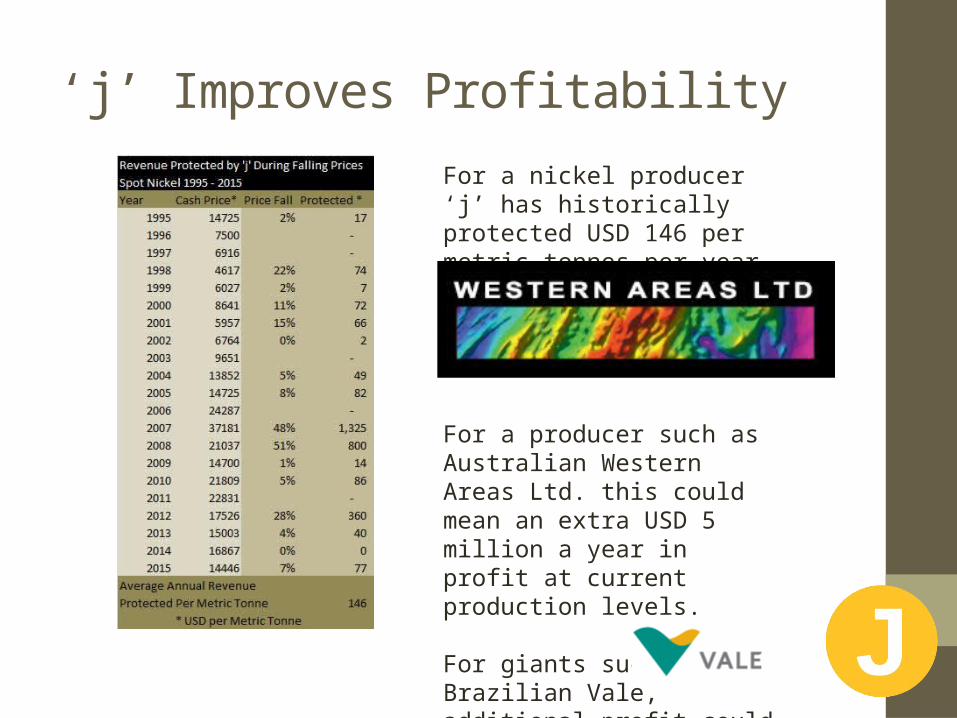
‘j’ Improves ProfitabilityFor a nickel producer ‘j’ has historically protected USD 146 per metric tonnes per year.
For a producer such as Australian Western Areas Ltd. this could mean an extra USD 5 million a year in profit at current production levels.
For giants such as Brazilian Vale, additional profit could reach USD 60 million a year.
Adding Value• ‘j’ can be used to trade any commodity, both long and short,
futures or spot.
• Upstream commodity producers can protect revenue by placing forward contracts during ‘j’ discovered periods of falling prices.
Pricing• Upstream commodity producers: 7% of historical benefit p.a.
Minimum subscription period: 2 years.
• Physical and Derivative Traders: 10% performance fee + 1% management fee. USD 60,000 advance of fees p.a.
• For other applications of ‘j’ please contact us.

We Look Forward to Talking With You
+64 22 101 [email protected] Mount Pleasant RoadChristchurch 8081New Zealand
www.kenton-dau.com
Coal producer Peabody Energy would have already added USD 81 million to its bottom line this year had it used the ‘j’ algorithm to time the placing of forward contracts…