Embed Size (px)
Citation preview

Item response theory and factor analysis as a mean to
characterize occurrence of response shift in a
longitudinal quality of life study in breast cancer
patients.
Amelie Anota, Caroline Bascoul-Mollevi, Thierry Conroy, Francis Guillemin,
Michel Velten, Damien Jolly, Mariette Mercier, Sylvain Causeret, Jean
Cuisenier, Olivier Graesslin, et al.
To cite this version:
Amelie Anota, Caroline Bascoul-Mollevi, Thierry Conroy, Francis Guillemin, Michel Velten, etal.. Item response theory and factor analysis as a mean to characterize occurrence of responseshift in a longitudinal quality of life study in breast cancer patients.. Health and Quality ofLife Outcomes, BioMed Central, 2014, 12 (1), pp.32. <10.1186/1477-7525-12-32>. <inserm-00997569>
HAL Id: inserm-00997569
http://www.hal.inserm.fr/inserm-00997569
Submitted on 28 May 2014
HAL is a multi-disciplinary open accessarchive for the deposit and dissemination of sci-entific research documents, whether they are pub-lished or not. The documents may come fromteaching and research institutions in France orabroad, or from public or private research centers.
L’archive ouverte pluridisciplinaire HAL, estdestinee au depot et a la diffusion de documentsscientifiques de niveau recherche, publies ou non,emanant des etablissements d’enseignement et derecherche francais ou etrangers, des laboratoirespublics ou prives.

RESEARCH Open Access
Item response theory and factor analysis as amean to characterize occurrence of response shiftin a longitudinal quality of life study in breastcancer patientsAmélie Anota1,2,3*, Caroline Bascoul-Mollevi4, Thierry Conroy1,5, Francis Guillemin1,6, Michel Velten1,7,
Damien Jolly1,8, Mariette Mercier1,3, Sylvain Causeret9, Jean Cuisenier9, Olivier Graesslin10, Zeinab Hamidou1,11
and Franck Bonnetain1,2,3
Abstract
Background: The occurrence of response shift (RS) in longitudinal health-related quality of life (HRQoL) studies,
reflecting patient adaptation to disease, has already been demonstrated. Several methods have been developed to
detect the three different types of response shift (RS), i.e. recalibration RS, 2) reprioritization RS, and 3)
reconceptualization RS. We investigated two complementary methods that characterize the occurrence of RS:
factor analysis, comprising Principal Component Analysis (PCA) and Multiple Correspondence Analysis (MCA),
and a method of Item Response Theory (IRT).
Methods: Breast cancer patients (n = 381) completed the EORTC QLQ-C30 and EORTC QLQ-BR23 questionnaires
at baseline, immediately following surgery, and three and six months after surgery, according to the “then-test/
post-test” design. Recalibration was explored using MCA and a model of IRT, called the Linear Logistic Model
with Relaxed Assumptions (LLRA) using the then-test method. Principal Component Analysis (PCA) was used to
explore reconceptualization and reprioritization.
Results: MCA highlighted the main profiles of recalibration: patients with high HRQoL level report a slightly
worse HRQoL level retrospectively and vice versa. The LLRA model indicated a downward or upward recalibration for
each dimension. At six months, the recalibration effect was statistically significant for 11/22 dimensions of the QLQ-C30
and BR23 according to the LLRA model (p ≤ 0.001). Regarding the QLQ-C30, PCA indicated a reprioritization of
symptom scales and reconceptualization via an increased correlation between functional scales.
Conclusions: Our findings demonstrate the usefulness of these analyses in characterizing the occurrence of RS. MCA
and IRT model had convergent results with then-test method to characterize recalibration component of RS. PCA is an
indirect method in investigating the reprioritization and reconceptualization components of RS.
Keywords: Health-related quality of life, Longitudinal analysis, Response shift, Factor analysis, Item Response Theory
* Correspondence: [email protected] of Life in Oncology Platform, Besançon, France2Methodological and Quality of Life Unit in Oncology, University Hospital of
Besançon, Besançon, France
Full list of author information is available at the end of the article
© 2014 Anota et al.; licensee BioMed Central Ltd. This is an Open Access article distributed under the terms of the CreativeCommons Attribution License (http://creativecommons.org/licenses/by/2.0), which permits unrestricted use, distribution, andreproduction in any medium, provided the original work is properly credited. The Creative Commons Public DomainDedication waiver (http://creativecommons.org/publicdomain/zero/1.0/) applies to the data made available in this article,unless otherwise stated.
Anota et al. Health and Quality of Life Outcomes 2014, 12:32
http://www.hqlo.com/content/12/1/32
BackgroundHealth-related quality of life (HRQoL) is a subjective
clinical endpoint that has been increasingly important
in health outcomes research and particularly in cancer
clinical trials over the past two decades [1] as well as in
breast cancer [2]. Although overall survival is still con-
sidered as the primary objective and the primary end-
point in many studies, most clinical trials now integrate
HRQoL as an endpoint in order to investigate the clin-
ical benefit for the patient.
One major objective of measuring HRQoL over time is
determining the extent to which treatment toxicities or
disease progression can affect patients’ HRQoL level.
However, self-assessment of HRQoL is subjective, i.e. it
is dependent on the patient's internal standards and def-
inition of HRQoL [3-5]. As patients can adapt to disease
and treatment toxicities, their health and HRQoL expec-
tations can also change over time. These changes could
result in a response shift (RS) effect [6-8].
RS can be defined as “a change in the meaning of one’s
self-evaluation of a target construct as a result of: (a) a
change in the respondent’s internal standards of meas-
urement (i.e. scale recalibration); (b) a change in the
respondent’s values (i.e. the importance of component do-
mains constituting the target construct, [reprioritization])
or (c) a redefinition of the target construct (i.e. reconcep-
tualization)” [9].
Different methods have been proposed to assess RS
[10-13]. The most widely used is the “Then-test”
method, which assesses patients’ pre-test HRQoL levels
retrospectively. The test involves asking patients post-
treatment to provide their current levels (post-test) but
also their pre-test levels in retrospect (then-test). This
method is based on the assumption that patients rate
their HRQoL post-test and pre-test levels with the same
criteria, since the assessments occur at the same time
point. The recalibration component of RS should thus
be taken into account when comparing post-test and
then-test scores. Comparing the mean of the pre-test
and then-test scores explores recalibration component
of RS [12].
Statistical methods have also been investigated to de-
tect RS. First, factor analyses have been explored to de-
tect RS [14,15]. An alternative to investigate RS with
factor analysis is the use of structural equation modeling
(SEM) [11,16,17]. These models can evaluate all types of
RS if they are experienced by a substantial part of indi-
vidual in the population analyzed [16]. These models are
based on means and covariance structures and rely on
observed scores. At this time and to our knowledge,
these models have never been applied to an European
Organization for Research and Treatment of Cancer
(EORTC) HRQoL questionnaire in order to highlight RS
effect. Principal Component Analysis (PCA) is a special
case of SEM. Item Response Theory (IRT) could also be
considered to explore RS effect but up to now these
models remain less applied and mainly through differential
item functioning [18,19]. Contrary to SEM, IRT models
are not based on the observed scores but directly on items
answers. In fact, in SEM, the raw score is assumed to be a
good representation of the latent trait (i.e. HRQoL), while
in IRT the items responses play a key role and the relation
between the items responses and the latent trait are not
linear in IRT.
While occurrence of RS in HRQoL studies has been
demonstrated [13], approaches that could reinforce the
proof that each component of RS occurs should be in-
vestigate to complement the results from other methods.
All methods that highlight RS have their strengths and
weaknesses then similar trend obtained from different
tools should increase accuracy of the results character-
izing RS occurrence and the confidence of the results.
Moreover, the studies to detect the occurrence of RS
are generally performed with two measurement time
points while in oncology clinical trials more than two
assessments is usually planned. Then we need also
tools for the longitudinal analysis of the potential oc-
currence of RS.
The intent of this study was thus to investigate statis-
tical methods to characterize the occurrence of RS for
HRQoL in breast cancer (BC) patients.
The primary objective was to assess if Multiple
Correspondence Analysis (MCA), which is a factor
analysis and a model of IRT named the Linear Logistic
model with Relaxed Assumptions (LLRA), had conver-
gent results with then-test method to characterize re-
calibration component of RS.
The secondary objective was to assess if Principal
Component Analysis (PCA), which is another factor
analysis model, could be a valuable tool to longitudin-
ally identify the reconceptualization and reprioritization
components of RS independently of the occurrence of the
recalibration component of RS.
MethodsPatients and eligibility criteria
A prospective, multicenter, randomized cohort study
was performed in the cancer care centers at Dijon,
Nancy, and the university hospitals of Strasbourg and
Reims (cities of France). It is a collaboration between
different teams with complementary skills and an inter-
est in the topic and all these teams are involved in qual-
ity of life research. All women initially hospitalized
between February 2006 and February 2008 for diagnosis
or treatment of primary or suspected BC were eligible
for inclusion. We anticipated that patients with no con-
firmed BC could constitute a control group. Neverthe-
less, due to the low effective (less than 10% of patients
Anota et al. Health and Quality of Life Outcomes 2014, 12:32 Page 2 of 18
http://www.hqlo.com/content/12/1/32

included) they could not constitute a larger control group
then they were excluded from the analyses. Women with
cancer other than BC, already undergoing BC treatment,
or with a previous history of cancer were excluded. Written
informed consent was obtained from every participant and
the protocol was approved by Dijon University Hospital
Ethics committee [20].
Health-related quality of life assessment
HRQoL was evaluated using the EORTC QLQ-C30 and
EORTC QLQ-BR23 BC specific tool at four time points:
at baseline (initial examination or initial hospitalization),
at discharge following initial hospitalization, at three
months (M3) and six months (M6) [21,22]. The QLQ-C30
and its BC module BR23 are validated tools in assessing
HRQoL in cancer, specifically in BC [21,22]. The QLQ-C30
comprises 30 items and measures five functional scales
(physical, role, emotional, cognitive and social functioning),
global health status (GHS), financial difficulties and eight
symptom scales (fatigue, nausea and vomiting, pain, dys-
pnea, insomnia, appetite loss, constipation, diarrhea) [22].
The BR23 module comprises 23 items that generate four
functional scales (body image, sexual functioning, sexual
enjoyment, future perspective) and four symptom scales
(systemic therapy side effects (STSE), breast symptoms,
arm symptoms, upset by hair loss) [22].
Response categories vary from 1 to 4 on a Likert scale
for the QLQ-C30 and BR23 questionnaires, with 1 cor-
responding to the best state for functional scales or no
symptoms, and 4 corresponding to the worst state for
functional scales or the highest symptomatic level. For
sexual dimensions, the response categories are reversed.
Scores are generated according to the EORTC Scoring
Manual [23]. These scores vary from 0 (worst) to 100
(best) for the functional dimensions and GHS, and from
0 (best) to 100 (worst) for the symptom dimensions.
A five-point difference in EORTC HRQoL scores is
considered as the minimal clinically important difference
(MCID) [24].
Then test assessment
In this study, the retrospective pre-test/post-test design
was used to detect recalibration [13]. At each follow-up
time point, one prospective and one retrospective meas-
urement were performed. The retrospective assessments
at the end of initial hospitalization and at M3 refer to
baseline HRQoL. At M6, the retrospective measurement
refers to HRQoL at M3. The order of the then-test and
post-test of HRQoL questionnaires was randomized with
a 1:1 allocation and stratification by center to assess the
impact of the order on RS occurrence and estimate. In
arm A, the order of the questionnaires was post-test/
then-test. In arm B, the order was then-test/post-test.
Authorization was obtained from the EORTC HRQoL
unit to adapt the HRQoL questionnaires (EORTC QLQ-
C30 and module BR23) to the then-test assessment. The
impact of the retrospective or prospective administration
of the questionnaire on RS occurrence has already been
analyzed in a previous paper showing no order effect
and is not treated in the present paper [20].
Treatments as well as clinical and sociodemographic
variables were recorded at inclusion.
Statistical analyses
Studied population and missing data
Variables collected at baseline were described with me-
dian and range for continuous variables and percentage
for qualitative variables, with percentage of missing
data. No imputation was performed on missing items.
Scores were calculated if at least half of the items were
answered according to the recommendations of the
EORTC scoring manual [23]. No imputation was performed
on missing scores.
MCA and LLRA were both performed on patients
with all items of the studied dimension (each dimension
of the QLQ-C30 and the QLQ-BR23) filled out at the
then-test and the pre-test measurement time points and
with a MCID between then-test and pre-test of at least 5
points for the given dimension. This selection was done
in order to retain a clinically meaningful difference of
the recalibration occurrence.
PCA were performed on patients with all scores avail-
able at the four prospective measurement times for one
questionnaire (QLQ-C30 or BR23).
For each analysis, patients retained were compared to
those excluded according to baseline characteristics in
order to check the random missing data profile and then
a possible selection bias.
Recalibration
For each score, the mean difference (MD) between each
then-test and the corresponding pre-test was calculated
and described as mean (SD). The existence of a signifi-
cant recalibration was tested with a Wilcoxon matched
pairs test. The effect size was calculated in order to as-
sess the magnitude of RS effect and was defined as the
mean change score between the then-test and the corre-
sponding pre-test dividing by the standard deviation of
patients at the prospective measurement time.
The primary objective was to assess if MCA and the
LLRA model of IRT had convergent results with the
then-test method to characterize the recalibration com-
ponent of RS.
Firstly, recalibration was thus explored by MCA [25].
MCA is a factor analysis dedicated to qualitative vari-
ables and can identify links between categories of polyto-
mous variables. This method is thus well adapted to the
items constructed on a Likert scale. This analysis was
Anota et al. Health and Quality of Life Outcomes 2014, 12:32 Page 3 of 18
http://www.hqlo.com/content/12/1/32
applied to items of each dimension according to the Then-
test method, i.e. with pre-test and then-test measures of the
same HRQoL. Only recalibration was explored with this
method since only one dimension was included. Therefore,
recalibration was confirmed by a correlation between two
different response categories of the same item measured at
pre-test and at then-test measurement time [26]. The study
was limited to the first two axes.
LLRA, a IRT model for measuring change, was then
applied to explore recalibration [27-30].
IRT and Classical Test Theory differ in terms of score
calculation. Classical Test Theory is mainly based on ob-
served scores while in IRT, item responses play the key
role: IRT models the item responses to the latent trait by
a probabilistic model. The raw score is thus not consid-
ered as a good representation of the latent trait but the
response to each item is considered directly. The relation-
ship between the observed score and the latent trait is no
longer linear. They are generally linked and modeled by a
logistic function. The IRT models introduce the concepts
of item easiness parameters and person parameters.
The person parameter corresponds to the level of the
patient on the latent trait (e.g. the level of HRQoL). The
item parameter is the location of the item on the latent
trait and corresponds to a level of difficulty or easiness
in this model.
The LLRA requires neither items’ unidimensionality
nor distributional assumptions about the population of
subjects [31]. In addition, the LLRA can fit with polyto-
mous responses and was developed in order to measure
the change occurring between several measurement time
points [32]. To give up the unidimensionality of the items,
items have to be measured at two measurement time
points or more [32,33].
The main idea of the LLRA model is not to consider
longitudinal change as a change in person parameters,
but rather as a change in item parameters. In this way,
person parameters are fixed over time and only item pa-
rameters vary. Since person parameters are nuisance pa-
rameters, we can estimate the item parameter trend
instead of the person parameter trend by conditional
maximum likelihood [34]. Indeed, fewer parameters have
to be estimated and they did not depend on the sample
considered.
One item I with parameter βi evaluated twice on an
individual can be seen as a pair of virtual items I*1 and
I*2 with two item parameters β*i1 and β*i2 respectively. For
the pre-test, β*i1 = βi while for the then-test β*i2 = βi + τ
where τ is the upward or downward trend effect of item
easiness parameter. This parameter is targeted by LLRA
[35]. In cases of polytomous items, for each item with
(m + 1) response categories there are m category param-
eters. The trend parameter τ is the same for each cat-
egory parameter. The design matrix was constructed
such that there is one trend parameter for each item. If
possible, the trend was generalized for all items of a di-
mension. The general form of LLRA, a longitudinal IRT
model adapted to polytomous items, is based on the
partial credit approach [35].
A positive (or negative) trend τ for one item implies
that the item easiness parameter increases (or decreases)
at the time of the then-test measurement compared to the
pre-test measurement. Patients choose higher (or lower)
response categories in the retrospective then-test measure
than in the prospective one for this item. In this way, re-
calibration would be indicated by a significant positive or
negative trend for one dimension.
Convergent results between MCA and IRT would
correspond to:
– a significant positive trend parameter for IRT and
some upward recalibration profiles highlighted by
MCA (i.e. patients choose upper response categories
at the then-test assessment as compared to the
prospective measurement time) more than some
downward recalibration profiles (patients choose
lower response categories at the then-test assessment
as compared to the prospective measurement time).
– a significant negative trend parameter for IRT and
some downward recalibration profiles highlighted by
MCA (patients choose lower response categories at
the then-test assessment) rather than some upward
recalibration profiles (patients choose upper
response categories at the then-test assessment).
– an insignificant trend parameter for IRT and
well-balanced recalibration profiles highlighted by
MCA (as many patients choose higher than lower
response categories at the retrospective measurement
time as compared to the prospective measure).
GHS was excluded from MCA and LLRA because of
the high number of response categories. There are seven
response categories for both items measuring GHS. To
apply a longitudinal model of IRT, all seven categories
have to be represented at each measurement time point,
which was not the case in the present study. GHS was
excluded from MCA in order to be consistent with IRT.
Reprioritization and reconceptualization
The secondary objective was to assess if PCA could be a
valuable tool to longitudinally identify the reconceptuali-
zation and reprioritization components of RS independ-
ently of the occurrence of recalibration component of RS.
PCA was performed on patients with all scores available
at all prospective measurement times and for one question-
naire (QLQ-C30 or BR23) on the scores generated for all
dimensions of each prospective questionnaire [12,14,15,36].
PCA was performed only for one questionnaire in order to
Anota et al. Health and Quality of Life Outcomes 2014, 12:32 Page 4 of 18
http://www.hqlo.com/content/12/1/32

have clear and understandable graphs. Reprioritization was
indicated by a change in scores generating the first two
principal components: scales generating the first principal
component are a priority to patients while those generating
the second principal component are secondary. Changes
occurring at the first principal component are considered
as major and those occurring at the second principal com-
ponent as minor. In this way, changes were qualified in the
first axis of “major reprioritization” and in the second axis
of “secondary reprioritization”. The study was limited to
the first two principal components, according to the Scree
test [37]. Reconceptualization was reflected by a change in
the structure of the graph of correlations between scores
and principal components, as well as in the connection or
opposition of some scores. Concerning the module BR23,
sexual enjoyment and hair loss were excluded from the
analysis given the number of missing values.
All analyses were performed with R software [38] using
FactoMineR library for factor analyses [39] and eRm library
for LLRA [34,35,40].
The statistical significance level was reduced to p = 0.002
for all analyses in order to prevent false positive results due
to the number of multiple comparisons performed (alpha
risk 0.05 divided by the number of dimensions analyzed).
ResultsPatients
Between February 2006 and February 2008, 381 patients
were included in the four participating centers. Mean
age was 58.4 (standard deviation = 11) years. Three hun-
dred and forty (89%) patients had confirmed BC. Complete
clinical and pathologic features of the population are given
in Table 1.
HRQoL questionnaires completion and missing data
Table 2 describes the number of completed QLQ-C30
and BR23 questionnaires at each measurement time.
317 (93%) patients had at least one HRQoL score at base-
line, 311 (91%) on discharge following initial hospitalization
(i.e. after surgery), 304 (89%) at M3 and 290 (85%) at M6.
Median time for HRQoL assessments between baseline
and the discharge following initial hospitalization was
6 days, range [1.5; 81.5].
Patients retained for MCA and LLRA with a 5-point
MCID were similar to those excluded according to base-
line characteristics for each analysis (data not shown).
Patients retained for PCA with all the four prospective
measurement times were similar to those excluded except
that they seem to be older (data not shown).
Recalibration
After surgery (Table 3), the recalibration effect was statisti-
cally and clinically significant for emotional functioning
(MD=5.36) and future perspectives (MD=7.41) dimensions
with a moderate effect size (0.21 and 0.24 respectively).
At M3, the recalibration effect was statistically and
clinically significant for role (MD = −6.50), emotional
(MD= 6.97) and social functioning (MD= −5.01), insomnia
(MD= −6.93), body image (MD= −8.16) and future per-
spectives (MD = 6.95) dimensions.
Table 1 Baseline patient characteristics
N %
Hospital
Dijon 271 71.1
Nancy 74 19.4
Reims 18 4.7
Strasbourg 18 4.7
Inclusion criteria
Confirmed primary breast cancer 242 63.5
Suspicion of primary breast cancer 138 36.2
Unknown 1 0.3
Cancer
Confirmed 340 89.2
Not confirmed 38 10.0
Unknown 3 0.8
Lymph node dissection(LND)
Axillary LND 138 36.2
Sentinel lymph node biopsy 131 34.4
ALND + SLNB 32 8.4
No LND 75 19.7
Unknown 5 1.3
Surgery type
Mastectmoy 124 32.6
No mastectomy 241 63.3
Unknown 16 4.2
Chemotherapy
Yes 155 40.7
No 218 57.2
Unknown 8 2.1
Radiotherapy
Yes 254 66.7
No 119 31.2
Unknown 8 2.1
Hormone therapy
Yes 170 44.6
No 203 53.3
Unknown 8 2.1
Questionnaires order
Arm 1: then-test/post-test 192 50.4
Arm 2: post-test/then-test 189 49.6
Anota et al. Health and Quality of Life Outcomes 2014, 12:32 Page 5 of 18
http://www.hqlo.com/content/12/1/32

At M6, the recalibration effect was statistically and
clinically significant for physical (MD = 5.10), role
(MD = 8.55) and social functioning (MD = 6.02) and for
fatigue (MD = −11.03), pain (MD = −6.02), insomnia
(MD= −5.64), body image (MD= 7.78) and breast symp-
toms (MD= −7.28).
Recalibration and MCA
All results obtained on the QLQ-C30 and QLQ-BR23
are summarized in Table 4 and in Table 5, respectively.
Qi_k (resp. Ri_k) refers to the k-th response category
of the i-th item of a prospective (resp. retrospective)
questionnaire on the graph.
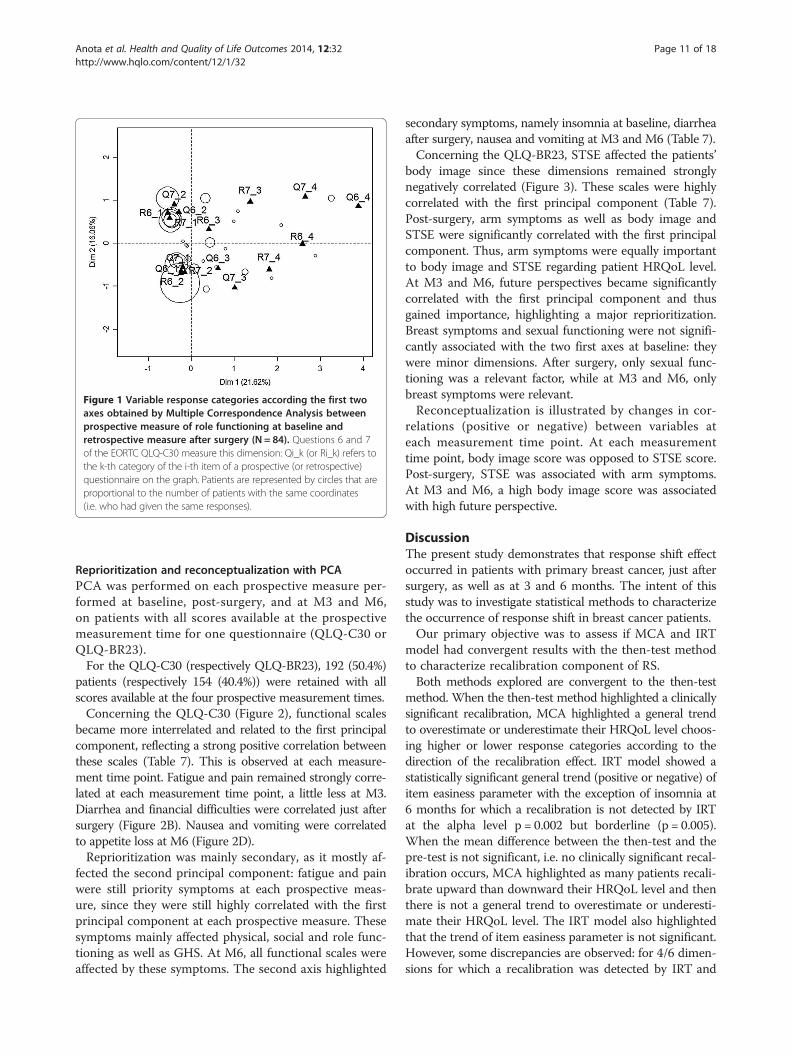
Figure 1 presents the graph obtained for baseline and
the then-test performed after surgery for role functioning.
272 patients answered the items 6 (Were you limited in
doing either your work or other daily activities?) and 7
(Were you limited in pursuing your hobbies or other
leisure time activities?) measuring the role functioning
scale at baseline and at the retrospective measurement
after surgery referring to the baseline HRQoL. Response
categories are coded “1/2/3/4” respectively for “Not at
all/A little/Quite a bit/Very much”. Among these patients,
84 (31%) had a MCID of at least 5 points between the
two measures. Figure 1 highlights two main patterns of
recalibration: patients who had reported an excellent
role functioning at baseline (i.e. had chosen response
category 1 for both items 6 and 7 at baseline) and who
had declared a slightly worse role functioning level
when they reevaluated this dimension retrospectively
after surgery (i.e. chose response category 2 for both
items 6 and 7 at the retrospective measurement time),
and vice versa (i.e. had chosen response category 2 for
both items 6 and 7 at baseline and had chosen response
category 2 for both items 6 and 7 at the retrospective
measurement time). The first profile is suggested by an
association between Q6_1, Q7_1, R6_2 and R7_2. The
reverse profile corresponds to the association between
Q6_2, Q7_2, R6_1 and R7_1. Recalibration profiles are
less explicit for patients who had reported a low role
functioning at baseline (i.e. had chosen response cat-
egory 3 or 4 for both items 6 and 7 at baseline). Indeed,
these patients are fewer and they did not follow a
unique recalibration profile. Patients who had reported
a relatively low role functioning at baseline (i.e. had
chosen response category 3 for both items 6 and 7 at
baseline) either tended to revise their opinion upwards
or downwards by choosing either response category 4
or response category 2 for both items 6 and 7 at the
retrospective assessment after surgery.
Recalibration and IRT using LLRA
Positive trend parameters (τ = +) indicated that at the
pre-test measurement, patients had overestimated their
functional level or had underestimated their symptom-
atic or sexual level.
Based on the first retrospective reassessment of their
baseline HRQoL (Table 6), patients had significantly
underestimated their emotional (τ = −0.62, p < 0.001)
and cognitive functioning (τ = −1.15, p < 0.001) and their
level of arm symptoms (τ = 0.64, p < 0.001). Patients also
had overestimated the presence of insomnia (τ = −0.49,
p = 0.001) and diarrhea (τ = −1.34, p < 0.001).
Based on the second retrospective reassessment of their
baseline HRQoL, patients had significantly overestimated
their role (τ = 0.71, p < 0.001) and social functioning
(τ = 0.66, p < 0.001), their body image (τ = 0.83, p < 0.001)
and insomnia level (τ = −0.49, p < 0.001) and had underes-
timated their level of pain (τ = 0.37, p = 0.001), and arm
symptoms (τ = 0.86, p < 0.001).
Regarding HRQoL at M3, patients had significantly
underestimated their physical (τ = −0.84, p < 0.001), role
(τ = −0.60, p < 0.001), cognitive (τ = −0.53, p < 0.001) and
social functioning (τ = −0.51, p < 0.001) as well as their body
image (τ = −0.66, p < 0.001). Patients also had overestimated
their emotional functioning (τ = 0.22) and their levels of
fatigue (τ = −0.54), pain (τ = −0.54), arm (τ = −0.37) and
breast (τ = −0.76) symptoms (p ≤ 0.001).
To summarize, after surgery, the recalibration effect
was statistically significant for 6/22 dimensions of the
QLQ-C30 and BR23 according to the IRT model while
for the then-test method it was only clinically signifi-
cant for 2 of these dimensions (emotional functioning
and future perspective). At M3, the recalibration effect
was statistically significant for 7/22 dimensions of the
QLQ-C30 and BR23 according to the IRT model and
to the then-test method except for the arm symptoms
(MD = 2.43, p = 0.011). At M6, the recalibration effect
was statistically significant for 11/22 dimensions of the
QLQ-C30 and BR23 according to the IRT model. The
same results were observed for the then-test method
except for the emotional (p = 0.054) and cognitive func-
tioning (p = 0.004) and the arm symptoms (p = 0.010). A
significant and clinically recalibration was also observed
according to the classical then-test method for insomnia
(MD = −5.64, p = 0.002) and not according to the IRT
model (p = 005).
Table 2 Description of the EORTC QLQ-C30 and BR23
questionnaires received at each measurement time
QLQ-C30 QLQ-BR23
Then-test Post-test Then-test Post-test
Baseline 359 (94.2%) 357 (93.7%)
After surgery 347 (91.1%) 347 (91.1%) 347 (91.1%) 346 (90.8%)
3 months 339 (90.0%) 342 (89.8%) 355 (87.9%) 340 (89.2%)
6 months 314 (82.4%) 322 (84.5%) 313 (82.1%) 322 (84.5%)
Anota et al. Health and Quality of Life Outcomes 2014, 12:32 Page 6 of 18
http://www.hqlo.com/content/12/1/32

Table 3 Recalibration component of response shift effect assessed with the then-test method at each measurement time
Baseline HRQoL Then-test 1 minus pre-test Then-test 2 minus pre-test HRQoL at three months Then-test 3 minus pre-test
N Mean (SD) N Mean (SD) P Effect size N Mean (SD) P Effect size N Mean (SD) N Mean (SD) P Effect size
QLQ-C30
Global Health Status 310 68.66 (20.52) 280 −0.80 (16.67) 0.600 −0.04 275 −4.21 (18.45) <0.001 −0.21 300 60.02 (20.19) 266 0.91 (21.30) 0.48 0.05
Physical functioning 313 90.01 (15.50) 283 −0.50 (10.78) 0.987 −0.03 280 −1.59 (13.26) 0.053 −0.11 301 81.31 (16.76) 273 5.10 (14.52) <0.001 0.31
Role functioning 309 89.28 (20.38) 281 −1.90 (18.70) 0.182 −0.09 282 −6.50 (23.72) <0.001 −0.32 300 74.06 (30.16) 269 8.55 (28.99) <0.001 0.30
Emotional functioning 308 64.86 (26.20) 279 5.36 (18.64) <0.001 0.21 280 6.97 (21.48) <0.001 0.27 300 72.80 (22.54) 270 −2.85 (24.55) 0.054 −0.11
Cognitive functioning 313 83.23 (20.76) 280 2.80 (14.97) 0.027 0.13 281 2.37 (18.27) 0.041 0.11 301 82.84 (21.11) 239 4.03 (20.80) 0.004 0.17
Social functioning 307 90.34 (18.88) 264 −0.51 (16.18) 0.644 −0.03 276 −5.01 (20.70) <0.001 −0.27 298 81.37 (25.42) 266 6.02 (25.77) <0.001 0.22
Fatigue 310 22.89 (22.92) 278 −1.48 (18.22) 0.039 −0.06 279 1.75 (20.92) 0.228 0.08 300 32.82 (24.08) 270 −11.03 (25.36) <0.001 −0.43
Nausea and vomiting 312 3.53 (11.18) 270 −0.77 (8.34) 0.130 −0.07 282 1.77 (15.11) 0.092 0.16 299 3.44 (10.90) 269 −3.22 (19.95) 0.010 −0.18
Pain 316 12.45 (20.87) 285 0.53 (19.04) 0.897 0.02 283 3.24 (23.03) 0.032 0.15 304 25.08 (24.82) 274 −6.02 (23.98) <0.001 −0.23
Dyspnea 310 11.72 (31.87) 280 −2.02 (15.19) 0.036 −0.09 279 −1.08 (15.58) 0.333 −0.05 301 12.86 (20.89) 269 −3.59 (24.08) 0.009 −0.15
Insomnia 307 38.11 (31.87) 277 −5.30 (27.14) 0.003 −0.17 274 −6.93 (30.94) <0.001 −0.22 299 36.63 (30.27) 266 −5.64 (32.59) 0.002 −0.18
Appetite loss 312 11.75 (22.46) 280 −3.45 520.35 0.005 −0.15 280 −1.19 (23.75) 0.323 −0.05 299 10.20 (20.13) 267 −4.62 (25.02) 0.004 −0.18
Constipation 310 12.47 (22.80) 276 −1.09 (21.15) 0.520 −0.05 277 1.56 (24.93) 0.284 0.07 298 21.38 (30.87) 264 −4.29 (26.61) 0.006 −0.16
Diarrhea 309 8.63 (16.48) 278 −2.88 (12.66) <0.001 −0.17 277 −2.89 (17.25) 0.010 −0.17 296 4.76 (12.30) 263 −0.63 (22.07) 0.483 −0.04
Financial difficulties 300 4.56 (14.60) 264 0.38 (12.83) 0.741 0.03 269 0.99 (16.51) 0.453 0.07 299 5.86 (15.93) 264 −2.15 (18.14) 0.048 −0.10
QLQ-BR23
Body image 295 90.04 (17.32) 262 −0.76 (11.95) 0.505 −0.05 257 −8.16 (16.96) <0.001 0.48 302 70.76 (30.77) 269 7.78 (24.82) <0.001 0.25
Sexual functioning 274 76.46 (24.01) 232 −0.50 (13.82) 0.207 −0.02 222 −1.21 (15.92) 0.206 −0.05 267 79.65 (22.06) 224 −4.69 (18.52) 0.002 −0.21
Sexual enjoyment 126 43.92 (28.79) 99 2.36 (11.91) 0.124 0.09 100 3.33 (22.97) 0.284 0.12 138 52.17 (29.31) 108 −1.54 (23.41) 0.548 −0.06
Future perspective 295 47.46 (30.86) 261 7.41 (30.60) <0.001 0.24 259 6.95 (32.47) <0.001 0.23 301 54.49 (32.76) 269 −0.12 (33.02) 0.968 −0.01
STSE 308 13.29 (15.30) 280 −1.71 (9.89) 0.008 −0.11 271 0.73 (13.84) 0.563 0.05 301 25.13 (20.20) 271 −4.76 (19.52) <0.001 −0.24
Breast symptoms 273 11.25 (14.92) 243 −0.73 (14.39) 0.152 −0.05 239 2.15 (19.76) 0.379 0.14 302 24.73 (22.97) 273 −7.28 (20.70) <0.001 −0.31
Arm symptoms 297 8.06 (14.42) 268 1.58 (18.49) 0.572 0.11 261 2.43 (16.53) 0.011 0.17 302 16.39 (18.54) 273 −2.71 (17.70) 0.010 −0.15
Hair loss 55 32.73 (36.57) 34 0.98 (17.38) 0.749 0.03 31 1.08 (25.07) 0.506 0.03 131 53.69 (39.78) 54 −8.03 (40.92) 0.173 −0.21
P: Wilcoxon matched test P value.
SD: standard deviation.
Results in bold correspond to clinically and statistically significant results.
Anota
etal.Health
andQuality
ofLife
Outco
mes
2014,12:32
Page7of18
http
://www.hqlo.co
m/co
ntent/1
2/1/32

Table 4 Main recalibration profiles highlighted by a multiple correspondence analysis performed on the EORTC QLQ-C30
Dimension (items) Time points N Percentage of recalibration(number of patients)
Recalibrationcategory 1 tocategory 2
Recalibrationcategory 2 tocategory 1
Recalibrationcategory 3 tocategory 4
Recalibrationcategory 4 tocategory 3
Categories 3 and4 dispersed
Physical functioning T1 - T2_Ra 100 37% (272) Q1-Q5 Q1-Q5 Q1-Q5
(Q1, Q5) T1 - T3_Rb 139 51% (274) Q1-Q5 Q1-Q5 Q1-Q5
T3 - T4_Rc 201 76% (266) Q1-Q5 Q1-Q5 Q1-Q5
Role functioning T1 - T2_R 84 31% (272) Q6, Q7 Q6, Q7 Q6, Q7
(Q6-Q7) T1 - T3_R 118 43% (274) Q6, Q7 Q6, Q7 Q6, Q7 Q6, Q7
T3 - T4_R 164 63% (261) Q6, Q7 Q6, Q7 Q6, Q7
Emotional functioning T1 - T2_R 180 68% (263) Q21-Q24 Q21-Q24
(Q21-Q24) T1 - T3_R 208 79% (263) Q21-Q24 Q21-Q24
T3 - T4_R 196 77% (255) Q21-Q24 Q21-Q24 Q21-Q24
Cognitive functioning T1 - T2_R 103 39% (266) Q20, Q25
(Q20, Q25) T1 - T3_R 129 48% (268) Q20, Q25 Q20, Q25 Q20, Q25 Q20, Q25 Q20, Q25
T3 - T4_R 130 51% (256) Q20, Q25 Q20, Q25 Q20, Q25 Q20, Q25
Social functioning T1 - T2_R 75 29% (260) Q26, Q27 Q26, Q27 Q26, Q27
(Q26, Q27) T1 - T3_R 101 38% (268) Q26, Q27 Q26, Q27 Q26, Q27 Q26, Q27
T3 - T4_R 142 56% (255) Q26, Q27 Q26, Q27 Q26, Q27 Q26, Q27 Q26, Q27
Fatigue T1 - T2_R 141 54% (259) Q10, Q12, Q18 Q10, Q12, Q18 Q10, Q12, Q18
(Q10, Q12, Q18) T1 - T3_R 160 61% (261) Q10, Q12, Q18 Q10, Q12, Q18 Q12 Q10, Q12, Q18 Q10, Q12, Q18
T3 - T4_R 183 73% (251) Q10, Q12, Q18 Q10, Q12, Q18 Q10, Q12, Q18 Q10, Q12, Q18
Nausea and vomiting T1 - T2_R 37 13% (280) Q14 Q14, Q15 Q14, Q15
(Q14, Q15) T1 - T3_R 65 24% (275) Q14 Q14 Q14
T3 - T4_R 98 37% (265) Q14 Q14
Pain T1 - T2_R 96 36% (267) Q9 Q9 Q9, Q19
(Q9, Q19) T1 - T3_R 124 46% (268) Q9, Q19 Q9, Q19 Q9, Q19
T3 - T4_R 148 58% (253) Q9, Q19 Q9, Q19 Q9, Q19
Insomnia T1 - T2_R 115 42% (277) Q11 Q11 Q11
(Q8) T1 - T3_R 135 49% (274) Q11 Q11 Q11 Q11
T3 - T4_R 147 55% (266) Q11 Q11 Q11 Q11
Dyspnea T1 - T2_R 50 18% (280) Q8 Q8 Q8
(Q11) T1 - T3_R 55 20% (279) Q8 Q8 Q8 Q8
T3 - T4_R 94 35% (269) Q8 Q8 Q8 Q8
Anota
etal.Health
andQuality
ofLife
Outco
mes
2014,12:32
Page8of18
http
://www.hqlo.co
m/co
ntent/1
2/1/32

Table 4 Main recalibration profiles highlighted by a multiple correspondence analysis performed on the EORTC QLQ-C30 (Continued)
Appetite loss T1 - T2_R 61 22% (280) Q13 Q13 Q13
(Q13) T1 - T3_R 85 30% (280) Q13 Q13 Q13
T3 - T4_R 90 34% (267) Q13 Q13 Q13
Constipation T1 - T2_R 71 26% (276) Q16 Q16 Q16 Q16
(Q16) T1 - T3_R 89 32% (277) Q16 Q16 Q16 Q16
T3 - T4_R 93 35% (264) Q16 Q16 Q16 Q16
Diarrhea T1 - T2_R 39 14% (278) Q17 Q17
(Q17) T1 - T3_R 64 23% (277) Q17 Q17
T3 - T4_R 61 24% (263) Q17 Q17 Q17
Financial difficulties T1 - T2_R 22 8% (264) Q28 Q28
(Q28) T1 - T3_R 33 12% (269) Q28 Q28 Q28
T3 - T4_R 47 18% (264) Q28 Q28 Q28
Only patients with a recalibration of 5-point at least between a pre-test and a then-test measure are incorporated in these analyses. Items with observed recalibration are listed.aT1→ T2_R: comparison of baseline HRQoL assessment and retrospective measure performed after surgery.bT1→ T3_R: comparison of baseline HRQoL assessment and retrospective measure performed three months later.cT3→ T4_R: comparison of HRQoL assessment at three months and retrospective measure performed three months later.
As example, 100 patients presented a significant recalibration of physical functioning among the 272 patients with all the five items of the dimension answered at both measurement time. The graph representing the
response categories highlight some recalibration profile:
- patients who had chosen response category 1 at the prospective measurement time for all the 5 items and who had chosen response category 2 to the same items at the retrospective measurement time.
- patients who had chosen response category 2 at the prospective measurement time for all the 5 items and who had chosen response category 1 to the same items at the retrospective measurement time.
- no recalibration profile is highlighted for response categories 3 and 4 and few patients had chosen these categories of response (these response categories are dispersed).
Anota
etal.Health
andQuality
ofLife
Outco
mes
2014,12:32
Page9of18
http
://www.hqlo.co
m/co
ntent/1
2/1/32

Table 5 Main recalibration profiles highlighted by multiple correspondence analysis performed on the QLQ-BR23 for patients with recalibration
N Percentage of recalibration(number of patients retained)
Recalibrationcategory 1 tocategory 2
Recalibrationcategory 2 tocategory 1
Recalibrationcategory 3 tocategory 2
Recalibrationcategory 3 tocategory 4
Recalibrationcategory 4 tocategory 3
Categories 3and 4 dispersed
Body image T1-T2_Ra 68 29% (236) Q9-Q12 Q9-Q12 Q9, Q10 Q9-Q12
(Q9-Q12) T1-T3_Rb 119 50% (238) Q9-Q12 Q9-Q12 Q9, Q12 Q9-Q12
T3-T4_Rc 153 63% (244) Q9, Q10 Q9, Q10 Q9-Q12
Sexual functioning T1-T2_R 55 25% (219) Q14 Q14
(Q14, Q15) T1-T3_R 71 34% (210) Q14 Q14, Q15
T3-T4_R 78 37% (213) Q14, Q15 Q14, Q15 Q14, Q15
Sexual enjoyment T1-T2_R 13 13% (99) Q16 Q16 Q16 Q16 Q16
(Q16) T1-T3_R 39 39% (100) Q16 Q16 Q16 Q16 Q16
T3-T4_R 33 31% (108) Q16 Q16 Q16 Q16 Q16
Future perspectives T1-T2_R 122 47% (261) Q13 Q13 Q13 Q13 Q13
(Q13) T1-T3_R 135 52% (259) Q13 Q13 Q13 Q13
T3-T4_R 144 54% (269) Q13 Q13 Q13 Q13
Systemic therapy side effects T1-T2_R 55 26% (209)
(Q1-Q4, Q6-Q8) T1-T3_R 61 32% (190)
T3-T4_R 77 39% (200)
Breast symptoms T1-T2_R 114 51% (223) Q20-Q23 Q20-Q23 Q20-Q23
(Q20-Q23) T1-T3_R 135 61% (223) Q20-Q23 Q20-Q23 Q20-Q23 Q20-Q23 Q20-Q23
T3-T4_R 190 74% (258) Q20-Q23 Q20-Q23 Q20-Q23 Q20-Q23
Arm symptoms T1-T2_R 97 38% (255) Q17-Q19 Q17-Q19 Q17-Q19
(Q17-Q19) T1-T3_R 111 46% (244) Q17-Q19 Q17-Q19 Q17 Q17-Q19
T3-T4_R 156 60% (260) Q17 Q17-Q19 Q17-Q19
Hair loss T1-T2_R 6 18% (34) Q5 Q5 Q5
(Q5) T1-T3_R 14 45% (31) Q5 Q5 Q5 Q5
T3-T4_R 24 44% (54) Q5 Q5 Q5 Q5
Only patients with a recalibration of 5-point at least between a pre-test and a then-test measure are incorporated in these analyses. Items with observed recalibration are listed.aT1→ T2_R: comparison of baseline HRQoL assessment and retrospective measure performed after surgery.bT1→ T3_R: comparison of baseline HRQoL assessment and retrospective measure performed three months later.cT3→ T4_R: comparison of HRQoL assessment at three months and retrospective measure performed three months later.
Anota
etal.Health
andQuality
ofLife
Outco
mes
2014,12:32
Page10of18
http
://www.hqlo.co
m/co
ntent/1
2/1/32
Reprioritization and reconceptualization with PCA
PCA was performed on each prospective measure per-
formed at baseline, post-surgery, and at M3 and M6,
on patients with all scores available at the prospective
measurement time for one questionnaire (QLQ-C30 or
QLQ-BR23).
For the QLQ-C30 (respectively QLQ-BR23), 192 (50.4%)
patients (respectively 154 (40.4%)) were retained with all
scores available at the four prospective measurement times.
Concerning the QLQ-C30 (Figure 2), functional scales
became more interrelated and related to the first principal
component, reflecting a strong positive correlation between
these scales (Table 7). This is observed at each measure-
ment time point. Fatigue and pain remained strongly corre-
lated at each measurement time point, a little less at M3.
Diarrhea and financial difficulties were correlated just after
surgery (Figure 2B). Nausea and vomiting were correlated
to appetite loss at M6 (Figure 2D).
Reprioritization was mainly secondary, as it mostly af-
fected the second principal component: fatigue and pain
were still priority symptoms at each prospective meas-
ure, since they were still highly correlated with the first
principal component at each prospective measure. These
symptoms mainly affected physical, social and role func-
tioning as well as GHS. At M6, all functional scales were
affected by these symptoms. The second axis highlighted
secondary symptoms, namely insomnia at baseline, diarrhea
after surgery, nausea and vomiting at M3 and M6 (Table 7).
Concerning the QLQ-BR23, STSE affected the patients’
body image since these dimensions remained strongly
negatively correlated (Figure 3). These scales were highly
correlated with the first principal component (Table 7).
Post-surgery, arm symptoms as well as body image and
STSE were significantly correlated with the first principal
component. Thus, arm symptoms were equally important
to body image and STSE regarding patient HRQoL level.
At M3 and M6, future perspectives became significantly
correlated with the first principal component and thus
gained importance, highlighting a major reprioritization.
Breast symptoms and sexual functioning were not signifi-
cantly associated with the two first axes at baseline: they
were minor dimensions. After surgery, only sexual func-
tioning was a relevant factor, while at M3 and M6, only
breast symptoms were relevant.
Reconceptualization is illustrated by changes in cor-
relations (positive or negative) between variables at
each measurement time point. At each measurement
time point, body image score was opposed to STSE score.
Post-surgery, STSE was associated with arm symptoms.
At M3 and M6, a high body image score was associated
with high future perspective.
DiscussionThe present study demonstrates that response shift effect
occurred in patients with primary breast cancer, just after
surgery, as well as at 3 and 6 months. The intent of this
study was to investigate statistical methods to characterize
the occurrence of response shift in breast cancer patients.
Our primary objective was to assess if MCA and IRT
model had convergent results with the then-test method
to characterize recalibration component of RS.
Both methods explored are convergent to the then-test
method. When the then-test method highlighted a clinically
significant recalibration, MCA highlighted a general trend
to overestimate or underestimate their HRQoL level choos-
ing higher or lower response categories according to the
direction of the recalibration effect. IRT model showed a
statistically significant general trend (positive or negative) of
item easiness parameter with the exception of insomnia at
6 months for which a recalibration is not detected by IRT
at the alpha level p = 0.002 but borderline (p = 0.005).
When the mean difference between the then-test and the
pre-test is not significant, i.e. no clinically significant recal-
ibration occurs, MCA highlighted as many patients recali-
brate upward than downward their HRQoL level and then
there is not a general trend to overestimate or underesti-
mate their HRQoL level. The IRT model also highlighted
that the trend of item easiness parameter is not significant.
However, some discrepancies are observed: for 4/6 dimen-
sions for which a recalibration was detected by IRT and
Figure 1 Variable response categories according the first two
axes obtained by Multiple Correspondence Analysis between
prospective measure of role functioning at baseline and
retrospective measure after surgery (N = 84). Questions 6 and 7
of the EORTC QLQ-C30 measure this dimension: Qi_k (or Ri_k) refers to
the k-th category of the i-th item of a prospective (or retrospective)
questionnaire on the graph. Patients are represented by circles that are
proportional to the number of patients with the same coordinates
(i.e. who had given the same responses).
Anota et al. Health and Quality of Life Outcomes 2014, 12:32 Page 11 of 18
http://www.hqlo.com/content/12/1/32

not significant according to the then-test method at the
first retrospective assessment, 1/7 at the second one, and
3/11 at the last retrospective assessment. Thus, the IRT
model detects more recalibration effect than the classical
then-test method.
MCA and IRT models highlight convergent results.
Based on the retrospective assessment of baseline HRQoL
after surgery and according to the LLRA, the trend of item
easiness parameter is insignificant for social functioning.
The corresponding MCA shows readjustment between re-
sponse categories 1 and 2 and between response categor-
ies 3 and 4. In this way, as many patients had chosen
higher than lower response categories at the retrospective
measurement time as compared to the baseline measure,
which is consistent with the LLRA. Based on retrospective
assessment of baseline HRQoL at 3 months and according
to the LLRA, patients had overestimated their body image
with a positive trend of item easiness parameter. Regard-
ing the corresponding MCA, it highlights a readjustment
from response categories 2 to response categories 3 and
from response categories 3 to response categories 4. In
this way, patients had chosen higher response categor-
ies at the retrospective measurement time compared to
the prospective measure indicating an overestimation
of body image at baseline. Based on the retrospective
assessment of the three months HRQoL at 6 months,
patients had overestimated their pain level with a negative
trend of item easiness parameter according to the LLRA.
Regarding the MCA performed on pain at the same meas-
urement times, it shows a recalibration between response
categories 1 and 2, and only from response categories 4 to
3, not from 3 to 4.
Table 6 Trend τ of item easiness parameter estimated by linear logistic model with relaxed assumptions for each
quality of life dimension
Dimension Items T1→ T2_Ra T1→ T3_Rb T3→ T4_Rc
N τ p N τ p N τ p
QLQ-C30
Physical functioning 1 – 4d 100 −0.02 0.858 139 0.27 0.004 201 −0.84 <0.001
Role functioning 6, 7 84 0.36e 0.011 118 0.71 <0.001 164 −0.60 <0.001
Emotional functioning 21 - 24 180 −0.62 <0.001 208 −0.65 <0.001 196 0.22 <0.001
Cognitive functioning 20, 25 103 −1.15 <0.001 129 −0.29 0.020 130 −0.53 <0.001
Social functioning 26, 27 75 0.07 0.791 101 0.66 <0.001 142 −0.51 <0.001
Fatigue 10, 12, 18 141 −0.19 0.280 160 0.23 0.019 183 −0.99 <0.001
Nausea and vomiting 14, 15 37 −0.60 0.022 65 0.50 0.029 98 −0.36 0.003
Pain 9, 19 96 0.11 0.410 124 0.37 0.001 148 −0.54 <0.001
Dyspnea 8 50 −0.60 0.025 55 −0.30 0.248 94 −0.42 0.014
Insomnia 11 115 −0.49 0.001 135 −0.49 <0.001 147 −0.36 0.005
Appetite loss 13 61 −0.59 0.004 85 −0.14 0.401 90 −0.51 0.003
Constipation 16 71 −0.16 0.392 89 0.17 0.295 93 −0.41 0.009
Diarrhea 17 39 −1.34 <0.001 64 −0.67 0.005 61 −0.09 0.641
Financial difficulties 28 22 0.16 0.630 33 0.25 0.322 47 −0.45 0.053
QLQ-BR23
Body image 9 - 12 68 0.10 0.489 119 0.83 <0.001 153 −0.66 <0.001
Sexual functioning 14, 15 55 0.06 0.950 71 0.33 0.078 78 0.77 0.010
Sexual enjoyment 16 13 −1.20 0.04 39 −0.43 0.14 33 0.19 0.49
Future perspective 13 122 −0.56 <0.01 135 −0.46 <0.01 144 0.01 0.95
STSE 1 - 4; 6 - 8 55 −0.40 <0.01 61 0.21 0.013 77 −0.74 <0.001
Breast symptoms 20 - 23 114 −0.11 0.07 135 0.36 0.01 190 −0.76 <0.001
Arm symptoms 17 - 19 97 0.64 <0.001 167 0.86 <0.001 156 −0.37 0.001
Hair loss Q5 6 0.22 0.738 16 0.12 0.808 24 −0.33 0.149
aT1→ T2_R: comparison of baseline quality of life assessment and retrospective measure performed after surgery.bT1→ T3_R: comparison of baseline quality of life assessment and retrospective measure performed three months later.cT3→ T4_R: comparison of quality of life assessment at three months and retrospective measure performed three months later.dQ5 was excluded because of the patients’ responses to this item at baseline: all patients chose either category 1 or 2 for this item at baseline, whereas all four
categories were represented on retrospective measures.eτ =0.364: patients significantly chose higher response categories at the retrospective measure of baseline HRQoL performed after surgery.
Anota et al. Health and Quality of Life Outcomes 2014, 12:32 Page 12 of 18
http://www.hqlo.com/content/12/1/32

The secondary objective was to assess if PCA could be
a valuable tool to longitudinally identify the reconceptu-
alization and reprioritization components of RS inde-
pendently of the occurrence of recalibration component
of RS. PCA indicated a reprioritization of the HRQoL
domains as evaluated by the QLQ-C30. Patients’ anxiety
probably related to the diagnosis of cancer and surgery
seemed to be a major concern at baseline before the
start of treatment, along with insomnia, which generated
the second principal component, after fatigue and pain,
which generated the first principal component. After
surgery, diarrhea symptoms increased in importance,
reflecting the impact of treatment. These results under-
line how patients adapt to their disease. At 3 months
and 6 months, nausea and vomiting were more import-
ant as compared to diarrhea, also reflecting the toxicities
of cancer treatment, especially chemotherapy. Regarding
the QLQ-BR23, patients with a high level of systemic
therapy side effects after surgery also tended to report a
high level of arm symptoms, which can be due to the re-
cent surgery. From 3 months, arm symptoms become less
important, while future perspectives gained importance
for primary breast cancer patients. Our results indicate
that there is no correlation between breast symptoms and
sexual functioning at 3 and 6 months.
No reprioritization was observed for the QLQ-C30
and QLQ-BR23 between the measures at M3 and M6.
Patients seemed to assess their HRQoL with the same
A B
C D
Figure 2 Graph representing the correlation between QLQ-C30 scores and the first two principal components of Principal Component
Analysis at each prospective measurement time (N = 192): at baseline (Panel A), just after surgery (Panel B), at three months (Panel C)
and at six months (Panel D). The QLQ-C30 measures five functional scales (physical functioning (pf), role functioning (rf), emotional functioning
(ef), cognitive functioning (cf), social functioning (sf)), global health status (GHS), financial difficulties (Fi) and eight symptom scales (fatigue (fa),
nausea and vomiting (na), pain (pa), dyspnea (dy), insomnia (in), appetite loss (A), constipation (CO), diarrhea (Dia)).
Anota et al. Health and Quality of Life Outcomes 2014, 12:32 Page 13 of 18
http://www.hqlo.com/content/12/1/32

relative importance at 6 months as they did at 3 months
suggesting that after treatment initiation they have a
more “stabilized” appreciation of HRQoL dimensions.
The reprioritization of symptomatic scales enables in-
terpretation of HRQoL levels and changes and impact of
treatments and disease on HRQoL. Then based on these
results we suggest that the occurrence of the reprioriti-
zation component of RS should be taken into account in
the interpretation of the results of the longitudinal analysis.
Deterioration of a scale, which becomes more important
over time for the patient, could have a strong impact on
patient’s overall HRQoL level and could indicate priority
for care. Conversely, deterioration of a scale, which for the
patient loses importance over time, could have a minor
impact on patient’s general HRQoL level.
Reconceptualization is reflected by changes in connec-
tions and contrasts between variables, and more generally
by changes in graph structure of PCA. The functional
scales of the QLQ-C30 became increasingly interrelated.
When one functional scale is affected by cancer treatment
or disease progression, then it is likely that all the other
functional scales are affected. Moreover, patients had asso-
ciated nausea and vomiting to appetite loss at 6 months.
These results suggest that PCA is an indirect method
in investigating the reprioritization and reconceptualiza-
tion components of RS.
The main limitation of this work is the use of the
Then-test as the standard method to explore recalibration.
The Then-test method is increasingly called into question
[41-43], mainly because it can induce a recall bias [13].
Indeed, the second reassessment of baseline HRQoL
was three months after baseline and the reassessment of
HRQoL at M3 was three months after the prospective
measure so it may induce a recall bias.
Schwartz et al. have proposed some guidelines to im-
prove the stringency of the Then-test method [41]. In
their paper, Schwartz et al. recommended to include a
control group, which would not susceptible to RS. As
RS is a treatment-dependent phenomenon, we tried to
constitute a control group including patients with only
a suspicion of BC. However, the number of patients
with no confirmed BC was not sufficient to constitute
Table 7 Correlation between quality of life scores and the first two first axis of principal component analysis on
prospective measures
Scores
T1: baseline T2: after surgery T3: 3 months T4: six months
First axis Second axis First axis Second axis First axis Second axis First axis Second axis
QLQ-C30 (N = 192)
GHS −0.74 0.17 −0.72 −0.06 −0.79 −0.09 −0.79 0.03
Physical functioning −0.76 −0.33 −0.76 0.01 −0.79 0.11 −0.81 0.03
Role functioning −0.85 −0.22 −0.81 −0.05 −0.85 −0.05 −0.87 0.01
Emotional functioning −0.46 0.71 −0.56 0.33 −0.68 0.31 0.73 0.23
Cognitive functioning −0.57 0.34 −0.69 0.01 −0.67 0.34 −0.70 0.23
Social functioning −0.71 −0.01 −0.70 0.13 −0.79 −0.01 −0.86 0.06
Fatigue 0.84 0.03 0.85 −0.01 0.90 0.02 0.87 0.02
Nausea and vomiting 0.63 0.01 0.56 0.18 0.46 0.70 0.40 0.69
Pain 0.77 0.19 0.81 0.07 0.69 −0.33 0.75 −0.02
Dyspnea 0.66 0.35 0.55 0.22 0.62 −0.14 0.67 −0.09
Insomnia 0.41 −0.63 0.54 −0.38 0.63 −0.15 0.63 −0.23
Appetite loss 0.51 −0.43 0.65 −0.11 0.61 0.46 0.48 0.66
Constipation 0.36 0.12 0.25 −0.42 0.44 0.37 0.42 0.25
Diarrhea 0.24 0.13 0.17 0.66 0.32 0.27 0.32 0.04
Financial difficulties 0.40 0.49 0.31 0.64 0.44 −0.11 0.38 −0.16
QLQ-BR23 (N = 154)
Body image −0.70 0.47 −0.64 0.45 −0.79 0.07 −0.79 0.25
Sexual functioning 0.30 −0.44 0.24 −0.52 0.31 −0.51 0.41 −0.41
Future perspective −0.31 0.46 −0.53 0.52 −0.76 0.25 −0.73 0.30
Systemic therapy side effects 0.78 −0.01 0.72 0.28 0.61 −0.49 0.67 −0.21
Breast symptoms 0.58 0.49 0.64 0.38 0.56 0.66 0.57 0.64
Arm symptoms 0.66 0.49 0.75 0.32 0.69 0.44 0.63 0.57
Anota et al. Health and Quality of Life Outcomes 2014, 12:32 Page 14 of 18
http://www.hqlo.com/content/12/1/32

a control group. Others explanations of detection of
RS effect could then also be formulated as social desir-
ability responding. This hypothesis cannot be verified
since a control group could not be constituted. As it
was recommended by Schwartz et al., we reported effect
sizes for recalibration in order to assess the magnitude
of RS effect. A Bonferroni correction of type I error
rate was performed in order to minimize false positive
conclusions. The guidelines also recommended to use
internal or external validation approaches as performance-
based, perception-based, and evaluation-based items/sub-
scales for internal validation of then-test results and clinical
measures indicating health state at baseline and follow-up
for external validation. However, we failed to include such
approaches in this present study. The instructions of the
retrospective questionnaires clearly indicate the patients to
think back to the referent time as advisable by Schwartz
et al. Moreover, the nomenclature used in this paper to
characterize the recalibration component of RS is those
recommended [41]. The Then-test method is based on
the assumption that patients rate their HRQoL post-test
and pre-test levels with the same criteria, since the as-
sessments occur at the same time point. A test of the
measurement invariance of the Then-test method would
be necessary in this study in order to validate the then-
test and to assess the possible recall bias due to its
retrospective nature. This would be planned in another
analysis using the Oort’s procedure [16,44].
Based on this study, substituting the then-test with the
LLRA and MCA to explore the recalibration component
of RS cannot be recommended at this time. Nevertheless,
IRT using LLRA could reinforce the Then-test method be-
cause of the improved interpretation of recalibration. This
model is effective, and the results are clearer, more explicit
A B
C D
Figure 3 Graph representing the correlation between QLQ-BR23 scores and the first two principal components of Principal
Component Analysis at each prospective measurement time (N = 154): at baseline (Panel A), just after surgery (Panel B), at three
months (Panel C) and at six months (Panel D). The QLQ-BR23 measures four functional scales (body image (BI), sexual functioning (SEXF),
sexual enjoyment (SE), future perspective (FP)) and four symptom scales (systemic therapy side effects (STSE), breast symptoms (BS), arm
symptoms (AS), upset by hair loss (HL)). SE and HL are excluded from these analyses.
Anota et al. Health and Quality of Life Outcomes 2014, 12:32 Page 15 of 18
http://www.hqlo.com/content/12/1/32
and easy to summarize and to interpret. These methods
should be used in other studies to validate their ability to
reinforce the then-test method.
SEM is often used nowadays to demonstrate RS
[11,16,17,45-48]. These models are not dependent on
the Then-test method. However, they are based on the
raw score and not on the items. In this way, IRT as
compared to SEM could be more informative. More-
over, at this time, SEM has never been applied to the
EORTC HRQoL questionnaires in order to highlight
occurrence of the response shift effect.
It would be interesting to compare the statistical method
described in the present study (factor analysis and IRT) to
SEM applied on prospective measure in another paper in
order to check their ability to capture all the three compo-
nents of RS. There is a need to investigate all these methods
using simulated data in order to establish differences using
these three methods.
Factor analysis presents the advantage of graphically
exploring all the components of RS. This visual repre-
sentation is interesting in order to explore reconceptual-
ization, which is the most conceptual component of the
RS effect. Moreover, at this time, few methods have been
proposed to identify this component [16] and in our
point of view no gold standard has emerged. In addition,
no additional questionnaires are required for exploring
reconceptualization and reprioritization. Thus, the use
of PCA on the scores of the main questionnaires seems
to be adequate in exploring these components. SEM is
also often used to assess these components. However,
our objective was to investigate the PCA method already
used in the past [14,15,36] and not to apply SEM. Indeed,
PCA is a special case of SEM.
IRT models and factor analysis are mostly used in the
development and validation of HRQoL questionnaires
[49-55]. However, several studies have begun to use IRT
in longitudinal studies of HRQoL [29,56-61], underscoring
the potential of these models in longitudinal analyses.
Moreover, longitudinal IRT model was used in order to
characterize recalibration component of RS. Few studies
have investigated RS using IRT while differential item
functioning based on IRT was also proposed as alternative
approach [18,62,63].
Finally, PCA were performed on patients with all scores
available at all the prospective measurement times. Only
40% to 50% of patients were thus retained in the analysis
but these patients were comparable to those excluded ac-
cording to baseline characteristics except there was an age
effect which may reflect a selection bias.
The data presented in this article confirm the potential
of IRT models in longitudinal HRQoL studies, especially
their ability to characterize more precisely the recali-
bration component of RS. Our data also underline
the interest of PCA to characterize reprioritization and
reconceptualization components of RS. These results
confirm the need to take recalibration into account
when comparing longitudinal HRQoL data between
patient groups and the need to explore the other com-
ponents in order to better interpret results [64,65].
The items of these questionnaire are prone to response
shift effect since they are evaluation-based items. Then
an objective assessment by the patient cannot be made.
Despite the fact that items of these questionnaires are
prone to RS effect. Some work is still needed to pro-
vide both a longitudinal analysis method easy to under-
stand for the clinician and to extract the potential
measurement bias due to the occurrence of a response
shift effect. Another solution would be to develop or
use other questionnaires not prone to response shift
effect with more performance-based items [41]. Future
studies should investigate the ability of these statistical
methods to capture all components of RS without the
then-test method.
Abbreviations
BC: Breast cancer; GHS: Global Health Status; EORTC: European Organization
for Research and Treatment of Cancer; HRQoL: Health-related quality of life;
IRT: Item response theory; LLRA: Linear logistic model with relaxed
assumptions; MCA: Multiple Correspondence Analyses; MCID: Minimal
clinically important difference; MD: mean difference; PCA: Principal
component analyses; RS: Response shift; SEM: Structural equation modeling;
STSE: Systemic therapy side effects.
Competing interests
The authors declare that they have no competing interests.
Authors’ contributions
AA performed the statistical analyses and interpretation and written the
manuscript, CBM interpreted the data and drafted the manuscript, TC, FG,
MV, DJ, MM, SC, JC, OG designed the study, SC, JC, OG included the patients,
ZH interpreted the data, FB designed the study, written protocol, managed
the statistical analyses, interpreted the data and review the draft. All authors
read and approved the final manuscript.
Acknowledgments
We thank Holly Sandu for correcting the manuscript. This work was
supported by a grant from the “Institut National du Cancer”. The study
sponsor had no role in the conception, the design of the study, the data
acquisition and analysis or in the manuscript preparation.
Author details1Quality of Life in Oncology Platform, Besançon, France. 2Methodological and
Quality of Life Unit in Oncology, University Hospital of Besançon, Besançon,
France. 3EA 3181, University of Franche-Comte, Besançon, France.4Department of Biostatistics, Institut Régional du Cancer Montpellier,
Montpellier, France. 5Medical Oncology Department, Centre Alexis Vautrin,
Nancy, France. 6Clinical Epidemiology and Evaluation Department, Inserm,
CIC-EC, and CHU, Nancy, France. 7Department of Epidemiology and Public
Health, Faculty of Medicine, EA 3430, University of Strasbourg, Strasbourg,
France. 8Pôle Recherche – Innovations, University Hospital of Reims, Reims,
France. 9Surgery Department, Centre Georges François Leclerc, Dijon, France.10Gynecological and Obstetric Department, Institut Mère Enfant, University
Hospital of Reims, Reims, France. 11Public health laboratory, EA 3279,
Aix-Marseille University, Marseille, France.
Received: 27 January 2014 Accepted: 1 March 2014
Published: 8 March 2014
Anota et al. Health and Quality of Life Outcomes 2014, 12:32 Page 16 of 18
http://www.hqlo.com/content/12/1/32

References
1. Osoba D: Health-related quality of life and cancer clinical trials. Ther Adv
Med Oncol 2011, 3:57–71.
2. Montazeri A: Health-related quality of life in breast cancer patients:
a bibliographic review of the literature from 1974 to 2007. J Exp Clin
Cancer Res 2008, 27:32.
3. Ubel PA, Peeters Y, Smith D: Abandoning the language of “response
shift”: a plea for conceptual clarity in distinguishing scale recalibration
from true changes in quality of life. Qual Life Res 2010, 19:465–471.
4. Wiklund I: Assessment of patient-reported outcomes in clinical trials: the
example of health-related quality of life. Fundam Clin Pharmacol 2004,
18:351–363.
5. Bullinger M: Assessing health related quality of life in medicine. An
overview over concepts, methods and applications in international
research. Restor Neurol Neurosci 2002, 20:93–101.
6. Gibbons FX: Social comparison as a mediator of response shift. Soc Sci
Med 1999, 48:1517–1530.
7. Howard GS, Dailey PR, Gulianick NA: The feasibility of informed pretests in
attenuating response shift bias. Appl Psychol Meas 1979, 3:481–494.
8. Howard GS, Ralph KM, Gulianick NA, Maxwell SE, Nance SW, Gerber SK:
Internal invalidity in pretest-posttest self-report evaluations and a
reevaluation of retrospective pretests. Appl Psychol Meas 1979, 3:1–23.
9. Sprangers MA, Schwartz CE: Integrating response shift into health
related quality of life research: a theoretical model. Soc Sci Med 1999,
48:1507–1515.
10. Korfage IJ, de Koning HJ, Essink-Bot ML: Response shift due to diagnosis
and primary treatment of localized prostate cancer: a then-test and a
vignette study. Qual Life Res 2007, 16:1627–1634.
11. Oort FJ, Visser MR, Sprangers MA: An application of structural equation
modeling to detect response shifts and true change in quality of life
data from cancer patients undergoing invasive surgery. Qual Life Res
2005, 14:599–609.
12. Schwartz CE, Sprangers MA: Methodological approaches for assessing
response shift in longitudinal health-related quality-of-life research.
Soc Sci Med 1999, 48:1531–1548.
13. Sprangers MA, Van Dam FS, Broersen J, Lodder L, Wever L, Visser MR,
Oosterveld P, Smets EM: Revealing response shift in longitudinal
research on fatigue–the use of the thentest approach. Acta Oncol
1999, 38:709–718.
14. Schmitt N: The use of analysis of covariance structures to assess beta
and gamma change. Multivar Behav Res 1982, 17:343–358.
15. Ahmed S, Mayo NE, Corbiere M, Wood-Dauphinee S, Hanley J, Cohen R:
Change in quality of life of people with stroke over time: true change or
response shift? Qual Life Res 2005, 14:611–627.
16. Oort FJ: Using structural equation modeling to detect response shifts
and true change. Qual Life Res 2005, 14:587–598.
17. King-Kallimanis BL, Oort FJ, Nolte S, Schwartz CE, Sprangers MA: Using
structural equation modeling to detect response shift in performance
and health-related quality of life scores of multiple sclerosis patients.
Qual Life Res 2011, 20:1527–1540.
18. Craig S: Measuring Change Retrospectively: An Examination Based on
Item Response Theory. In “Measuring Behavioral Change: Methodological
Considerations.” Symposium Presented at the Annual Conference of the Society
for Industrial and Organizational Psychology. Edited by Martineau J. ; 2000.
19. Meade AW, Ellington JK, Craig SB: Exploratory Measurement Invariance:
A New Method Based on Item Response Theory. In Symposium Presented
at the 19th Annual Conference of the Society for Industrial and Organizational
Psychology, Chicago, IL.; 2004.
20. Dabakuyo TS, Guillemin F, Conroy T, Velten M, Jolly D, Mercier M, Causeret S,
Cuisenier J, Graesslin O, Gauthier M, Bonnetain F: Response shift effects on
measuring post-operative quality of life among breast cancer
patients: a multicenter cohort study. Qual Life Res 2013, 22:1–11.
21. Aaronson NK, Ahmedzai S, Bergman B, Bullinger M, Cull A, Duez NJ, Filiberti A,
Flechtner H, Fleishman SB, de Haes JC, Kaasa S, Klee M, Osoba D, Ravasi D, Robe
PB, Schraub S, Sneeuw K, Sullivan M, Takeda F: The European Organization for
Research and Treatment of Cancer QLQ-C30: a quality-of-life instrument
for use in international clinical trials in oncology. J Natl Cancer Inst 1993,
85:365–376.
22. Sprangers MA, Groenvold M, Arraras JI, Franklin J, te Velde A, Muller M,
Franzini L, Williams A, de Haes HC, Hopwood P, Cull A, Aaronson NK: The
European Organization for Research and Treatment of Cancer breast
cancer-specific quality-of-life questionnaire module: first results from a
three-country field study. J Clin Oncol 1996, 14:2756–2768.
23. Fayers PM, Aaronson NK, Bjordal K, Groenvold M, Curran D: Bottomley
AobotEQoLG. In EORTC QLQ-C30 Scoring Manual. 3rd edition. EORTC; 2001.
edn; 2001.
24. Osoba D, Rodrigues G, Myles J, Zee B, Pater J: Interpreting the significance
of changes in health-related quality-of-life scores. J Clin Oncol 1998,
16:139–144.
25. Hoffman DL, De Leeuw J: Interpreting multiple correspondence analysis
as an multidimensional scaling method. Mark Lett 1992, 3:259–272.
26. Greenacre MJ: Interpreting multiple correspondence analysis. Appl
Stochastic Model Data Anal 2006, 7:195–210.
27. Fischer GH: Some Probabilistic Models for Measuring Change. In Advances
in Psychological and Educational Measurement. Edited by de Gruijter DNM,
van der Kamp LJT. New York: Wiley; 1976.
28. Fischer GH: Some Latent Trait Models for Measuring Change in
Qualitative Observations. In New Horizons in Testing. Latent Trait Theory and
Computerized Adaptive Testing. Edited by Weiss DJ. New York: Academic
Press; 1983.
29. Fischer GH, Ponocny I: An extension of the patial credit model with an
application to the measurement of change. Psychometrika 1994,
59:177–192.
30. Fischer G, Parzer P: An extension of the rating scale model with an
application to the measurement of change. Psychometrika 1991,
56:637–651.
31. Rasch G: Probabilistic Models for Some Intelligence and Attainment Tests. The
Danish Institute of Educational Research, Copenhagen: MESA Press; 1960.
32. Fischer GH: Linear Logistic Models for Change. Rasch Models. Foundations,
Recent Developments and Applications. New York: Springer; 1995.
33. Van der Linden WJ, Hambleton RK: Handbook of Modern Item Response
Theory. New York: Springer Verlag; 1997.
34. Mair P, Hatzinger R: CML based estimation of extended Rasch models
with the eRm package in R. Psychol Sci Q 2007, 49:26–43.
35. Mair P, Hatzinger R: Extended rasch modeling: the eRm package for the
application of IRT models in R. J Stat Softw 2007, 20:1–20.
36. Barclay-Goddard R, Epstein JD, Mayo NE: Response shift: a brief overview
and proposed research priorities. Qual Life Res 2009, 18:335–346.
37. Costello AB, Osborne JW: Best practices in exploratory factor analysis: four
recommendations for getting the most from your analysis. Pract Asses Res
Eval 2005, 10:173–178.
38. Development Core Team R: R: A Language and Environment for Statistical
Computing. R Foundation for Statistical Computing, Vienna, Austria. ISBN
3-900051-07-0. URL http://www.R-project.org/.
39. Lê S, Josse J, Husson F: FactoMineR: an R package for multivariate
analysis. J Stat Softw 2008, 25:1–18.
40. Hatzinger R, Rusch T: IRT models with relaxed assumptions in eRm: a
manual-like instruction. Psychol Sci Q 2009, 51:87–120.
41. Schwartz CE, Sprangers MA: Guidelines for improving the stringency of
response shift research using the thentest. Qual Life Res 2010, 19:455–464.
42. Schwartz CE, Rapkin BA: Understanding appraisal processes underlying
the thentest: a mixed methods investigation. Qual Life Res 2012,
21:381–388.
43. Visser MR, Oort FJ, Sprangers MA: Methods to detect response shift in
quality of life data: a convergent validity study. Qual Life Res 2005,
14:629–639.
44. Nolte S, Elsworth GR, Sinclair AJ, Osborne RH: Tests of measurement
invariance failed to support the application of the “then-test”. J Clin
Epidemiol 2009, 62:1173–1180.
45. Ahmed S, Bourbeau J, Maltais F, Mansour A: The Oort structural equation
modeling approach detected a response shift after a COPD self-management
program not detected by the Schmitt technique. J Clin Epidemiol 2009,
62:1165–1172.
46. Gandhi PK, Ried LD, Huang IC, Kimberlin CL, Kauf TL: Assessment of
response shift using two structural equation modeling techniques.
Qual Life Res 2013, 22:461–471.
47. Donaldson GW: Structural equation models for quality of life response
shifts: promises and pitfalls. Qual Life Res 2005, 14:2345–2351.
48. King-Kallimanis BL, Oort FJ, Visser MR, Sprangers MA: Structural equation
modeling of health-related quality-of-life data illustrates the measurement
and conceptual perspectives on response shift. J Clin Epidemiol 2009,
62:1157–1164.
Anota et al. Health and Quality of Life Outcomes 2014, 12:32 Page 17 of 18
http://www.hqlo.com/content/12/1/32

49. Edelen MO, Reeve BB: Applying item response theory (IRT) modeling to
questionnaire development, evaluation, and refinement. Qual Life Res
2007, 16(Suppl 1):5–18.
50. Floyd FJ, Widaman KF: Factor analysis in the development and refinement
of clinical assessment instruments. Psychol Assess 1995, 7:286–299.
51. Hambleton RK: Emergence of item response modeling in instrument
development and data analysis. Med Care 2000, 38:II60–II65.
52. Lai JS, Crane PK, Cella D: Factor analysis techniques for assessing sufficient
unidimensionality of cancer related fatigue. Qual Life Res 2006, 15:1179–1190.
53. McLachlan SA, Devins GM, Goodwin PJ: Factor analysis of the psychosocial
items of the EORTC QLQ-C30 in metastatic breast cancer patients participating
in a psychosocial intervention study. Qual Life Res 1999, 8:311–317.
54. Reise SP, Widaman KF, Pugh RH: Confirmatory factor analysis and item
response theory: two approaches for exploring measurement invariance.
Psychol Bull 1993, 114:552–566.
55. Smith AB, Wright P, Selby PJ, Velikova G: A rasch and factor analysis of the
functional assessment of cancer therapy-general (FACT-G). Health Qual
Life Outcomes 2007, 5:19.
56. Liu L, Hedeker D, Mermelstein R: Modeling nicotine dependence: an
application of a longitudinal IRT model for the analysis of adolescent
nicotine dependence syndrome scale. Nicotine Tob Res 2013, 15:326–333.
57. Blanchin M, Hardouin JB, Le Neel T, Kubis G, Blanchard C, Mirallié E, Sébille V:
Comparaison of CTT and rasch-based approaches for the analysis of
longitudinal patient reported outcomes. Stat Med 2011, 30:825–838.
58. Swartz RJ, Schwartz C, Basch E, Cai L, Fairclough DL, McLeod L, Mendoza TR,
Rapkin B: The king’s foot of patient-reported outcomes: current practices
and new developments for the measurement of change. Qual Life Res
2011, 20:1159–1167.
59. van Nispen RM, Knol DL, Neve HJ, van Rens GH: A multilevel item
response theory model was investigated for longitudinal vision-related
quality-of-life data. J Clin Epidemiol 2010, 63:321–330.
60. Douglas JA: Item response models for longitudinal quality of life data in
clinical trials. Stat Med 1999, 18:2917–2931.
61. Glas CA, Geerlings H, van de Laar MA, Taal E: Analysis of longitudinal
randomized clinical trials using item response models. Contemp Clin Trials
2009, 30:158–170.
62. Craig S: Implicit theories and beta change in longitudinal evaluations of
training effectiveness: an investigation using item response theory.
2002. Dissertation submitted to the Faculty of the Virginia Polytechnic
Institute and State University in partial fulfillment of the requirements for
the degree of Doctor of Philosophy.
63. Schwartz C, Martha J, Swaim B, Bode R, Kim D: Detecting response shift in
using rasch analysis of then test data. Qual Life Res 2007, A-15(suppl).
64. Bonnetain F, Dahan L, Maillard E, Ychou M, Mitry E, Hammel P, Legoux JL,
Rougier P, Bedenne L, Seitz JF: Time until definitive quality of life score
deterioration as a means of longitudinal analysis for treatment trials in
patients with metastatic pancreatic adenocarcinoma. Eur J Cancer 2010,
46:2753–2762.
65. Hamidou Z, Dabakuyo TS, Mercier M, Fraisse J, Causeret S, Tixier H, Padeano MM,
Loustalot C, Cuisenier J, Sauzedde JM, Smail M, Combier JP, Chevillote P,
Rosbuger C, Arveux P, Bonnetain F: Time to deterioration in quality of life
score as a modality of longitudinal analysis in patients with breast
cancer. Oncologist 2011, 16:1458–1468.
doi:10.1186/1477-7525-12-32Cite this article as: Anota et al.: Item response theory and factor analysisas a mean to characterize occurrence of response shift in a longitudinalquality of life study in breast cancer patients. Health and Quality of LifeOutcomes 2014 12:32. Submit your next manuscript to BioMed Central
and take full advantage of:
• Convenient online submission
• Thorough peer review
• No space constraints or color figure charges
• Immediate publication on acceptance
• Inclusion in PubMed, CAS, Scopus and Google Scholar
• Research which is freely available for redistribution
Submit your manuscript at www.biomedcentral.com/submit
Anota et al. Health and Quality of Life Outcomes 2014, 12:32 Page 18 of 18
http://www.hqlo.com/content/12/1/32