Embed Size (px)
Citation preview
ITEM Club special report on consumer spending May 2012
Ernst & Young ITEM Club i
Contents
Highlights ........................................ .................................................................................................................1
ITEM Club special report on consumer spending ..... ...................................................................................2
Introduction ................................................................................................................................................2
2011 was a tough year for the consumer… ...............................................................................................2
….following a severe squeeze on real household incomes .......................................................................3
This year should see some relief, as long as oil prices cool ......................................................................3
Tax changes should provide additional support to disposable income .....................................................4
Non-income factors should gradually become more supportive ................................................................8
The debt overhang will continue to cast a shadow… ................................................................................9
…and consumers should be prepared for interest rates to normalise .......................................................9
The consumer recovery should gradually build momentum ................................................................... 10
‘Discretionary’ spending will continue to be squeezed in short-term ...................................................... 11
Conclusion .............................................................................................................................................. 12
Appendix – consumer spending categories ........... ................................................................................... 13
Ernst & Young is the sole sponsor of the ITEM Club, which is the only non-governmental economic forecasting group to use the HM Treasury model of the UK economy. Its forecasts are independent of any political, economic or business bias.

Ernst & Young ITEM Club 1
Highlights • The consumer sector has endured a torrid five year period, with a combination of high inflation and
weak earnings growth causing a severe squeeze on household finances and a steep decline in spending. By the end of 2011 consumer spending was still almost 6% below the pre-recession peak, a marked contrast with previous recoveries when spending had risen well above previous peaks by this stage.
• The squeeze was at its most severe last year, but some light is emerging at the end of the tunnel. Inflation has already begun to cool and we expect the CPI measure to move back to the 2% target by the end of the year, providing that oil prices continue to ease, bringing prices back into line with wages. When personal tax changes are factored in, the situation looks better still, with the majority of consumers set to benefit from successive large increases in the income tax personal allowance which should ensure that most see real take-home pay stabilise this year and accelerate next. In nominal terms, the biggest winners are expected to be those earning between the median wage and the basic rate limit for income tax, although this year their advantage will be eroded by a higher relative inflation rate. The lowest and highest earners will not see any benefit from these changes.
• Stronger household finances and an improving economic backdrop should generate a gradual pickup in consumer spending from the middle of this year. Tourism activity around the Olympic Games is expected to provide a further boost, raising spending growth to 0.8% this year. As real incomes strengthen, growth is expected to accelerate to 1.1% in 2013. Spending growth should pick up further in subsequent years, as the wider recovery becomes more firmly entrenched. However, the consumer recovery will continue to be constrained by the need for households to deleverage further and then by the impact of higher debt servicing costs as interest rates begin to normalise and spending is not expected to return to previous peaks until mid-2015.
• High inflation in price inelastic spending categories such as food, housing and petrol have squeezed spending on more discretionary goods and services over the past couple of years, but these pressures should begin to weaken from this year. We expect the Recreation & Culture and Communications categories to continue to achieve the strongest spending growth, as rapid advancements in technology, development of new products and falling prices continue to underpin strong demand across a range of products.
Ernst & Young ITEM Club 2
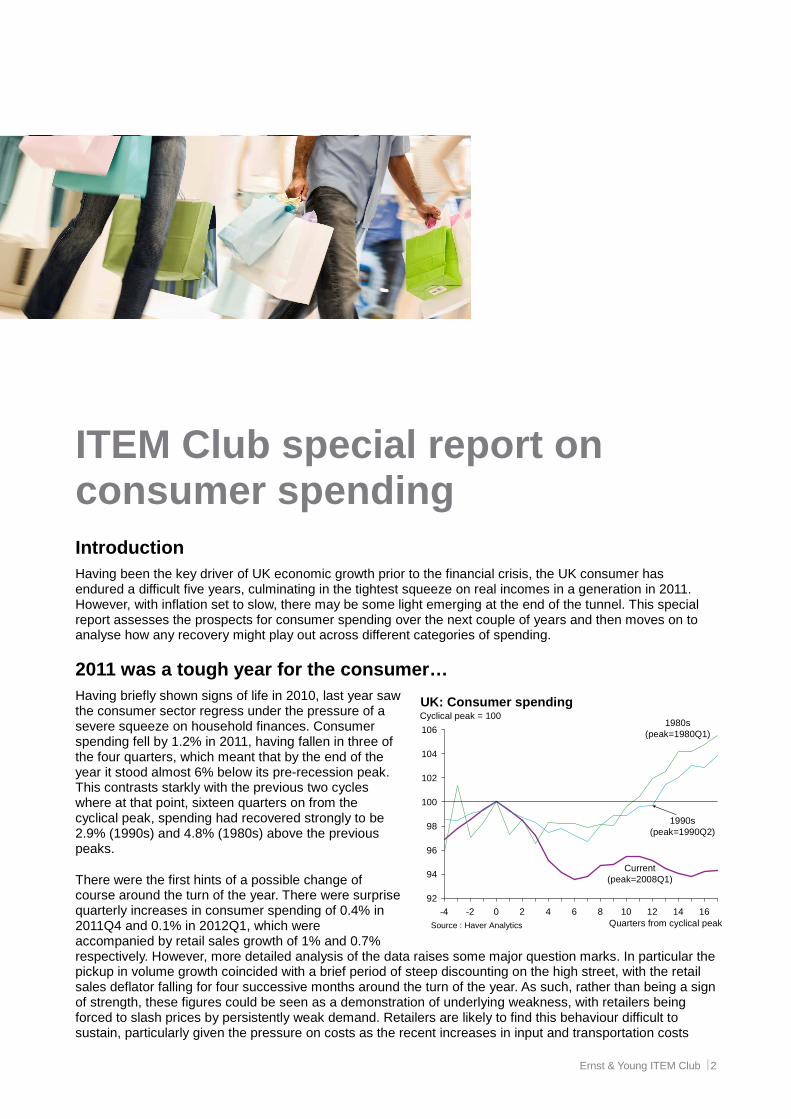
ITEM Club special report on consumer spending Introduction Having been the key driver of UK economic growth prior to the financial crisis, the UK consumer has endured a difficult five years, culminating in the tightest squeeze on real incomes in a generation in 2011. However, with inflation set to slow, there may be some light emerging at the end of the tunnel. This special report assesses the prospects for consumer spending over the next couple of years and then moves on to analyse how any recovery might play out across different categories of spending.
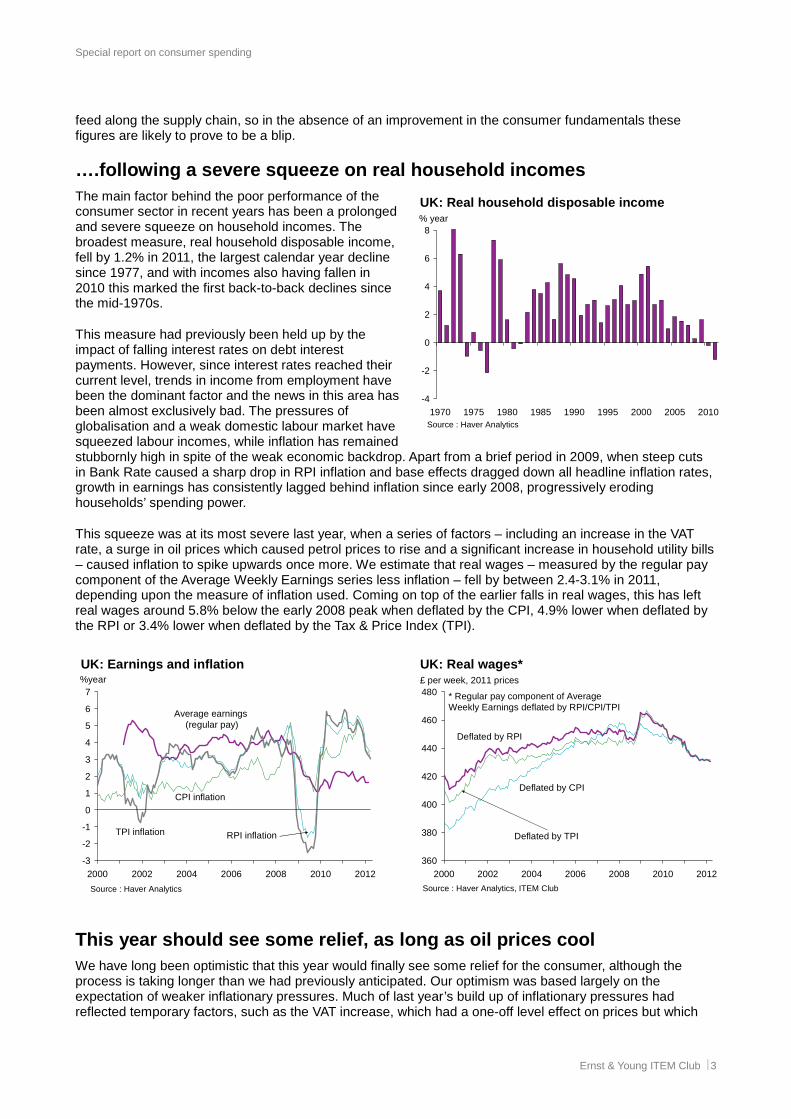
2011 was a tough year for the consumer… Having briefly shown signs of life in 2010, last year saw the consumer sector regress under the pressure of a severe squeeze on household finances. Consumer spending fell by 1.2% in 2011, having fallen in three of the four quarters, which meant that by the end of the year it stood almost 6% below its pre-recession peak. This contrasts starkly with the previous two cycles where at that point, sixteen quarters on from the cyclical peak, spending had recovered strongly to be 2.9% (1990s) and 4.8% (1980s) above the previous peaks.
There were the first hints of a possible change of course around the turn of the year. There were surprise quarterly increases in consumer spending of 0.4% in 2011Q4 and 0.1% in 2012Q1, which were accompanied by retail sales growth of 1% and 0.7% respectively. However, more detailed analysis of the data raises some major question marks. In particular the pickup in volume growth coincided with a brief period of steep discounting on the high street, with the retail sales deflator falling for four successive months around the turn of the year. As such, rather than being a sign of strength, these figures could be seen as a demonstration of underlying weakness, with retailers being forced to slash prices by persistently weak demand. Retailers are likely to find this behaviour difficult to sustain, particularly given the pressure on costs as the recent increases in input and transportation costs
92
94
96
98
100
102
104
106
-4 -2 0 2 4 6 8 10 12 14 16
UK: Consumer spendingCyclical peak = 100
Source : Haver Analytics
Current (peak=2008Q1)
1990s (peak=1990Q2)
1980s(peak=1980Q1)
Quarters from cyclical peak
Special report on consumer spending
Ernst & Young ITEM Club 3
feed along the supply chain, so in the absence of an improvement in the consumer fundamentals these figures are likely to prove to be a blip.
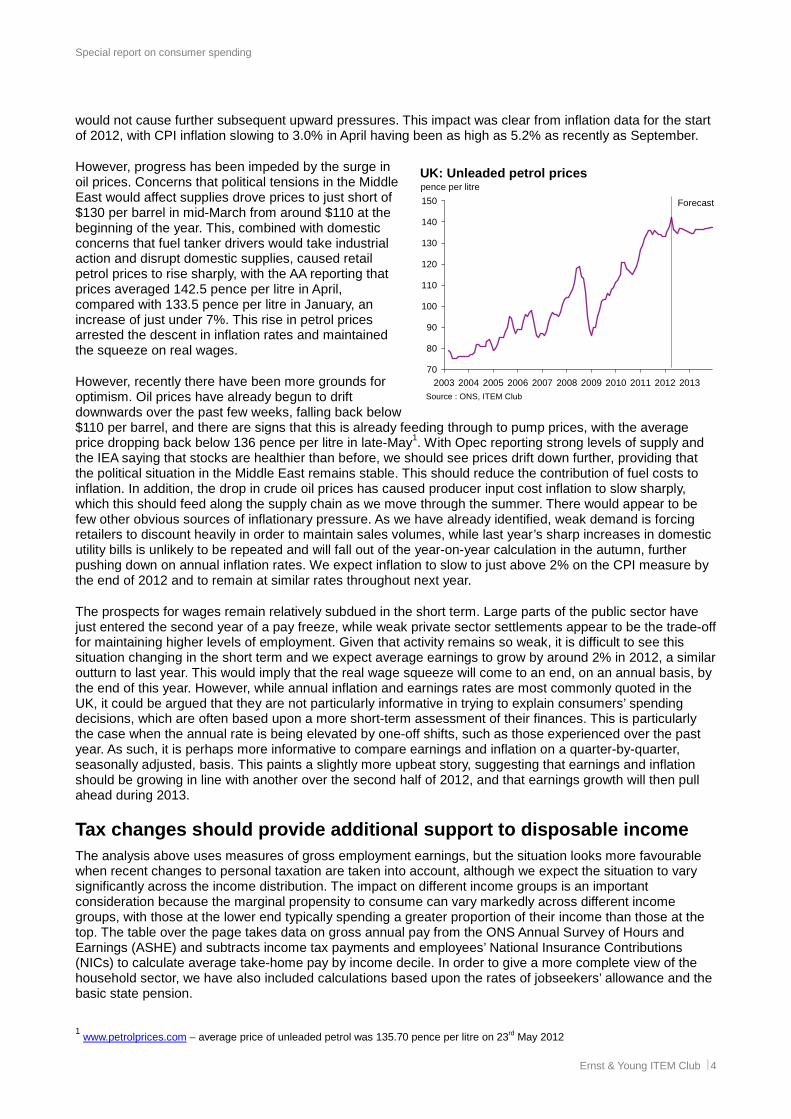
….following a severe squeeze on real household inco mes The main factor behind the poor performance of the consumer sector in recent years has been a prolonged and severe squeeze on household incomes. The broadest measure, real household disposable income, fell by 1.2% in 2011, the largest calendar year decline since 1977, and with incomes also having fallen in 2010 this marked the first back-to-back declines since the mid-1970s.
This measure had previously been held up by the impact of falling interest rates on debt interest payments. However, since interest rates reached their current level, trends in income from employment have been the dominant factor and the news in this area has been almost exclusively bad. The pressures of globalisation and a weak domestic labour market have squeezed labour incomes, while inflation has remained stubbornly high in spite of the weak economic backdrop. Apart from a brief period in 2009, when steep cuts in Bank Rate caused a sharp drop in RPI inflation and base effects dragged down all headline inflation rates, growth in earnings has consistently lagged behind inflation since early 2008, progressively eroding households’ spending power.
This squeeze was at its most severe last year, when a series of factors – including an increase in the VAT rate, a surge in oil prices which caused petrol prices to rise and a significant increase in household utility bills – caused inflation to spike upwards once more. We estimate that real wages – measured by the regular pay component of the Average Weekly Earnings series less inflation – fell by between 2.4-3.1% in 2011, depending upon the measure of inflation used. Coming on top of the earlier falls in real wages, this has left real wages around 5.8% below the early 2008 peak when deflated by the CPI, 4.9% lower when deflated by the RPI or 3.4% lower when deflated by the Tax & Price Index (TPI).
This year should see some relief, as long as oil pr ices cool We have long been optimistic that this year would finally see some relief for the consumer, although the process is taking longer than we had previously anticipated. Our optimism was based largely on the expectation of weaker inflationary pressures. Much of last year’s build up of inflationary pressures had reflected temporary factors, such as the VAT increase, which had a one-off level effect on prices but which
-4
-2
0
2
4
6
8
1970 1975 1980 1985 1990 1995 2000 2005 2010
UK: Real household disposable income% year
Source : Haver Analytics
-3
-2
-1
0
1
2
3
4
5
6
7
2000 2002 2004 2006 2008 2010 2012
UK: Earnings and inflation%year
Source : Haver Analytics
Average earnings (regular pay)
CPI inflation
RPI inflationTPI inflation
360
380
400
420
440
460
480
2000 2002 2004 2006 2008 2010 2012
UK: Real wages*£ per week, 2011 prices
Source : Haver Analytics, ITEM Club
* Regular pay component of Average Weekly Earnings deflated by RPI/CPI/TPI
Deflated by CPI
Deflated by RPI
Deflated by TPI
Special report on consumer spending
Ernst & Young ITEM Club 4
would not cause further subsequent upward pressures. This impact was clear from inflation data for the start of 2012, with CPI inflation slowing to 3.0% in April having been as high as 5.2% as recently as September.
However, progress has been impeded by the surge in oil prices. Concerns that political tensions in the Middle East would affect supplies drove prices to just short of $130 per barrel in mid-March from around $110 at the beginning of the year. This, combined with domestic concerns that fuel tanker drivers would take industrial action and disrupt domestic supplies, caused retail petrol prices to rise sharply, with the AA reporting that prices averaged 142.5 pence per litre in April, compared with 133.5 pence per litre in January, an increase of just under 7%. This rise in petrol prices arrested the descent in inflation rates and maintained the squeeze on real wages.
However, recently there have been more grounds for optimism. Oil prices have already begun to drift downwards over the past few weeks, falling back below $110 per barrel, and there are signs that this is already feeding through to pump prices, with the average price dropping back below 136 pence per litre in late-May1. With Opec reporting strong levels of supply and the IEA saying that stocks are healthier than before, we should see prices drift down further, providing that the political situation in the Middle East remains stable. This should reduce the contribution of fuel costs to inflation. In addition, the drop in crude oil prices has caused producer input cost inflation to slow sharply, which this should feed along the supply chain as we move through the summer. There would appear to be few other obvious sources of inflationary pressure. As we have already identified, weak demand is forcing retailers to discount heavily in order to maintain sales volumes, while last year’s sharp increases in domestic utility bills is unlikely to be repeated and will fall out of the year-on-year calculation in the autumn, further pushing down on annual inflation rates. We expect inflation to slow to just above 2% on the CPI measure by the end of 2012 and to remain at similar rates throughout next year.
The prospects for wages remain relatively subdued in the short term. Large parts of the public sector have just entered the second year of a pay freeze, while weak private sector settlements appear to be the trade-off for maintaining higher levels of employment. Given that activity remains so weak, it is difficult to see this situation changing in the short term and we expect average earnings to grow by around 2% in 2012, a similar outturn to last year. This would imply that the real wage squeeze will come to an end, on an annual basis, by the end of this year. However, while annual inflation and earnings rates are most commonly quoted in the UK, it could be argued that they are not particularly informative in trying to explain consumers’ spending decisions, which are often based upon a more short-term assessment of their finances. This is particularly the case when the annual rate is being elevated by one-off shifts, such as those experienced over the past year. As such, it is perhaps more informative to compare earnings and inflation on a quarter-by-quarter, seasonally adjusted, basis. This paints a slightly more upbeat story, suggesting that earnings and inflation should be growing in line with another over the second half of 2012, and that earnings growth will then pull ahead during 2013.
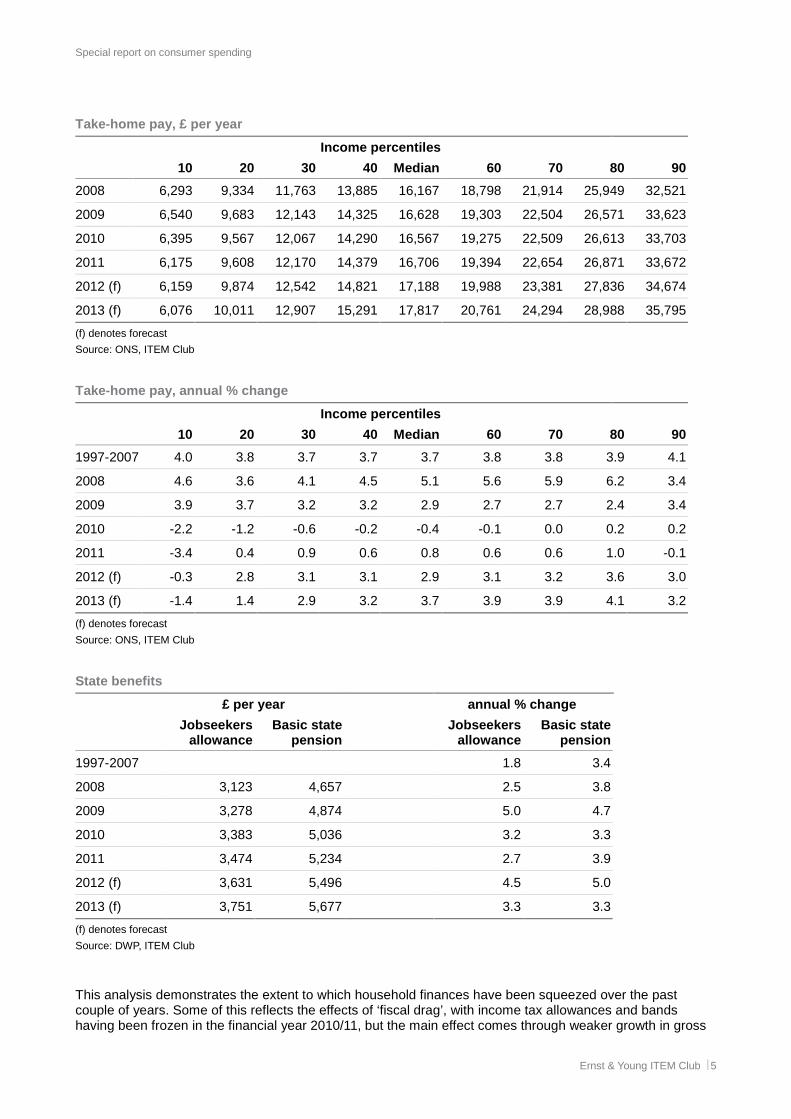
Tax changes should provide additional support to di sposable income The analysis above uses measures of gross employment earnings, but the situation looks more favourable when recent changes to personal taxation are taken into account, although we expect the situation to vary significantly across the income distribution. The impact on different income groups is an important consideration because the marginal propensity to consume can vary markedly across different income groups, with those at the lower end typically spending a greater proportion of their income than those at the top. The table over the page takes data on gross annual pay from the ONS Annual Survey of Hours and Earnings (ASHE) and subtracts income tax payments and employees’ National Insurance Contributions (NICs) to calculate average take-home pay by income decile. In order to give a more complete view of the household sector, we have also included calculations based upon the rates of jobseekers’ allowance and the basic state pension.
1 www.petrolprices.com – average price of unleaded petrol was 135.70 pence per litre on 23rd May 2012
70
80
90
100
110
120
130
140
150
2003 2004 2005 2006 2007 2008 2009 2010 2011 2012 2013
UK: Unleaded petrol pricespence per litre
Source : ONS, ITEM Club
Forecast
Special report on consumer spending
Ernst & Young ITEM Club 5
Take-home pay, £ per year
Income percentiles
10 20 30 40 Median 60 70 80 90
2008 6,293 9,334 11,763 13,885 16,167 18,798 21,914 25,949 32,521
2009 6,540 9,683 12,143 14,325 16,628 19,303 22,504 26,571 33,623
2010 6,395 9,567 12,067 14,290 16,567 19,275 22,509 26,613 33,703
2011 6,175 9,608 12,170 14,379 16,706 19,394 22,654 26,871 33,672
2012 (f) 6,159 9,874 12,542 14,821 17,188 19,988 23,381 27,836 34,674
2013 (f) 6,076 10,011 12,907 15,291 17,817 20,761 24,294 28,988 35,795
(f) denotes forecast
Source: ONS, ITEM Club
Take-home pay, annual % change
Income percentiles
10 20 30 40 Median 60 70 80 90
1997-2007 4.0 3.8 3.7 3.7 3.7 3.8 3.8 3.9 4.1
2008 4.6 3.6 4.1 4.5 5.1 5.6 5.9 6.2 3.4
2009 3.9 3.7 3.2 3.2 2.9 2.7 2.7 2.4 3.4
2010 -2.2 -1.2 -0.6 -0.2 -0.4 -0.1 0.0 0.2 0.2
2011 -3.4 0.4 0.9 0.6 0.8 0.6 0.6 1.0 -0.1
2012 (f) -0.3 2.8 3.1 3.1 2.9 3.1 3.2 3.6 3.0
2013 (f) -1.4 1.4 2.9 3.2 3.7 3.9 3.9 4.1 3.2
(f) denotes forecast
Source: ONS, ITEM Club
State benefits
£ per year annual % change
Jobseekers allowance
Basic state pension
Jobseekers allowance
Basic state pension
1997-2007 1.8 3.4
2008 3,123 4,657 2.5 3.8
2009 3,278 4,874 5.0 4.7
2010 3,383 5,036 3.2 3.3
2011 3,474 5,234 2.7 3.9
2012 (f) 3,631 5,496 4.5 5.0
2013 (f) 3,751 5,677 3.3 3.3
(f) denotes forecast
Source: DWP, ITEM Club
This analysis demonstrates the extent to which household finances have been squeezed over the past couple of years. Some of this reflects the effects of ‘fiscal drag’, with income tax allowances and bands having been frozen in the financial year 2010/11, but the main effect comes through weaker growth in gross
Special report on consumer spending
Ernst & Young ITEM Club 6
pay. The biggest losers appear to have been those towards the lower end of the income distribution, who have seen take-home pay decline sharply over the past couple of years after the introduction of the National Minimum Wage had closed income differentials in earlier periods. Our analysis shows that there is a strong relationship between earnings growth and the level of unemployment at the lower end of the income distribution, which we attribute to the shift from full-time to part-time roles and the dominance of low-skilled roles, where workers have a much weaker wage bargaining position because of the large number of potential alternatives for their roles. In contrast to weak employment incomes, state benefits have increased strongly over the past couple of years due to the indexation by persistently high rates of inflation.
Though most groups did at least experience some growth in nominal take-home pay in 2011, there are two clear losers, with the top and bottom deciles seeing further declines. This appears to be a reflection of the £1,000 increase in the income tax personal allowance for financial year 2011/12 and the changes to employees’ NICs, which involved an increase in the main rate from 11% to 12% but also an increase in the Lower Earnings Limit, i.e. the point at which workers begin to make contributions. These changes have boosted the take-home pay of most income deciles, but the lowest 10% of earners were already paying zero income tax so have not been helped. Meanwhile the top 10% of earners have seen any benefit from the higher personal allowance offset by an equivalent reduction in the basic rate limit.
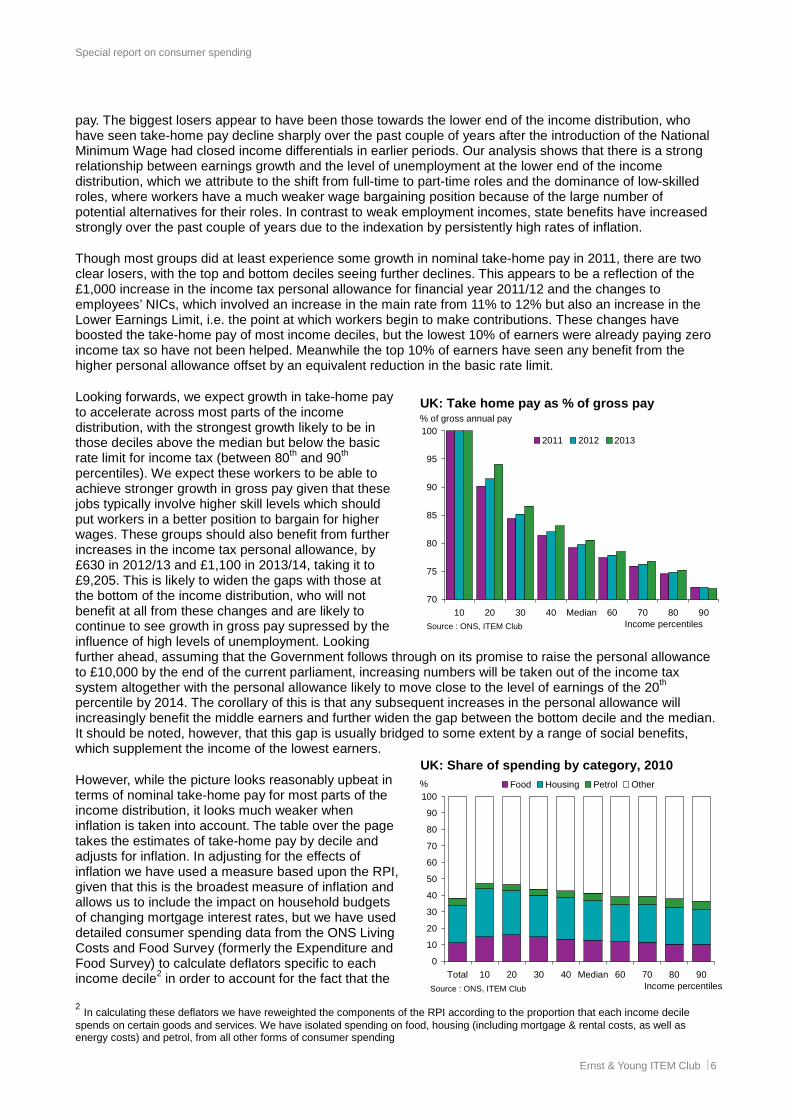
Looking forwards, we expect growth in take-home pay to accelerate across most parts of the income distribution, with the strongest growth likely to be in those deciles above the median but below the basic rate limit for income tax (between 80th and 90th percentiles). We expect these workers to be able to achieve stronger growth in gross pay given that these jobs typically involve higher skill levels which should put workers in a better position to bargain for higher wages. These groups should also benefit from further increases in the income tax personal allowance, by £630 in 2012/13 and £1,100 in 2013/14, taking it to £9,205. This is likely to widen the gaps with those at the bottom of the income distribution, who will not benefit at all from these changes and are likely to continue to see growth in gross pay supressed by the influence of high levels of unemployment. Looking further ahead, assuming that the Government follows through on its promise to raise the personal allowance to £10,000 by the end of the current parliament, increasing numbers will be taken out of the income tax system altogether with the personal allowance likely to move close to the level of earnings of the 20th percentile by 2014. The corollary of this is that any subsequent increases in the personal allowance will increasingly benefit the middle earners and further widen the gap between the bottom decile and the median. It should be noted, however, that this gap is usually bridged to some extent by a range of social benefits, which supplement the income of the lowest earners.
However, while the picture looks reasonably upbeat in terms of nominal take-home pay for most parts of the income distribution, it looks much weaker when inflation is taken into account. The table over the page takes the estimates of take-home pay by decile and adjusts for inflation. In adjusting for the effects of inflation we have used a measure based upon the RPI, given that this is the broadest measure of inflation and allows us to include the impact on household budgets of changing mortgage interest rates, but we have used detailed consumer spending data from the ONS Living Costs and Food Survey (formerly the Expenditure and Food Survey) to calculate deflators specific to each income decile2 in order to account for the fact that the 2 In calculating these deflators we have reweighted the components of the RPI according to the proportion that each income decile spends on certain goods and services. We have isolated spending on food, housing (including mortgage & rental costs, as well as energy costs) and petrol, from all other forms of consumer spending
70
75
80
85
90
95
100
10 20 30 40 Median 60 70 80 90
2011 2012 2013
UK: Take home pay as % of gross pay% of gross annual pay
Source : ONS, ITEM Club Income percentiles
0
10
20
30
40
50
60
70
80
90
100
Total 10 20 30 40 Median 60 70 80 90
Food Housing Petrol Other
UK: Share of spending by category, 2010%
Source : ONS, ITEM Club Income percentiles
Special report on consumer spending
Ernst & Young ITEM Club 7
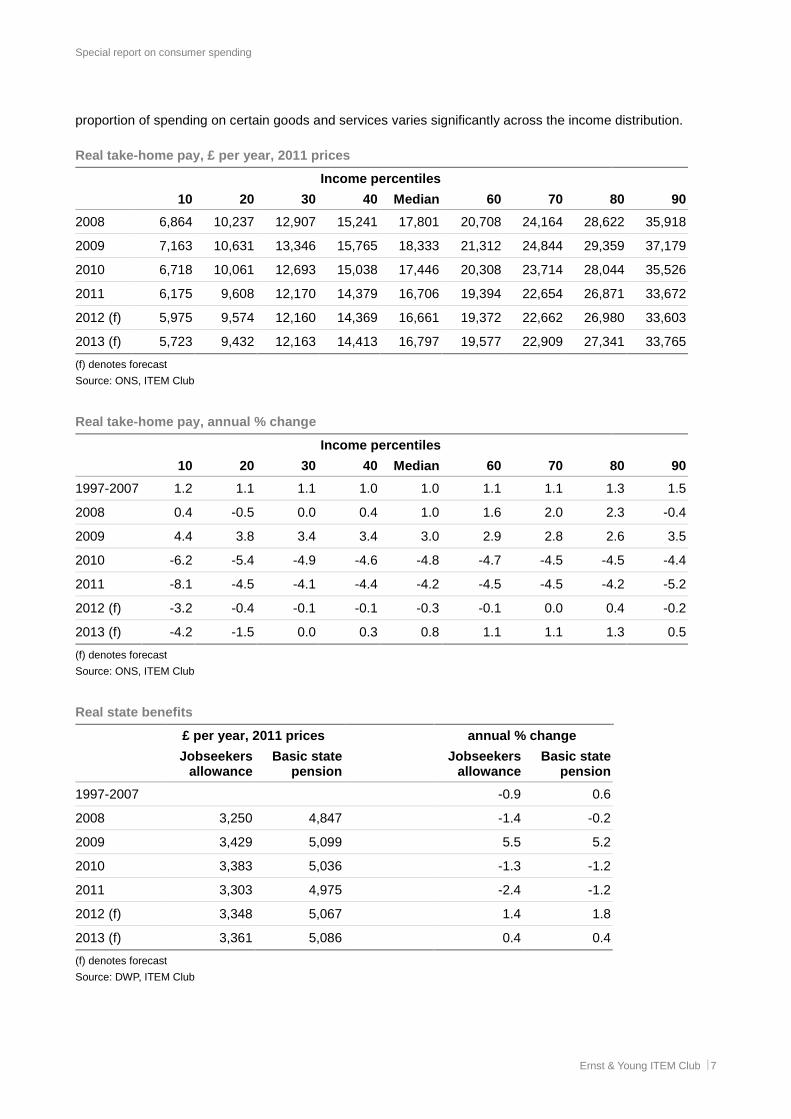
proportion of spending on certain goods and services varies significantly across the income distribution.
Real take-home pay, £ per year, 2011 prices
Income percentiles
10 20 30 40 Median 60 70 80 90
2008 6,864 10,237 12,907 15,241 17,801 20,708 24,164 28,622 35,918
2009 7,163 10,631 13,346 15,765 18,333 21,312 24,844 29,359 37,179
2010 6,718 10,061 12,693 15,038 17,446 20,308 23,714 28,044 35,526
2011 6,175 9,608 12,170 14,379 16,706 19,394 22,654 26,871 33,672
2012 (f) 5,975 9,574 12,160 14,369 16,661 19,372 22,662 26,980 33,603
2013 (f) 5,723 9,432 12,163 14,413 16,797 19,577 22,909 27,341 33,765
(f) denotes forecast
Source: ONS, ITEM Club
Real take-home pay, annual % change
Income percentiles
10 20 30 40 Median 60 70 80 90
1997-2007 1.2 1.1 1.1 1.0 1.0 1.1 1.1 1.3 1.5
2008 0.4 -0.5 0.0 0.4 1.0 1.6 2.0 2.3 -0.4
2009 4.4 3.8 3.4 3.4 3.0 2.9 2.8 2.6 3.5
2010 -6.2 -5.4 -4.9 -4.6 -4.8 -4.7 -4.5 -4.5 -4.4
2011 -8.1 -4.5 -4.1 -4.4 -4.2 -4.5 -4.5 -4.2 -5.2
2012 (f) -3.2 -0.4 -0.1 -0.1 -0.3 -0.1 0.0 0.4 -0.2
2013 (f) -4.2 -1.5 0.0 0.3 0.8 1.1 1.1 1.3 0.5
(f) denotes forecast
Source: ONS, ITEM Club
Real state benefits
£ per year, 2011 prices annual % change
Jobseekers allowance
Basic state pension
Jobseekers allowance
Basic state pension
1997-2007 -0.9 0.6
2008 3,250 4,847 -1.4 -0.2
2009 3,429 5,099 5.5 5.2
2010 3,383 5,036 -1.3 -1.2
2011 3,303 4,975 -2.4 -1.2
2012 (f) 3,348 5,067 1.4 1.8
2013 (f) 3,361 5,086 0.4 0.4
(f) denotes forecast
Source: DWP, ITEM Club
Special report on consumer spending
Ernst & Young ITEM Club 8
This analysis re-emphasises the intensity of the squeeze on household finances across the income distribution, but also demonstrates the severity of the problems at the lower end. In particular, those in the bottom decile have had to contend with both falling take-home pay in nominal terms, plus the worst of the inflationary pressures through their greater exposure to food and housing costs.
We expect a further sharp decline in real take-home pay for the lowest decile this year, albeit one which is less severe than the past two years, which is largely attributable to a further modest drop in nominal take-home pay. As previously stated, the narrow focus on employment income and exclusion of social benefit payments from the analysis exaggerates the impact on the incomes of the lowest paid, but even making allowance for this it is clear that the pressure on these groups remains severe.
It is notable that having clearly out-performed in terms of nominal take-home pay, the groups above the median enjoy less of an advantage when inflation is taken into account. This is principally because these groups tend to spend a greater proportion of their income on fuel and are, therefore, likely to have suffered disproportionately from the sharp increase in retail petrol prices at the beginning of this year. The biggest winners this year are likely to be the non-workers; the system of indexation means that last year’s high inflation caused a significant jump in benefit payments, but with inflation likely to be much weaker this year this should mean a firm real terms increase in income for the unemployed and pensioners, going someway to offset the losses of the previous two years.
The clear message from this analysis is that the worst looks to be behind us, with most parts of the income distribution set to see real take-home pay remain stable this year before increasing in 2013. Given that the vast majority of consumer spending tends to be financed directly from take-home pay, this suggests a gradual improvement in the outlook for spending. On a broader definition of incomes the outlook also appears set to improve. The strong cash position of UK firms should translate into higher dividend payments, particularly if firms remain reluctant to use the funds for investment, while the trend towards higher levels of self employment is leading to higher levels of income from this source. We expect real household disposable income to be broadly flat in 2012, but momentum should build as the year progresses, leading to growth of around 1.5% in 2013.
Non-income factors should gradually become more sup portive While the level of resources available to households is the key determinant of consumer spending, a number of other factors are also important. Wider labour market developments are also significant, not just directly through their impact on household incomes but more indirectly through their impact on confidence, as demonstrated in our 2011 report3. This link remained firm during 2011, with sentiment continuing to deteriorate as unemployment rose.
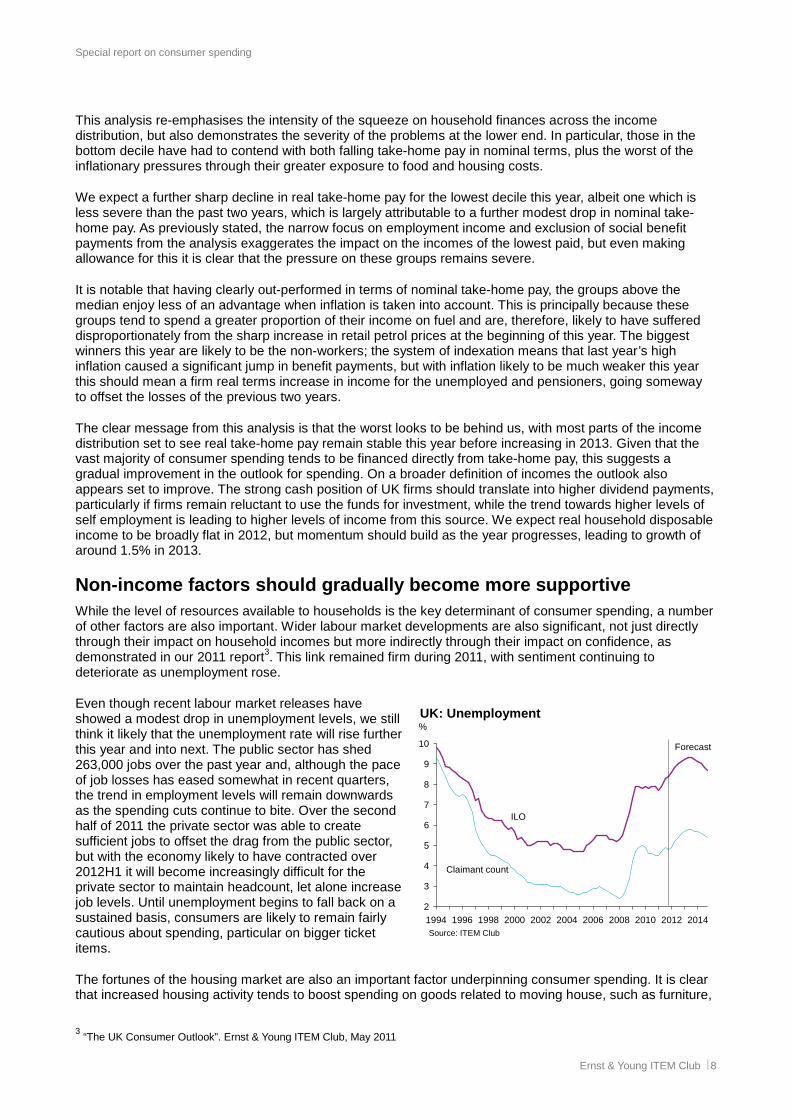
Even though recent labour market releases have showed a modest drop in unemployment levels, we still think it likely that the unemployment rate will rise further this year and into next. The public sector has shed 263,000 jobs over the past year and, although the pace of job losses has eased somewhat in recent quarters, the trend in employment levels will remain downwards as the spending cuts continue to bite. Over the second half of 2011 the private sector was able to create sufficient jobs to offset the drag from the public sector, but with the economy likely to have contracted over 2012H1 it will become increasingly difficult for the private sector to maintain headcount, let alone increase job levels. Until unemployment begins to fall back on a sustained basis, consumers are likely to remain fairly cautious about spending, particular on bigger ticket items.
The fortunes of the housing market are also an important factor underpinning consumer spending. It is clear that increased housing activity tends to boost spending on goods related to moving house, such as furniture,
3 “The UK Consumer Outlook”. Ernst & Young ITEM Club, May 2011
2
3
4
5
6
7
8
9
10
1994 1996 1998 2000 2002 2004 2006 2008 2010 2012 2014
%
Claimant count
ILO
UK: Unemployment
Forecast
Source: ITEM Club
Special report on consumer spending
Ernst & Young ITEM Club 9
carpets and white goods, while the high level of home ownership in the UK also generates a link between house prices and consumer sentiment. Some commentators also make the case for a link between housing wealth and consumer spending, although this is more disputed.
There was a modest pickup in housing transactions around the turn of the year, but this appears to have been connected with the end of the stamp duty holiday for first-time buyers in March and recent figures on activity have been much more subdued. This downward trend is likely continue in the short-term, with several banks having increased their Standard Variable Rates (SVRs) in recent weeks and the latest Credit Conditions Survey reporting that banks expecting to tighten mortgage availability over the next three months. This appears to follow on from the tightening of credit in the Eurozone as its banks strive to meet the more stringent regulatory capital requirements imposed last December by reducing loan books. However, we do not expect this to become a progressive tightening over a prolonged period; rather we expect credit conditions to gradually loosen from next year which, combined with an improving economic backdrop, should result in both transactions and prices gradually recovering. This, in turn, should provide some support to demand in housing-related spending sectors, as well as helping to support confidence.
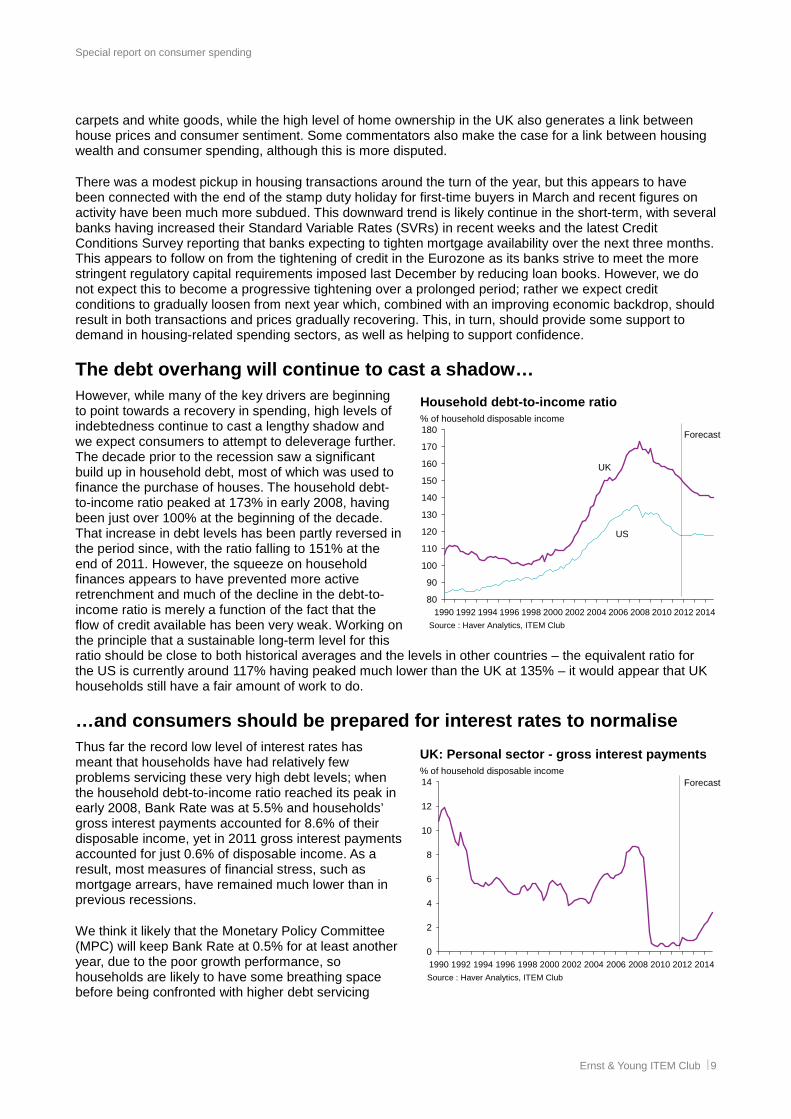
The debt overhang will continue to cast a shadow… However, while many of the key drivers are beginning to point towards a recovery in spending, high levels of indebtedness continue to cast a lengthy shadow and we expect consumers to attempt to deleverage further. The decade prior to the recession saw a significant build up in household debt, most of which was used to finance the purchase of houses. The household debt-to-income ratio peaked at 173% in early 2008, having been just over 100% at the beginning of the decade. That increase in debt levels has been partly reversed in the period since, with the ratio falling to 151% at the end of 2011. However, the squeeze on household finances appears to have prevented more active retrenchment and much of the decline in the debt-to-income ratio is merely a function of the fact that the flow of credit available has been very weak. Working on the principle that a sustainable long-term level for this ratio should be close to both historical averages and the levels in other countries – the equivalent ratio for the US is currently around 117% having peaked much lower than the UK at 135% – it would appear that UK households still have a fair amount of work to do.
…and consumers should be prepared for interest rate s to normalise Thus far the record low level of interest rates has meant that households have had relatively few problems servicing these very high debt levels; when the household debt-to-income ratio reached its peak in early 2008, Bank Rate was at 5.5% and households’ gross interest payments accounted for 8.6% of their disposable income, yet in 2011 gross interest payments accounted for just 0.6% of disposable income. As a result, most measures of financial stress, such as mortgage arrears, have remained much lower than in previous recessions.
We think it likely that the Monetary Policy Committee (MPC) will keep Bank Rate at 0.5% for at least another year, due to the poor growth performance, so households are likely to have some breathing space before being confronted with higher debt servicing
0
2
4
6
8
10
12
14
1990 1992 1994 1996 1998 2000 2002 2004 2006 2008 2010 2012 2014
UK: Personal sector - gross interest payments% of household disposable income
Source : Haver Analytics, ITEM Club
Forecast
80
90
100
110
120
130
140
150
160
170
180
1990 1992 1994 1996 1998 2000 2002 2004 2006 2008 2010 2012 2014
Household debt-to-income ratio% of household disposable income
Source : Haver Analytics, ITEM Club
Forecast
US
UK
Special report on consumer spending
Ernst & Young ITEM Club 10
costs. However, if global input cost inflation increases again and the domestic economy begins to recover in the manner in which we anticipate, then the MPC will come under increasing pressure to begin increasing Bank Rate from the middle of next year.
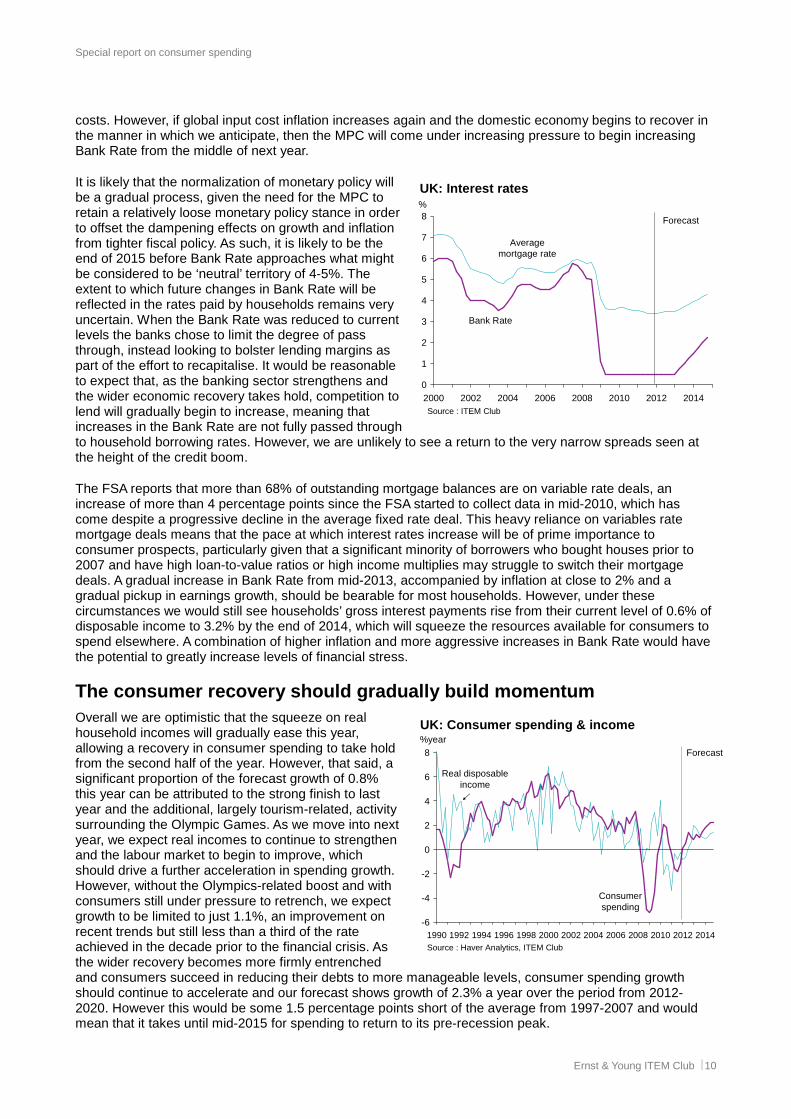
It is likely that the normalization of monetary policy will be a gradual process, given the need for the MPC to retain a relatively loose monetary policy stance in order to offset the dampening effects on growth and inflation from tighter fiscal policy. As such, it is likely to be the end of 2015 before Bank Rate approaches what might be considered to be ‘neutral’ territory of 4-5%. The extent to which future changes in Bank Rate will be reflected in the rates paid by households remains very uncertain. When the Bank Rate was reduced to current levels the banks chose to limit the degree of pass through, instead looking to bolster lending margins as part of the effort to recapitalise. It would be reasonable to expect that, as the banking sector strengthens and the wider economic recovery takes hold, competition to lend will gradually begin to increase, meaning that increases in the Bank Rate are not fully passed through to household borrowing rates. However, we are unlikely to see a return to the very narrow spreads seen at the height of the credit boom.
The FSA reports that more than 68% of outstanding mortgage balances are on variable rate deals, an increase of more than 4 percentage points since the FSA started to collect data in mid-2010, which has come despite a progressive decline in the average fixed rate deal. This heavy reliance on variables rate mortgage deals means that the pace at which interest rates increase will be of prime importance to consumer prospects, particularly given that a significant minority of borrowers who bought houses prior to 2007 and have high loan-to-value ratios or high income multiplies may struggle to switch their mortgage deals. A gradual increase in Bank Rate from mid-2013, accompanied by inflation at close to 2% and a gradual pickup in earnings growth, should be bearable for most households. However, under these circumstances we would still see households’ gross interest payments rise from their current level of 0.6% of disposable income to 3.2% by the end of 2014, which will squeeze the resources available for consumers to spend elsewhere. A combination of higher inflation and more aggressive increases in Bank Rate would have the potential to greatly increase levels of financial stress.
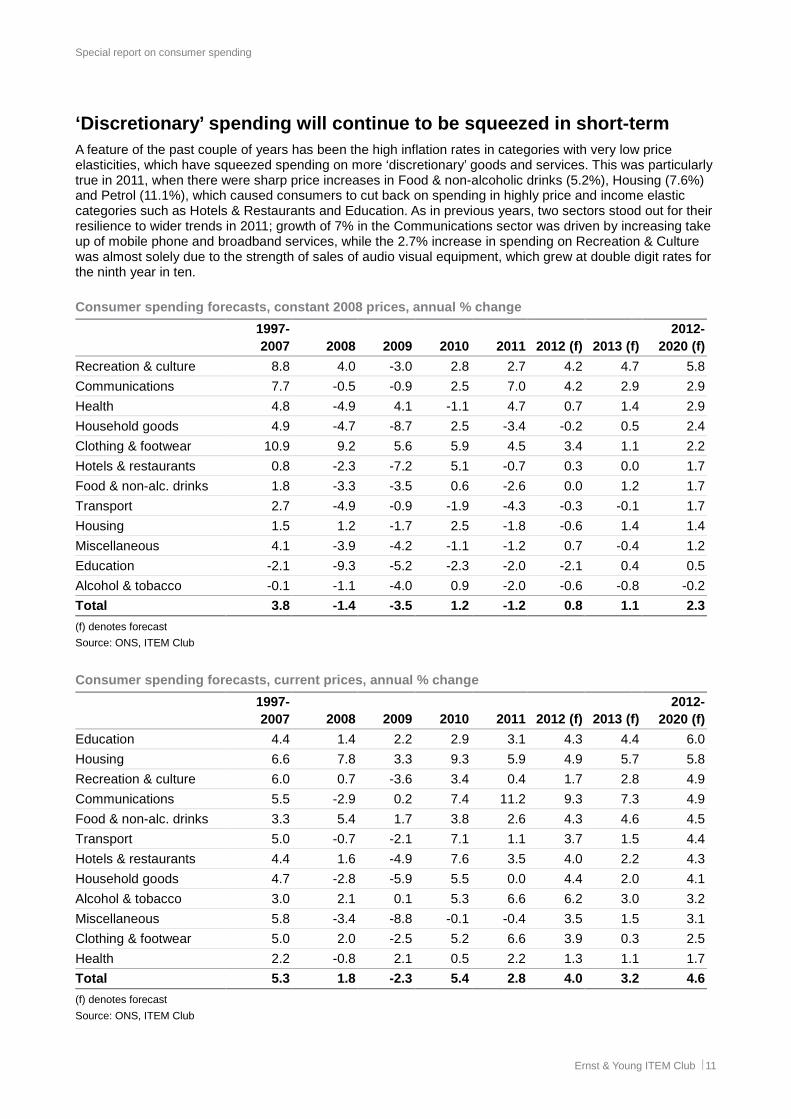
The consumer recovery should gradually build moment um Overall we are optimistic that the squeeze on real household incomes will gradually ease this year, allowing a recovery in consumer spending to take hold from the second half of the year. However, that said, a significant proportion of the forecast growth of 0.8% this year can be attributed to the strong finish to last year and the additional, largely tourism-related, activity surrounding the Olympic Games. As we move into next year, we expect real incomes to continue to strengthen and the labour market to begin to improve, which should drive a further acceleration in spending growth. However, without the Olympics-related boost and with consumers still under pressure to retrench, we expect growth to be limited to just 1.1%, an improvement on recent trends but still less than a third of the rate achieved in the decade prior to the financial crisis. As the wider recovery becomes more firmly entrenched and consumers succeed in reducing their debts to more manageable levels, consumer spending growth should continue to accelerate and our forecast shows growth of 2.3% a year over the period from 2012-2020. However this would be some 1.5 percentage points short of the average from 1997-2007 and would mean that it takes until mid-2015 for spending to return to its pre-recession peak.
0
1
2
3
4
5
6
7
8
2000 2002 2004 2006 2008 2010 2012 2014
UK: Interest rates%
Source : ITEM Club
Bank Rate
Average mortgage rate
Forecast
-6
-4
-2
0
2
4
6
8
1990 1992 1994 1996 1998 2000 2002 2004 2006 2008 2010 2012 2014
UK: Consumer spending & income%year
Source : Haver Analytics, ITEM Club
Real disposable income
Consumer spending
Forecast
Special report on consumer spending
Ernst & Young ITEM Club 11
‘Discretionary’ spending will continue to be squeez ed in short-term A feature of the past couple of years has been the high inflation rates in categories with very low price elasticities, which have squeezed spending on more ‘discretionary’ goods and services. This was particularly true in 2011, when there were sharp price increases in Food & non-alcoholic drinks (5.2%), Housing (7.6%) and Petrol (11.1%), which caused consumers to cut back on spending in highly price and income elastic categories such as Hotels & Restaurants and Education. As in previous years, two sectors stood out for their resilience to wider trends in 2011; growth of 7% in the Communications sector was driven by increasing take up of mobile phone and broadband services, while the 2.7% increase in spending on Recreation & Culture was almost solely due to the strength of sales of audio visual equipment, which grew at double digit rates for the ninth year in ten.
Consumer spending forecasts, constant 2008 prices, annual % change
1997- 2007 2008 2009 2010 2011 2012 (f) 2013 (f)
2012- 2020 (f)
Recreation & culture 8.8 4.0 -3.0 2.8 2.7 4.2 4.7 5.8
Communications 7.7 -0.5 -0.9 2.5 7.0 4.2 2.9 2.9
Health 4.8 -4.9 4.1 -1.1 4.7 0.7 1.4 2.9
Household goods 4.9 -4.7 -8.7 2.5 -3.4 -0.2 0.5 2.4
Clothing & footwear 10.9 9.2 5.6 5.9 4.5 3.4 1.1 2.2
Hotels & restaurants 0.8 -2.3 -7.2 5.1 -0.7 0.3 0.0 1.7
Food & non-alc. drinks 1.8 -3.3 -3.5 0.6 -2.6 0.0 1.2 1.7
Transport 2.7 -4.9 -0.9 -1.9 -4.3 -0.3 -0.1 1.7
Housing 1.5 1.2 -1.7 2.5 -1.8 -0.6 1.4 1.4
Miscellaneous 4.1 -3.9 -4.2 -1.1 -1.2 0.7 -0.4 1.2
Education -2.1 -9.3 -5.2 -2.3 -2.0 -2.1 0.4 0.5
Alcohol & tobacco -0.1 -1.1 -4.0 0.9 -2.0 -0.6 -0.8 -0.2
Total 3.8 -1.4 -3.5 1.2 -1.2 0.8 1.1 2.3
(f) denotes forecast
Source: ONS, ITEM Club
Consumer spending forecasts, current prices, annual % change
1997- 2007 2008 2009 2010 2011 2012 (f) 2013 (f)
2012- 2020 (f)
Education 4.4 1.4 2.2 2.9 3.1 4.3 4.4 6.0
Housing 6.6 7.8 3.3 9.3 5.9 4.9 5.7 5.8
Recreation & culture 6.0 0.7 -3.6 3.4 0.4 1.7 2.8 4.9
Communications 5.5 -2.9 0.2 7.4 11.2 9.3 7.3 4.9
Food & non-alc. drinks 3.3 5.4 1.7 3.8 2.6 4.3 4.6 4.5
Transport 5.0 -0.7 -2.1 7.1 1.1 3.7 1.5 4.4
Hotels & restaurants 4.4 1.6 -4.9 7.6 3.5 4.0 2.2 4.3
Household goods 4.7 -2.8 -5.9 5.5 0.0 4.4 2.0 4.1
Alcohol & tobacco 3.0 2.1 0.1 5.3 6.6 6.2 3.0 3.2
Miscellaneous 5.8 -3.4 -8.8 -0.1 -0.4 3.5 1.5 3.1
Clothing & footwear 5.0 2.0 -2.5 5.2 6.6 3.9 0.3 2.5
Health 2.2 -0.8 2.1 0.5 2.2 1.3 1.1 1.7
Total 5.3 1.8 -2.3 5.4 2.8 4.0 3.2 4.6
(f) denotes forecast
Source: ONS, ITEM Club
Special report on consumer spending
Ernst & Young ITEM Club 12
The squeeze on the discretionary categories should ease a little this year, with smaller price rises forecast across the economy, including for the price inelastic sectors. We expect the Recreation & Culture and Communications categories to continue to lead, as rapid advancements in technology, development of new products and falling prices continue to underpin strong demand across a range of products. Clothing & footwear is also expected to post a strong performance, although this is largely due to a strong finish to 2011 and we expect growth to slow to a more sustainable rate going forwards. The Olympics should boost tourism, thus supporting spending in Hotels & Restaurants, but overall growth in that sector is likely to remain relatively weak because it is a highly income elastic sector which will continue to suffer from the slow improvement in household incomes, so the Olympics will merely mitigate this weakness. The lessening in the pressures on discretionary spending can be seen in the much smaller declines forecast for categories such as Transport (which includes the purchase of new vehicles) and Household goods.
Looking further out, we expect the Recreation & Culture and Communications sectors to continue their dominance, though the degree to which they outperform other sectors is likely to narrow, given that some of the dominant markets of recent years are approaching saturation point and there are significant questions about whether the pace of innovation can be maintained at past rates. As the wider economic outlook improves, and real household income growth picks up, we expect spending in the more highly income elastic sectors to strengthen, such as Cars and Hotels & Restaurants. Though the government has pledged to protect front-line Health services from the public spending cuts, we expect to see consumers continuing to turn to private provision. Spending on Household Goods should continue to pick up as the housing market outlook improves, but with housing market activity unlikely to return to pre-recession levels in the future, we expect growth in spending on Household Goods to grow broadly in line with overall consumer spending growth, rather than outperform as it had done previously.
Conclusion After a tough couple of years there is some light appearing at the end of the tunnel for consumers. Providing that oil prices cool and inflation continues to slow, most households should see their take-home pay stabilise in real terms this year and then begin to grow again in 2013. Changes to the income tax regime will aid this process, particularly next year for those income groups just above the median wage, although the nature of the changes means that the highest and lowest earners will not see any benefit.
Other factors should become more supportive to consumer spending along a similar timescale. Unemployment is expected to begin to fall back from the middle of next year, while housing activity should also begin to pick up, providing direct support as well as bolstering confidence. The Olympics should provide a further boost to spending this year, but abstracting from this we expect underlying growth to gradually accelerate over the next two years, with real consumer spending forecast to grow by 0.8% in 2012 and 1.1% in 2013. As the recovery gains momentum the squeeze on spending in more highly income elastic categories should also ease. Spending growth should accelerate further in subsequent years, but will continue to be constrained by the need for consumers to deleverage and latterly by the impact of higher debt servicing costs as interest rates begin to normalise and spending is not expected to return to previous peaks until mid-2015.
Special report on consumer spending
Ernst & Young ITEM Club 13
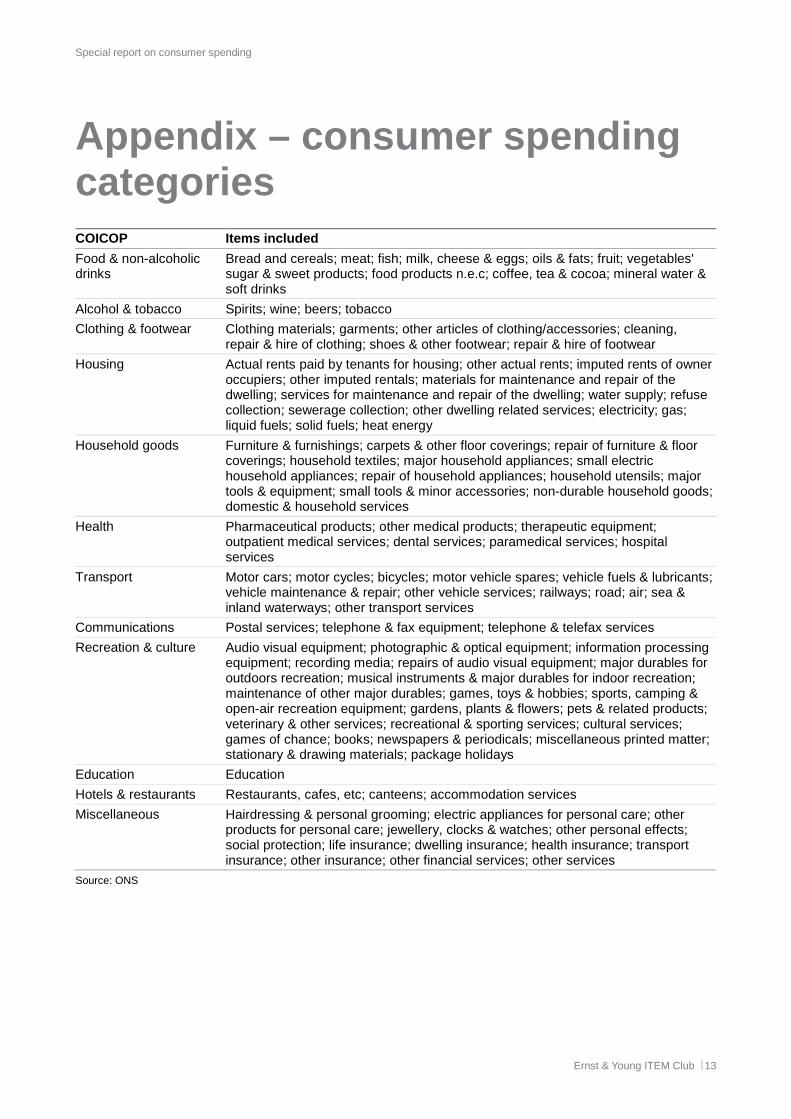
Appendix – consumer spending categories COICOP Items included
Food & non-alcoholic drinks
Bread and cereals; meat; fish; milk, cheese & eggs; oils & fats; fruit; vegetables' sugar & sweet products; food products n.e.c; coffee, tea & cocoa; mineral water & soft drinks
Alcohol & tobacco Spirits; wine; beers; tobacco
Clothing & footwear Clothing materials; garments; other articles of clothing/accessories; cleaning, repair & hire of clothing; shoes & other footwear; repair & hire of footwear
Housing Actual rents paid by tenants for housing; other actual rents; imputed rents of owner occupiers; other imputed rentals; materials for maintenance and repair of the dwelling; services for maintenance and repair of the dwelling; water supply; refuse collection; sewerage collection; other dwelling related services; electricity; gas; liquid fuels; solid fuels; heat energy
Household goods Furniture & furnishings; carpets & other floor coverings; repair of furniture & floor coverings; household textiles; major household appliances; small electric household appliances; repair of household appliances; household utensils; major tools & equipment; small tools & minor accessories; non-durable household goods; domestic & household services
Health Pharmaceutical products; other medical products; therapeutic equipment; outpatient medical services; dental services; paramedical services; hospital services
Transport Motor cars; motor cycles; bicycles; motor vehicle spares; vehicle fuels & lubricants; vehicle maintenance & repair; other vehicle services; railways; road; air; sea & inland waterways; other transport services
Communications Postal services; telephone & fax equipment; telephone & telefax services
Recreation & culture Audio visual equipment; photographic & optical equipment; information processing equipment; recording media; repairs of audio visual equipment; major durables for outdoors recreation; musical instruments & major durables for indoor recreation; maintenance of other major durables; games, toys & hobbies; sports, camping & open-air recreation equipment; gardens, plants & flowers; pets & related products; veterinary & other services; recreational & sporting services; cultural services; games of chance; books; newspapers & periodicals; miscellaneous printed matter; stationary & drawing materials; package holidays
Education Education
Hotels & restaurants Restaurants, cafes, etc; canteens; accommodation services
Miscellaneous Hairdressing & personal grooming; electric appliances for personal care; other products for personal care; jewellery, clocks & watches; other personal effects; social protection; life insurance; dwelling insurance; health insurance; transport insurance; other insurance; other financial services; other services
Source: ONS
Ernst & Young LLP
Assurance | Tax | Transaction | Advisory
www.ey.com/uk
About Ernst & Young
Ernst & Young is a global leader in assurance, tax, transaction and advisory services. Worldwide, our 152,000 people are united by our shared values and an unwavering commitment to quality. We make a difference by helping our people, our clients and our wider communities achieve their potential.
Ernst & Young refers to the global organization of member firms of Ernst & Young Global Limited, each of which is a separate legal entity. Ernst & Young Global Limited, a UK company limited by guarantee, does not provide services to clients. For more information about our organization, please visit www.ey.com
About ITEM Club
The ITEM Club is the only non-governmental economic forecasting group to use the HM Treasury’s model of the UK economy. ITEM stands for Independent Treasury Economic Model. HM Treasury uses the UK Treasury model for its UK policy analysis and Industry Act forecasts for the Budget. ITEM’s use of the model enables it to explore the implications and unpublished assumptions behind Government forecasts and policy measures.
Uniquely, ITEM can test whether Government claims are consistent and can assess which forecasts are credible and which are not. Its forecasts are independent of any political, economic or business bias.
The UK firm Ernst & Young is a limited liability partnership registered in England and Wales with Registered number OC300001 and is a member firm of Ernst & Young Global Limited
Ernst & Young LLP, 1 More London Place, London, SE1 2AF.
© ITEM Club Limited. 2012. Published in the UK. All Rights Reserved.
All views expressed in ITEM Club special report on consumer spending are those of ITEM Club Limited and may or may not be those of Ernst & Young LLP. Information in this publication is intended to provide only a general outline of the subjects covered. It should neither be regarded as comprehensive or sufficient for making decisions, nor should it be used in place of professional advice. Neither the ITEM Club Limited, Ernst & Young LLP nor the Ernst & Young ITEM Club accepts any responsibility for any loss arising from any action taken or not taken by anyone using this material. If you wish to discuss any aspect of the content of this newsletter, please talk to your usual Ernst & Young contact.
This document may not be disclosed to any third party without Ernst & Young’s prior written consent.
Reproduced with permission from ITEM Club Limited