Embed Size (px)
Citation preview
Executive Summary As we head rapidly towards the end of 2020, a year in which many say ‘phew’ thank goodness that is over, the
latest statistics on the New Zealand economy give us a picture of the depth of the effects of COVID-19.
There have been some reassuring signs of stability in recent indicators for the Waikato region. A rise in the
number of people in jobs saw the unemployment rate remain steady (compared to a rise around the country),
and exports continue to perform well.
Total consumer spending
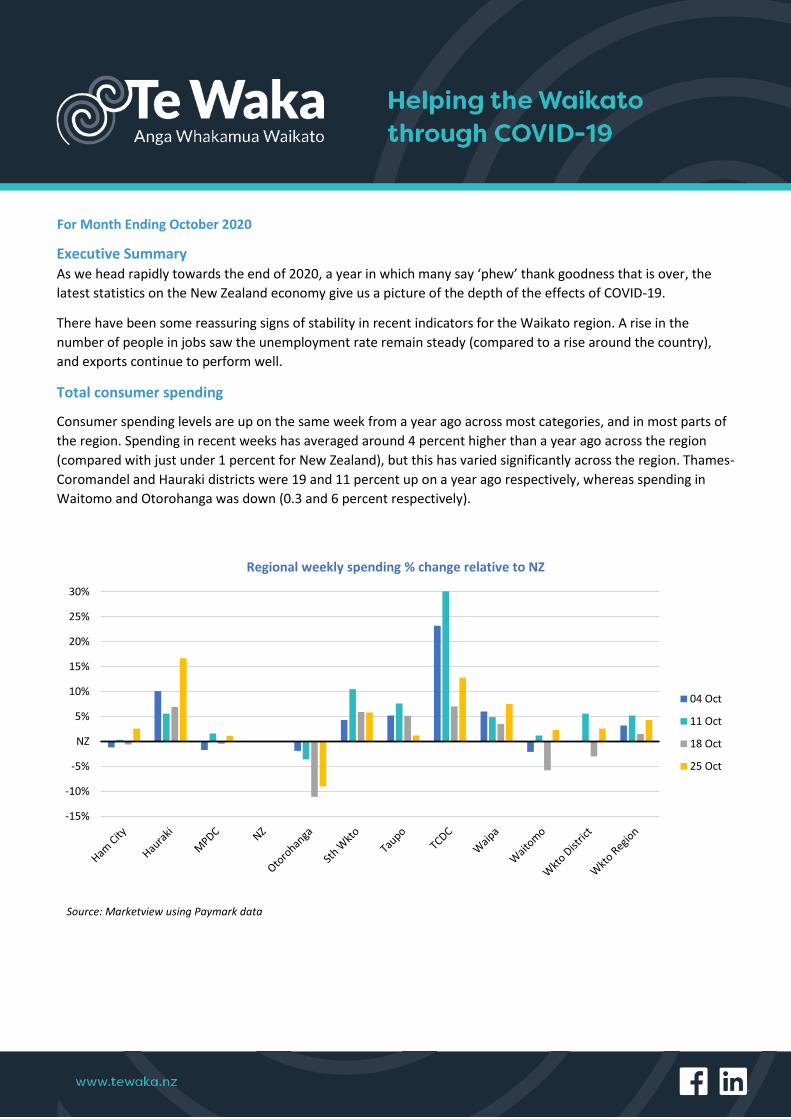
Consumer spending levels are up on the same week from a year ago across most categories, and in most parts of
the region. Spending in recent weeks has averaged around 4 percent higher than a year ago across the region
(compared with just under 1 percent for New Zealand), but this has varied significantly across the region. Thames-
Coromandel and Hauraki districts were 19 and 11 percent up on a year ago respectively, whereas spending in
Waitomo and Otorohanga was down (0.3 and 6 percent respectively).
-15%
-10%
-5%
NZ
5%
10%
15%
20%
25%
30%
Regional weekly spending % change relative to NZ
04 Oct
11 Oct
18 Oct
25 Oct
For Month Ending October 2020
Source: Marketview using Paymark data
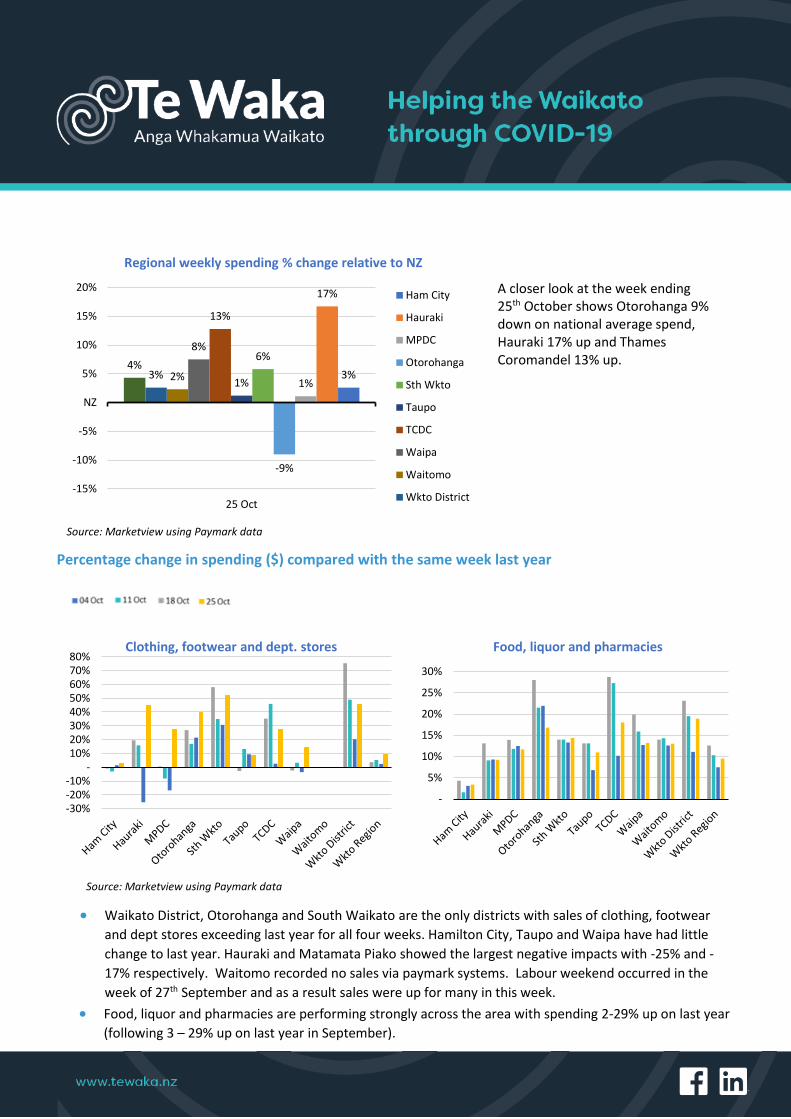
A closer look at the week ending 25th October shows Otorohanga 9% down on national average spend, Hauraki 17% up and Thames Coromandel 13% up.
Percentage change in spending ($) compared with the same week last year
• Waikato District, Otorohanga and South Waikato are the only districts with sales of clothing, footwear
and dept stores exceeding last year for all four weeks. Hamilton City, Taupo and Waipa have had little
change to last year. Hauraki and Matamata Piako showed the largest negative impacts with -25% and -
17% respectively. Waitomo recorded no sales via paymark systems. Labour weekend occurred in the
week of 27th September and as a result sales were up for many in this week.
• Food, liquor and pharmacies are performing strongly across the area with spending 2-29% up on last year (following 3 – 29% up on last year in September).
3%
17%
1%
-9%
6%
1%
13%
8%
2%3%4%
-15%
-10%
-5%
NZ
5%
10%
15%
20%
25 Oct
Regional weekly spending % change relative to NZ
Ham City
Hauraki
MPDC
Otorohanga
Sth Wkto
Taupo
TCDC
Waipa
Waitomo
Wkto District
-30%-20%-10%
-10%20%30%40%50%60%70%80%
Clothing, footwear and dept. stores
-
5%
10%
15%
20%
25%
30%
Food, liquor and pharmacies
Source: Marketview using Paymark data
Source: Marketview using Paymark data
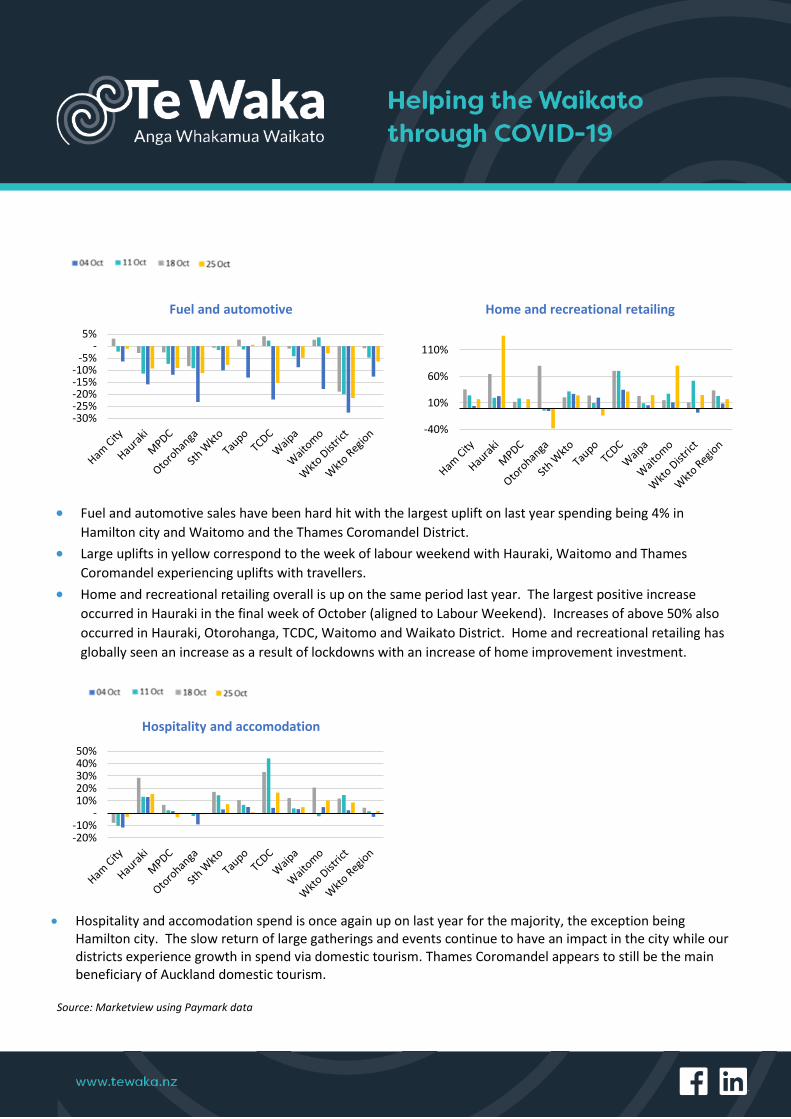
• Fuel and automotive sales have been hard hit with the largest uplift on last year spending being 4% in
Hamilton city and Waitomo and the Thames Coromandel District.
• Large uplifts in yellow correspond to the week of labour weekend with Hauraki, Waitomo and Thames
Coromandel experiencing uplifts with travellers.
• Home and recreational retailing overall is up on the same period last year. The largest positive increase
occurred in Hauraki in the final week of October (aligned to Labour Weekend). Increases of above 50% also
occurred in Hauraki, Otorohanga, TCDC, Waitomo and Waikato District. Home and recreational retailing has
globally seen an increase as a result of lockdowns with an increase of home improvement investment.
• Hospitality and accomodation spend is once again up on last year for the majority, the exception being
Hamilton city. The slow return of large gatherings and events continue to have an impact in the city while our districts experience growth in spend via domestic tourism. Thames Coromandel appears to still be the main beneficiary of Auckland domestic tourism.
-30%-25%-20%-15%-10%
-5%-
5%
Fuel and automotive
-40%
10%
60%
110%
Home and recreational retailing
-20%-10%
-10%20%30%40%50%
Hospitality and accomodation
Source: Marketview using Paymark data
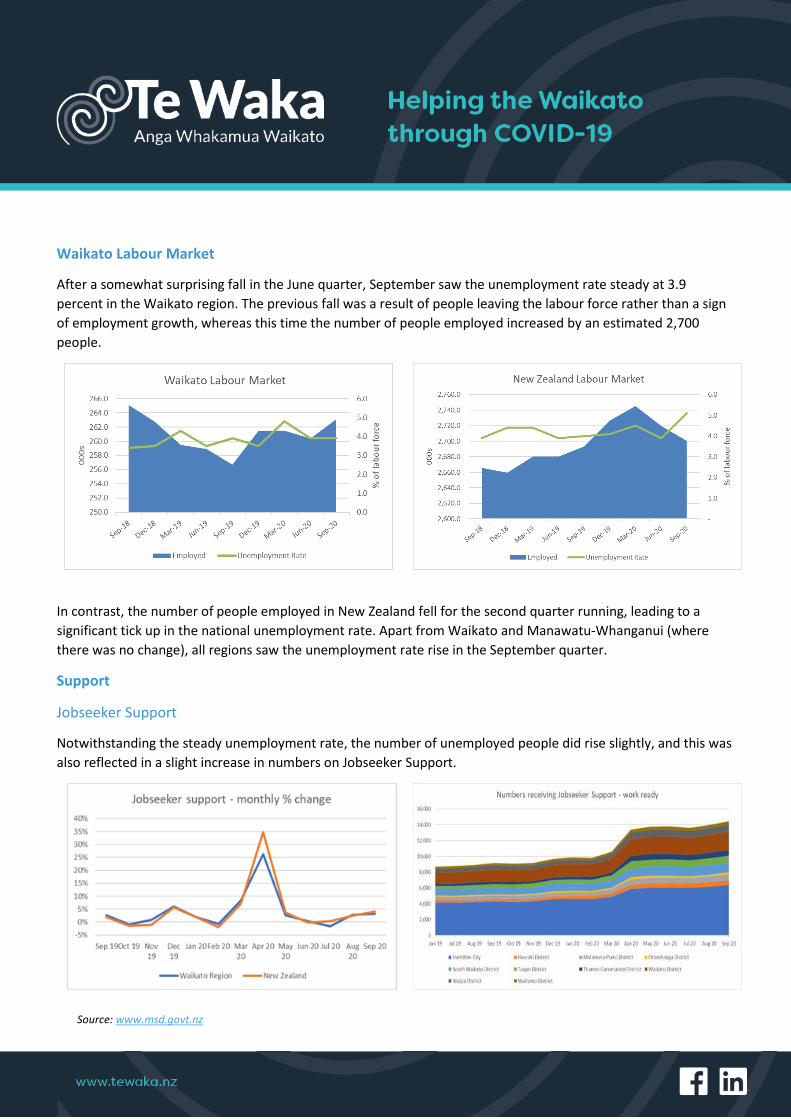
Waikato Labour Market
After a somewhat surprising fall in the June quarter, September saw the unemployment rate steady at 3.9
percent in the Waikato region. The previous fall was a result of people leaving the labour force rather than a sign
of employment growth, whereas this time the number of people employed increased by an estimated 2,700
people.
In contrast, the number of people employed in New Zealand fell for the second quarter running, leading to a
significant tick up in the national unemployment rate. Apart from Waikato and Manawatu-Whanganui (where
there was no change), all regions saw the unemployment rate rise in the September quarter.
Support
Jobseeker Support
Notwithstanding the steady unemployment rate, the number of unemployed people did rise slightly, and this was
also reflected in a slight increase in numbers on Jobseeker Support.
Source: www.msd.govt.nz

Hardship
Numbers for special grants for food have declined, while for the accommodation supplement they are rising, but
only slowly compared to the spike earlier on this year.
Building Consents
While it may not be surprising, given the pandemic, that residential building consents have been trending down in
2020, it is worth noting that the slowdown actually began more than a year ago. The downward trend followed a
similar pattern as in Auckland, with a lag of perhaps three months. Auckland’s pickup, which began around April
has yet to spill over the Bombay Hills though.
Source: www.msd.govt.nz
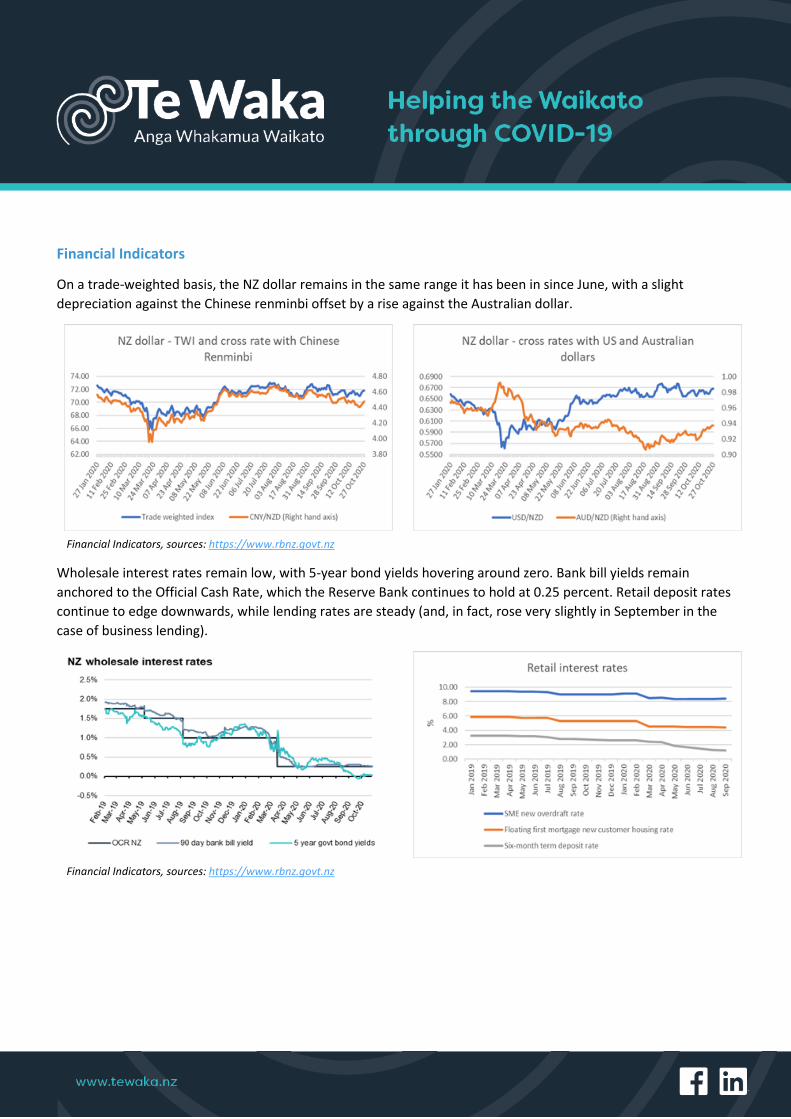
Financial Indicators
On a trade-weighted basis, the NZ dollar remains in the same range it has been in since June, with a slight
depreciation against the Chinese renminbi offset by a rise against the Australian dollar.
Wholesale interest rates remain low, with 5-year bond yields hovering around zero. Bank bill yields remain
anchored to the Official Cash Rate, which the Reserve Bank continues to hold at 0.25 percent. Retail deposit rates
continue to edge downwards, while lending rates are steady (and, in fact, rose very slightly in September in the
case of business lending).
Financial Indicators, sources: https://www.rbnz.govt.nz
Financial Indicators, sources: https://www.rbnz.govt.nz
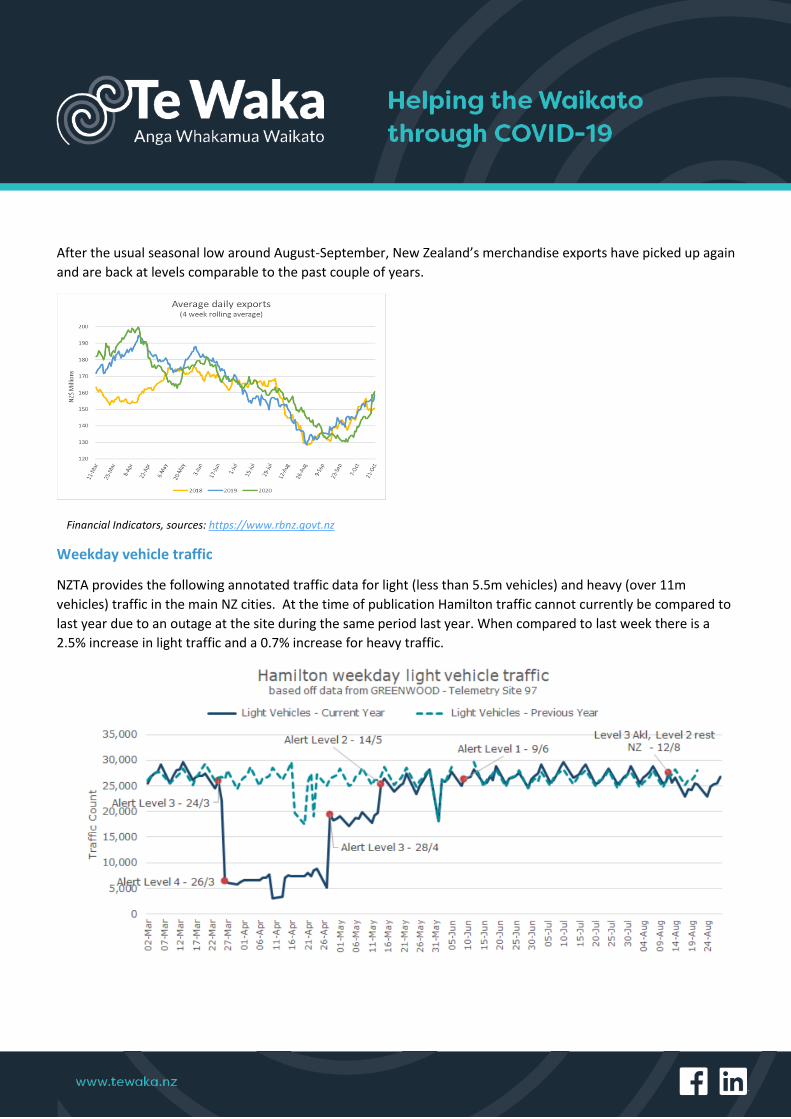
After the usual seasonal low around August-September, New Zealand’s merchandise exports have picked up again
and are back at levels comparable to the past couple of years.
Weekday vehicle traffic
NZTA provides the following annotated traffic data for light (less than 5.5m vehicles) and heavy (over 11m
vehicles) traffic in the main NZ cities. At the time of publication Hamilton traffic cannot currently be compared to
last year due to an outage at the site during the same period last year. When compared to last week there is a
2.5% increase in light traffic and a 0.7% increase for heavy traffic.
Financial Indicators, sources: https://www.rbnz.govt.nz
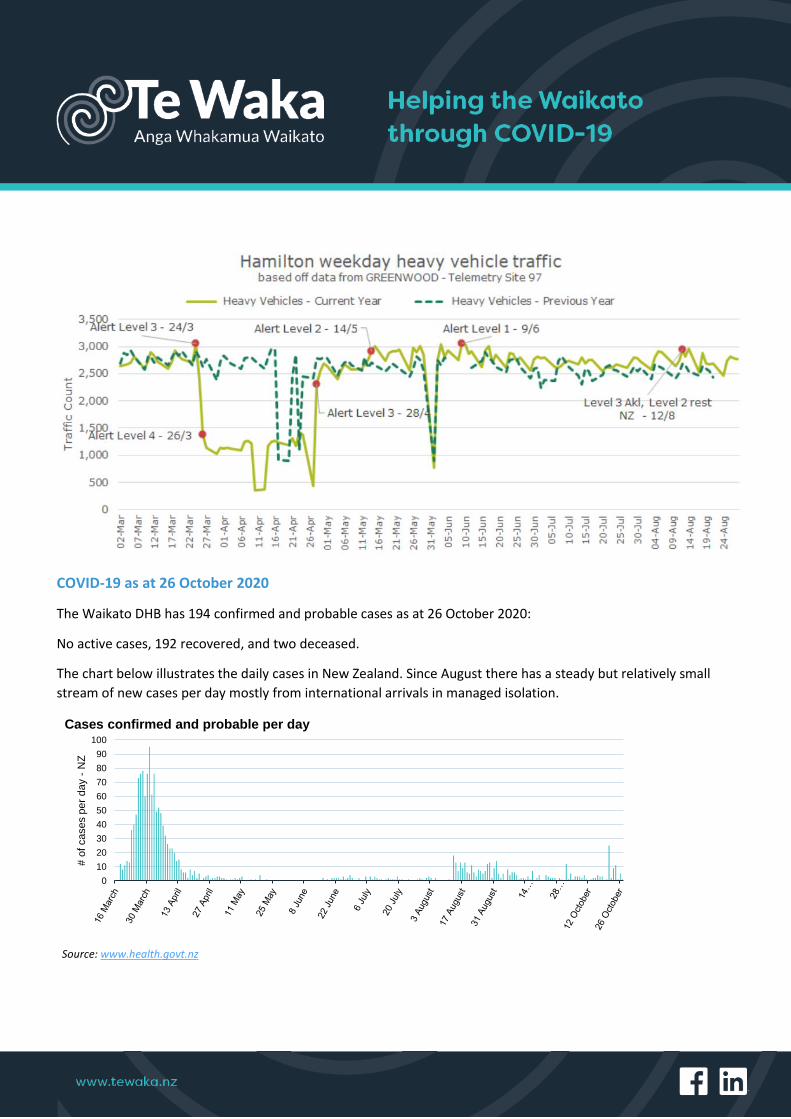
COVID-19 as at 26 October 2020
The Waikato DHB has 194 confirmed and probable cases as at 26 October 2020:
No active cases, 192 recovered, and two deceased.
The chart below illustrates the daily cases in New Zealand. Since August there has a steady but relatively small
stream of new cases per day mostly from international arrivals in managed isolation.
0
10
20
30
40
50
60
70
80
90
100
# o
f cases p
er
day -
NZ
Cases confirmed and probable per day
Source: www.health.govt.nz
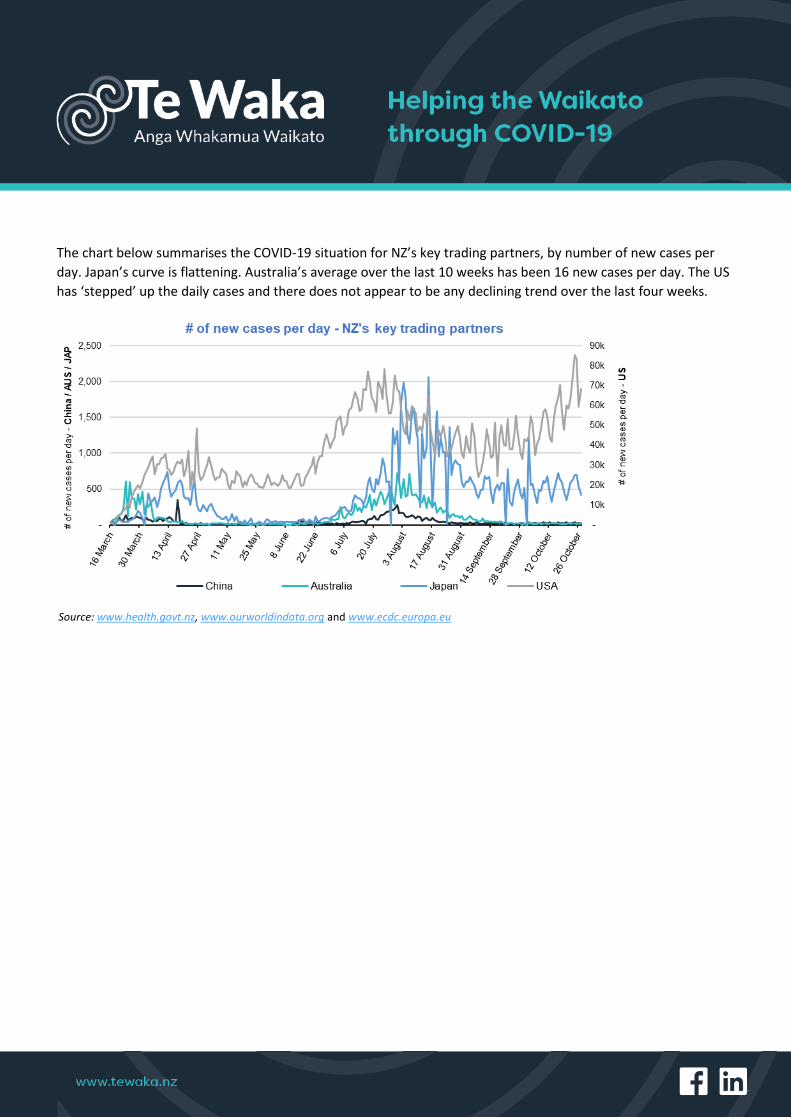
The chart below summarises the COVID-19 situation for NZ’s key trading partners, by number of new cases per
day. Japan’s curve is flattening. Australia’s average over the last 10 weeks has been 16 new cases per day. The US
has ‘stepped’ up the daily cases and there does not appear to be any declining trend over the last four weeks.
Source: www.health.govt.nz, www.ourworldindata.org and www.ecdc.europa.eu
www.ecdc.europa.eu