Embed Size (px)
Citation preview

Item 10: Workshop onDevelopment of the Elk River
Sediment Total Maximum Daily Load
March 15, 2012Fortuna, CA
Adona White, PEBasin Planning
North Coast Regional Water Quality Control Board

Presentation Overview
• TMDL Development– Watershed overview (Chapter 1)– WQ and BU Impairments, Nuisance
Conditions (Chapter 2)– Source Analysis (Chapter 3)
• Elk Waterbody Delineation• Restoration Summit• Next steps

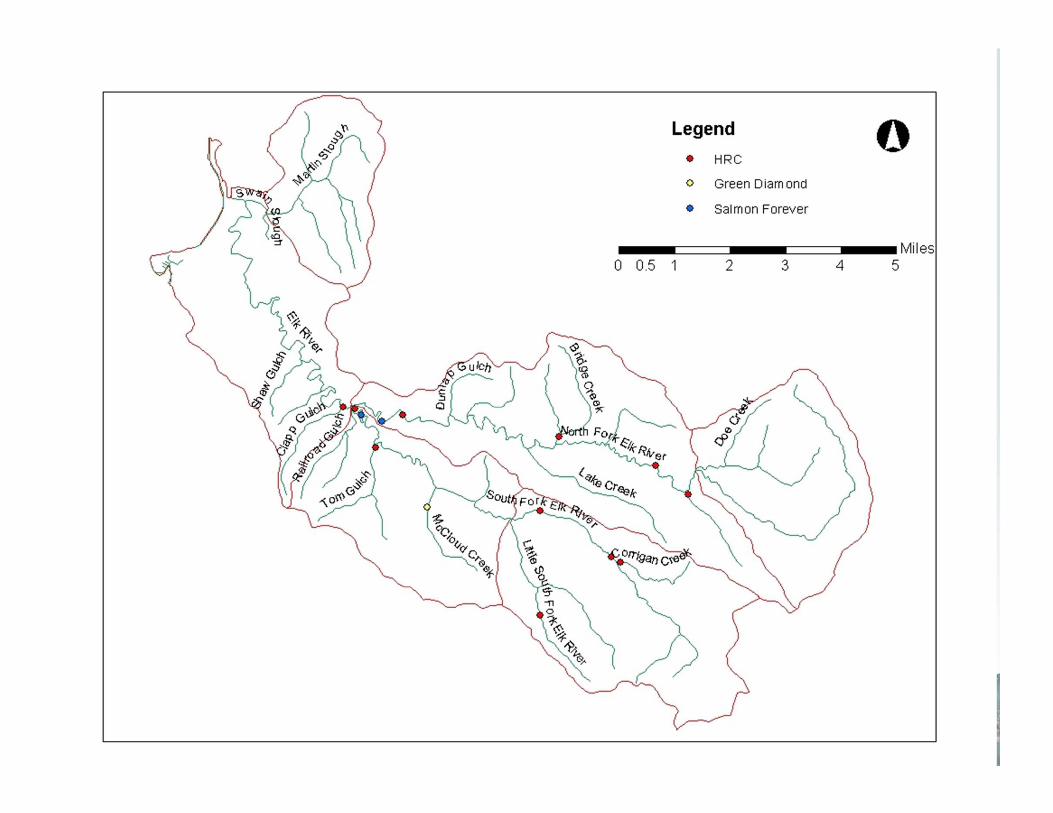
Elk River Watershed
58.3 square miles - North Fork Elk River (22.5mi2)- South Fork Elk River (19.5 mi2)- Lower Elk River (10.4 mi2)- Martin Slough (5.9 mi2)

Elk River Geologic Terrains

Elk River Hillslope Gradient

Elk River Landuse
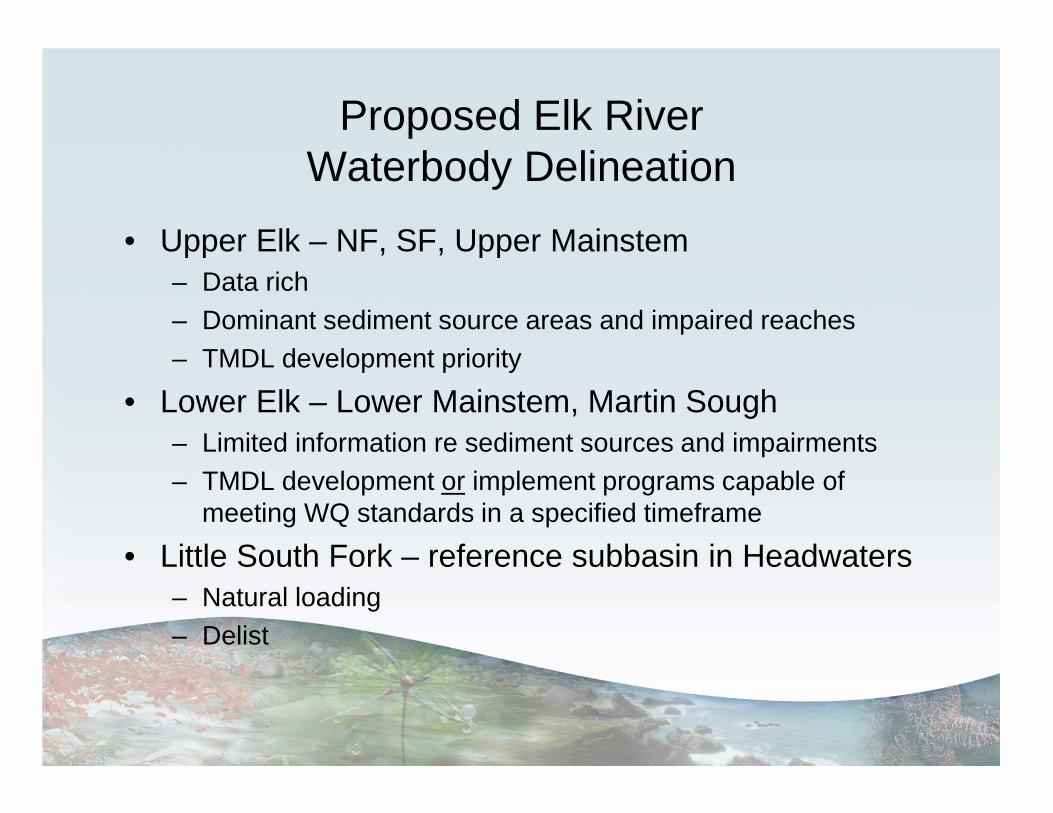
Proposed Elk River Waterbody Delineation
• Upper Elk – NF, SF, Upper Mainstem– Data rich– Dominant sediment source areas and impaired reaches– TMDL development priority
• Lower Elk – Lower Mainstem, Martin Sough– Limited information re sediment sources and impairments– TMDL development or implement programs capable of
meeting WQ standards in a specified timeframe
• Little South Fork – reference subbasin in Headwaters– Natural loading– Delist

Proposed Elk River Waterbody Delineation

History and Actions in Upper Elk• Managed for industrial timber harvesting for over a century1986-1998: Increased rate/scale of harvest & roads 1993-1998: THPs violations; water quality impacts; storm triggered
discharges of sediment; 303(d) listed; RB requires inventory/treatment plan, water supplies
1999: Headwaters Deal: PL HCP/SYP; Headwater Forest1999-2001: CDF moratorium on new THPs until watershed analysis,
flooding evaluation & monitoring2002: RB issues WDRs, CAOs, MRPs; leads mediation and science
panel, begins TMDL development2004: Identified need to address channel conveyance2006: WDRs addressing rate and scale of timber operations to control
harvest-related landslides and peak flows2008: HRC takes over PL lands

Beneficial Use Impairment &Exceedence of Water Quality Objectives
• Sediment deposition – Reduced channel capacity; altered morphology– Nuisance flooding conditions– Pool filling; spawning habitat
• Elevated suspended sediment concentrations and turbidity levels– Limit fish feeding and survivability– Limit water supplies; increased maintenance
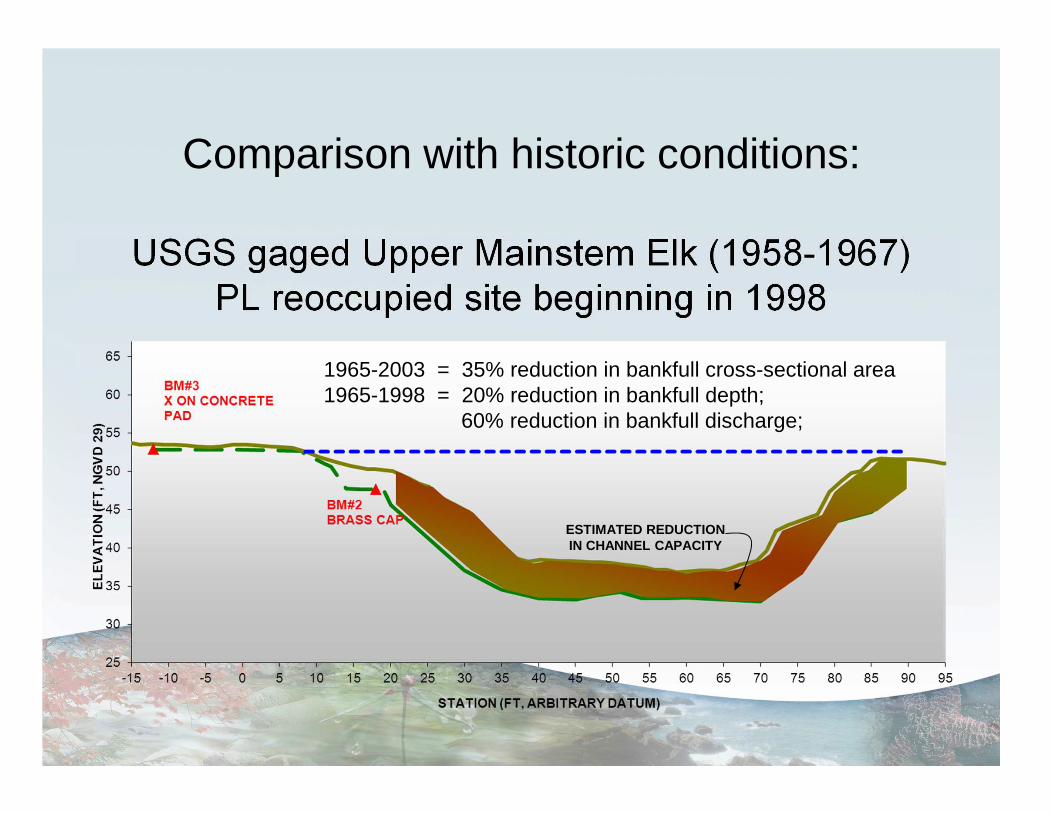
Comparison with historic conditions:
USGS gaged Upper Mainstem Elk (1958-1967)PL reoccupied site beginning in 1998
1965-2003 = 35% reduction in bankfull cross-sectional area1965-1998 = 20% reduction in bankfull depth;
60% reduction in bankfull discharge;
ESTIMATED REDUCTIONIN CHANNEL CAPACITY
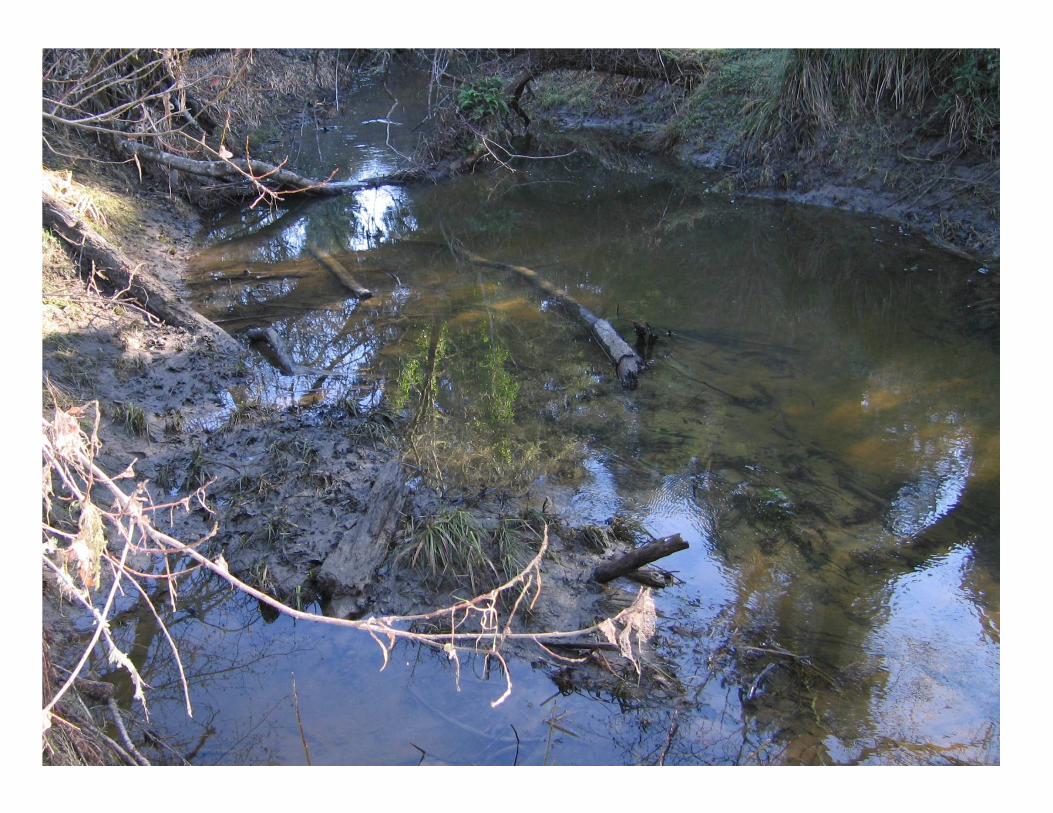

Flooding
Nuisance FloodingConditions
(California Water Code section 13050. )

Cumulative Effects
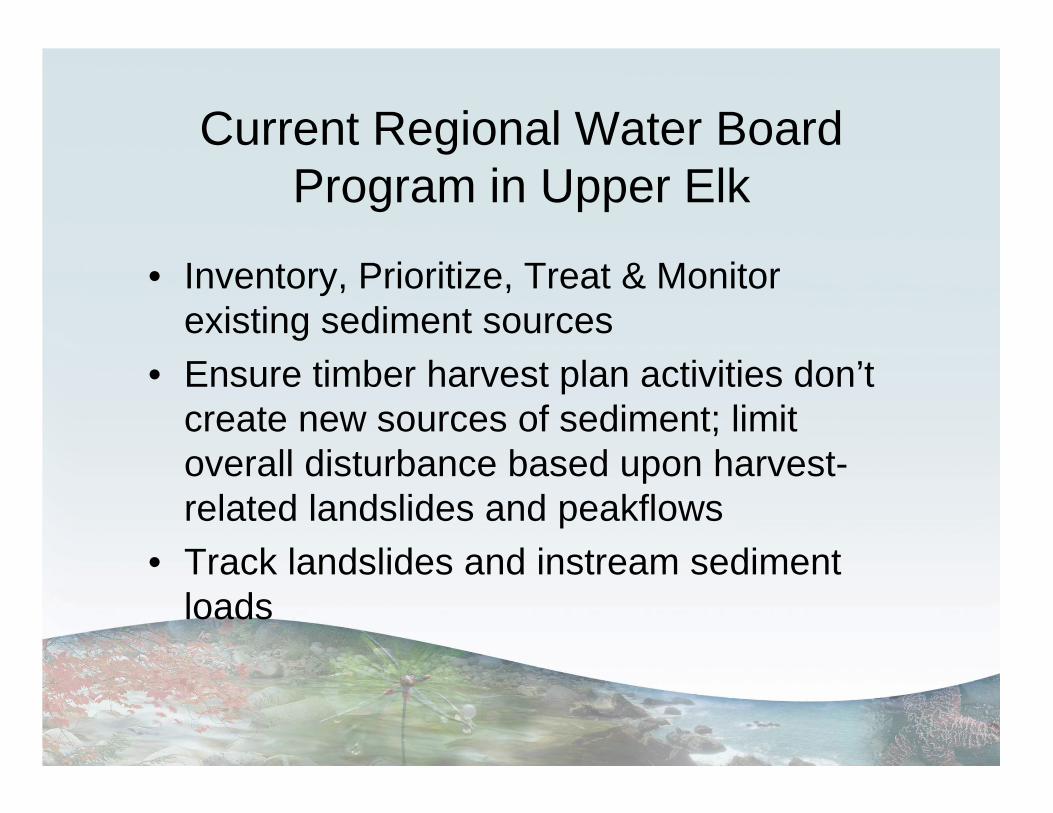
Current Regional Water Board Program in Upper Elk
• Inventory, Prioritize, Treat & Monitor existing sediment sources
• Ensure timber harvest plan activities don’t create new sources of sediment; limit overall disturbance based upon harvest-related landslides and peakflows
• Track landslides and instream sediment loads

Upper Elk River Source Analysis
• Timing and magnitude of natural and management-related hillslope sediment sources
• Sub-basin analyses based on site specific data
• Reference and managed study sub-basins for generalized loadings where no site specific data available
• Time periods analyzed: 1955-1966, 1967-1974, 1975-1987, 1988-1997, 1998-2000, and 2001-2003.– Recent time period pending updated landslide inventories
– Hillslope loads could be compared with SS loads

Upper Elk River Source AnalysisData sources:
• Humboldt Redwood Company
• Pacific Lumber Company• Green Diamond Resource
Company• Bureau of Land
Management• Pacific Watershed
Associates
• Stillwater Sciences• North Coast Regional
Water Board• Redwood Sciences
Laboratory• California Geologic
Survey• Salmon Forever• Humboldt State
University

Analysis of Upper Elk River Drainage Network
– Field-surveys of study sub-basins – Identified natural and managed drainage
area thresholds for channel initiation. – Calculated natural and managed drainage
network for analysis time periods.

Upper Elk Source Analysis: Natural
Sediment Source Data Sources Relied Upon / Approach Soil Creep Literature Bank Erosion Field surveys; natural drainage density estimate Small Streambank Landslides
Field surveys; natural drainage density estimate
Shallow Hillslope Landslides
Aeas not harvested in past 15 years Nat
ura
l
Deep seated Landslides
CGS mapped active features; Palco WA rates

Upper Elk Natural Sources Summary
0.4
8.9
26.130.1
2.9
68.4
0
20
40
60
80
Soil Creep Bank Erosion SmallStreambankLandslides
ShallowHillslope
Landslides
Deep seatedLandslides
Total
Natural Sediment Source Category
An
nu
al A
vera
ge
Sed
iem
nt
Lo
adin
g (
yd3 /m
i2 /yr)

Upper Elk Source Analysis: Management
Sediment Source Data Sources Relied Upon / Approach
Low Order Channel Incision
Field-based estimates of managed and natural drainage density; assumed 75% occurred in 1950’s and 5% in each subsequent decade
Management-Related Soil Creep Soil creep to management-induce channel network
Management-Related Bank Erosion
Field surveys in managed study sub-basins; managed drainage density estimate; subtracted natural loading
Management-Related Open Slope Shallow Landslides
Sub-basin specific landslide inventory data from Palco WA and 2005 ROWD; non-road-related slides, includes some skid-related slides
Man
agem
ent
Road-related Landslides
Sub-basin specific landslide inventory data from Palco WA and 2005 ROWD
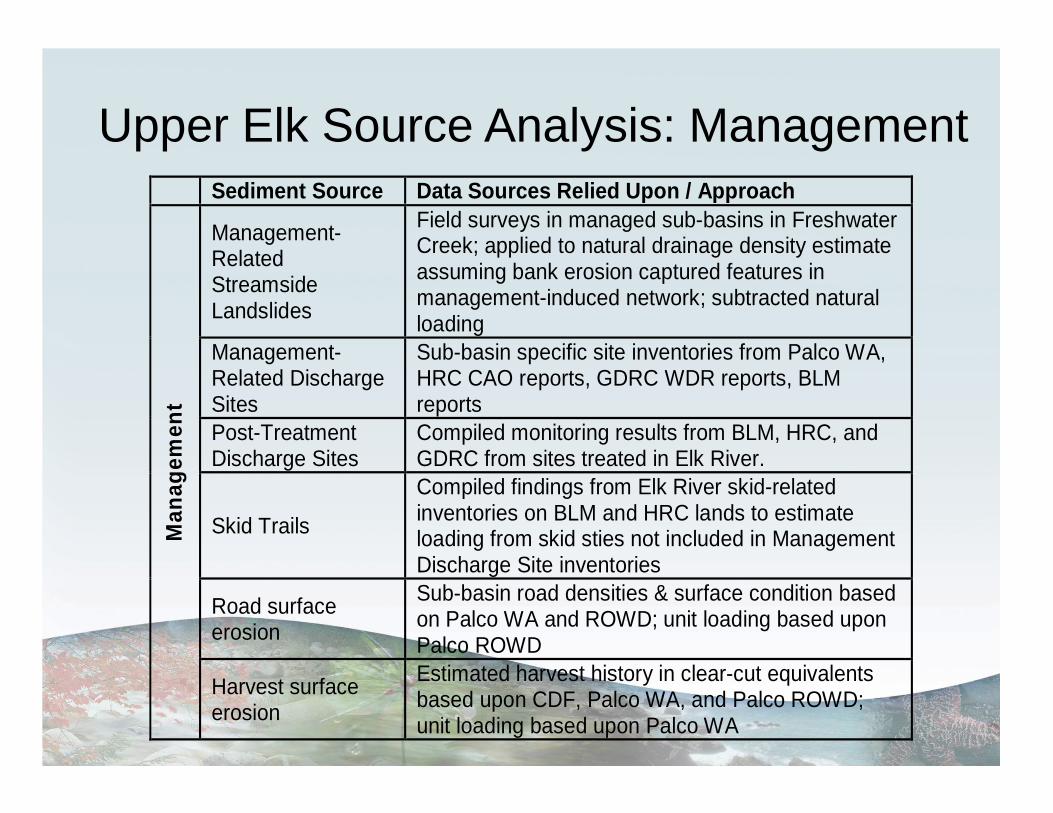
Sediment Source Data Sources Relied Upon / Approach
Management-Related Streamside Landslides
Field surveys in managed sub-basins in Freshwater Creek; applied to natural drainage density estimate assuming bank erosion captured features in management-induced network; subtracted natural loading
Management-Related Discharge Sites
Sub-basin specific site inventories from Palco WA, HRC CAO reports, GDRC WDR reports, BLM reports
Post-Treatment Discharge Sites
Compiled monitoring results from BLM, HRC, and GDRC from sites treated in Elk River.
Skid Trails
Compiled findings from Elk River skid-related inventories on BLM and HRC lands to estimate loading from skid sties not included in Management Discharge Site inventories
Road surface erosion
Sub-basin road densities & surface condition based on Palco WA and ROWD; unit loading based upon Palco ROWD
Man
agem
ent
Harvest surface erosion
Estimated harvest history in clear-cut equivalents based upon CDF, Palco WA, and Palco ROWD; unit loading based upon Palco WA
Upper Elk Source Analysis: Management

Upper Elk Management Sources Summary
1659%
824%
1144%
1036%
528%
906%
782
1134
564
361
708
620
0
100
200
300
400
500
600
700
800
900
1,000
1,100
1,200
1955-1966 1967-1974 1975-1987 1988-1997 1998-2000 2001-2003
Time period
Sed
imen
t Lo
adin
g (y
d3 /mi2 /y
r)
0%
200%
400%
600%
800%
1000%
1200%
1400%
1600%
1800%
Per
cent
of
Nat
ural
Loa
ding
Natural Loading Soil Creep Bank Erosion
Streamside Landslides Open Slope Shallow Landslides Road-related Landslides
Management-related discharge sites Skid Trails Post-Treatment Discharge Sites
Road Surface Erosion Harvest Surface Erosion Low Order Channel Incision
% of Natural Loading Total Loading

Comparison with Palco Watershed AnalysisTMDL Palco WA
Source Category 1988-2000
(yd3/mi2/yr) Source Category 1988-2000 (yd3/mi2/yr)
Soil Creep 0.44 Soil Creep 52 Bank Erosion 9 Bank Erosion 38 Shallow Landslides 26 Shallow Landslides 68 Streamside Landslides 30 Streamside Landslides 276 Deep Seated Landslides 0 Deep Seated Landslides 3
Nat
ura
l
Natural Total 66 Natural Total 437 Low Order Channel Headward Incision 24
Soil Creep 1 Bank Erosion 52 Bank Erosion 38
Streamside Landslides 272
Road-related Streamside Landslides
162
Open-slope Shallow Landslides 182
Open-slope Shallow Landslides
144
Road-related Shallow Landslides 237
Road-related Shallow Landslides
168
Discharge sites 59 Gullies 28 Skid Trails 15 Post-Treatment Discharge Sites 3 Road surface erosion 118 Road surface erosion 32 Harvest Surface Erosion 5 Surface Erosion 6
Man
agem
ent
Management Total 967 Management Total 579 Total Loading 1,033 Total Loading 1,016
Percent over Natural Loading 1,576% Percent over Natural
Loading 232%
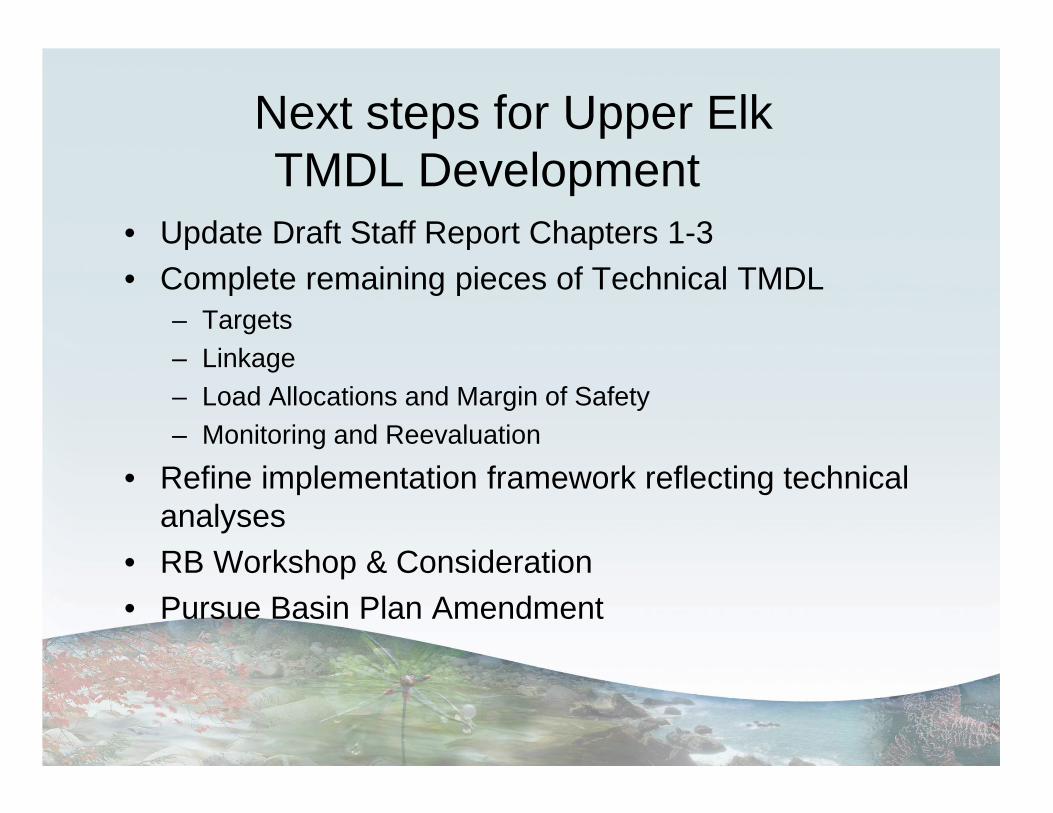
Next steps for Upper Elk TMDL Development
• Update Draft Staff Report Chapters 1-3• Complete remaining pieces of Technical TMDL
– Targets– Linkage– Load Allocations and Margin of Safety– Monitoring and Reevaluation
• Refine implementation framework reflecting technical analyses
• RB Workshop & Consideration• Pursue Basin Plan Amendment

Three Tiered Watershed Recovery Approach:
• Sediment loading to achieve water quality objectives and supportive of fisheries and water supplies– Build on current framework to further control
management-related sediment loads• Alleviate impairments from stored instream deposits
– Systems approach• Near-term projects that may result in improved
conditions; track performance
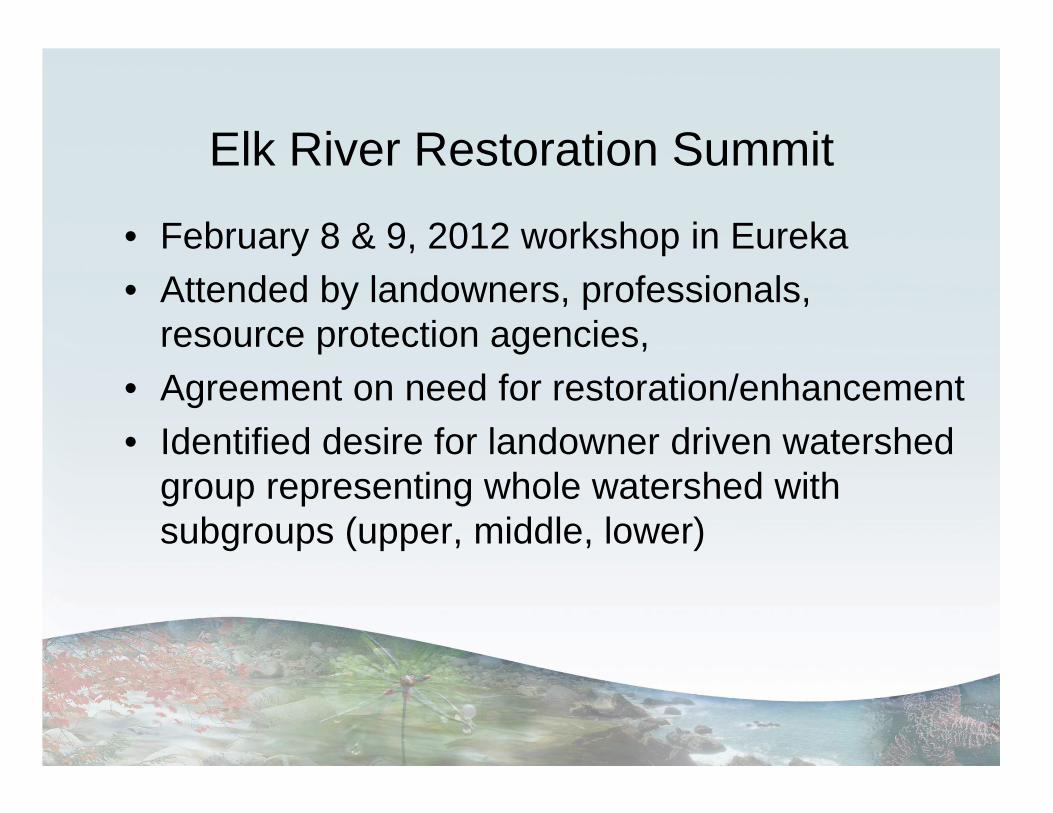
Elk River Restoration Summit
• February 8 & 9, 2012 workshop in Eureka• Attended by landowners, professionals,
resource protection agencies, • Agreement on need for restoration/enhancement• Identified desire for landowner driven watershed
group representing whole watershed with subgroups (upper, middle, lower)

Summer/Fall 2012 –Workshop & Consideration of Complete
Technical Package for Upper Elk
• Revised Chapters 1-3• Updated analysis of instream conditions relative to WQ
objectives and BUs• Source analysis for 2004-2010 loading• Desired target conditions: instream and hillslope• Linkage of instream suspended measurements and
hillslope estimates• Loading capacity based upon multiple indicators• Load allocations and MOS
Watershed Recovery
• TMDL to describe the watershed recovery plan
• Our program then should be designed to accomplish the plan– WDRs, CAOs, MRPs, partnerships

Track Elk River TMDL development, and download documents for review
and comment:http://www.waterboards.ca.gov/northcoast/
progams/tmdl/elk
Sign-up for announcements pertaining to Elk TMDL:
http://www.waterboards.ca.gov/resources/email_subscriptions/reg1_subscribe.shtml