Embed Size (px)
Citation preview
IT’S ALL ABOUT MONEY, HONEY!
AnalystAshutosh Narkar 5549 1767([email protected])
DealingSandeepa Arora 5549 1776Biren Patel 5677 5900
November 2005
Crew B.O.S Products Ltd
India Infoline Research can be also accessed on Bloomberg (Code IILL), Thomson First Call and ISI Emerging markets.
In vogue
November 25, 2005 2
Crew B.O.S Products Ltd - In vogue
Share Price Chart
Shareholding pattern
Recommendation : BUY
CMP : Rs167
Target Price : Rs251Potential Upside : 50%52 Week H / L : Rs50 / 209
Market Cap : Rs2.1bn
Avg. volume : 0.8-1mn
BSE code : 532542NSE code : CREWBOSReuters code : 532542.BO
Bloomberg code : N/A
Shareholding Percentage
Promoters 57.6
Domestic Institutions 10.0
FII 7.8
Public and Others 24.6
Crew B.O.S products is one of India’s leading exporter of fashion and home
accessories. The company earns more than 95% of its revenues from the
US and the European market. Its clientele include some of world’s big
retailers namely Next, GAP, Fossil, Chico, Tesco, Laura Ashley and many
others among its clientele. The company has performed consistently in
the past with revenue CAGR of 46% and earnings CAGR of 44%over the
last five years. Post its recent GDR issue, the company is poised to expand
its operations and also enter the leather-finishing segment. We expect the
company to post revenue CAGR of 55% and earnings CAGR of 60% during
FY05-08. We initiate coverage on the company with a buy rating with a
12-15 month horizon and a price target of Rs251. This implies a potential
upside of around 50% from the current market price of Rs167.
Investment highlights
Growing fashion accessory market to drive profit CAGR of 54%(FY05-08)
Worldwide sales of fashion accessory are around 10%-12% of apparel sales.
This is up from an earlier percentage of about 6%-7% few years back. Crew
B.O.S with a strong list of major retailers in its client list is expected to benefit
from this growing trend of fashion accessories business world over. We expect
the company to post earnings CAGR of 54% during FY05-08.
Company has sustainable competitive advantage in designing capabilities
India and Crew B.O.S in particular is competing on cost competitiveness along
with strong design capabilities to keep the Chinese low cost advantage at
bay. While the Chinese score on production line, Indian companies score on
the drawing boards, helping earn a premium. Most big retailers world over
have started tapping Crew B.O.S for their fashion accessories business. The
company is also in talks with major retailers to outsource their product designing.
Leather finishing segment to give scalability to the revenue model
Acquisition of the Jalandhar unit for backward integration and expansion of
leather finishing plant to service the Chinese market is expected to give scalability
to the company’s revenue model. We expect this segment to earn operating
margins of around 15% and contribute 12-15% of revenues from FY07 onwards.
Key Financials FY04 FY05 FY06P FY07P FY08P (12) (12) (12) (12) (12)Sales (Rs mn) 554 810 1,424 2,310 3,000Growth (%) 5.3 46.3 75.7 62.2 29.9OPM (%) 12.7 15.0 16.6 16.0 15.8Net Profit (Rs mn) 42 82 172 264 335Growth (%) 27.2 95.9 109.9 53.3 26.9EPS (Rs) 6.1 7.5 13.4 20.6 26.1PE (x) 27.9 22.4 12.4 8.1 6.4P/BV (x) 8.4 5.3 2.9 2.2 1.7EV/ EBITDA 18.2 17.2 10.2 7.0 5.4ROAE (%) 34.2 33.7 32.0 31.1 29.8ROACE (%) 21.9 23.0 23.2 23.6 23.5Source: Company data, India Infoline estimates
November 25, 2005 3
Crew B.O.S Products Ltd - In vogue
Table of ContentsSr. No Particulars Page No.1 Valuation rationale 42 Industry scenario 53 Company Background 74 Management Team 75 Business profile 86 Investment rationale 9
Investment positives Investment concerns
7 Financials 14
November 25, 2005 4
Crew B.O.S Products Ltd - In vogue
Terminal GrowthRate (%)
The company has been trading in PE (x) band of 12-14 one-year forward earnings.
Crew B.O.S does not have a like comparison in the Indian market in terms of
business (Fashion Accessories). The company uses both leather (60%) and
textiles (40%) for its products and would be unfair to term it as a leather company.
As a result we refrain from valuing the company on relative basis and value it
using a two-stage DCF model. We have used a WACC of 10.5% and a terminal
growth rate of 3%. We arrive at a one-year forward value of Rs251 implying a
potential upside of 50% from the current market price of Rs167. Our target price
discounts the FY07 earnings at a multiple of 12.4x.
We feel Crew B.O.S with many inherent advantages like value added product,
niche business segment and strong earnings growth would command higher
valuations over the leather companies with vanilla products.
Since one half of the current year has already elapsed we have valued the
company from an FY07 perspective and considering FY06 as the base year.
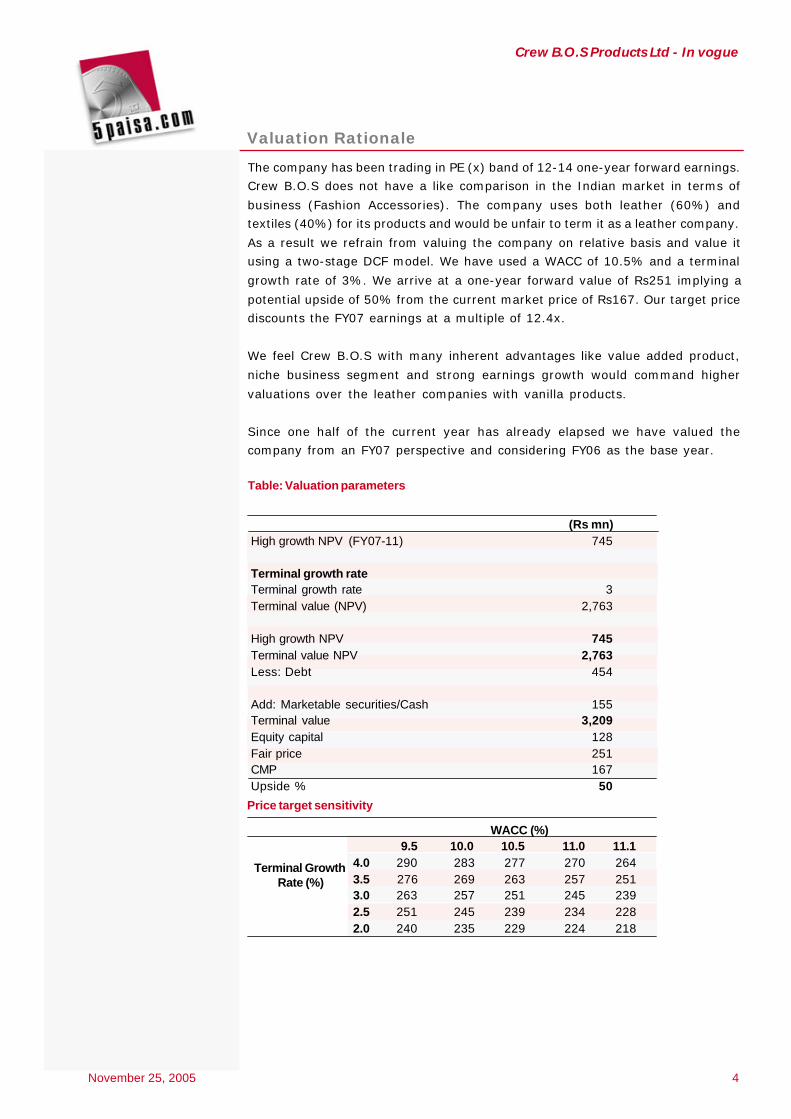
Table: Valuation parameters
(Rs mn)High growth NPV (FY07-11) 745 Terminal growth rate Terminal growth rate 3Terminal value (NPV) 2,763 High growth NPV 745Terminal value NPV 2,763Less: Debt 454
Add: Marketable securities/Cash 155Terminal value 3,209Equity capital 128Fair price 251CMP 167Upside % 50
Price target sensitivity
Valuation Rationale
WACC (%)9.5 10.0 10.5 11.0 11.1
4.0 290 283 277 270 2643.5 276 269 263 257 2513.0 263 257 251 245 2392.5 251 245 239 234 2282.0 240 235 229 224 218

November 25, 2005 5
Crew B.O.S Products Ltd - In vogue
US$mn FY99 FY00 FY01 FY02 FY03 World Leather Accessories Imports 7,120 7,702 7,996 8,464 9,476 India Export Share % 5.8 6.3 5.5 5.5 6.2 World Leather Imports 71,701 77,330 80,784 81,877 88,182 India Exports Share % 2.2 2.5 2.4 2.3 2.5
Source: CLE
Fashion accessory- Industry scenario
Fashion accessories segment has been gaining momentum over the past few
years. The demand however, is currently concentrated in the developed regions
of US and Europe. The major markets for these fashion accessories are USA,
UK, Europe and Australia. Competition to the Indian exporters in this segment
comes from China, Korea and Turkey. However, India’s skilled resources at low
cost and its ability to provide the market with fashion accessories of different
design, feel and texture gives it a competitive advantage over its counterparts.
India is beginning to get appreciation for its work in this industry and brand
India is gradually gaining strength world over.
Fragmented nature of the industry makes it difficult to estimate the market
size. The industry is divided into different segments like handbags, belts, wallets,
eyewear, neckwear, watches, gloves, hats, hosiery, other accessories, home
furnishing products etc. These fashion accessories are marketed through mass
merchandisers, department stores and specialty shops depending on their price
and quality. Consumers are becoming more aware of accessories as fashion
statements, and as a result, are purchasing brand name and quality items that
complement other fashion items.
Leather fashion accessory segment
Leather forms a critical component of the fashion accessory segment, with most
of the products like handbags, belts, wallets, home furnishings, fashion wear
shoes all using leather as raw material. The growth in this sector is exports
driven resulting from developed nations switching manufacturing hubs to low
cost nations like China and India. Even traditional leather producing countries
like Italy have resorted to outsource their manufacturing to India and other
developing nations, due to increasing costs and environmental concerns. Other
major leather product consuming countries like Spain, Germany and USA, have
started evaluating outsourcing their leather product requirements to the Indian
subcontinent.
Table: Indian leather industry export market share in world leather imports
November 25, 2005 6
Crew B.O.S Products Ltd - In vogue
Table: Major leather exporting countries and their market share
FY99 FY00 FY01 FY02 FY03China 15.9% 17.8% 18.2% 19.7% 21.8%Italy 16.1% 15.9% 16.3% 15.8% 15.9%Brazil 2.8% 3.1% 3.2% 3.1% 3.2%India 2.2% 2.5% 2.4% 2.3% 2.5%Korea 3.2% 3.2% 2.7% 2.2% 1.9%Indonesia 2.5% 2.5% 2.2% 1.6% 1.5%Thailand 1.8% 1.7% 1.6% 0.0% 1.4%Taiwan 2.2% 2.0% 1.6% 1.6% 1.4%Mexico 1.1% 1.1% 0.9% 0.8% 0.8%Turkey 0.6% 0.6% 0.6% 0.6% 0.6%
Source: CLE
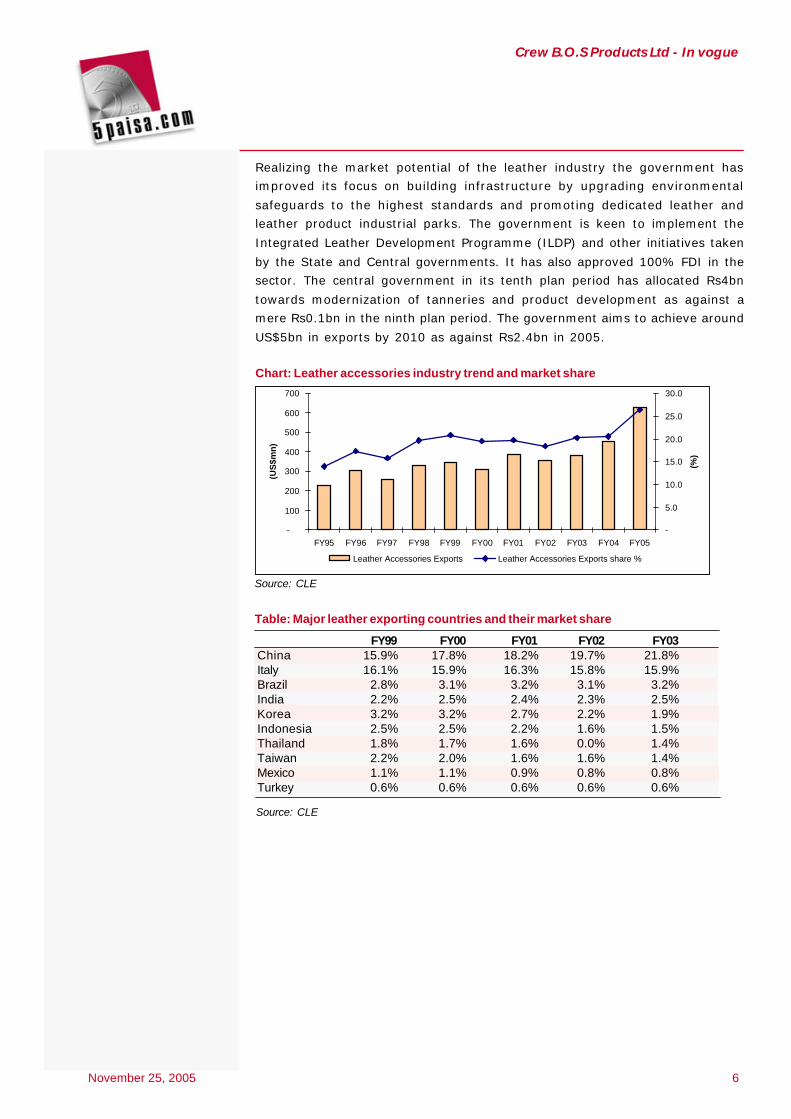
Realizing the market potential of the leather industry the government has
improved its focus on building infrastructure by upgrading environmental
safeguards to the highest standards and promoting dedicated leather and
leather product industrial parks. The government is keen to implement the
Integrated Leather Development Programme (ILDP) and other initiatives taken
by the State and Central governments. It has also approved 100% FDI in the
sector. The central government in its tenth plan period has allocated Rs4bn
towards modernization of tanneries and product development as against a
mere Rs0.1bn in the ninth plan period. The government aims to achieve around
US$5bn in exports by 2010 as against Rs2.4bn in 2005.
Chart: Leather accessories industry trend and market share
Source: CLE
-
100
200
300
400
500
600
700
FY95 FY96 FY97 FY98 FY99 FY00 FY01 FY02 FY03 FY04 FY05
(US
$mn
)
-
5.0
10.0
15.0
20.0
25.0
30.0
(%)
Leather Accessories Exports Leather Accessories Exports share %
November 25, 2005 7
Crew B.O.S Products Ltd - In vogue
Background
Crew B.O.S. Products Limited (formerly known as Motherson Unimetex Private
Limited) was established in 1988. The company has grown from being a fashion
bag and belt manufacturer initially to a manufacturer of multiple products in the
fashion accessories segment. It is primarily engaged in the manufacturing and
marketing of lifestyle fashion accessories and premium home decoration
products to reputed retailers like GAP, Next PLC, Fossil, Esprit etc in US and
Europe. It currently operates its manufacturing facilities from seven factories,
all in India.
The company in August 2004 tapped the capital markets to fund its expansion
plans. The company raised Rs140mn through the initial public offer. The company
recently concluded its GDR offering in August 2005 and raised around Rs220mn
to further expand its existing capacities.
Management Team
Mr.Tarun Oberoi, Managing Director (Age 44 years)
Mr.Oberoi is the founding promoter of Crew B.O.S. He holds a bachelors degree
in Commerce from the Delhi University along with a management diploma through
the Oberoi School of Hotel Management. Before promoting the company he had
a 4-year experience in East India Hotels at various positions both in India and
abroad.
Mr.Robin Bartholomew, Whole time Director (Age 45 years)
Mr.Bartholomew is the co promoter of the company. He holds a post-graduate
diploma in Sociology from the Delhi School of Economics. He holds a Diploma in
Hotel Management from the Oberoi School of Hotel Management. He worked
with East India Hotels Limited for 4 years at various positions in India. He
joined Crew BOS in June 1991 as promoter director
Mr.Puneet Nikore, Director Finance (Age 41 years)
Mr.Nikore is chartered accountant by profession and heads the commercial and
finance function of the company. He has been associated with the company
since inception in various capacities as auditor, Vice-President Finance and
currently as Director finance. His areas of specialization are project financing,
company law matters, audit and direct tax matters.
Company Profile
November 25, 2005 8
Crew B.O.S Products Ltd - In vogue
Business profile
Product mix
Revenue share (%) FY03 FY04 FY05Fashion Bags 59.9 27.8 35.9Fashion belts 25.4 17.4 28.3Wallets 3.5 4.0 4.6Fashion Footwear - 4.8 9.6Home Accessories 10.8 40.2 14.1Others 0.4 5.8 7.6
Business geography Revenue share %
Region FY03 FY04 FY05USA 79.3 41.1 53.6Europe 19.4 29.2 42.4India - 29.3 0.3Rest of the world 1.3 0.4 3.7Total 100.0 100.0 100.0
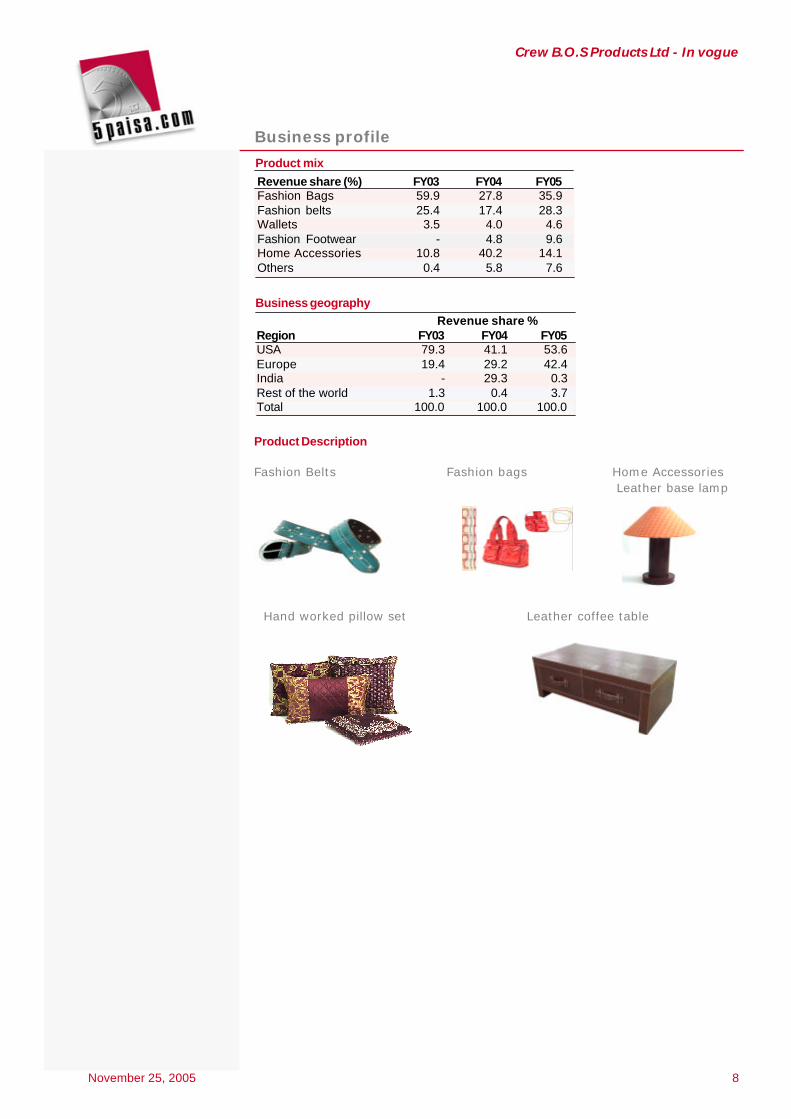
Product Description
Fashion Belts Fashion bags Home Accessories Leather base lamp
Hand worked pillow set Leather coffee table
November 25, 2005 9
Crew B.O.S Products Ltd - In vogue
Investment rationaleIndia emerging as a leather fashion goods outsourcing hubOver the past few years with globalization dictating terms, production base inmany developed countries has been shifting towards low cost Asian and otherdeveloping nations. Like many industries namely the auto and auto ancillary, theleather industry and leather fashion accessory segment in particular has been abig beneficiary. The growth potential can be seen in the positive trend over the
last decade. The leather accessories segment has shown tremendous potentialregistering a 10-year CAGR of 10.7%. It has outperformed the leather footwearindustry, which historically has been the focus area in the backdrop of majorshoe multinationals establishing base in India.
Table: Leather exports from India in US$mn1996 2000 2001 2002 2003 2004 2005 CAGR
Finished Leather 371 240 381 459 509 556 577 4.2%Leather Footwear 340 377 381 395 423 553 602 7.1%Footwear Component 243 215 238 234 175 161 164 (4.1)%Leather Garments 414 347 460 379 272 301 319 (1.9)%Leather Accessories 305 313 386 357 379 456 628 10.7%Leather Goods 284 279 344 321 335 403 568 10.5%Saddlery And Harness 21 34 43 36 44 53 60 12.4%Leather Gloves 79 98 97 86 90 136 - Non-Leather Footwear 11 14 19 26 27 53 90 20.4%Total 1,763 1,604 1,964 1,936 1,875 2,216 2,379 3.9%Source: CLE, India Infoline estimates
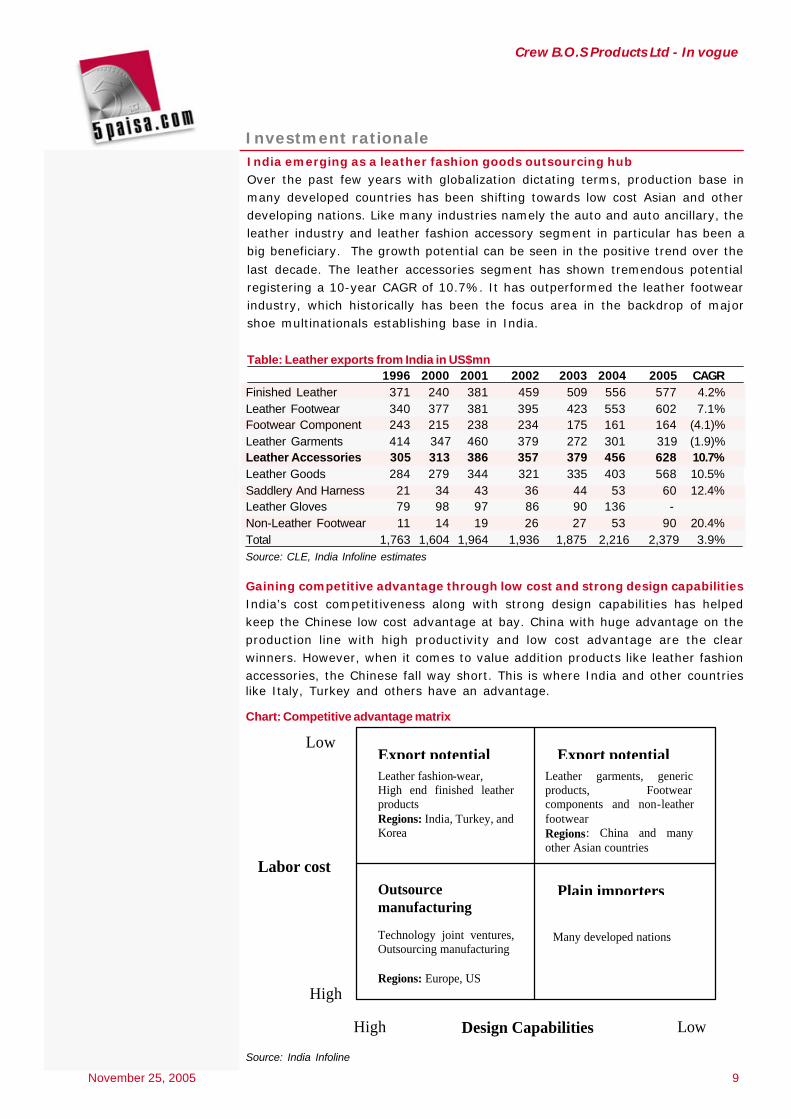
Gaining competitive advantage through low cost and strong design capabilitiesIndia’s cost competitiveness along with strong design capabilities has helpedkeep the Chinese low cost advantage at bay. China with huge advantage on theproduction line with high productivity and low cost advantage are the clearwinners. However, when it comes to value addition products like leather fashionaccessories, the Chinese fall way short. This is where India and other countrieslike Italy, Turkey and others have an advantage.
Chart: Competitive advantage matrix
Leather fashion-wear, High end finished leather products Regions: India, Turkey, and Korea
Technology joint ventures, Outsourcing manufacturing Regions: Europe, US
Leather garments, generic products, Footwear components and non-leather footwear Regions: China and many other Asian countries
Many developed nations
Export potential Export potential
Outsource manufacturing
Plain importers
Low
High
High
Low
Labor cost
Design Capabilities
Source: India Infoline
November 25, 2005 10
Crew B.O.S Products Ltd - In vogue
While the Italians have developed this art and still are a force to reckon in this
business, high manufacturing cost is slowly moving the manufacturing base from
the European countries to the Asian countries and especially India. Most big
retailers world over have started tapping Crew B.O.S for their fashion accessories
business. The company boasts of clients like Next, GAP, Fossil and many others.
In house design capabilities and advanced Italian technology providing a
competitive edge
Crew B.O.S. is in a unique position where more than 50% of its turnover comes
from manufacture of products researched and designed in house. The company
has an in-house design team of 18 people. The company is exploring opportunities
to outsource the designing capabilities of its major customers. Designing
capabilities sets the company apart from most of its Chinese counterparts, who
are more into generalized product manufacturing like belts and bags. This has
also helped the company get better realizations on its products.
Multiple factors should contribute to robust revenue growth over the next
few years
The growing fashion accessories business world over and Crew B.O.S’s established
brand in servicing world’s big retailers is expected to place the company in a
strong position to tap the outsourcing business of these big retailers. The company
has also leveraged well on its existing client relationship to increase its revenues
from Fossil for export of leather watchstraps. The company is also entering the
leather finishing business through expansion of its existing plant, which is
expected to give scalability to the revenue model. This will help the company
serve the Chinese market with its finished leather products. We expect all these
to help the company to post revenue CAGR of 58% during FY06-08.
Ø Growing fashion accessories business world over
Worldwide sales of fashion accessory are around 10%-12% in comparison
to apparel sales. This is up from an earlier percentage of about 6%-7% few
years back. Accessories besides giving a differentiation and increasing the
product line also offer high margins compared to apparel. This is now making
accessory a much larger segment than it has been historically and therefore
offers significantly more opportunities with lesser competition in comparison
to apparel.
Ø Fashion accessory major Fossil’s stake in the company could lead to
more business
The company has a good client relationship with Fossil. Fossil has also
acquired around 3% of the company’s equity in the latest GDR offering.
Fossil sources majority of its requirements from Asia and China and Hong
Kong in particular. We see Fossil’s stake in the company as a move towards
increasing it’s sourcing from India and Crew B.O.S. in particular. Most other
retailers world over have been looking at other Asian markets to reduce
their exposure to China. This is expected to benefit Crew Bos positively as
the company has now proved itself on the international stage for its product
variety and design capabilities.
November 25, 2005 11
Crew B.O.S Products Ltd - In vogue
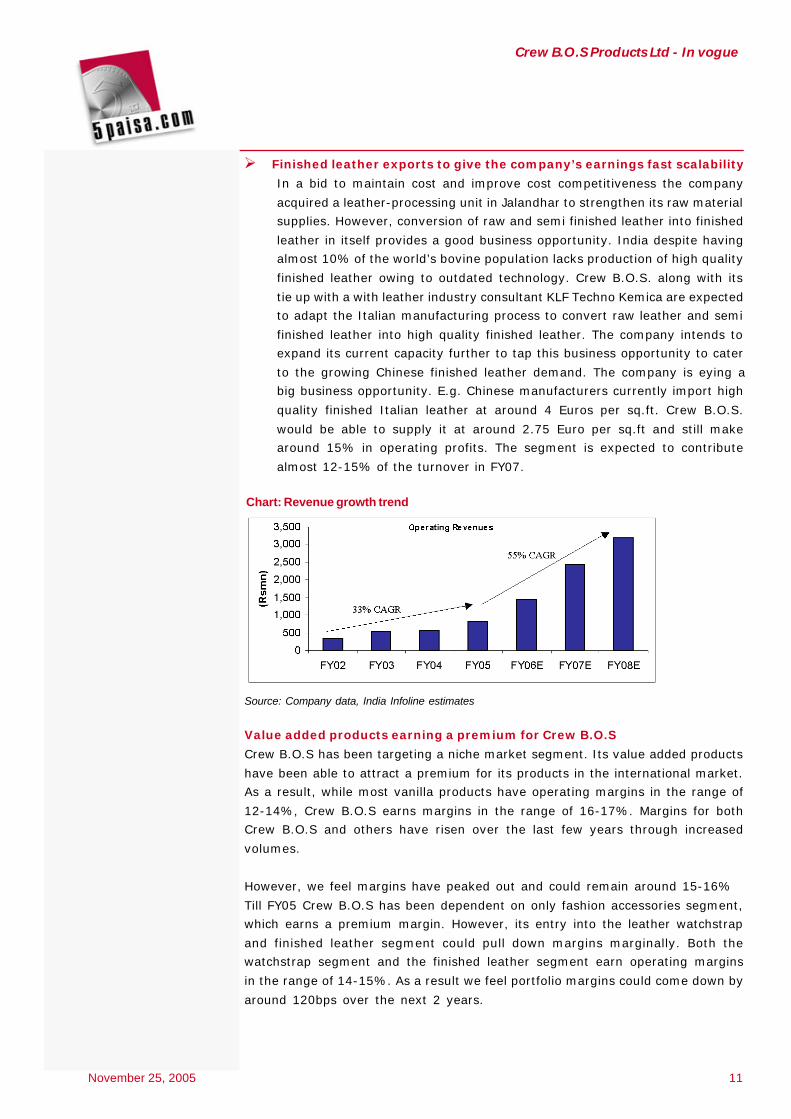
Ø Finished leather exports to give the company’s earnings fast scalability
In a bid to maintain cost and improve cost competitiveness the company
acquired a leather-processing unit in Jalandhar to strengthen its raw material
supplies. However, conversion of raw and semi finished leather into finished
leather in itself provides a good business opportunity. India despite having
almost 10% of the world’s bovine population lacks production of high quality
finished leather owing to outdated technology. Crew B.O.S. along with its
tie up with a with leather industry consultant KLF Techno Kemica are expected
to adapt the Italian manufacturing process to convert raw leather and semi
finished leather into high quality finished leather. The company intends to
expand its current capacity further to tap this business opportunity to cater
to the growing Chinese finished leather demand. The company is eying a
big business opportunity. E.g. Chinese manufacturers currently import high
quality finished Italian leather at around 4 Euros per sq.ft. Crew B.O.S.
would be able to supply it at around 2.75 Euro per sq.ft and still make
around 15% in operating profits. The segment is expected to contribute
almost 12-15% of the turnover in FY07.
Chart: Revenue growth trend
Source: Company data, India Infoline estimates
Value added products earning a premium for Crew B.O.S
Crew B.O.S has been targeting a niche market segment. Its value added products
have been able to attract a premium for its products in the international market.
As a result, while most vanilla products have operating margins in the range of
12-14%, Crew B.O.S earns margins in the range of 16-17%. Margins for both
Crew B.O.S and others have risen over the last few years through increased
volumes.
However, we feel margins have peaked out and could remain around 15-16%
Till FY05 Crew B.O.S has been dependent on only fashion accessories segment,
which earns a premium margin. However, its entry into the leather watchstrap
and finished leather segment could pull down margins marginally. Both the
watchstrap segment and the finished leather segment earn operating margins
in the range of 14-15%. As a result we feel portfolio margins could come down by
around 120bps over the next 2 years.
November 25, 2005 12
Crew B.O.S Products Ltd - In vogue
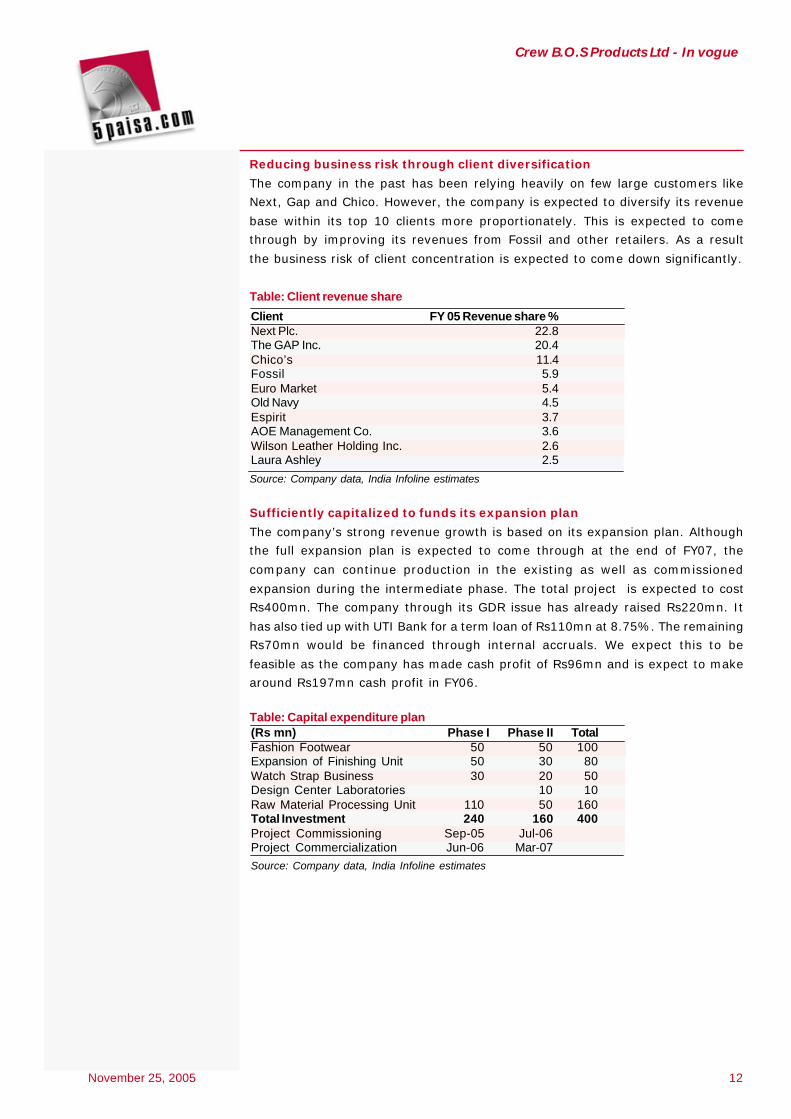
Reducing business risk through client diversification
The company in the past has been relying heavily on few large customers like
Next, Gap and Chico. However, the company is expected to diversify its revenue
base within its top 10 clients more proportionately. This is expected to come
through by improving its revenues from Fossil and other retailers. As a result
the business risk of client concentration is expected to come down significantly.
Table: Client revenue share
Client FY 05 Revenue share %Next Plc. 22.8The GAP Inc. 20.4Chico’s 11.4Fossil 5.9Euro Market 5.4Old Navy 4.5Espirit 3.7AOE Management Co. 3.6Wilson Leather Holding Inc. 2.6Laura Ashley 2.5
Source: Company data, India Infoline estimates
Sufficiently capitalized to funds its expansion plan
The company’s strong revenue growth is based on its expansion plan. Although
the full expansion plan is expected to come through at the end of FY07, the
company can continue production in the existing as well as commissioned
expansion during the intermediate phase. The total project is expected to cost
Rs400mn. The company through its GDR issue has already raised Rs220mn. It
has also tied up with UTI Bank for a term loan of Rs110mn at 8.75%. The remaining
Rs70mn would be financed through internal accruals. We expect this to be
feasible as the company has made cash profit of Rs96mn and is expect to make
around Rs197mn cash profit in FY06.
Table: Capital expenditure plan(Rs mn) Phase I Phase II TotalFashion Footwear 50 50 100Expansion of Finishing Unit 50 30 80Watch Strap Business 30 20 50Design Center Laboratories 10 10Raw Material Processing Unit 110 50 160Total Investment 240 160 400Project Commissioning Sep-05 Jul-06 Project Commercialization Jun-06 Mar-07 Source: Company data, India Infoline estimates
November 25, 2005 13
Crew B.O.S Products Ltd - In vogue
Effective tax rate to remain around 5% till FY10The company derives more than 95% of the revenues from the export market.This it does by exporting through the Export Oriented Units (EOU). This presentsthe company a 100% tax holiday till FY10. As a result the effective tax rate forthe company has been around 3%. Post expansion of the leather finishing plant,the company is expected to derive some revenues from the Indian market. Toremain conservative we have estimated only 85% of the revenues to come fromthe export market. In effect the company would continue to enjoy a 100% taxholiday on 85% of the revenues, while pay a 33% tax rate on the remaining15% earnings. This results in an effective tax rate of 5% till FY10.
Investment concerns
Successful and timely completion of the expansion plan critical for growthAlthough the company’s future growth exudes confidence, the incremental highgrowth is expected to trickle down post expansion. The company has alreadyraised resources for the same. However, business growth would hinge on thecompany successfully completing the expansion in time.
Business growth dependent on understanding dynamic fashion trendsFashion trends being dynamic in nature, pose business risk to the company. Thecompany has an experienced team of 18 designers with rich experience in thefashion business. The company recruits new designers from reputed fashioninstitutes like National Institute of Fashion Technology (NIFT) and other fashioninstitutes. This has helped the company to maintain its competitive advantagein the international market. Future business growth would depend on thecompany maintaining this competitive edge.
Scaling up and retaining design team crucial to business successThe company derives a big competitive advantage in design capabilities. Itcurrently has a design team of 18 people. We feel the company would have toramp up its existing design team to shoulder the increasing workload. Expandingits existing team and successful retention policy to hold on to the existing teamwould be would be crucial for the company’s progress.
Order or shipment rejection can impact business significantlyMajority of Crew B.O.S’s customers are big retailers. These players have stringentproduct quality and delivery norms in addition to the strong bargaining power.Any order or shipment rejection could impact the company’s business and margins,as the goods would have to be sold at a much cheaper cost. The company so farhas not had any major order rejections. While there have been stray cases oflate shipment, which has resulted in the company having to take a haircut onthe list price depending on the delay period. While in FY05, few customersaccounted for majority of the revenues; the scene is expected to change in thecurrent and subsequent years.
High impact cost due to low paper supply in the marketThe company has small equity base of Rs128mn, out of which promoters hold57.6% and institutions hold another 17%. This leaves just 25.4% or 3.3mn sharesin the market. The average daily volumes range around 0.1-0.2mn on the NationalStock Exchange (NSE). This could result in the high impact cost, while investingas well as liquidating investment in the company.
November 25, 2005 14
Crew B.O.S Products Ltd - In vogue
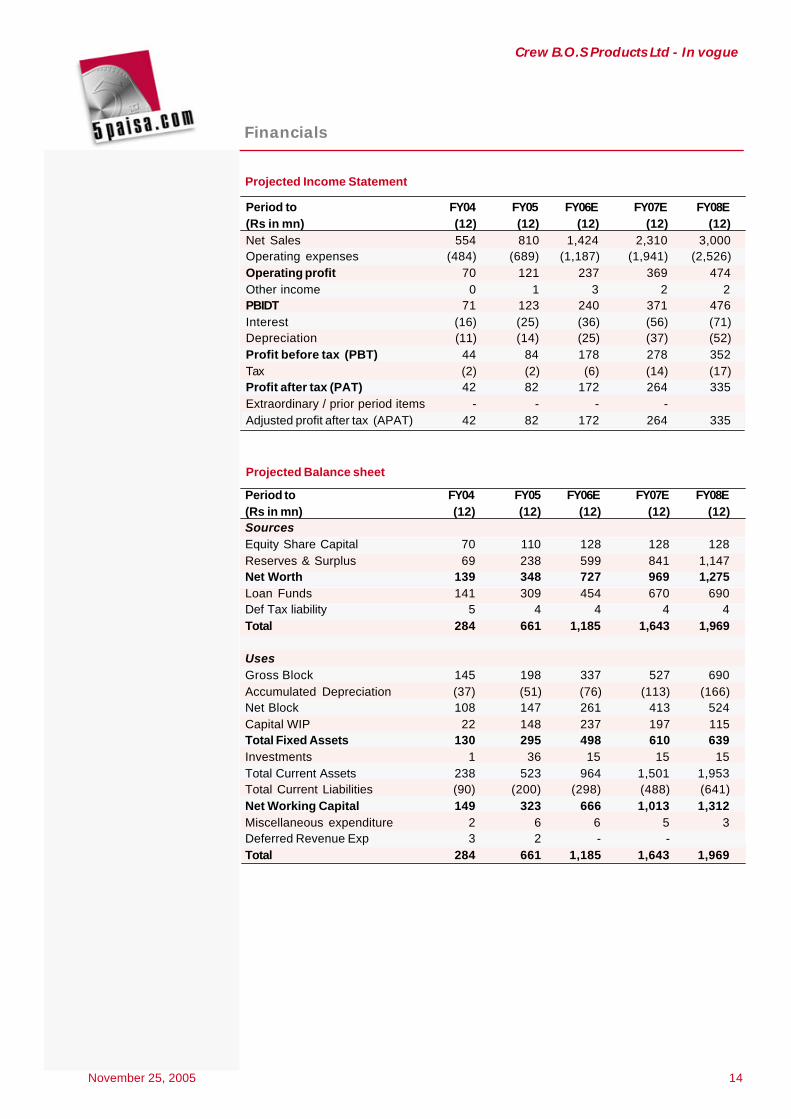
Projected Income Statement
Period to FY04 FY05 FY06E FY07E FY08E(Rs in mn) (12) (12) (12) (12) (12)Net Sales 554 810 1,424 2,310 3,000Operating expenses (484) (689) (1,187) (1,941) (2,526)Operating profit 70 121 237 369 474Other income 0 1 3 2 2PBIDT 71 123 240 371 476Interest (16) (25) (36) (56) (71)Depreciation (11) (14) (25) (37) (52)Profit before tax (PBT) 44 84 178 278 352Tax (2) (2) (6) (14) (17)Profit after tax (PAT) 42 82 172 264 335Extraordinary / prior period items - - - - Adjusted profit after tax (APAT) 42 82 172 264 335
Projected Balance sheet
Period to FY04 FY05 FY06E FY07E FY08E(Rs in mn) (12) (12) (12) (12) (12)Sources Equity Share Capital 70 110 128 128 128Reserves & Surplus 69 238 599 841 1,147Net Worth 139 348 727 969 1,275Loan Funds 141 309 454 670 690Def Tax liability 5 4 4 4 4Total 284 661 1,185 1,643 1,969 Uses Gross Block 145 198 337 527 690Accumulated Depreciation (37) (51) (76) (113) (166)Net Block 108 147 261 413 524Capital WIP 22 148 237 197 115Total Fixed Assets 130 295 498 610 639Investments 1 36 15 15 15Total Current Assets 238 523 964 1,501 1,953Total Current Liabilities (90) (200) (298) (488) (641)Net Working Capital 149 323 666 1,013 1,312Miscellaneous expenditure 2 6 6 5 3Deferred Revenue Exp 3 2 - - Total 284 661 1,185 1,643 1,969
Financials
November 25, 2005 15
Crew B.O.S Products Ltd - In vogue
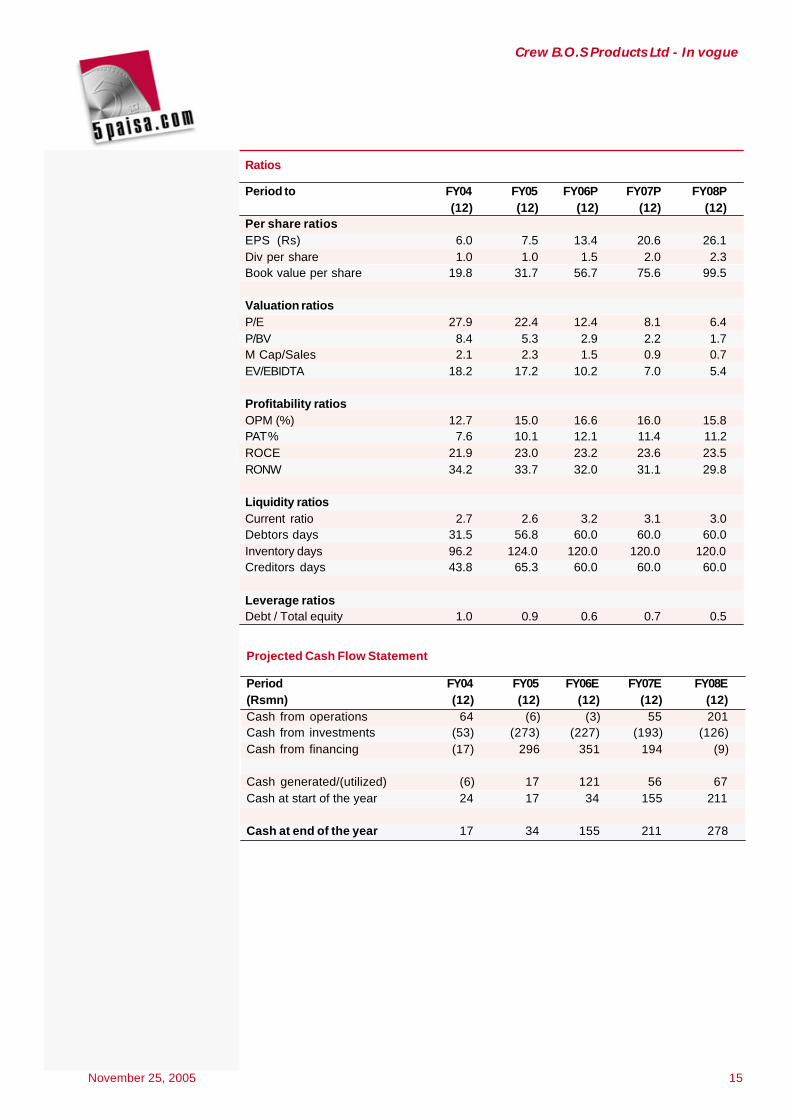
Period to FY04 FY05 FY06P FY07P FY08P (12) (12) (12) (12) (12)Per share ratios EPS (Rs) 6.0 7.5 13.4 20.6 26.1Div per share 1.0 1.0 1.5 2.0 2.3Book value per share 19.8 31.7 56.7 75.6 99.5 Valuation ratios P/E 27.9 22.4 12.4 8.1 6.4P/BV 8.4 5.3 2.9 2.2 1.7M Cap/Sales 2.1 2.3 1.5 0.9 0.7EV/EBIDTA 18.2 17.2 10.2 7.0 5.4 Profitability ratios OPM (%) 12.7 15.0 16.6 16.0 15.8PAT % 7.6 10.1 12.1 11.4 11.2ROCE 21.9 23.0 23.2 23.6 23.5RONW 34.2 33.7 32.0 31.1 29.8 Liquidity ratios Current ratio 2.7 2.6 3.2 3.1 3.0Debtors days 31.5 56.8 60.0 60.0 60.0Inventory days 96.2 124.0 120.0 120.0 120.0Creditors days 43.8 65.3 60.0 60.0 60.0 Leverage ratios Debt / Total equity 1.0 0.9 0.6 0.7 0.5
Ratios
Period FY04 FY05 FY06E FY07E FY08E(Rsmn) (12) (12) (12) (12) (12)Cash from operations 64 (6) (3) 55 201Cash from investments (53) (273) (227) (193) (126)Cash from financing (17) 296 351 194 (9) Cash generated/(utilized) (6) 17 121 56 67Cash at start of the year 24 17 34 155 211 Cash at end of the year 17 34 155 211 278
Projected Cash Flow Statement
Published in August 2005. All rights reserved. © India Infoline Ltd 2005-6.This report is for information purposes only and does not construe to be any investment, legal or taxation advice. It is not intendedas an offer or solicitation for the purchase and sale of any financial instrument. Any action taken by you on the basis of theinformation contained herein is your responsibility alone and India Infoline Ltd (hereinafter referred as IIL) and its subsidiaries orits employees or directors, associates will not be liable in any manner for the consequences of such action taken by you.We have exercised due diligence in checking the correctness and authenticity of the information contained herein, but do notrepresent that it is accurate or complete. IIL or any of its subsidiaries or associates or employees shall not be in any wayresponsible for any loss or damage that may arise to any person from any inadvertent error in the information contained in thispublication. The recipients of this report should rely on their own investigations. IIL and/or its subsidiaries and/or directors,employees or associates may have interests or positions, financial or otherwise in the securities mentioned in this report.India Infoline Ltd , 24 Nirlon Complex, Off Western Exp. Highway, Goregaon(E). Mumbai -63. Tel 5677 5900. Fax 2685 0451
it’s all about money, honey!
Toll Free 1600-22-6555 Email [email protected] is the trade name of India Infoline Securities Pvt Ltd (IISPL), a wholly ownedsubsidiary of India Infoline Ltd. IISPL is a member of the National Stock Exchange of India(NSE) and The Stock Exchange, Mumbai (BSE). IISPL is also a Depository Participant withNSDL.
IndiaInfolinecom
Our Recent Publications
DCM Shriram Ltd - September 29, 2006
Opto Circuits (India) Ltd - Scaling Upper Circuits - September 15, 2005
Control Print India Ltd: Printing a sucess code - August 12, 2005
Finolex Cables Ltd: Get Wired - August 12, 2005
Carbon Credits : Emitting Gains - July 22, 2005
Financial Technologies Ltd : Strike it rich - July 04, 2005