Embed Size (px)
Citation preview
It takes a Community to Bridge a Divide: Working Towards Digital and Social Inclusion with Community Technology Learning Centres
Muir K & Boot R*
The Smith Family, Australia
Abstract Digital inclusion programs are a proven approach to helping disadvantaged Australians
overcome the ‘digital divide’ and to build social capital. The digital divide is often viewed in terms
of physical access to Information and Communications Technology (ICT), but digital inclusion
goes beyond access. A person not only needs access, but also must possess the motivation
and basic ICT skills in order to fully participate in the economic, social, political and cultural
spheres of society.
The Smith Family’s initiatives in the area of digital inclusion highlight the value of a lead
facilitator to drive a community-centred approach that focuses on networks and partnerships to
deliver sustainable social change. Digital inclusion programs are based on a community
capacity building approach that provides more meaningful, sustainable and far-reaching
outcomes.
This paper provides a case study on The Smith Family’s involvement in Microsoft’s global
Unlimited Potential (UP) program. UP in Australia is working with over 150 community
technology learning centres (CTLCs) to connect individuals and communities, and to improve
lifelong learning opportunities for disadvantaged people. As lead partner, The Smith Family
works with and through partners both in the local community and across the country towards the
delivery of integrated local programs. Program activities include community consultations and
networking, assets-based reviews, customised non-formal training programs, access to low-cost
PCs, train-the-trainer initiatives and other funding and support resources for CTLCs. It is a
proactive and preventative approach to overcoming disadvantage by identifying and leveraging
existing resources.
Section I: Background The importance of technological literacy became evident in the 1990s when the educational,
economic and social benefits of access to and usage of Information and Communication
Technologies (ICT) were realised. With this realisation came the understanding that certain
groups in society were missing out on developing these literacy skills. The phrase ‘digital divide’
was coined to describe this problem and governments and non-profits around the world moved
to bridge the gap. While ‘digital divide’ as a term has begun to lose relevance, the
advantageous nature of ICT literacy has increased.
1
In 1999 The Smith Family (TSF) began working to ensure disadvantaged families were ready,
willing and able to be digitally engaged by establishing Computer Clubs in two locations. Five
years later, TSF became the lead partner in Microsoft Australia’s Unlimited Potential (UP)
initiative.1 This paper presents an overview of the first phase of evaluation outcomes from UP’s
Community Technology Learning Centres (CTLCs).
Access to and meaningful usage of computers and related technology has the potential to bring
about educational, economic and social benefits (Chow et al. 2000, Harouna et al. 2001, p. 7,
Asgeirsdottir 2002). Yet not all Australians have access or can meaningfully use computers and
the internet (Zappala and McLaren 2003, p. 13, International Telecommunication Union 2003).
While the term ‘digital divide’ was coined, and is still popularly used to explain this occurrence,
digital inclusion encompasses far more than ‘access’ to the hardware and software of
technology (Ferlander 2003). There is not a simplistic two way spilt between the ‘haves’ and
‘have-nots’ as digital inclusion occurs on a number of levels (Cisler in Warschauer).
Of course access remains important, but access is redundant if people lack the skills or the
interest to use computers and the Internet. The provision of training, while also essential, does
not guarantee that the digitally excluded will be motivated to attend. The Access, Basic Training
and Content, or ABCs, of the digital divide have therefore been extended to incorporate the idea
that technology is also a means to ‘social inclusion’. As the United Kingdom Cabinet office
recognised in 2004:
“Digital inclusion is not about computers, the internet or even technology. It is
about using technology as a channel to improve skills, to enhance quality of life,
to drive education, and to promote economic well-being across all elements of
society. Digital inclusion is really about social inclusion, and because of this, the
potential for technology to radically improve society and the way we live our
lives should not be underestimated” (Cabinet Office 2004).
Muir (2004) argued that the ABC acronym should be reassigned to Access, Basic Training and
Community Connections. The challenge is to engage those not using technology to be digitally
inclusive by recognising the financial, educational and motivational barriers individuals face that
prevent them from accessing and fully using technology in order to assist them to overcome
these impediments. The new ‘C’ recognises the importance of motivation as one of the primary
barriers and helps to shift the focus away from technology towards people and the community.
Barriers to digital inclusion While the price of technology has come down considerably over the past decade, financial
issues still present barriers for low socio-economic status families when considering purchasing
1 TSF’s work in this area has been informed by five separate research reports and two prior program evaluations. The most significant research reports are Zappala 2003 and Muir 2004.
2
computers and access to the Internet. Barriers to Participation revealed that sole parents only
spent an average of $2.90 per week on computers and the Internet, compared to the $6.70
spent by couples with children (Zappala 2003, p. 34). In 2000 the Australian Bureau of Statistics
(ABS) found households on incomes of over $50,000 were twice as likely to have Internet
access than those earning less than $50,000 (Zappala 2003, p. 67).
Education also remains a barrier for some individuals. A recent study by the National Centre for
Social and Economic Modelling (NATSEM 2004, pp. 90, 97) found 70 per cent of Australians
with tertiary qualifications used a computer at home and 75 per cent used the Internet,
compared to 27 and 32.1 per cent respectively of those who had completed up to Year 10 at
school (Lloyd and Bill 2004, pp. 90, 97).
The third barrier, which ties in with education and learning, is motivation. The OECD found the
most common barrier to learning is not financial or time limitations, rather it is motivation. Some
people fail to understand the benefits of learning (Directorate for Education, Employment,
Labour and Social Affairs 2001, p. 18). So even if we remove the other barriers, certain people
will still lack the ‘drive’ to learn to use technology (Selwyn et al. 2003, p. 179).
When we assess who these non-learners predominantly are — the early school leavers, the
unskilled workers and the unemployed — we find that they are also the groups least likely to
use computers and related technology (OECD 2003, p. 4). Thus the solution to engaging these
individuals must go beyond just providing access and training and should include community
connections.
Overcoming the barriers with CTLCs CTLCs may provide part of the solution to digital inclusion because they can address all three of
the above barriers: they can provide free or cheap access to computers and the Internet; a non-
threatening local environment where individuals can go to learn about computers; and a local
informal setting that may engage those with low education levels and those previously
disinterested in learning about technology (Muir 2004).
These centres have been found to not only engage disengaged learners and change attitudes
towards learning, but also connect people and communities. This connectedness is a result of
providing a public meeting place where locals can interact and access the Internet to
communicate with others outside of their area and become part of ‘communities of interest’.
Participants of CTLCs have been found to increase their interaction with previous strangers,
have a greater awareness of local activities, opportunities and resources available to them,
engage in community issues and improve their community identity (for a further discussion of
the literature see Muir 2004). While the literature demonstrates that CTLCs can produce positive
3
social outcomes, just placing a centre in a community does not guarantee success. Positive
outcomes are contingent on a number of conditions.
Drawing on research and practitioner, educator and other commentators’ experiences, Muir
(2004) highlighted six key ‘success factors’ for CTLCs.2 The six factors are:
1. having partnerships
2. being engaged with the community
3. providing a positive learning environment
4. having well trained, multi-skilled staff & volunteers who are engaged with the community
5. providing an appropriate physical location and an internal environment that encourages
social interaction
6. conducting evaluations.
Section II: The response — The Smith Family and Microsoft Unlimited Potential The Smith Family The Smith Family is a national, independent, social enterprise that supports disadvantaged
children and their families to create a better future through education. Our vision is of "A more
caring, cohesive Australian community”. Our mission is that "Together with caring Australians,
The Smith Family will unlock opportunities for disadvantaged families to participate more fully in
society."
The Smith Family works to achieve its mission in two ways: by increasing the participation of
those that have been marginalised and the engagement of those individuals and organisations
that have capacity to share (time, talent or money). The Smith Family has adopted a preventive
approach to addressing disadvantage that is based on education and lifelong learning. The
organisation has a particular focus on increasing the reading, technological and financial literacy
capacity of children and their families.
Microsoft Unlimited Potential Microsoft Unlimited Potential (UP) is a global initiative that aims to help people overcome the
‘digital divide’ within their communities regardless of their circumstances. Microsoft Australia has
committed more than AU$40 million over five years in software, cash, curriculum and training
support to reach disadvantaged Australians.3 UP is a multi-faceted program including the
following components:
• UP Software Donation Program — free software for community organisations
• Resources to support Community Technology Learning Centres (CTLCs)
2 For a far more comprehensive list of best practice criteria, see CTCNet’s ‘Standards of Excellence for Computer Technology Centres’, Version 4 Rev. 10/02. This includes three levels – best practices, preferred practices and minimum standards. 3 For further information see <http://www.microsoft.com/australia/up>
4
• Microsoft Authorised Refurbisher — free software for hardware refurbishing
• Disaster Relief Grants.4
The partnership Microsoft Australia began donating software to TSF in 1998. In 1999, the two organisations
came together to begin working on bridging the ‘digital divide’. Two Computer Clubs were
established in suburban Melbourne to teach ICT skills to financially disadvantaged children. In
November 2002, the partnership grew to include RMIT University and nine local community
organisations. The reach was extended across Victoria and the target groups expanded to
include regional citizens of all ages.
In June 2004, the Microsoft Unlimited Potential (UP) program was launched in Australia, with
TSF as the lead community partner. At the time of writing this report, the TSF-Microsoft
partnership is still growing rapidly and includes 44 community organisations across Australia
delivering ICT skills training in 75 TSF-affiliated CTLCs. The target groups now include low
socio-economic families, seniors, youth at risk, culturally and linguistically diverse individuals,
those with a disability, people living in rural and remote areas, and Indigenous Australians.
UP in Australia is designed and built on the collective experience, skills and networks of
Microsoft, TSF, RMIT University5 and the other UP Foundation Partners — WorkVentures,
Inspire Foundation, Australian Seniors Computer Clubs Association (ASCCA) and Yarnteen
Aboriginal & Torres Strait Islander Corporation. Across all the Foundation Partners, there are
currently more than 150 UP CTLCs located in every Australian state and territory. The overall
program aim for the partnership is to improve lifelong learning for disadvantaged people by
providing technology-related skills through CTLCs.
The UP project The objective of UP in Australia is to support CTLCs and networks of CTLCs to enhance their
impact in the community and their long-term sustainability of operations. UP does this by:
• providing direct resources to support CTLCs such as curriculum for formal and non-
formal training programs, funding for elements of CTLC operations, and Microsoft software
• running Train-the-Trainer courses for volunteers and other CTLC staff
• facilitating information sharing forums on topics such as volunteer management,
community engagement, and social impact evaluation tools
• facilitating the matching of Microsoft staff volunteers to provide services for local
community organisations
4 This aspect is not discussed in this paper. 5 RMIT University is the Academic Partner for Unlimited Potential in Australia.
5
• assisting CTLCs in community engagement and in attracting disadvantaged individuals
in the community to attend centres, particularly through the 117 Education Support Workers
employed by The Smith Family in their flagship Learning for Life program
• linking other relevant local, state and national initiatives, such as PC refurbishing
through the Microsoft Authorised Refurbisher program, migrant settlement services, and
local iterations of Job creation and employment programs
• conducting research and ongoing evaluation of the effectiveness of the UP network and
the social impact of UP CTLCs
• consulting and conversing with government and others to champion digital inclusion
issues
• responding to the evolving needs of CTLCs as agreed with UP stakeholders.
UP training programs The funding provided to CTLCs is targeted in key areas and not intended as comprehensive
funding for CTLC operations. The funding focuses on volunteer management and is directly
linked to the delivery of training programs and outcomes. All of the training offered uses non-
formal approaches and is based on the ‘Fields of Fascination’ concept (described further in a
following section) as a means of re-engaging individuals in lifelong learning. There are two types
of training programs funded:
• ICT Fundamentals is designed to cater for those people who have no prior meaningful
experience with computers. It provides an introduction to computers and aims to equip
participants with basic ICT literacy skills such as how to turn a computer on, use a mouse
and keyboard, search the Internet, send an e-mail, and fill out an online form. The training is
a minimum of five hours and is normally run with five to ten people.
• Computer Clubs/‘whereveruni’ is designed for those with little or no ICT literacy skills and
who can commit to an eight week program. Computer clubs usually run for two hours every
week (minimum 16 contact hours per student), with a minimum of five participants.
‘Computer Club’ is the generic term used within UP. ‘whereveruni’6 is a trademark of RMIT
University and is the equivalent of Computer Clubs. The broader RMIT University innovation
program7 also incorporates accredited professional development for volunteer trainers.
Evidence-based The methodology used to develop the project is based upon evidence-based principles and
action research, as reflected in this paper. For example, the six success factors for CTLCs
6 ‘whereveruni’ original name and concept created by Jim Downing and expanded by the RMIT Learning Network team. ‘whereveruni’ is targeted at adults who are marginalised from learning and social participation and aims to excite these people to realise the possibilities that lay within them through an educational experience that is facilitated by technology. 7 RMIT University’s involvement is funded by the Victorian Department of Education OTTE Innovation Program.
6
outlined by Muir (2004) are utilised firstly as part of the selection criteria for new UP CTLC
partners, and secondly, to help inform the type of support provided.
The challenge is to develop a workable and sustainable model to address a complex problem
that has no simple solution. The model has evolved over time and will continue to evolve as we
work towards having a greater impact.
The UP program is an example of working ‘with and through’ others to leverage off existing
resources and capacity. It focuses on working at a community level ‘with’ communities, rather
than ‘for’ or ‘to’ them. We also document and learn from our experiences. The following section
discusses some of TSF and RMIT University’s key learnings from conceptualising and
actualising digital inclusion programs.
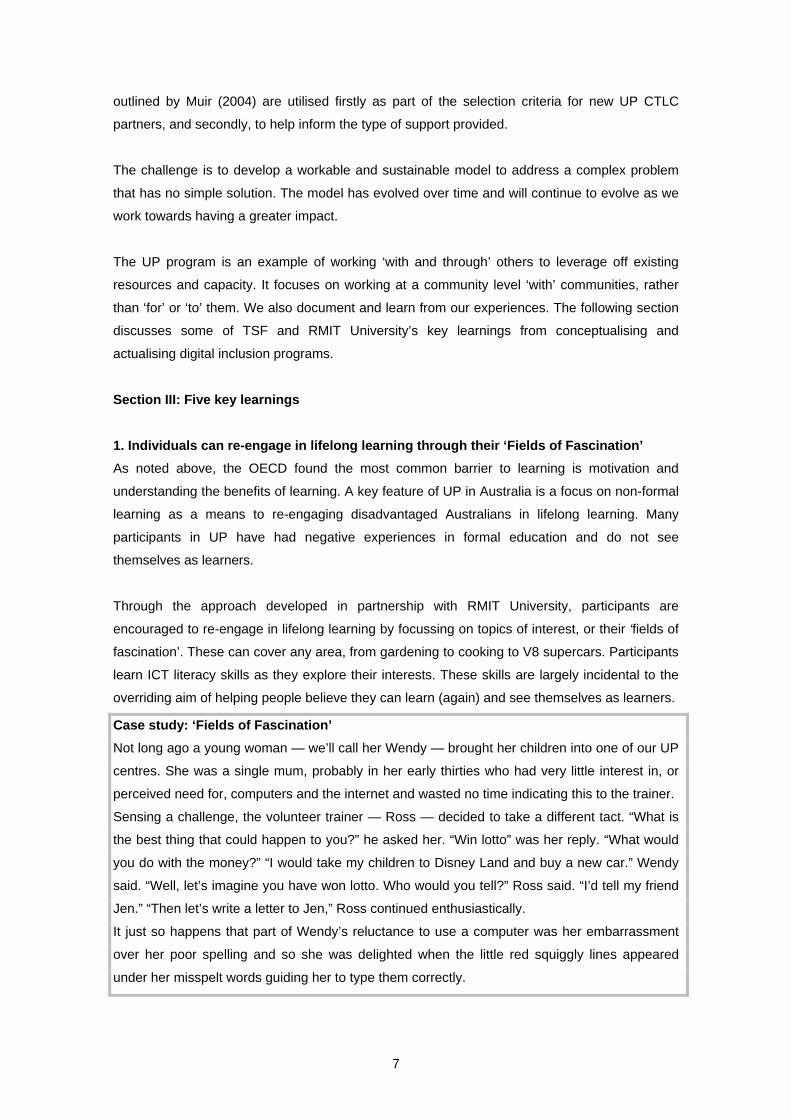
Section III: Five key learnings 1. Individuals can re-engage in lifelong learning through their ‘Fields of Fascination’ As noted above, the OECD found the most common barrier to learning is motivation and
understanding the benefits of learning. A key feature of UP in Australia is a focus on non-formal
learning as a means to re-engaging disadvantaged Australians in lifelong learning. Many
participants in UP have had negative experiences in formal education and do not see
themselves as learners.
Through the approach developed in partnership with RMIT University, participants are
encouraged to re-engage in lifelong learning by focussing on topics of interest, or their ‘fields of
fascination’. These can cover any area, from gardening to cooking to V8 supercars. Participants
learn ICT literacy skills as they explore their interests. These skills are largely incidental to the
overriding aim of helping people believe they can learn (again) and see themselves as learners.
Case study: ‘Fields of Fascination’ Not long ago a young woman — we’ll call her Wendy — brought her children into one of our UP
centres. She was a single mum, probably in her early thirties who had very little interest in, or
perceived need for, computers and the internet and wasted no time indicating this to the trainer.
Sensing a challenge, the volunteer trainer — Ross — decided to take a different tact. “What is
the best thing that could happen to you?” he asked her. “Win lotto” was her reply. “What would
you do with the money?” “I would take my children to Disney Land and buy a new car.” Wendy
said. “Well, let’s imagine you have won lotto. Who would you tell?” Ross said. “I’d tell my friend
Jen.” “Then let’s write a letter to Jen,” Ross continued enthusiastically.
It just so happens that part of Wendy’s reluctance to use a computer was her embarrassment
over her poor spelling and so she was delighted when the little red squiggly lines appeared
under her misspelt words guiding her to type them correctly.
7
At the same time a man came into the centre. He didn’t think that learning to use a computer
could be fun until Ross showed him how to surf the web and found a page on the Internet that
compared the fuel consumption of Holden and Ford V8s. The man was enthralled and couldn’t
believe the internet could be used to source such information.
A third and older woman in the UP centre, was very interested in ‘Blue stone’ buildings and
castles. Again, Ross was able to help her use the internet to find a wealth of information on blue
stone castles in the UK.
But here comes the most important part of this story. It wasn’t long before the man started
talking to the young single mum about which car she should buy for her kids and the older lady
convinced the single mum to visit a castle or two on her way to Disney Land.
This is the real strength of the UP initiative. The ability to use technology as a way of connecting
people to create a strengthened sense of neighbourhood and in turn build stronger, more
connected communities.
2. Partnerships and community engagement are vital for CTLC sustainability A key to sustainability is through developing meaningful partnerships. Community organisations,
businesses and individuals possess numerous skills, resources and networks, which can be
drawn upon to assist CTLCs to achieve their desired educational and social outcomes (CTCNet
2002, Russell 1999, pp. 28-31). Organisations working in isolation are unlikely to be sustainable
and/or successful.
The sustainability of a centre is highly dependant upon funding it can attract or revenue it can
raise. After many years some centres and learning networks have ceased operating or are
currently vulnerable to closure partly because of a dependence on a single source of centralised
funding, usually from government (Crow 2003, p. 30). Since 1997 the federal government has
injected large amounts of funding into CTLCs under the Networking the Nation initiative. The
2003–2004 budget, for example, included $27.9 million. Yet from 1 July 2004 funding stopped.
Thus the issue of sustainability is now paramount in the mind of those who have survived,
especially because most centres have remained reliant on government funding (DCITA 2003, p.
2).
Despite funding cuts, a significant number of CTLCs continue to operate, many of which are
connected to networks. The stronger CTLCs often have links to entrepreneurial leadership or
leadership that is well integrated into their community. The remaining centres and networks are
survivors; they have their own aspirations and plans for program development. UP recognises
the importance of complementing these aspirations and utilising their existing management and
volunteer structures.
8
“Taree Community College has valued the opportunity to be involved with the Microsoft
Unlimited Potential program in partnership with The Smith Family. The community as a whole
has benefited from the sharing of skills and knowledge, especially through the digital storytelling
computer club. In this forum, indigenous youth are working with mentors from the community to
record traditional stories using modern technology. What a wonderful way to help build greater
understanding and tolerance in our community” (Debra Nicholson, Manager, Taree Community
College).
The UP program is also actively working to assist CTLCs to attract appropriate individuals in the
community to attend centres. One strategy uses TSF’s 117 Education Support Workers from its
flagship Learning for Life program.
3. Local success revolves around ‘local champions’ As part of managing and coordinating the growth of UP in Australia, TSF identifies communities
across Australia are likely to benefit most from digital inclusion programs. This depends in part
on community needs, but also on the communities’ capacity to use and build on the resources
provided by UP. Sufficient infrastructure must be in place for UP to be effective in a community.
The required level of physical infrastructure is relatively simple to define and procure. However,
the required level of social infrastructure is more nebulous.
When recruiting CTLC partners for UP, the single most important factor TSF considers is the
strength, capacity and quantity of ‘local champions’ or proactive leaders who are well connected
and engaged in the community. Such ‘champions’ come from various backgrounds and cannot
be easily defined, except perhaps for displaying a proven track record for making a difference in
the community through worthwhile initiatives.
4. Training programs must be flexible to meet local needs UP in Australia is a national program delivered locally by selected community partners who are
already actively engaged in their communities. The community partners are empowered with the
flexibility to deliver the program depending on their local conditions. UP recognises that local
community organisations are best placed to assess local needs and demands.
The differing types of CTLCs delivering UP in Australia include community centres, libraries,
community colleges, primary and high schools, learning centres, and youth centres. Many of
these centres are used to a top-down approach where they are instructed as to what courses
will be offered, the manner in which they will be delivered and what outcomes should be
attained. While UP has a formal curriculum, which is utilised as an effective resource, it is very
flexible in its approach. Although a few centres found this flexibility challenging initially, it is now
overwhelmingly perceived as a major asset of the UP model.
9
“I have learnt so much in such a short time, and I am learning at my own pace,
which is much easier” (Elsie, on her way to Certificate II in Information
Technology through whereveruni).
5. Volunteers are invaluable but not ‘free’ Volunteers are a valuable resource and have been heavily utilised by CTLCs in Australia and
around the world. In 2001 alone, over 1000 volunteers spent more than 80,000 hours assisting
CTLCs (Norris 2002, pp. 364-80). While much has been written about the advantages of using
volunteers,8 there are also challenges and our experience to date confirms much of the wider
literature.
Although an invaluable resource volunteers require time consuming management, ongoing
support, training, precise information, clearly defined policies and their skills and interests need
to be matched to available roles. Managing volunteers is not the same as managing staff, but
volunteer management still consumes significant resources (Tacticos 2004).
The UP funding provided to CTLC partners to deliver Computer Clubs is intended to help cover
the costs of volunteer recruitment and management. However, we must recognise that not all
centres can realistically attract and retain good volunteers and occasionally paid resources are
necessary.
The TSF affiliated UP centres are not required to provide certified/qualified trainers. The level of
ICT knowledge required is relatively low. As many of the participants experience learning
difficulties and/or have had negative experiences with formal learning, the important
characteristic for trainers is that they can empathise with the participants and engage them.
Section IV: The evaluation (Phase I) The data used for this first phase of evaluation is from eleven of the more established CTLCs.
Successive program evaluations will also include data from CTLCs that joined UP more
recently. The evaluation captured data on 98 adults participating in regular computer classes
(these adults were split across thirteen groups) and 145 school students participating in youth
specific computer clubs. While the training and student outcomes are detailed briefly in Parts A
and B, this paper primarily focuses on adults who attended UP CTLCs regularly over
approximately a three-month period.
Part A: Evaluation of adults regularly attending CTLCs The evaluation used surveys, which explored the demographic details of attendees, their
previous computer experience, the types of computer use, and the affect UP centres had on the
attendee’s lives and that of their communities.
10
The pre-program evaluation of the regular adult attendees, which aimed to establish baseline
data, was completed by 128 adults (71 filled out the forms online and 57 completed them in
hard copy). Ninety-eight individuals completed the post-program surveys at the end of their
course. While the same centres distributed both surveys, not all of the individuals who submitted
a post-program survey had completed a registration one.9 Thus the baseline data and the post-
program data cannot be directly correlated. While this is unfortunate, the pre and post program
surveys can be used independently to reveal who attended the centres and to demonstrate the
influence these centres have had on some people’s lives.
Demographics Many of those who attended the centres were older female pensioners from couple families,
with a significant proportion from culturally and linguistically diverse backgrounds. Almost two-
thirds of those who completed the pre- and post-program surveys were female. 63.4 per cent of
those who disclosed their age were over 55 years and over one-quarter of participants were
aged between 65-74 years.
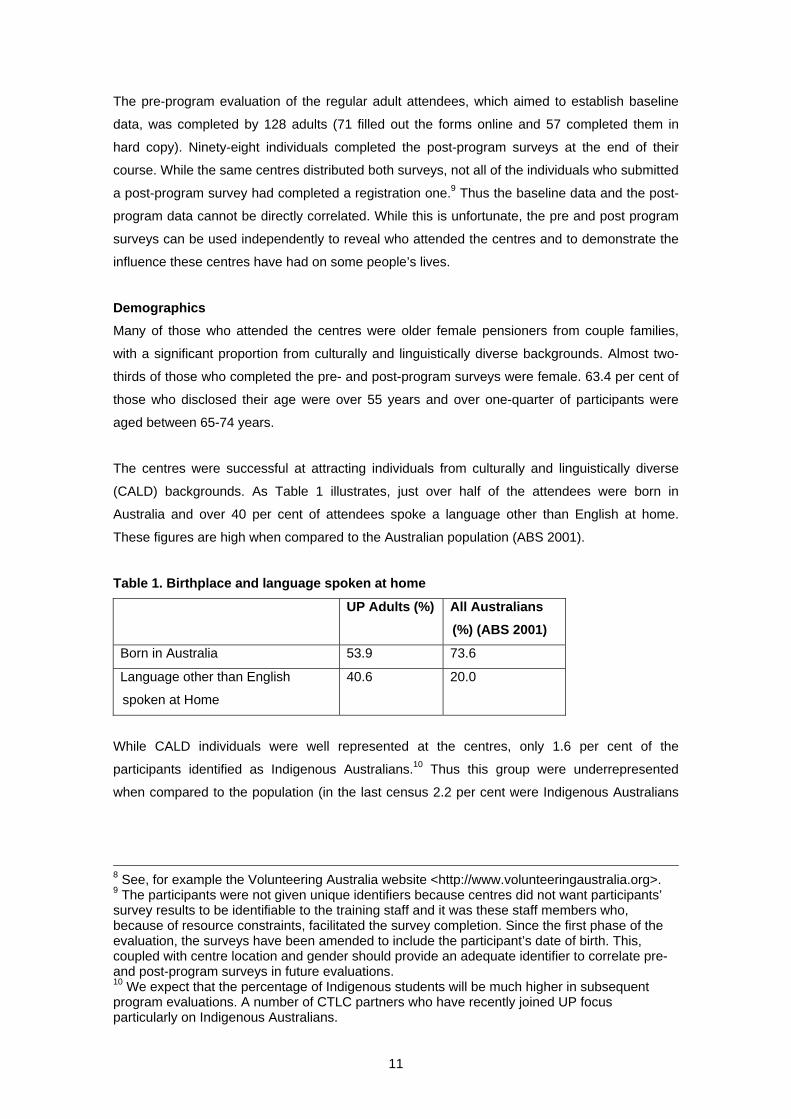
The centres were successful at attracting individuals from culturally and linguistically diverse
(CALD) backgrounds. As Table 1 illustrates, just over half of the attendees were born in
Australia and over 40 per cent of attendees spoke a language other than English at home.
These figures are high when compared to the Australian population (ABS 2001).
Table 1. Birthplace and language spoken at home
UP Adults (%) All Australians (%) (ABS 2001)
Born in Australia 53.9 73.6
Language other than English
spoken at Home
40.6 20.0
While CALD individuals were well represented at the centres, only 1.6 per cent of the
participants identified as Indigenous Australians.10 Thus this group were underrepresented
when compared to the population (in the last census 2.2 per cent were Indigenous Australians
8 See, for example the Volunteering Australia website <http://www.volunteeringaustralia.org>. 9 The participants were not given unique identifiers because centres did not want participants’ survey results to be identifiable to the training staff and it was these staff members who, because of resource constraints, facilitated the survey completion. Since the first phase of the evaluation, the surveys have been amended to include the participant’s date of birth. This, coupled with centre location and gender should provide an adequate identifier to correlate pre- and post-program surveys in future evaluations. 10 We expect that the percentage of Indigenous students will be much higher in subsequent program evaluations. A number of CTLC partners who have recently joined UP focus particularly on Indigenous Australians.
11
ABS 2001). Those with a disability were also slightly underrepresented. While 20 per cent of
Australians have a disability, only 15.9 per cent of attendees identified similarly (ABS 2003)11.
Given the age bracket of participants, it is not surprising that only 22.9 per cent of attendees
were in families with dependent children. However, what was unexpected was the small number
of sole parents. While there were twenty parents with dependant children from couple families
attending, only two were headed by sole parents (therefore comprising less than 10 per cent of
these families). As one parent families make up 15.5 per cent of all Australian families (ABS
2001), the centres are not attracting a representative proportion of younger sole parents.12 This
may be attributed to the time demands on sole parents, but centres should look at barriers, such
as childcare, this group may be facing which prevents them from taking up opportunities like
computer training.
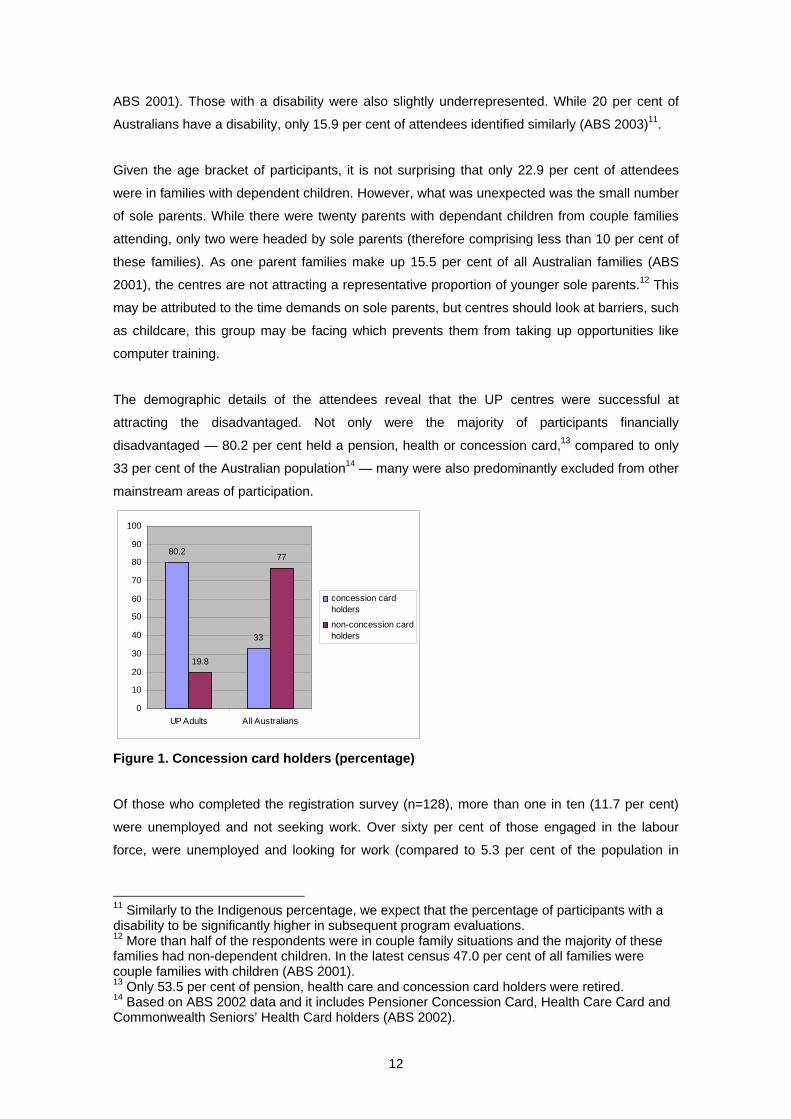
The demographic details of the attendees reveal that the UP centres were successful at
attracting the disadvantaged. Not only were the majority of participants financially
disadvantaged — 80.2 per cent held a pension, health or concession card,13 compared to only
33 per cent of the Australian population14 — many were also predominantly excluded from other
mainstream areas of participation.
80.2
33
19.8
77
0
10
20
30
40
50
60
70
80
90
100
UP Adults All Australians
concession cardholders
non-concession cardholders
Figure 1. Concession card holders (percentage)
Of those who completed the registration survey (n=128), more than one in ten (11.7 per cent)
were unemployed and not seeking work. Over sixty per cent of those engaged in the labour
force, were unemployed and looking for work (compared to 5.3 per cent of the population in
11 Similarly to the Indigenous percentage, we expect that the percentage of participants with a disability to be significantly higher in subsequent program evaluations. 12 More than half of the respondents were in couple family situations and the majority of these families had non-dependent children. In the latest census 47.0 per cent of all families were couple families with children (ABS 2001). 13 Only 53.5 per cent of pension, health care and concession card holders were retired. 14 Based on ABS 2002 data and it includes Pensioner Concession Card, Health Care Card and Commonwealth Seniors’ Health Card holders (ABS 2002).
12
September 2004; ABS 2005b), 23.1 per cent were employed on a part-time or casual basis and
only 6 per cent were working full-time.15
Fifty-one per cent of those who completed the post-program survey (n=98) were not employed
and only 56 per cent of this group were looking for work. Of the 30.6 per cent who were
employed, the majority (60 per cent of this group) were employed casually and a further 23.3
per cent were working part-time.
The labour force status of the adults attending the centres could not always be accounted for by
other traditional forms of participation — caring, volunteering or study. Even after excluding
those with a disability who were not seeking work and the retired, one in five of the first group
and one in four of the second, were not acting in any of these roles.16
Therefore not only were many of the UP Centres’ attendees financially disadvantaged, there
were also a significant proportion who were disconnected from the potential opportunities and
social networks that work, study, caring or volunteering can offer. The fact that these individuals
attended a CTLC is testament to the important role community centres can play in actively
reengaging individuals in society.
Attracting individuals to UP People became aware of the UP centres from three main sources — advertisements, agencies
(such as Centrelink, TSF and other non-government organisations) and friends or relatives.
While most of the group were fairly mobile (58.6 per cent came in a car), 21 people (16.4 per
cent) demonstrated a strong commitment by travelling for 45 minutes or more to attend.
Reasons for attendance varied, but access to computers (83.6 per cent), learning to use
computers (78.9 per cent), finding information (75.8 per cent) and access to the internet (71.9
per cent) were deemed most important. Over two-thirds (67.2 per cent) also reported coming to
the centre to increase their self-confidence. Surprisingly, despite the large proportion of pension
card holders, the cheap/free nature of the course was only considered an important motivational
factor by 57.8 per cent. Finding information about study/job options were also seen to be of
lesser importance (42.2 per cent felt this was one reason why they attended). This is a telling
finding because it shows the appropriateness of the centres’ ‘fields of fascination’ approach.
Individuals learn ICT skills through their areas of interest, rather than being involved in very
structured computer training or directed to certain sites.
15 Half of the participants were retired. Over one in four respondents (28 per cent) had only reached Year 9 or less. A further 10.3 per cent had completed Year 10. A quarter has completed further education — either an apprenticeship, traineeship, university degree or TAFE course. The remainder reached Year 11 or Year 12. While 43 per cent had completed a community education course in the past, over half of this group were retired. 16 In the post-program survey 21.4 per cent of all post-program participants were caring in a full-time or part-time capacity, 18.4 per cent were volunteering and 14.3 per cent were studying.
13
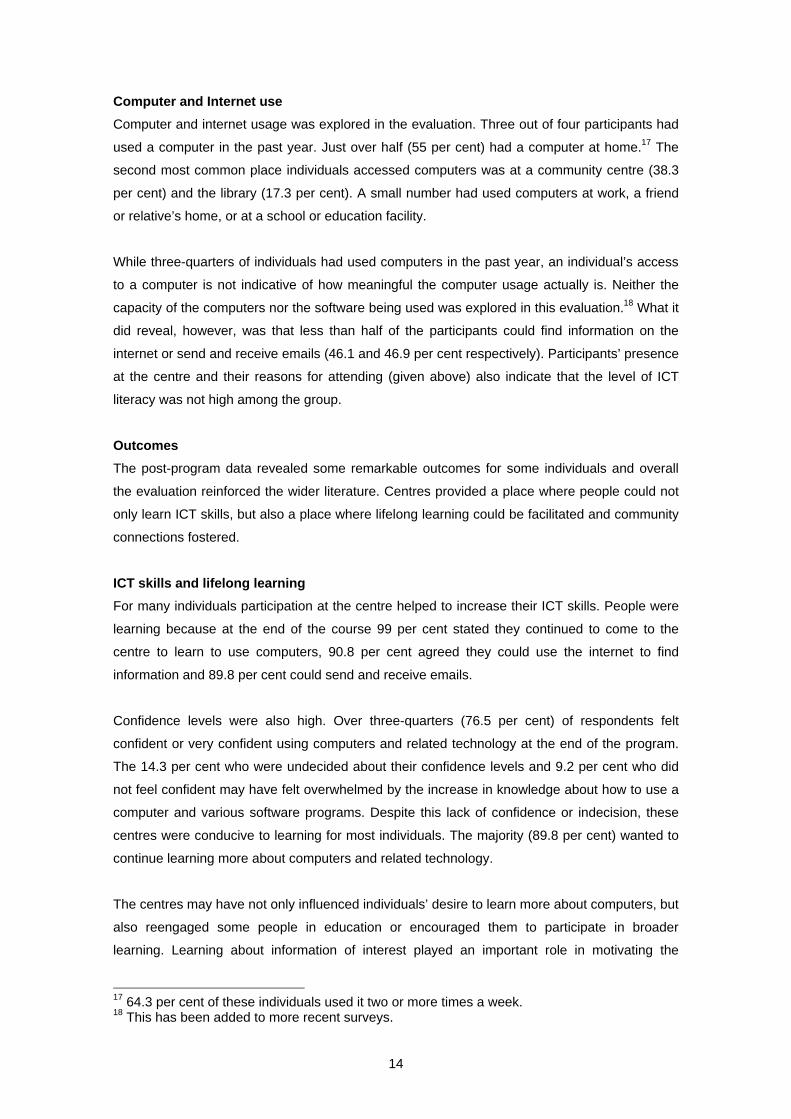
Computer and Internet use Computer and internet usage was explored in the evaluation. Three out of four participants had
used a computer in the past year. Just over half (55 per cent) had a computer at home.17 The
second most common place individuals accessed computers was at a community centre (38.3
per cent) and the library (17.3 per cent). A small number had used computers at work, a friend
or relative’s home, or at a school or education facility.
While three-quarters of individuals had used computers in the past year, an individual’s access
to a computer is not indicative of how meaningful the computer usage actually is. Neither the
capacity of the computers nor the software being used was explored in this evaluation.18 What it
did reveal, however, was that less than half of the participants could find information on the
internet or send and receive emails (46.1 and 46.9 per cent respectively). Participants’ presence
at the centre and their reasons for attending (given above) also indicate that the level of ICT
literacy was not high among the group.
Outcomes The post-program data revealed some remarkable outcomes for some individuals and overall
the evaluation reinforced the wider literature. Centres provided a place where people could not
only learn ICT skills, but also a place where lifelong learning could be facilitated and community
connections fostered.
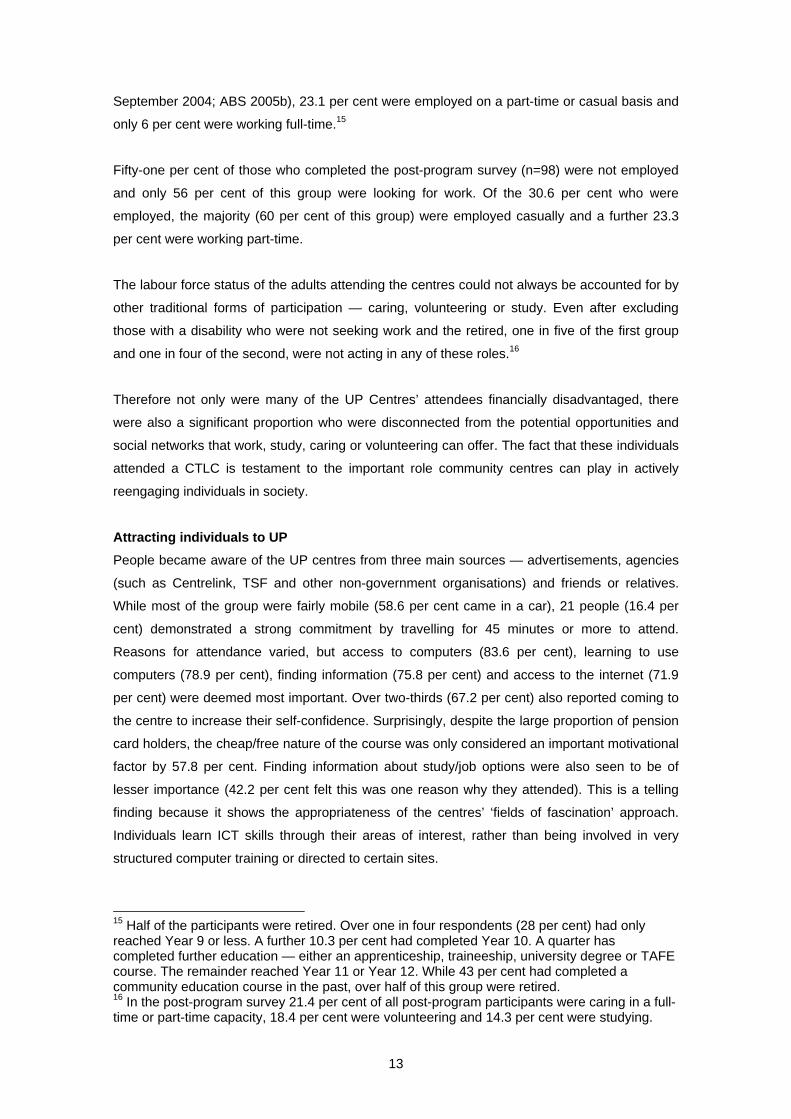
ICT skills and lifelong learning For many individuals participation at the centre helped to increase their ICT skills. People were
learning because at the end of the course 99 per cent stated they continued to come to the
centre to learn to use computers, 90.8 per cent agreed they could use the internet to find
information and 89.8 per cent could send and receive emails.
Confidence levels were also high. Over three-quarters (76.5 per cent) of respondents felt
confident or very confident using computers and related technology at the end of the program.
The 14.3 per cent who were undecided about their confidence levels and 9.2 per cent who did
not feel confident may have felt overwhelmed by the increase in knowledge about how to use a
computer and various software programs. Despite this lack of confidence or indecision, these
centres were conducive to learning for most individuals. The majority (89.8 per cent) wanted to
continue learning more about computers and related technology.
The centres may have not only influenced individuals’ desire to learn more about computers, but
also reengaged some people in education or encouraged them to participate in broader
learning. Learning about information of interest played an important role in motivating the
17 64.3 per cent of these individuals used it two or more times a week. 18 This has been added to more recent surveys.
14
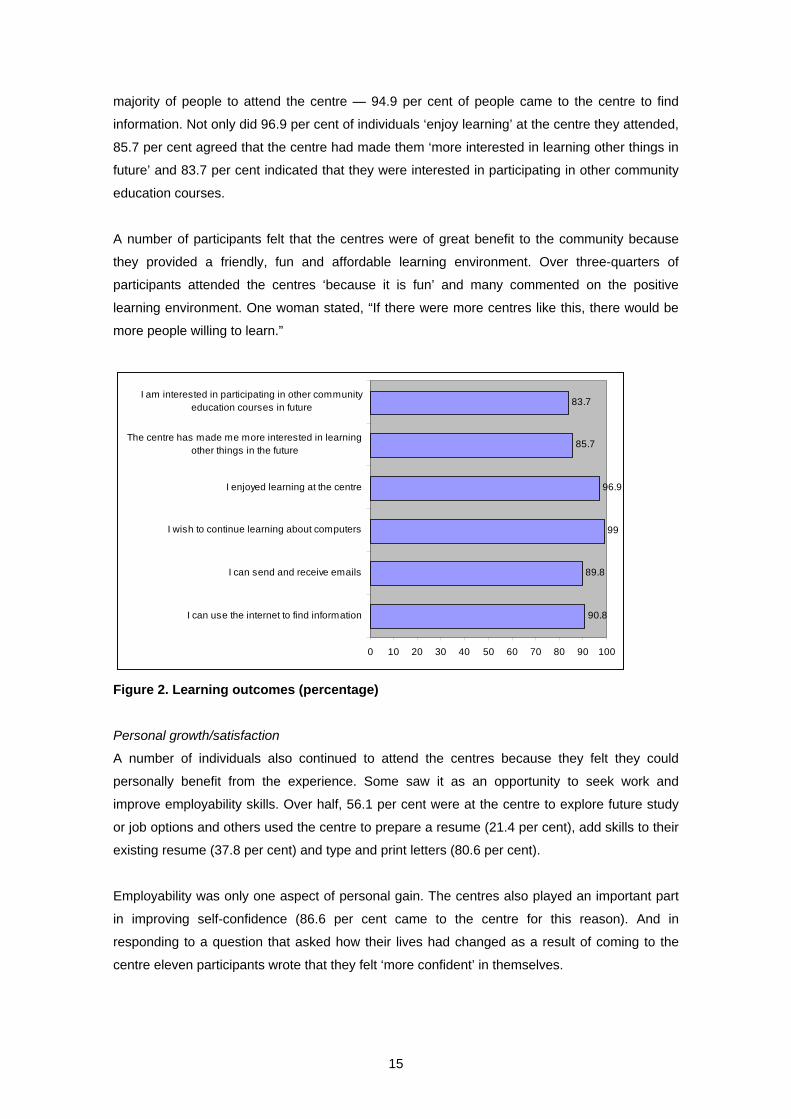
majority of people to attend the centre — 94.9 per cent of people came to the centre to find
information. Not only did 96.9 per cent of individuals ‘enjoy learning’ at the centre they attended,
85.7 per cent agreed that the centre had made them ‘more interested in learning other things in
future’ and 83.7 per cent indicated that they were interested in participating in other community
education courses.
A number of participants felt that the centres were of great benefit to the community because
they provided a friendly, fun and affordable learning environment. Over three-quarters of
participants attended the centres ‘because it is fun’ and many commented on the positive
learning environment. One woman stated, “If there were more centres like this, there would be
more people willing to learn.”
90.8
89.8
99
96.9
85.7
83.7
0 10 20 30 40 50 60 70 80 90 100
I can use the internet to find information
I can send and receive emails
I wish to continue learning about computers
I enjoyed learning at the centre
The centre has made me more interested in learningother things in the future
I am interested in participating in other communityeducation courses in future
Figure 2. Learning outcomes (percentage)
Personal growth/satisfaction
A number of individuals also continued to attend the centres because they felt they could
personally benefit from the experience. Some saw it as an opportunity to seek work and
improve employability skills. Over half, 56.1 per cent were at the centre to explore future study
or job options and others used the centre to prepare a resume (21.4 per cent), add skills to their
existing resume (37.8 per cent) and type and print letters (80.6 per cent).
Employability was only one aspect of personal gain. The centres also played an important part
in improving self-confidence (86.6 per cent came to the centre for this reason). And in
responding to a question that asked how their lives had changed as a result of coming to the
centre eleven participants wrote that they felt ‘more confident’ in themselves.
15
Connecting people
While computers are sometimes stigmatised as socially isolating, these centres served an
important community purpose — they connected people, both electronically and physically.
Many participants noted that their attendance was influenced by a social purpose. Over 80 per
cent of people came to the centre to email and chat over the internet (83.7 per cent) and
because they liked the other people who attended (81.4 per cent).
Electronically connecting people
While the type of internet usage was not explored in great detail, individuals were asked if they
accessed a number of sites relating to certain areas of life that could connect them socially,
politically and locally:
• 55 per cent used the internet to keep in touch with relatives and friends
• 64 per cent were connected locally by logging onto the internet to find local information and
events
• 49 per cent of participants used the internet to access government information and services.
The access to government services is notable because such contact increases these
individuals’ linking capital.
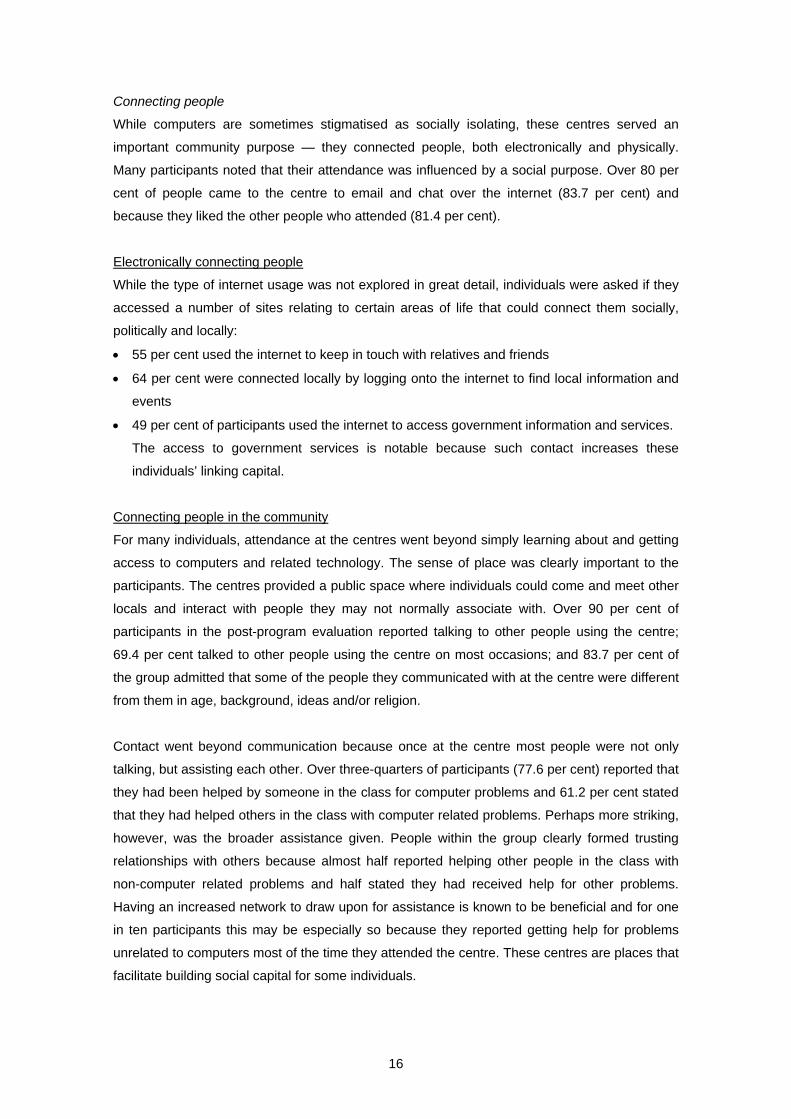
Connecting people in the community
For many individuals, attendance at the centres went beyond simply learning about and getting
access to computers and related technology. The sense of place was clearly important to the
participants. The centres provided a public space where individuals could come and meet other
locals and interact with people they may not normally associate with. Over 90 per cent of
participants in the post-program evaluation reported talking to other people using the centre;
69.4 per cent talked to other people using the centre on most occasions; and 83.7 per cent of
the group admitted that some of the people they communicated with at the centre were different
from them in age, background, ideas and/or religion.
Contact went beyond communication because once at the centre most people were not only
talking, but assisting each other. Over three-quarters of participants (77.6 per cent) reported that
they had been helped by someone in the class for computer problems and 61.2 per cent stated
that they had helped others in the class with computer related problems. Perhaps more striking,
however, was the broader assistance given. People within the group clearly formed trusting
relationships with others because almost half reported helping other people in the class with
non-computer related problems and half stated they had received help for other problems.
Having an increased network to draw upon for assistance is known to be beneficial and for one
in ten participants this may be especially so because they reported getting help for problems
unrelated to computers most of the time they attended the centre. These centres are places that
facilitate building social capital for some individuals.
16
0%
20%
40%
60%
80%
100%
Talked to otherparticipants at the
centre
Received help forcomputer problems
from otherparticipants
Received help forother problems from
other participants
never
rarely
some of the times I attend the centre
most of the time I attend the centre
every time I attend the centre
Figure 3. Connecting people
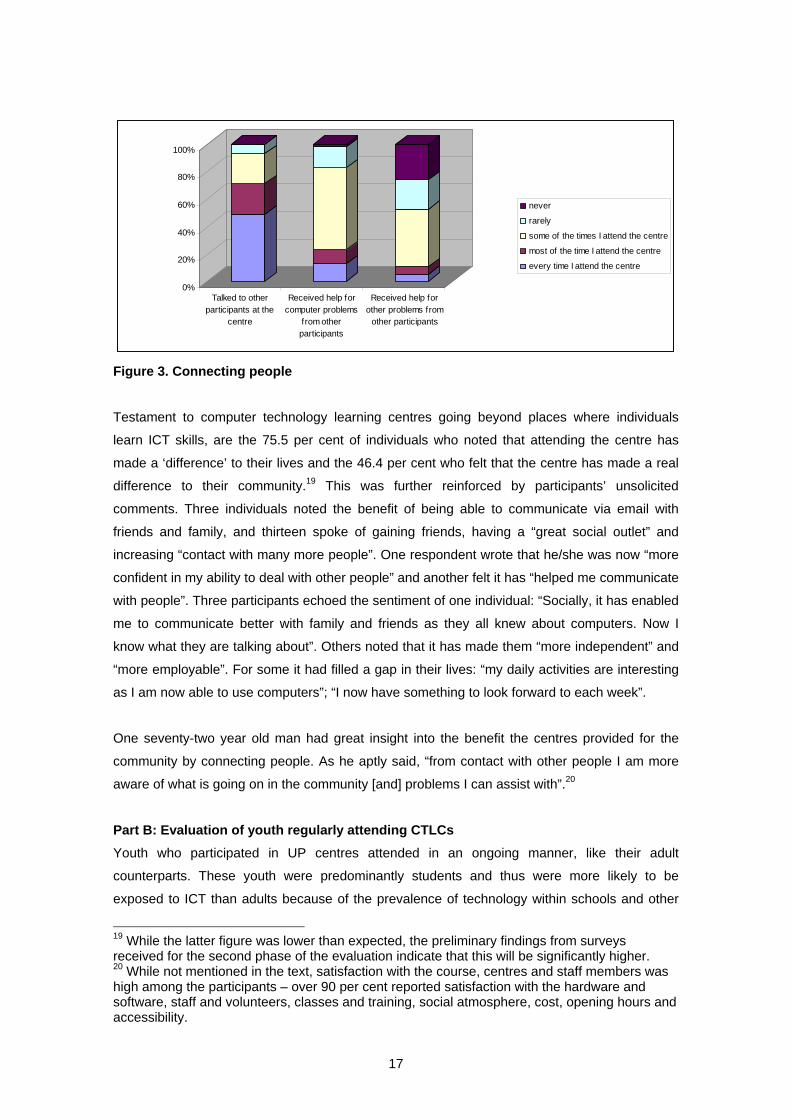
Testament to computer technology learning centres going beyond places where individuals
learn ICT skills, are the 75.5 per cent of individuals who noted that attending the centre has
made a ‘difference’ to their lives and the 46.4 per cent who felt that the centre has made a real
difference to their community.19 This was further reinforced by participants’ unsolicited
comments. Three individuals noted the benefit of being able to communicate via email with
friends and family, and thirteen spoke of gaining friends, having a “great social outlet” and
increasing “contact with many more people”. One respondent wrote that he/she was now “more
confident in my ability to deal with other people” and another felt it has “helped me communicate
with people”. Three participants echoed the sentiment of one individual: “Socially, it has enabled
me to communicate better with family and friends as they all knew about computers. Now I
know what they are talking about”. Others noted that it has made them “more independent” and
“more employable”. For some it had filled a gap in their lives: “my daily activities are interesting
as I am now able to use computers”; “I now have something to look forward to each week”.
One seventy-two year old man had great insight into the benefit the centres provided for the
community by connecting people. As he aptly said, “from contact with other people I am more
aware of what is going on in the community [and] problems I can assist with”.20
Part B: Evaluation of youth regularly attending CTLCs Youth who participated in UP centres attended in an ongoing manner, like their adult
counterparts. These youth were predominantly students and thus were more likely to be
exposed to ICT than adults because of the prevalence of technology within schools and other
19 While the latter figure was lower than expected, the preliminary findings from surveys received for the second phase of the evaluation indicate that this will be significantly higher. 20 While not mentioned in the text, satisfaction with the course, centres and staff members was high among the participants – over 90 per cent reported satisfaction with the hardware and software, staff and volunteers, classes and training, social atmosphere, cost, opening hours and accessibility.
17
education facilities. This, coupled with some slight differences in the evaluation survey, is why
adults and youth are dealt with separately in this report. Of the youth who attended the centres,
210 completed the pre-program survey, and 145 also filled out the post-program evaluation.
Demographics Youth attending the centre were almost split 50:50 male and female (54 per cent male, 46 per
cent female). The mean age was 12.3. The greatest proportion of youth were between 11 and
15 years of age (51.9 per cent), followed by 23 per cent who were under 10 years of age.
Almost 15 per cent were 18 years old and the remaining 10 per cent did not disclose their age.
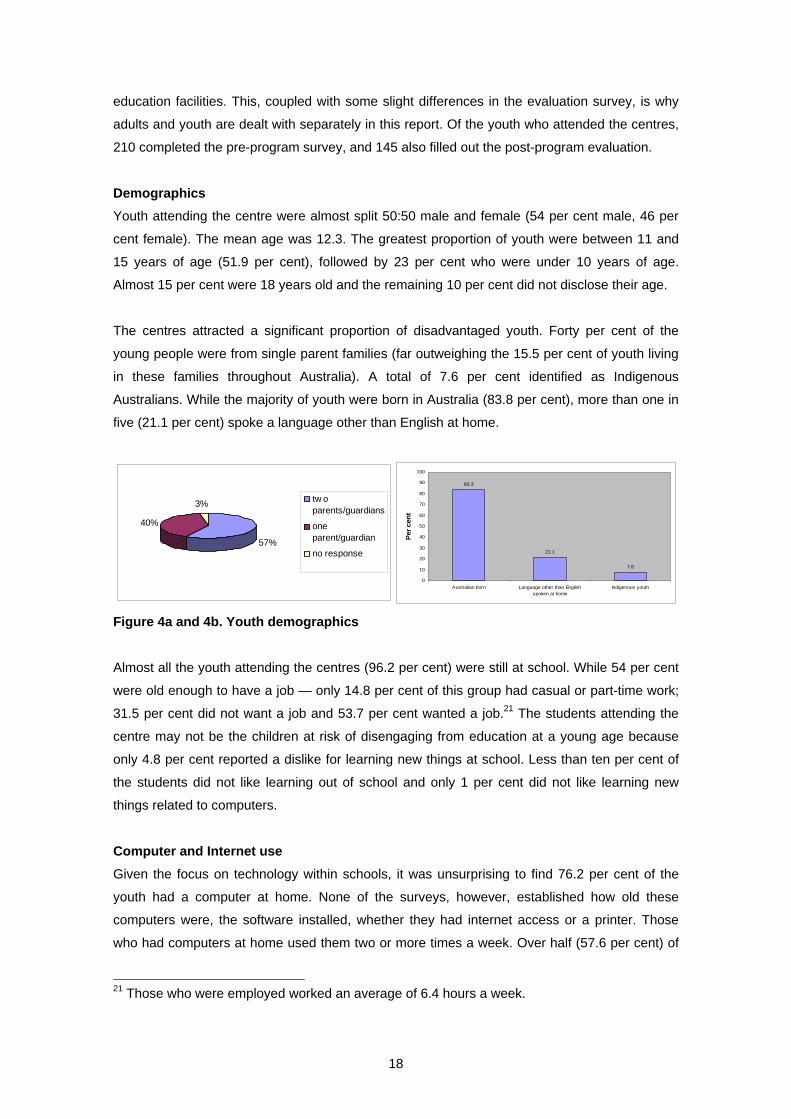
The centres attracted a significant proportion of disadvantaged youth. Forty per cent of the
young people were from single parent families (far outweighing the 15.5 per cent of youth living
in these families throughout Australia). A total of 7.6 per cent identified as Indigenous
Australians. While the majority of youth were born in Australia (83.8 per cent), more than one in
five (21.1 per cent) spoke a language other than English at home.
57%
40%
3% tw oparents/guardians
oneparent/guardian
no response
83.3
21.1
7.6
0
10
20
30
40
50
60
70
80
90
100
Australian born Language other than Englishspoken at home
Indigenous youth
Per c
ent
Figure 4a and 4b. Youth demographics
Almost all the youth attending the centres (96.2 per cent) were still at school. While 54 per cent
were old enough to have a job — only 14.8 per cent of this group had casual or part-time work;
31.5 per cent did not want a job and 53.7 per cent wanted a job.21 The students attending the
centre may not be the children at risk of disengaging from education at a young age because
only 4.8 per cent reported a dislike for learning new things at school. Less than ten per cent of
the students did not like learning out of school and only 1 per cent did not like learning new
things related to computers.
Computer and Internet use Given the focus on technology within schools, it was unsurprising to find 76.2 per cent of the
youth had a computer at home. None of the surveys, however, established how old these
computers were, the software installed, whether they had internet access or a printer. Those
who had computers at home used them two or more times a week. Over half (57.6 per cent) of
21 Those who were employed worked an average of 6.4 hours a week.
18
the students used computers at a friend or relative’s house. Eighty per cent had used one at a
community centre and 39 per cent at the library. Almost all youth (96.7 per cent) had used a
computer at school. Thus the students were somewhat frequent computer uses and were active
in exploiting resources to get access to computers and the internet. This was further evidenced
by the 81.3 per cent who felt very or slightly confident about using a computer.
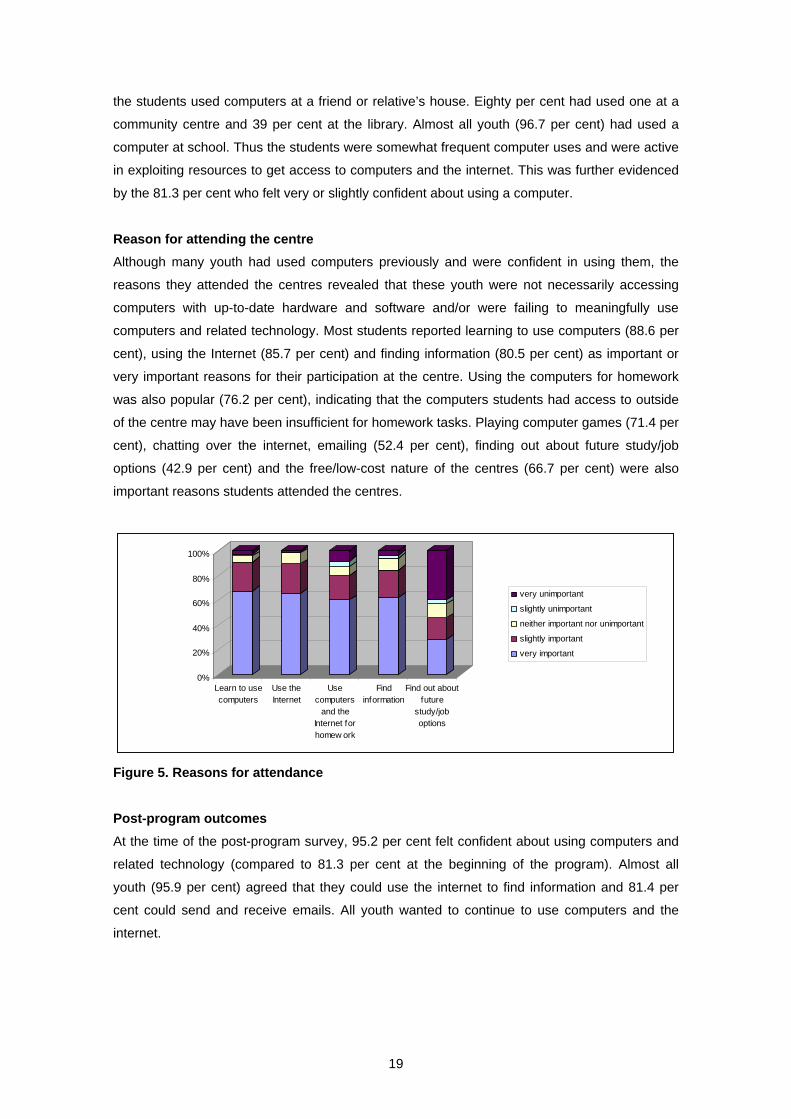
Reason for attending the centre Although many youth had used computers previously and were confident in using them, the
reasons they attended the centres revealed that these youth were not necessarily accessing
computers with up-to-date hardware and software and/or were failing to meaningfully use
computers and related technology. Most students reported learning to use computers (88.6 per
cent), using the Internet (85.7 per cent) and finding information (80.5 per cent) as important or
very important reasons for their participation at the centre. Using the computers for homework
was also popular (76.2 per cent), indicating that the computers students had access to outside
of the centre may have been insufficient for homework tasks. Playing computer games (71.4 per
cent), chatting over the internet, emailing (52.4 per cent), finding out about future study/job
options (42.9 per cent) and the free/low-cost nature of the centres (66.7 per cent) were also
important reasons students attended the centres.
0%
20%
40%
60%
80%
100%
Learn to usecomputers
Use theInternet
Usecomputers
and theInternet forhomew ork
Findinformation
Find out aboutfuture
study/joboptions
very unimportant
slightly unimportant
neither important nor unimportant
slightly important
very important
Figure 5. Reasons for attendance
Post-program outcomes At the time of the post-program survey, 95.2 per cent felt confident about using computers and
related technology (compared to 81.3 per cent at the beginning of the program). Almost all
youth (95.9 per cent) agreed that they could use the internet to find information and 81.4 per
cent could send and receive emails. All youth wanted to continue to use computers and the
internet.
19
Reasons for attendance
Over time, young people’s reasons for attending the centres slightly changed. At the end of the
program an increased number of students attended to:
• learn to use computers (92.4 per cent)
• use the internet (94.5 per cent)
• find information (86.9 per cent)
• chat over the internet or email (64.8 per cent).
Thus a larger proportion of youth may have understood the knowledge and benefits that can be
reaped from computers and related technology. The importance of using the computers for
homework use decreased slightly (73.1 per cent), along with finding out about future study/job
options (32.4 per cent). More students attended because it was free/cheap (82.8 per cent).
Centres also became a social hub for some students — 83.4 per cent reported attending
because “I like the people” and 94.5 per cent attended because “it is fun”.22
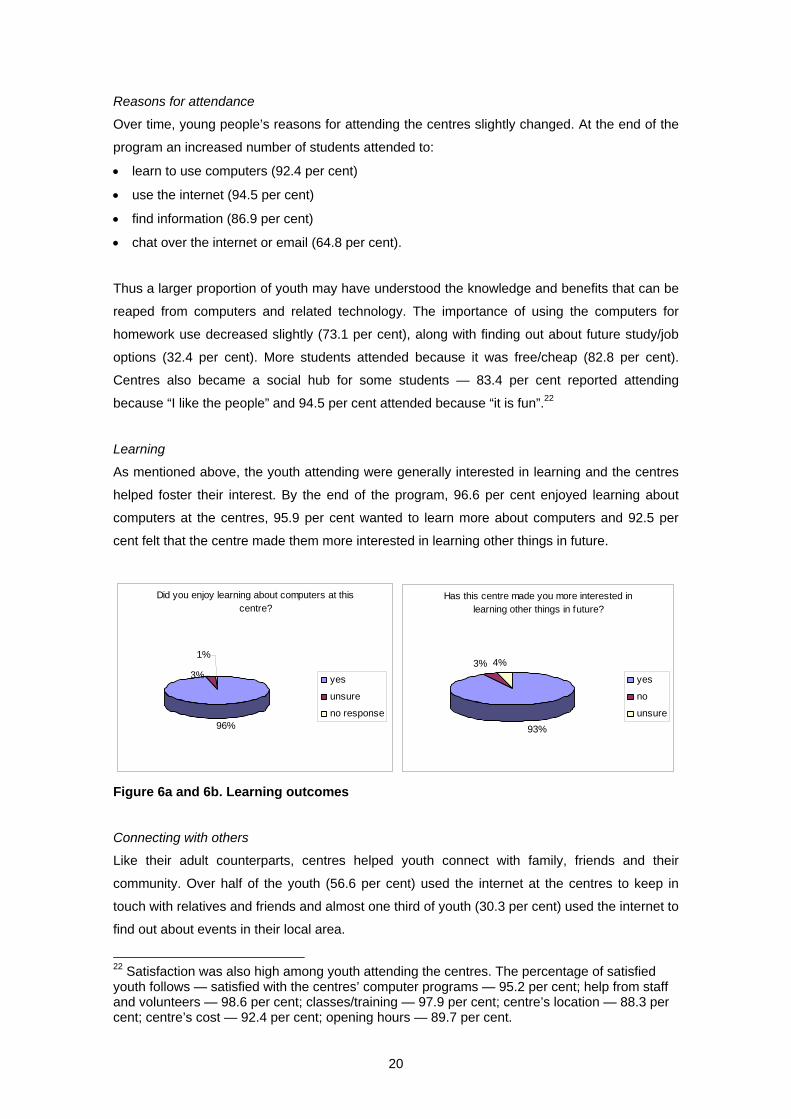
Learning
As mentioned above, the youth attending were generally interested in learning and the centres
helped foster their interest. By the end of the program, 96.6 per cent enjoyed learning about
computers at the centres, 95.9 per cent wanted to learn more about computers and 92.5 per
cent felt that the centre made them more interested in learning other things in future.
Did you enjoy learning about computers at this centre?
96%
3%
1%
yes
unsure
no response
Has this centre made you more interested in learning other things in future?
93%
3% 4%
yes
no
unsure
Figure 6a and 6b. Learning outcomes
Connecting with others
Like their adult counterparts, centres helped youth connect with family, friends and their
community. Over half of the youth (56.6 per cent) used the internet at the centres to keep in
touch with relatives and friends and almost one third of youth (30.3 per cent) used the internet to
find out about events in their local area.
22 Satisfaction was also high among youth attending the centres. The percentage of satisfied youth follows — satisfied with the centres’ computer programs — 95.2 per cent; help from staff and volunteers — 98.6 per cent; classes/training — 97.9 per cent; centre’s location — 88.3 per cent; centre’s cost — 92.4 per cent; opening hours — 89.7 per cent.
20
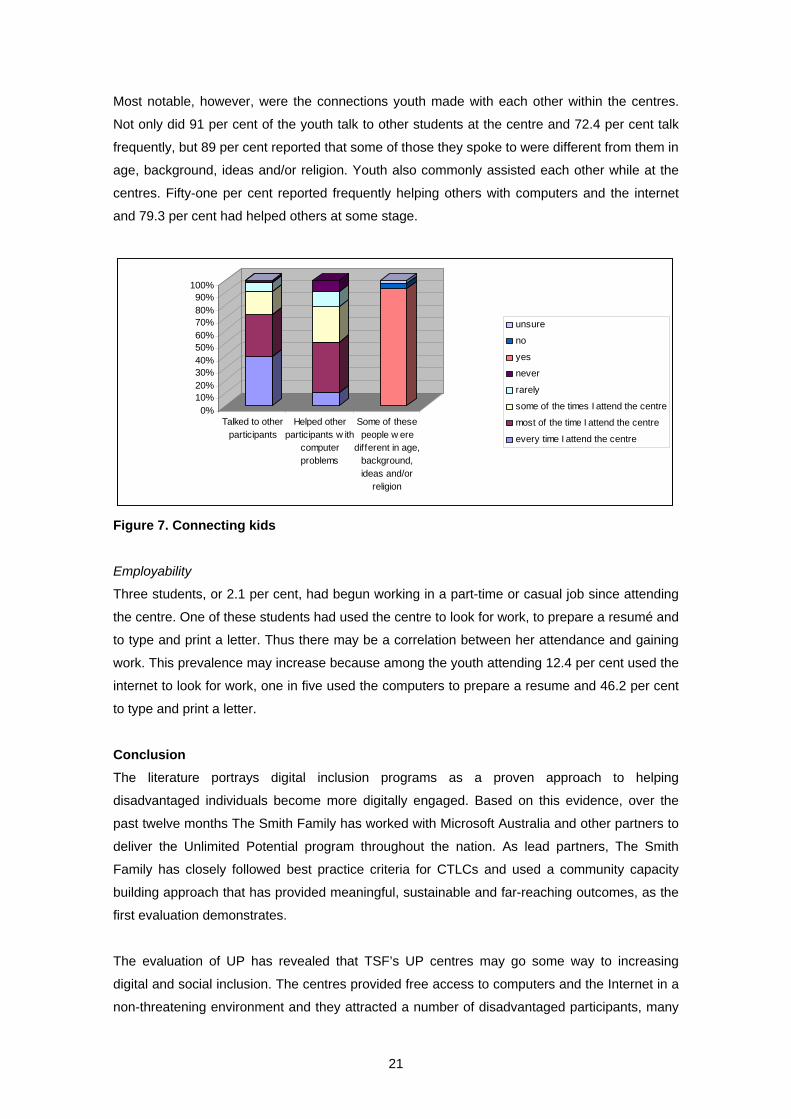
Most notable, however, were the connections youth made with each other within the centres.
Not only did 91 per cent of the youth talk to other students at the centre and 72.4 per cent talk
frequently, but 89 per cent reported that some of those they spoke to were different from them in
age, background, ideas and/or religion. Youth also commonly assisted each other while at the
centres. Fifty-one per cent reported frequently helping others with computers and the internet
and 79.3 per cent had helped others at some stage.
0%10%20%30%40%50%60%70%80%90%
100%
Talked to otherparticipants
Helped otherparticipants w ith
computerproblems
Some of thesepeople w ere
different in age,background,ideas and/or
religion
unsure
no
yes
never
rarely
some of the times I attend the centre
most of the time I attend the centre
every time I attend the centre
Figure 7. Connecting kids
Employability
Three students, or 2.1 per cent, had begun working in a part-time or casual job since attending
the centre. One of these students had used the centre to look for work, to prepare a resumé and
to type and print a letter. Thus there may be a correlation between her attendance and gaining
work. This prevalence may increase because among the youth attending 12.4 per cent used the
internet to look for work, one in five used the computers to prepare a resume and 46.2 per cent
to type and print a letter.
Conclusion The literature portrays digital inclusion programs as a proven approach to helping
disadvantaged individuals become more digitally engaged. Based on this evidence, over the
past twelve months The Smith Family has worked with Microsoft Australia and other partners to
deliver the Unlimited Potential program throughout the nation. As lead partners, The Smith
Family has closely followed best practice criteria for CTLCs and used a community capacity
building approach that has provided meaningful, sustainable and far-reaching outcomes, as the
first evaluation demonstrates.
The evaluation of UP has revealed that TSF’s UP centres may go some way to increasing
digital and social inclusion. The centres provided free access to computers and the Internet in a
non-threatening environment and they attracted a number of disadvantaged participants, many
21
of whom were otherwise excluded from mainstream activities like work or study. From the self-
reporting of participants, attending the centres helped to increase ICT skills, foster positive
attitudes towards learning, contribute to personal growth and increase social connectivity —
electronically connecting people to relatives and friends and physically networking people with
other locals. While further more detailed research on UP centres should be conducted, this
evaluation has reaffirmed that given the right conditions and model, CTLCs have the potential to
increase digital and social inclusion.
References Australian Bureau of Statistics (ABS) 2002a, ‘Basic Community Profile and Snapshot’, Census
of Population and Housing 2001, viewed 27 March 2005,
<http://www.abs.gov.au/ausstats/[email protected]/Census_BCP_ASGC_ViewTemplate?ReadF
orm&Expand=1>.
ABS 2002b, Population by Age and Sex, Australian States and Territories, Cat. No. 3201.0,
ABS, Canberra, June 2002.
ABS 2003, Disability Australia, Cat. No. 4446.0, ABS, Canberra.
ABS 2005a, ‘Communications and information technology, Use of information technology’, Year
Book Australia, Cat. No. 1301.0, ABS, Canberra.
ABS 2005b, Labour Force Australia, Cat. No. 6202.0, ABS, Canberra, February 2005.
Asgeirsdottir B 2001, ‘Seizing the Benefits of New Technologies in a Changing Economy’ and
Thomas Anderson, ‘Knowledge without borders’, OECD Observer, viewed 16 February 2004,
<http://www.oecdobserver.org/news/fullstory.php/aid/619/Knowledge_without_borders.html>.
Academy for Educational Development 2003, Country Reports: Research on Non-Profit Public
Access Technology Centers, Report for Microsoft Corporation, Academy for Educational
Development, Washington, USA.
Brazelton J & Gorry A 2003, ‘Creating a knowledge-sharing community: If you build it will they
come?’, Association for Computing Machinery, vol. 46, no. 2, February 2003, pp. 23-25.
Cabinet Office, United Kingdom 2004, Enabling a digitally United Kingdom: A framework for
action, <http://www.cabinetoffice.gov.uk/publications/reports/digital/digitalframe.pdf>.
Chow C, Ellis J, Walker J & Wise B 2000, Who Goes There? Longitudinal Case Studies of
Twelve Users of Community Technology Centres, CTCNet Research and Evaluation Team and
National Science Foundation, USA.
Cisler S, Breeden L, Guilfoy V, Roberts M & Stone A 1999, ‘Computer and Communications
Use in Low-Income Communities’, Telecentre Evaluation: A Global Perspective, Quebec
Canada: A report for the Annie E. Casey Foundation presented at an international meeting on
telecentre evaluation, 28-30 September 1999.
22
Cook D, Diaz S, Juliana M & Kratcoski A 2002, Distance Learning Research Grants: Report of
findings, submitted to The Ohio Learning Network, Research Centre for Educational
Technology, Kent State University, Kent.
Crowe D, ‘Funds for IT programs dry up’, The Australian Financial Review, 13 May 2003.
CTCNet, Standards of Excellence for Computer Technology Centres, version 4, revision 10/02,
viewed 9 March 2004,
<http://www.npower.org/nationalservices/sbcexcelerator/ctc+standards+evaluation+form_blank.
pdf>.
Davies S, Wiley-Schwartz A, Pinkett R & Servon L 2003, Community Technology Centres as
Catalysts for Community Change, A Report to the Ford Foundation, Project for Public Spaces,
BCT Partners and New School University, January 2003.
Department of Communications, Information Technology and the Arts (DCITA) 2003,
Maintaining the Viability of Online Access Centres in Regional, Rural and Remote Australia,
Discussion Paper, DCITA, Canberra.
Devins D, Darlow A & Smith V 2002, ‘Lifelong learning and digital exclusion: lessons from the
evaluation of an ICT learning centre and an emerging research agenda’, Regional Studies, vol.
36, no. 8, November 2002.
Directorate for Education, Employment, Labour and Social Affairs, OECD 2001, Thematic
Review on Adult Learning: Highlights, Emerging Issues and Lessons to Date’, OECD, Paris.
Ferlander S 2003, The Internet, Social Capital and Local Community, PhD thesis, Department
of Psychology, University of Stirling.
Harouna B, McMillan-Culp K, Green L, Henriquez A & Honey M 2001, Effective Technology Use
in Low-Income Communities: Research Review for the America Connects Consortium, Centre
for Children & Technology.
Hopkins L & Thomas J, e-social capital: Building community through electronic networks,
Institute for Social Research, Swinburne University, viewed 5 March 2004,
<http://www.sisr.net/wiredhighrise/papers/buildcommunity.pdf>.
International Telecommunication Union 2003, ‘ITU Digital Access Index: World’s First Global
ICT Ranking’, Press Release, 19 November 2003, viewed 23 February 2004,
<http://www.itu.int/newsarchive/press_releases/2003/30.html>.
Lloyd R & Bill A 2004, Australia Online: How Australians are Using Computers and the Internet
2001, National Centre for Social and Economic Modelling and Australian Bureau of Statistics,
Canberra.
Muir K 2004, Connecting Communities with CTLCs: from the digital divide to social inclusion,
The Smith Family, Sydney.
23
Norris A 2002, ‘Online access centres and partnerships for building community capacity’,
Australian Journal of Adult Learning, vol. 42, no. 3, November 2002, pp. 364-80.
OECD 2001, The New Economy Beyond the Hype: The OECD Growth Project, OECD, Paris.
OECD 2003, Beyond Rhetoric: Adult Learning Policies and Practices — Highlights, OECD,
Paris.
Oliver R 2001, ‘Seeking best practice in online learning: flexible learning toolboxes in the
Australian VET sector’, Australian Journal of Educational Technology, vol. 17, no. 2, pp. 204-22.
Russell M 1999, ‘Online learning communities: implications for adult learning’, Adult Learning,
vol. 10, no. 4, Summer 1999, pp. 28-31.
Selwyn N & Gorard S 2003, ‘Reality bytes: examining the rhetoric of widening educational
participation via ICT’, British Journal of Educational Technology, vol. 34, no 2, pp. 169-181.
Selwyn N, Gorard S & Williams S 2002, ‘We are guinea pigs really’: Examining the realities of
ICT-based adult learning’, Studies in the Education of Adults, vol. 34, no. 1, Spring, pp. 23-41.
Simpson L, Daws L & Wood L 2003, ‘More than just an Internet connection: Building Rural
Social Capital Through Public Access’, Rural Society, vol. 13, no. 2, pp. 113-25.
Tacticos T 2004, ‘Cost Restraint: Tensions in Volunteer Use and Support’, Evolution, Devolution
or Revolution, 10th National Conference on Volunteering, Volunteering Australia, Melbourne, 2-4
June.
Warschauer M 2003, ‘Demystifying the Digital Divide’, Scientific American, vol. 289, no. 2,
August, pp. 42-7.
Warschauer M 2002, ‘Reconceptualizing the Digital Divide’, First Monday, no. 7, June, viewed 3
March 2004, <http://www.firstmonday.dk/issues/issue7_7/warschauer/>.
Zappala G (ed.) 2003, Barriers to Participation: Financial, Educational and Technological, A
report into the barriers to societal participation among low-income Australians, The Smith
Family, Camperdown.
24