Embed Size (px)
Citation preview
istatworkingpapers
N.232015
The Revised ISTAT Economic Sentiment Indicator: its Structure and Verification of Performance Against the Cyclical Movements of the Italian GDP
Solange Leproux, Emilia Matera

N.232015
The Revised ISTAT Economic Sentiment Indicator: its Structure and Verification of Performance Against the Cyclical Movements of the Italian GDP
Solange Leproux, Emilia Matera
istatworkingpapers
Comitato scientifico
Giorgio Alleva Emanuele Baldacci Francesco Billari Tommaso Di Fonzo Andrea Mancini Roberto Monducci Fabrizio Onida Linda Laura Sabbadini Antonio Schizzerotto
Comitato di redazione
Alessandro Brunetti Patrizia Cacioli Marco Fortini Romina Fraboni Stefania Rossetti Daniela Rossi Maria Pia Sorvillo
Segreteria tecnica
Daniela De Luca Laura Peci Marinella Pepe Gilda Sonetti
Istat Working Papers The Revised ISTAT Economic Sentiment Indicator: its Structure and Verification of Performance Against the Cyclical Movements of the Italian GDP N. 23/2015 ISBN 978-88-458-1883-7 © 2015 Istituto nazionale di statistica Via Cesare Balbo, 16 – Roma Salvo diversa indicazione la riproduzione è libera, a condizione che venga citata la fonte. Immagini, loghi (compreso il logo dell’Istat), marchi registrati e altri contenuti di proprietà di terzi appartengono ai rispettivi proprietari e non possono essere riprodotti senza il loro consenso.
ISTAT WORKING PAPERS N. 23/2015
ISTITUTO NAZIONALE DI STATISTICA 5
The Revised ISTAT Economic Sentiment Indicator: its Structure and Verification of Performance Against the Cyclical Movements
of the Italian GDP
Solange Leproux, Emilia Matera
Sommario
Nel corso del 2014 le inchieste congiunturali ISTAT sul clima di fiducia delle imprese sono state oggetto di una importante ristrutturazione metodologica volta, in particolare, all’aggiornamento del sistema di ponderazione utilizzato in fase di elaborazione dei dati. Contestuale all’avvio della diffusione delle nuove serie delle variabili tratte da tali inchieste e dei relativi indici di fiducia (espressi in base 2010, anziché 2005 come in precedenza), l’Istituto ha avviato anche la pubblicazione della nuova serie dello IESI, l’indicatore sintetico della fiducia dell’intero comparto produttivo italiano che l’ISTAT diffonde dal giugno 2012. Alla luce dei risultati cui tale revisione ha condotto, questo lavoro si propone di verificare le capacità del “nuovo” IESI nel cogliere le fluttuazioni dell’attività economica aggregata. A fini comparativi, l’analisi econometrica viene successivamente estesa anche allo ESI, l’analogo indicatore costruito, per l’Italia, dalla Commissione Europea. Sulla base delle evidenze empiriche emerse, l’indicatore elaborato dall’ISTAT sembra presentare interessanti caratteristiche sia in termini di tempestività nell’identificazione dei punti di svolta della evoluzione ciclica dell’economia, sia in termini di capacità anticipatrici rispetto al tasso di crescita del PIL.
Parole chiave: Clima di fiducia, indicatori compositi, ciclo economico.
Abstract
In 2014 ISTAT surveys on firms’ confidence climate have been substantially revised in their methodology. This revision has concentrated on the updating of the weighting system used during the process of data construction. Parallel to the diffusion of these new revised series and, therefore, of firms’ confidence climate indexes (with 2010 as the base year, instead of 2005 as in the old series), ISTAT has also started the publication of the newly-revised synthetic indicator regarding the confidence climate of the entire Italian productive sector (IESI) which was first published in June 2012. Based on the results of this revision, the paper aims to verify the capacity of the “new” IESI to better assess the fluctuations in aggregate economic activity. The econometric analysis here presented is extended to a comparison with the analogous synthetic indicator (ESI) produced with reference to the Italian economy by the European Commission. The empirical evidence produced in this paper shows some important features of IESI and in particular its capacity to timely anticipate the turning points of the business cycle as well as the dynamics of GDP growth.
Keywords: Confidence Indicators, Composite Indicators, Business Cycle.
THE REVISED ISTAT ECONOMIC SENTIMENT INDICATOR
6 ISTITUTO NAZIONALE DI STATISTICA
Index
Pag.
1. Introduction…………………………………………………………………….. 72. The harmonized business and consumer surveys: a review of their history
and literature………………………………………….…………………….…… 83. The ISTAT surveys on business confidence within the European harmonized
program ………………………………………….………………………….…… 114. The construction methodology of the ISTAT Economic Sentiment Indicator
(IESI) …………………………………………. ………………………….…… 5. The IESI cyclical features compared with the performance of Italian GDP 6. Final remarks ............................................................................................................
131519
ISTAT WORKING PAPERS N. 23/2015
ISTITUTO NAZIONALE DI STATISTICA 7
1. Introduction1
The Italian National Statistical Institute (ISTAT) publishes on monthly basis the results of consumers’ and firms’ surveys with the press release “Consumer and Business Confidence”. Starting in June 2012, the press release presents also the “ISTAT Economic Sentiment Indicator”, an indicator that provides an aggregate measurement of the state of confidence of the entire Italian productive sector, together with the traditional indices of the climate of confidence, calculated for the individual productive sectors.
Briefly indicated as “IESI”, the new indicator is a synthesis of data from the surveys of business confidence manufacturing, construction, market services and retail trade.
Since January 20112, ISTAT is the Italian partner of these surveys that have recently seen an important methodological restructuring. In particular, the system of weighting of variables investigated has been updated (since January 2010, weighed with the Added Value 2012, rather than 2010) and the base for all the confidence indices, IESI included, is now the year 2010, rather than 2005.
The rearranging work, started at the beginning of 2014, ended with the diffusion of a press release, in March 30, 2015, of the “new” historical series of all of the variables investigated, the “new” confidence indices relating to individual industries and, finally, of the “new” series of the composite index IESI3
The aim of this work is to check the cyclical properties of the new series of the IESI, to assess its capacity to anticipate the turning points of aggregate activities as identified by GDP and, finally, to compare these properties with those of the analogous indicator developed, for our country, by the European Commission: the Economic Sentiment Indicator (ESI).
The paper is organized as follows: after the introduction, the second section presents an overview of the history and of national and international literature on surveys and gives a brief review of the most known indicators processed with the variables of Business surveys; the third section describes the business confidence climate surveys, monthly provided by ISTAT within the harmonized project of the EC. The fourth section describes the methodology used for the construction of the IESI, as well as the one used to reconstruct the historical series of the indicator after the introduction of the above-mentioned methodological innovations; the fifth section illustrates the results of statistical and econometric tests in order to evaluate the performance of the IESI relative to GDP. It follows a comparison of the results of these tests with those obtained by applying the same test to the ESI indicator developed by the European Commission; final remarks end the paper.
1
Although the work is a common reflection of the authors, sections 1, 3, 4 may be attributed to E. Matera, sections 2, 5, 6 to S. Leproux. The views expressed in this paper are those of the authors and do not necessarily represent the institutions with which they are affiliated.
2 The first Italian institution responsible for the realization of these surveys has been the National Institute for Studies on Economic Cycle (IS-CO). Subsequently, the President of the Republic Decree No.374 of 1998 has attributed the function to the Institute for Studies and Economic Analyses (ISAE). Following the suppression of the latter, the harmonized surveys were transferred to the Italian National Statistical Office (ISTAT) in January 2011 (Atricle 7 of Decre No.78 of 2010, as converted in law No.122 of 2010).
3 The “new” series and the series until February 2015 are available in the data bank I. Stat, accessible from the site of the Institute http://dati.istat.it/.
THE REVISED ISTAT ECONOMIC SENTIMENT INDICATOR
8 ISTITUTO NAZIONALE DI STATISTICA
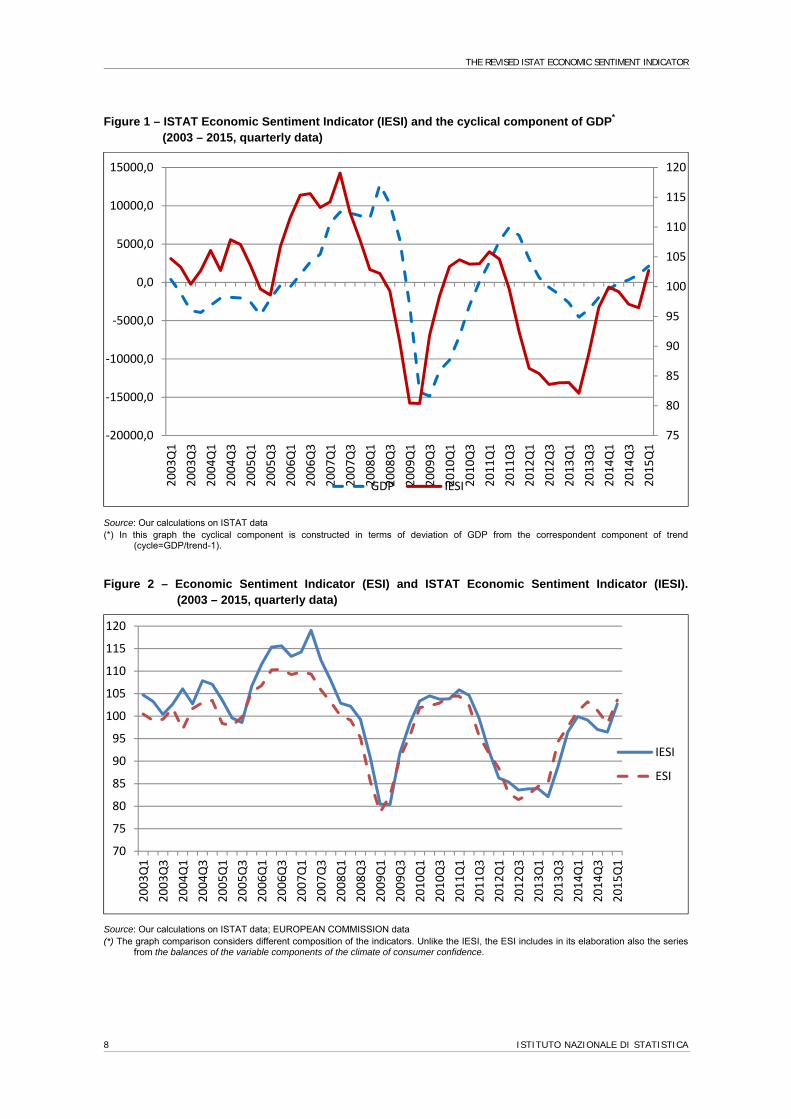
Figure 1 – ISTAT Economic Sentiment Indicator (IESI) and the cyclical component of GDP*
(2003 – 2015, quarterly data)
Source: Our calculations on ISTAT data (*) In this graph the cyclical component is constructed in terms of deviation of GDP from the correspondent component of trend
(cycle=GDP/trend-1).
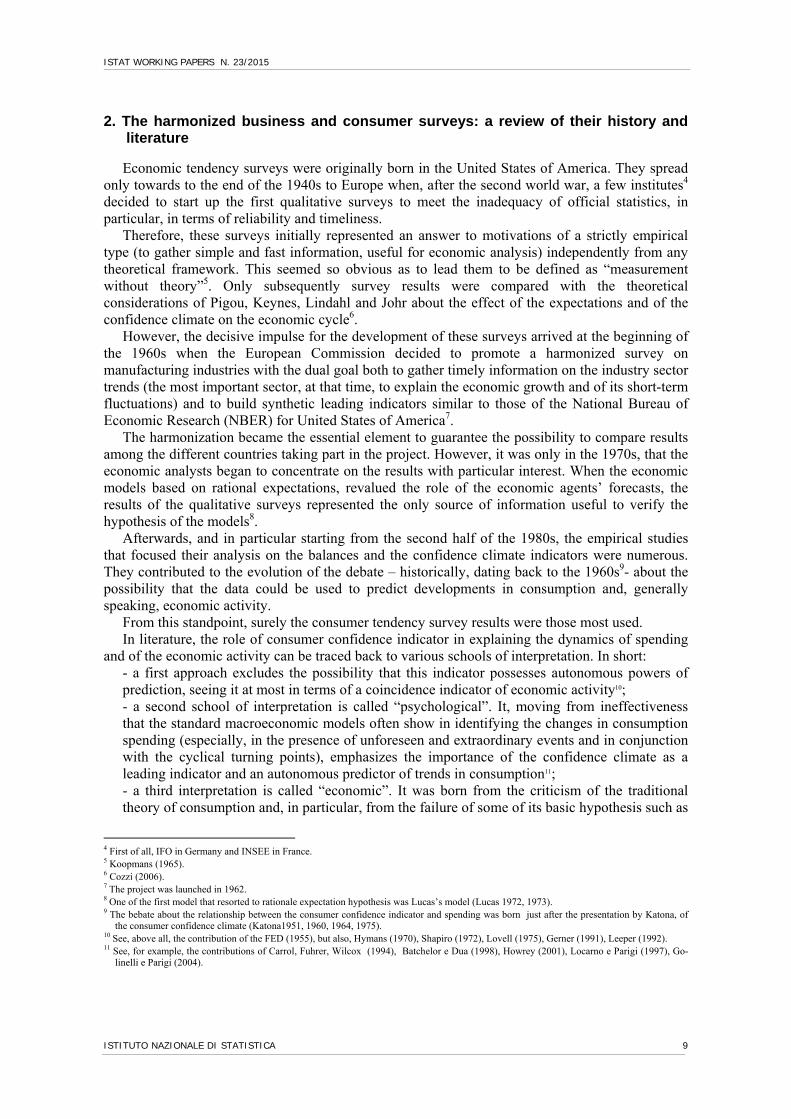
Figure 2 – Economic Sentiment Indicator (ESI) and ISTAT Economic Sentiment Indicator (IESI). (2003 – 2015, quarterly data)
Source: Our calculations on ISTAT data; EUROPEAN COMMISSION data (*) The graph comparison considers different composition of the indicators. Unlike the IESI, the ESI includes in its elaboration also the series
from the balances of the variable components of the climate of consumer confidence.
75
80
85
90
95
100
105
110
115
120
‐20000,0
‐15000,0
‐10000,0
‐5000,0
0,0
5000,0
10000,0
15000,02003Q1
2003Q3
2004Q1
2004Q3
2005Q1
2005Q3
2006Q1
2006Q3
2007Q1
2007Q3
2008Q1
2008Q3
2009Q1
2009Q3
2010Q1
2010Q3
2011Q1
2011Q3
2012Q1
2012Q3
2013Q1
2013Q3
2014Q1
2014Q3
2015Q1
GDP IESI
70
75
80
85
90
95
100
105
110
115
120
2003Q1
2003Q3
2004Q1
2004Q3
2005Q1
2005Q3
2006Q1
2006Q3
2007Q1
2007Q3
2008Q1
2008Q3
2009Q1
2009Q3
2010Q1
2010Q3
2011Q1
2011Q3
2012Q1
2012Q3
2013Q1
2013Q3
2014Q1
2014Q3
2015Q1
IESI
ESI
ISTAT WORKING PAPERS N. 23/2015
ISTITUTO NAZIONALE DI STATISTICA 9
2. The harmonized business and consumer surveys: a review of their history and literature
Economic tendency surveys were originally born in the United States of America. They spread only towards to the end of the 1940s to Europe when, after the second world war, a few institutes4
decided to start up the first qualitative surveys to meet the inadequacy of official statistics, in particular, in terms of reliability and timeliness.
Therefore, these surveys initially represented an answer to motivations of a strictly empirical type (to gather simple and fast information, useful for economic analysis) independently from any theoretical framework. This seemed so obvious as to lead them to be defined as “measurement without theory”5. Only subsequently survey results were compared with the theoretical considerations of Pigou, Keynes, Lindahl and Johr about the effect of the expectations and of the confidence climate on the economic cycle6.
However, the decisive impulse for the development of these surveys arrived at the beginning of the 1960s when the European Commission decided to promote a harmonized survey on manufacturing industries with the dual goal both to gather timely information on the industry sector trends (the most important sector, at that time, to explain the economic growth and of its short-term fluctuations) and to build synthetic leading indicators similar to those of the National Bureau of Economic Research (NBER) for United States of America7.
The harmonization became the essential element to guarantee the possibility to compare results among the different countries taking part in the project. However, it was only in the 1970s, that the economic analysts began to concentrate on the results with particular interest. When the economic models based on rational expectations, revalued the role of the economic agents’ forecasts, the results of the qualitative surveys represented the only source of information useful to verify the hypothesis of the models8.
Afterwards, and in particular starting from the second half of the 1980s, the empirical studies that focused their analysis on the balances and the confidence climate indicators were numerous. They contributed to the evolution of the debate – historically, dating back to the 1960s9- about the possibility that the data could be used to predict developments in consumption and, generally speaking, economic activity.
From this standpoint, surely the consumer tendency survey results were those most used. In literature, the role of consumer confidence indicator in explaining the dynamics of spending
and of the economic activity can be traced back to various schools of interpretation. In short: - a first approach excludes the possibility that this indicator possesses autonomous powers of prediction, seeing it at most in terms of a coincidence indicator of economic activity10; - a second school of interpretation is called “psychological”. It, moving from ineffectiveness that the standard macroeconomic models often show in identifying the changes in consumption spending (especially, in the presence of unforeseen and extraordinary events and in conjunction with the cyclical turning points), emphasizes the importance of the confidence climate as a leading indicator and an autonomous predictor of trends in consumption11; - a third interpretation is called “economic”. It was born from the criticism of the traditional theory of consumption and, in particular, from the failure of some of its basic hypothesis such as
4 First of all, IFO in Germany and INSEE in France. 5 Koopmans (1965). 6 Cozzi (2006). 7
The project was launched in 1962. 8
One of the first model that resorted to rationale expectation hypothesis was Lucas’s model (Lucas 1972, 1973). 9
The bebate about the relationship between the consumer confidence indicator and spending was born just after the presentation by Katona, of the consumer confidence climate (Katona1951, 1960, 1964, 1975).
10 See, above all, the contribution of the FED (1955), but also, Hymans (1970), Shapiro (1972), Lovell (1975), Gerner (1991), Leeper (1992).
11 See, for example, the contributions of Carrol, Fuhrer, Wilcox (1994), Batchelor e Dua (1998), Howrey (2001), Locarno e Parigi (1997), Go-linelli e Parigi (2004).
THE REVISED ISTAT ECONOMIC SENTIMENT INDICATOR
10 ISTITUTO NAZIONALE DI STATISTICA
that of rationale expectations, uncertainty and lack of perfect capital markets12; - a line of more recent study, finally, investigated the importance of the confidence climate of consumers in relation to the heterogeneity of the individual behavior13. The business tendency surveys have instead received much less attention on the part of the analysts. It is widely believed that the lesser success of these surveys, compared to those carried out on
consumers is at least partly due to the fact that they have been widespread for many years without the relevant confidence indicator14. The information synthesized by simple balances cannot in fact provide an interpretation of the current and prospective economic situation of the country as effective as that provided by the confidence indicators.
So only in the 1990s - that is, after encouragement by the European Commission to also publish confidence indicators for the manufacturing, construction, services and retail trade sectors – did theoretical and empirical contributions centre on business confidence indicators and on the role that they play in explaining the evolution of the business cycle.
Among the contributions related to this line of analysis, there comes to mind the work of Carnazza and Parigi (1999), in which the authors analyzed the role of the business confidence indicators in the study of the cyclical evolution of the Italian economy. Starting from data of surveys carried out on manufacturing, construction and retail trade firms, the authors built up new business climate indicators. Looking at the period between the first quarter of 1986 and the fourth quarter of 1999, they assessed that the ability of these new indicators in predicting the short-term evolution of the Italian GDP was very similar to that of a previous more sophisticated leading indicator jointly elaborated by the Institute of Studies and Economic Analysis (ISAE15) and the Research Department of the Bank of Italy16. Besides, the new indicators exhibit advantages of fast calculation, timeliness and, finally, lack of the need to revise the data (a problem that characterizes, on the contrary, the elaboration of most of the other composite leading indicators).
Subsequent work of Baffigi and Bassanetti (2004) proposed five indicators for real-time detection of turning points of the industrial production cycle of the euro area and of its four largest economies (France, Germany, Italy, Spain). Applying the model Gregoir and Lenglart model17 to a small number of questions included in surveys of the manufacturing firms, for each country and for the whole area the authors provided an estimate, on a monthly basis, of the probability that the economy in question finds itself in a positive or negative phase. These indicators, presented as the difference between these two probabilities, vary between -1 and +1, and their sign qualifies the current phase of the cycle; consequently, the turning point is indicated by the change of sign.
Finally, among the most recent studies based only on the data of business surveys, one can cite the analysis of Bernardelli (2014), presented at the 32nd CIRET conference18. Appling a Hidden Markov model for analyzing the results of the survey carried out on the firms of the industry sector, the author identifies the turning points of the Polish economy for the period between March 1997 and February 2014. The study highlighted, in particular, that the model based on the judgments on the current situation of the economy, rather than the one based on the expectations of the respondents, provides more satisfactory results in approximating the official chronology provided by the OECD for the country.
The systematic use of the monthly surveys carried out on businesses and on consumers by national and international institutions for the construction of the composite leading indicators,
12 For example, Flavin (1981), Wilcox (1989), Mishkin (1978), Deaton (1992), Carroll (1992), Luidvington e Michaelides (2001). 13 An interesting analysis of the effects on consumption induced by the shocks occurring at the aggregate level is conducted on data dis-
aggregated by socio-demographic characteristics of consumers in Souleles (2004). For the Italian case, see an analysis between the confidence climate and household expenditures based on disaggregated data, in Leproux and Malgarini (2006).
14 Except for surveys carried out by the IFO.
15 The ISAE was abolished in December 2010. Refer to footnote 2 on that.
16 See Altissimo et al. (1999) on this issue .
17 The model describes the economic cycle as a latent variable, the result of a first-order Markov process that characterizes the alternation of the phases of expansions and recessions (switching model). Grégoir and Lenglart (2000).
18 Bernardelli (2014). For the literature on it see also Marcellino (2006), Crosilla e Leproux (2007), Bachman, Elstner, Sims (2010).
ISTAT WORKING PAPERS N. 23/2015
ISTITUTO NAZIONALE DI STATISTICA 11
however, is the evidence of how the data stemming from these surveys represents the information more readily available on the economic situation of a country. Several indicators are calculated by assigning a central or even exclusive role to such data; among these indicators we cite, for example:
- The “Economic Sentiment Indicator” (ESI) from the European Commission. This latter is built up as a weighted average of the qualitative variables (15 balances in the whole) that compose both consumer and the business confidence indicators. The indicator is scaled to have mean of 100 and standard deviation of 1019, so that the values greater than 100 indicate an above-average economic sentiment whereas values below 100 indicate a below-average position. The ESI presents characteristics of leading indicator compared with the turning points of the reference series chosen as a proxy of the economic aggregate (GDP or industrial production). - The OECD system of “Composite Leading Indicators” (CLIs)20. It is a system of leading indicators that the OECD has developed since the 1980s. These indicators are calculated on a monthly basis for 33 OECD countries, for six economies not belonging to the OECD (Brazil, China, India, Indonesia, Russia and South Africa) and for the eight major geographic aggregations (OECD-Total; OECD and non-OECD Economies; Canada, France, Germany, Italy, Japan, United Kingdom and United States; OECD-Europe; Eurozone; France, Germany, Italy and the United Kingdom; NAFTA area: Canada, Mexico and the United States of America; China, India, Indonesia, Japan and Korea). They are built on the basis of time series characterized by cyclical fluctuations similar to those of the general cycle. For most countries, the reference series used was that of industrial production, up to March 2012 and that of the GDP, since April of the same year21. The series -both qualitative and quantitative- composing the indicators of each country are selected according to economic significance, cyclic behavior, the quality, timeliness and availability of data; they vary in number from country to country, ranging from a minimum of 5 to a maximum of 10 series22. - The "New Eurocoin" developed by the Bank of Italy and CEPR . It represents a real-time synthetic measure of the eurozone economy. Born to replace the old Eurocoin index, it does not have leading properties but provides a monthly updated estimate of GDP growth, free from measurement errors, seasonal and other short-run fluctuations. The construction of the indicator is based on an extensive database comprising about 150 series organized by groups of leading, coincident and lagged indicators with respect to GDP. Among the latter, 41 series refer to the industrial production indices, 24 to the price indices and 25 to indices drawn from business and consumer surveys.
3. The ISTAT surveys on business confidence within the European harmonized program
Starting from January 2011, ISTAT has become the beneficiary for Italy for the implementation of surveys on business confidence23, within the European harmonised project, currently governed by European Commission Decision C (97) 2241 of 15 July 1997 and Commission Communication COM (2006) of July 12, 200624.
These surveys were born (with the original aim remaining unchanged over time) to collect opinions (assessments and expectations) of firms about specific variables related to their future
19 For the methodological notes see: European Commission (2007). 20 Information on the methodology can be found in OECD (2012), or on the site: http://stats.oecd.org/mei/default.asp?rev=2. 21 The system of indicators was a subject of a methodological review in 2012. See for that OECD (2012). 22 For Italy, in particular, the component series are: the consumer confidence indicator; the production expectations (manufacturing firms; % bal-
ance); the deflated net new orders (industrial products; 2010=100); the order books (manufacturing firms; % balance); the CPI (2010=100; in-verted); imports from Germany (CIF). For each country, the full list of the component series is available on the website: http://www.oecd.org/std/leading-indicators/oecdcompositeleadingindicatorsreferenceturningpointsandcomponentseries.htm
23 See note 2. 24
On this matter, see CE, 1997.
THE REVISED ISTAT ECONOMIC SENTIMENT INDICATOR
12 ISTITUTO NAZIONALE DI STATISTICA
behavior and the economic environment in which they operate. The information gathered, mostly qualitative, are relevant to the identification of current and future changes of the four sectors of activity investigated.
The confidence surveys are designed for economic analysis purposes and are strongly different from quantitative statistics: they refer to different areas of economic activity, because respondents might respond assigning qualities rather than quantities to the variable of interest, are conducted with specific methods and are used mainly monitoring the economy.
From the methodological point of view, the business surveys follow the guide lines of the European Commission concerning the sample (type and sectoral stratification), the time frame (monthly) and the structure of the questionnaires. Collection methods and data processing (weighting and aggregation of results), and the techniques used to prepare, check and update the samples, are left to the choice of the countries participating in the European project.
In line with the methodological guidelines of the European Commission, the samples of the ISTAT surveys are longitudinal (panel) and stratified by sector of activity, on the basis of the divisions of ATECO 2007 classification, as is specifically required for each survey from the European Commission25. Finally, the questionnaires used by the ISTAT in the monthly interviews are, at least in their basic formulation, those being harmonized European level26.
The European Commission collects and process the results of harmonized (and thus comparable) surveys of countries participating in the program in order to analyze and compare the cyclical fluctuations of individual economies, the Eurozone and the European Union. Each country uses them to study and to predict the short-term evolution of the different economic sectors.
Italy participates in the project since the early ‘60s with, in particular, the following monthly surveys among businesses:
The survey on manufacturing confidence climate; The survey on construction confidence climate; The survey on retail trade confidence climate; The survey on market services confidence climate. ISTAT produces and publishes in each survey the monthly balances of all the variables
collected (obtained by the difference between positive and negative answering options, measured as percentage point of total answers27) and the confidence climate (in terms of indices, on base 2010 = 100) 28. In particular, the ISTAT publishes each month these indicators of confidence: - the confidence indicator in the manufacturing sector, obtained as the arithmetic mean of the
balances of three variables: assessment on the overall order books; assessment on stocks of finished products (the balance of this variable goes into the calculation of the indicator with the sign reversed); expectations regarding the development of production; - the confidence indicator in construction, obtained as the arithmetic mean of the balances of two variables: assessments on orders and/or construction plans; employment expectations;
- the indicator of the confidence of the retail trade, obtained as the arithmetic mean of the balances of three variables: assessments and expectations on sales; assessments on stocks (the balance of the variable is inserted in the calculation of the indicator with the inverted sign);
25
The ISTAT samples are stratified by geographic area and size of the company (identified by the number of employees). Precisely, the theoreti-cal sample size is equal to 700 units for the survey conducted among construction companies; 1.000 for the retail trade survey; 2.000 for the market services survey; 4.000 for the manufacturing survey. For a more detail on the methodological characteristics of surveys , see the metho-dological note of which is accompanied by the press release monthly “Consumer and Business Confidence”, available on the site http://www.istat.it/it/archivio/statisticaflash
26 All models of surveys, in addition to qualitative questions required by the Commission, present other sections designed to satisfy specific as-pects linked to national interest.
27 In the standard questionnaires the qualitative questions present three answering options: “ increased”, “stationary”, “diminished”. 28 Since 1973, within the same harmonized project, Italy realizes the survey of consumers. The results of this survey are made available in terms
of balances and climate index of confidence.
ISTAT WORKING PAPERS N. 23/2015
ISTITUTO NAZIONALE DI STATISTICA 13
- the indicator of the confidence of business services, obtained as the arithmetic mean of the balances of three variables: assessments and expectations on orders and on demand in general; expectations on the general trend of the Italian economy.
From a theoretical point of view, the significance of the results of qualitative surveys monitoring and anticipating economic developments of a sector, or of a country, or of a geographical area, rests on the idea that assessments and expectations anticipate the human behavior. The idea is that the behaviour of the operators at time t depends on the assessments and the expectations of the same operators at time t-1. Then, the survey’ results (expressed as balances or confidence indicators) provide information on short-term economic development, are available rapidly29, are harmonized and should not be revised (excluding normal seasonal changes). At the same time, they include information known to the participants in the survey, but not yet clearly understandable from quantitative variables aggregated (such as the consumption expenditure, or the added value, or the GDP).
The confidence climate of firms records the changes in perceptions of the operators. However, the indications of a qualitative nature that emerge from surveys are a necessary precondition, but not a sufficient one, to be quickly transposed in quantitative terms.
The caution of firms interviewed because of recent recession, seems to delay the emergence of the positive information that qualitative indicators could give: the extent of the recession makes firms’ expectations more uncertain. This slows the expenditure of firms; this confirms that qualitative indicators are able to anticipate more peaks then the troughs and, following the methodology of the NBER’S of Business survey analysis, peaks show less delays than troughs.
Moreover, consider what Zani30 explained in terms of "range of indifference": if the trend is increasing the operator considers as “satisfactory” the situation that brings some improvement and considers as “good” one that brings an increase greater than the “satisfactory” of his/her own firm’s growth. If the trend is a downward one, the same operator considers “satisfactory” the situation where the orders stop to fall and considers “good” the situation where sees better perspectives.
From a more technical point of views, many empirical works show that the aggregation of qualitative series into synthetic indicators, improves the forecasting capacity of each series, mitigates the false signals, reduces the cyclic variability and the possible errors that can be linked to the seasonality and minimizes the accidental errors of the series31.
ISTAT started the publication of the aggregate indicator of economic sentiment called ISTAT Economic Sentiment Indicator (IESI), both to respond to a real need for synthetic information and to be in line with studies more and more sophisticated about synthetic indicators. IESI considers what the European Commission has done, with reference to the Euro Area (with the Economic Sentiment Indicator, ESI), and what IFO in Germany (with the German IFO Business Climate) and INSEE in France, with l'Indicateur de climat des affaires)32 have been doing.
4. The construction methodology of the ISTAT Economic Sentiment Indicator (IESI)
In line with the methodology adopted by the European Commission with the indicator ESI, the methodology of aggregation of balances that compose the index, derives from the aggregation of the balances of the variables included in the confidence climate referred to industry, construction, trade and services surveys33. 29
For each harmonized survey, the ISTAT releases the data before the end of the month to which they relate. The European Commission publish-es the results of all the economic surveys harmonized at European level (today the countries leading this type of surveys there are 28 - 31, with the three candidate countries to join the European Union -) usually within the last week of the month of reference.
30 See: Zani, 1982. 31 See, for example: Strigel, 1988, Schlitzer, 1993, Carnazza e Oneto, 1996, Burns and Mitchell,1946. 32 In particular, see, for the indicator developed by the European, European Economy (2001); for the one developed by INSEE, Note de conjonc-
ture (2008); for the indicator of IFO, see the website: http://www.cesifo-group.de/ifoHome/facts/Survey-Results/Business-Climate.html 33 As well in paragraph 3.
THE REVISED ISTAT ECONOMIC SENTIMENT INDICATOR
14 ISTITUTO NAZIONALE DI STATISTICA
Therefore, the early data set, created by processing monthly responses of about 7,500 enterprises, is composed of historical series of eleven variables (3 each for the manufacturing, services and trade surveys and 2 for the construction survey).
The synthesis of these variables, seasonally adjusted34 and standardized, is calculated as a weighted sample average: in the computation the weighting system uses as weights the corresponding of Value Added as defined by National Accounts of each sector.
More in details, to assign to each sectors a weight as close as possible to the effective observations of each survey, the aggregates of Value Added are calculated net of the divisions that are not included in the domains of observation of the individual surveys35.
In addition, in order to obtain the weighted averages, the aggregates of value-added processed for each sector are divided by the number of variables that compose each confidence climate (see Table 1):
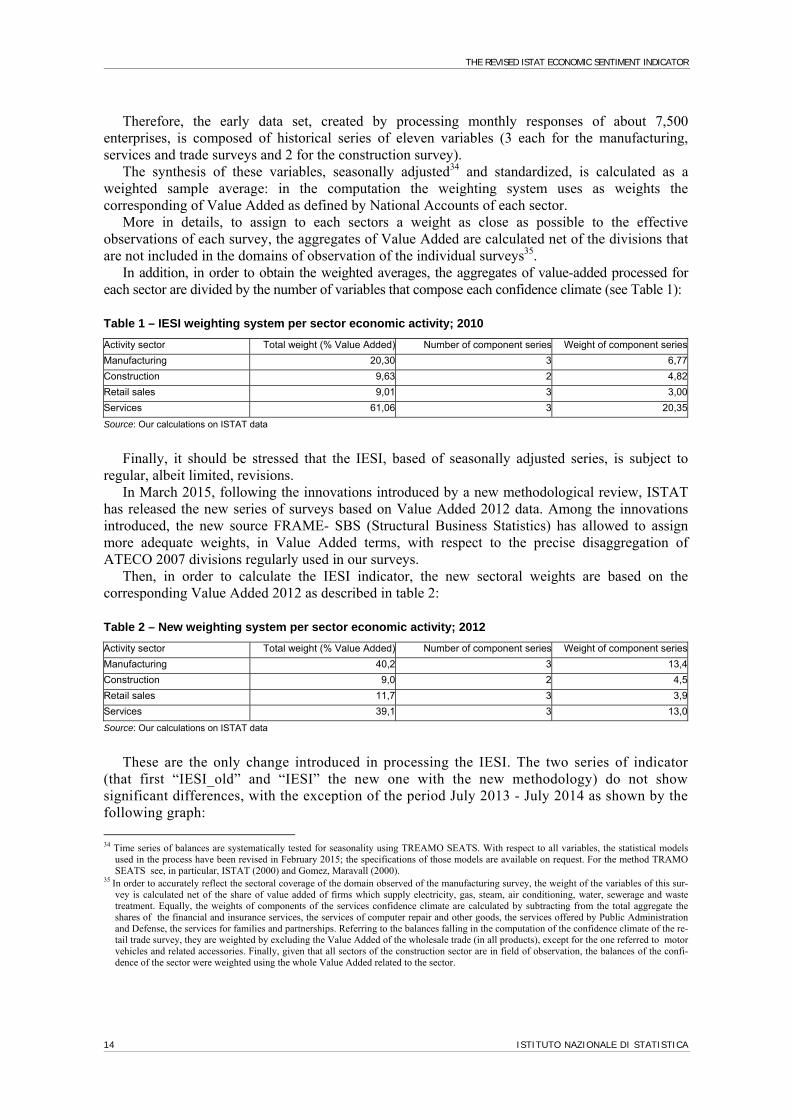
Table 1 – IESI weighting system per sector economic activity; 2010
Activity sector Total weight (% Value Added) Number of component series Weight of component series
Manufacturing 20,30 3 6,77
Construction 9,63 2 4,82
Retail sales 9,01 3 3,00
Services 61,06 3 20,35
Source: Our calculations on ISTAT data
Finally, it should be stressed that the IESI, based of seasonally adjusted series, is subject to regular, albeit limited, revisions.
In March 2015, following the innovations introduced by a new methodological review, ISTAT has released the new series of surveys based on Value Added 2012 data. Among the innovations introduced, the new source FRAME- SBS (Structural Business Statistics) has allowed to assign more adequate weights, in Value Added terms, with respect to the precise disaggregation of ATECO 2007 divisions regularly used in our surveys.
Then, in order to calculate the IESI indicator, the new sectoral weights are based on the corresponding Value Added 2012 as described in table 2:
Table 2 – New weighting system per sector economic activity; 2012
Activity sector Total weight (% Value Added) Number of component series Weight of component series
Manufacturing 40,2 3 13,4
Construction 9,0 2 4,5
Retail sales 11,7 3 3,9
Services 39,1 3 13,0
Source: Our calculations on ISTAT data
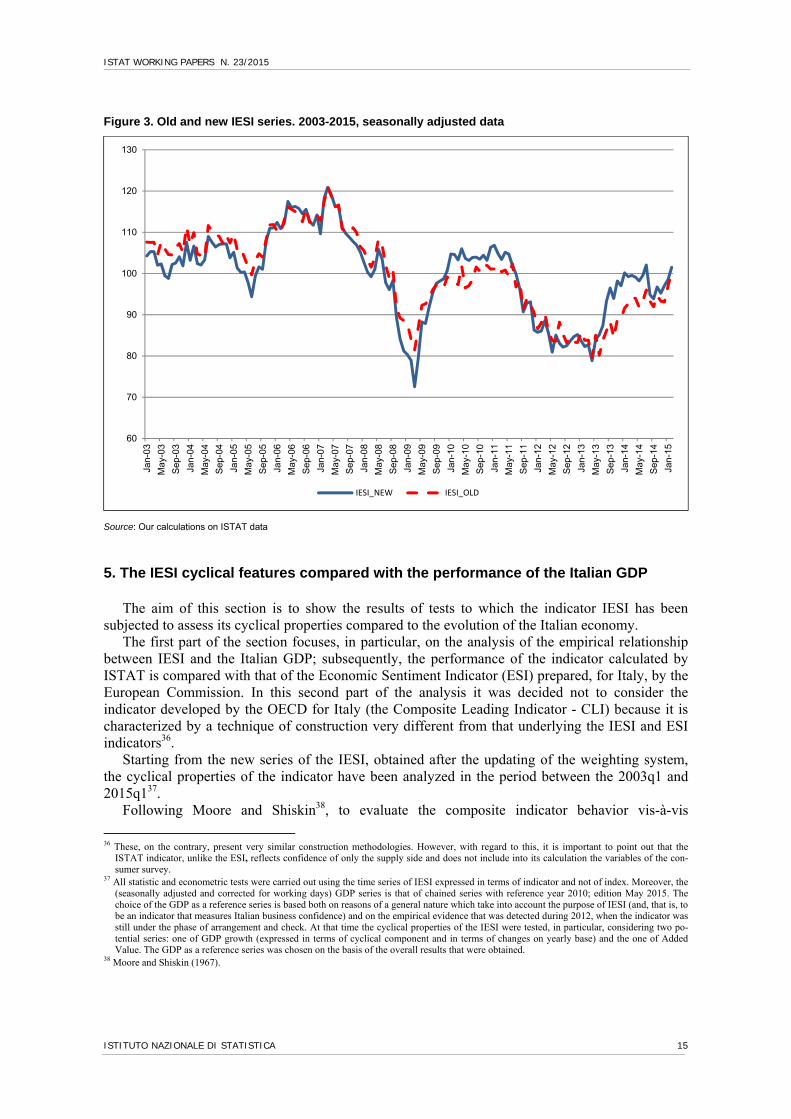
These are the only change introduced in processing the IESI. The two series of indicator (that first “IESI_old” and “IESI” the new one with the new methodology) do not show significant differences, with the exception of the period July 2013 - July 2014 as shown by the following graph:
34 Time series of balances are systematically tested for seasonality using TREAMO SEATS. With respect to all variables, the statistical models
used in the process have been revised in February 2015; the specifications of those models are available on request. For the method TRAMO SEATS see, in particular, ISTAT (2000) and Gomez, Maravall (2000).
35 In order to accurately reflect the sectoral coverage of the domain observed of the manufacturing survey, the weight of the variables of this sur-vey is calculated net of the share of value added of firms which supply electricity, gas, steam, air conditioning, water, sewerage and waste treatment. Equally, the weights of components of the services confidence climate are calculated by subtracting from the total aggregate the shares of the financial and insurance services, the services of computer repair and other goods, the services offered by Public Administration and Defense, the services for families and partnerships. Referring to the balances falling in the computation of the confidence climate of the re-tail trade survey, they are weighted by excluding the Value Added of the wholesale trade (in all products), except for the one referred to motor vehicles and related accessories. Finally, given that all sectors of the construction sector are in field of observation, the balances of the confi-dence of the sector were weighted using the whole Value Added related to the sector.
ISTAT WORKING PAPERS N. 23/2015
ISTITUTO NAZIONALE DI STATISTICA 15
Figure 3. Old and new IESI series. 2003-2015, seasonally adjusted data
Source: Our calculations on ISTAT data
5. The IESI cyclical features compared with the performance of the Italian GDP
The aim of this section is to show the results of tests to which the indicator IESI has been subjected to assess its cyclical properties compared to the evolution of the Italian economy.
The first part of the section focuses, in particular, on the analysis of the empirical relationship between IESI and the Italian GDP; subsequently, the performance of the indicator calculated by ISTAT is compared with that of the Economic Sentiment Indicator (ESI) prepared, for Italy, by the European Commission. In this second part of the analysis it was decided not to consider the indicator developed by the OECD for Italy (the Composite Leading Indicator - CLI) because it is characterized by a technique of construction very different from that underlying the IESI and ESI indicators36.
Starting from the new series of the IESI, obtained after the updating of the weighting system, the cyclical properties of the indicator have been analyzed in the period between the 2003q1 and 2015q137.
Following Moore and Shiskin38, to evaluate the composite indicator behavior vis-à-vis
36 These, on the contrary, present very similar construction methodologies. However, with regard to this, it is important to point out that the
ISTAT indicator, unlike the ESI, reflects confidence of only the supply side and does not include into its calculation the variables of the con-sumer survey.
37 All statistic and econometric tests were carried out using the time series of IESI expressed in terms of indicator and not of index. Moreover, the (seasonally adjusted and corrected for working days) GDP series is that of chained series with reference year 2010; edition May 2015. The choice of the GDP as a reference series is based both on reasons of a general nature which take into account the purpose of IESI (and, that is, to be an indicator that measures Italian business confidence) and on the empirical evidence that was detected during 2012, when the indicator was still under the phase of arrangement and check. At that time the cyclical properties of the IESI were tested, in particular, considering two po-tential series: one of GDP growth (expressed in terms of cyclical component and in terms of changes on yearly base) and the one of Added Value. The GDP as a reference series was chosen on the basis of the overall results that were obtained.
38 Moore and Shiskin (1967).
60
70
80
90
100
110
120
130Ja
n-03
May
-03
Sep
-03
Jan-
04
May
-04
Sep
-04
Jan-
05
May
-05
Sep
-05
Jan-
06
May
-06
Sep
-06
Jan-
07
May
-07
Sep
-07
Jan-
08
May
-08
Sep
-08
Jan-
09
May
-09
Sep
-09
Jan-
10
May
-10
Sep
-10
Jan-
11
May
-11
Sep
-11
Jan-
12
May
-12
Sep
-12
Jan-
13
May
-13
Sep
-13
Jan-
14
May
-14
Sep
-14
Jan-
15
IESI_NEW IESI_OLD
THE REVISED ISTAT ECONOMIC SENTIMENT INDICATOR
16 ISTITUTO NAZIONALE DI STATISTICA
developments in the reference series, in particular, we looked at turning points coherence, directional coherence and correlation. Lastly, in order to further test the forecasting capabilities of the composite indicator we investigated its forecasting properties in sample and out of sample.
As for turning points coherence, the analysis was conducted after removal from the GDP series of the long-term trend. This latter, in particular, was estimated using the Hodrick-Prescott filter in its standard version for quarterly series39.
On the base of the growth cycle approach, the phases of expansion and recession of the reference series were identified through the Bry-Brochan routine on the cyclical components of GDP40. The classical NBER approach was adopted for the quarterly data of the ISTAT indicator instead41.
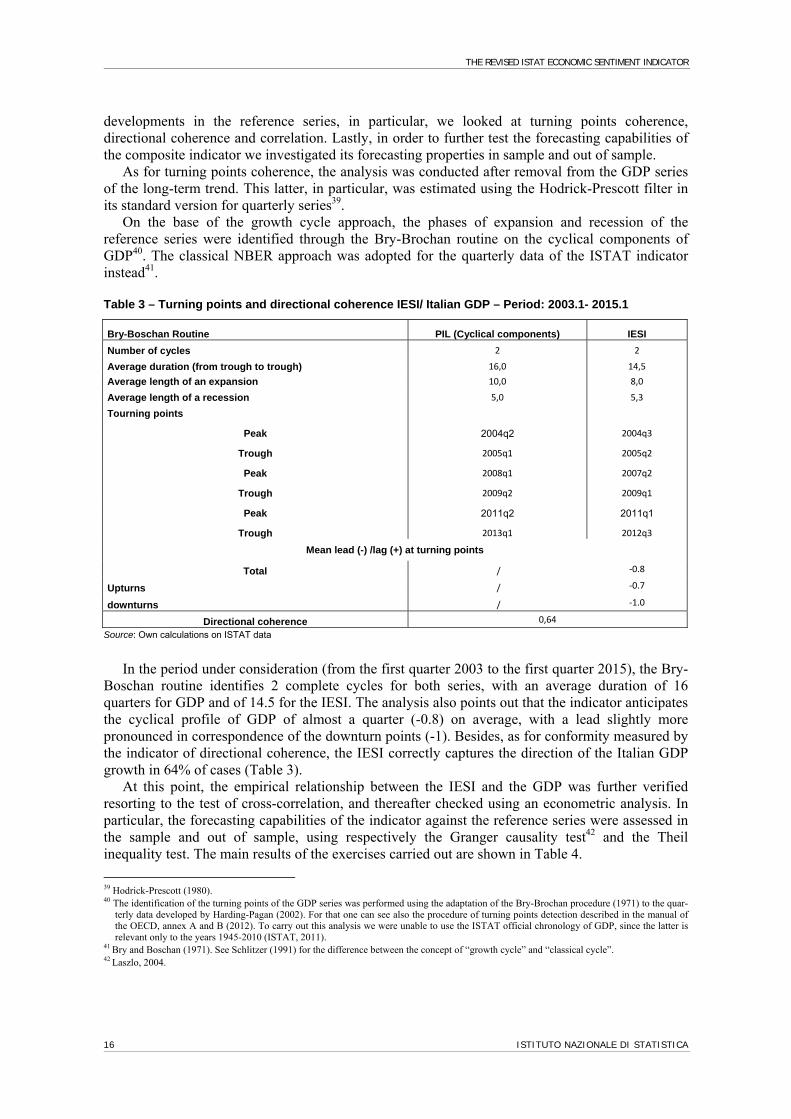
Table 3 – Turning points and directional coherence IESI/ Italian GDP – Period: 2003.1- 2015.1
Bry-Boschan Routine PIL (Cyclical components) IESI
Number of cycles 2 2
Average duration (from trough to trough) 16,0 14,5
Average length of an expansion 10,0 8,0
Average length of a recession 5,0 5,3
Tourning points
Peak 2004q2 2004q3
Trough 2005q1 2005q2
Peak 2008q1 2007q2
Trough 2009q2 2009q1
Peak 2011q2 2011q1
Trough 2013q1 2012q3
Mean lead (-) /lag (+) at turning points
Total / ‐0.8
Upturns / ‐0.7
downturns / ‐1.0
Directional coherence 0,64
Source: Own calculations on ISTAT data
In the period under consideration (from the first quarter 2003 to the first quarter 2015), the Bry-Boschan routine identifies 2 complete cycles for both series, with an average duration of 16 quarters for GDP and of 14.5 for the IESI. The analysis also points out that the indicator anticipates the cyclical profile of GDP of almost a quarter (-0.8) on average, with a lead slightly more pronounced in correspondence of the downturn points (-1). Besides, as for conformity measured by the indicator of directional coherence, the IESI correctly captures the direction of the Italian GDP growth in 64% of cases (Table 3).
At this point, the empirical relationship between the IESI and the GDP was further verified resorting to the test of cross-correlation, and thereafter checked using an econometric analysis. In particular, the forecasting capabilities of the indicator against the reference series were assessed in the sample and out of sample, using respectively the Granger causality test42 and the Theil inequality test. The main results of the exercises carried out are shown in Table 4.
39
Hodrick-Prescott (1980). 40 The identification of the turning points of the GDP series was performed using the adaptation of the Bry-Brochan procedure (1971) to the quar-
terly data developed by Harding-Pagan (2002). For that one can see also the procedure of turning points detection described in the manual of the OECD, annex A and B (2012). To carry out this analysis we were unable to use the ISTAT official chronology of GDP, since the latter is relevant only to the years 1945-2010 (ISTAT, 2011).
41 Bry and Boschan (1971). See Schlitzer (1991) for the difference between the concept of “growth cycle” and “classical cycle”. 42 Laszlo, 2004.
ISTAT WORKING PAPERS N. 23/2015
ISTITUTO NAZIONALE DI STATISTICA 17
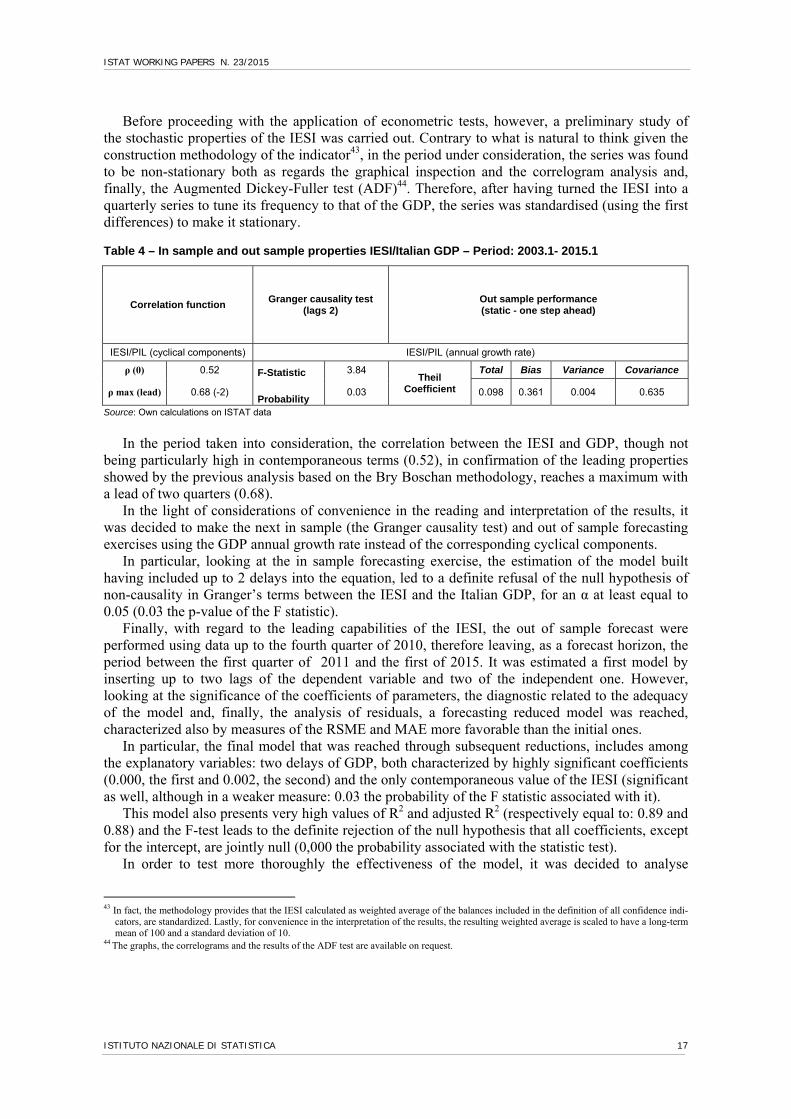
Before proceeding with the application of econometric tests, however, a preliminary study of the stochastic properties of the IESI was carried out. Contrary to what is natural to think given the construction methodology of the indicator43, in the period under consideration, the series was found to be non-stationary both as regards the graphical inspection and the correlogram analysis and, finally, the Augmented Dickey-Fuller test (ADF)44. Therefore, after having turned the IESI into a quarterly series to tune its frequency to that of the GDP, the series was standardised (using the first differences) to make it stationary. Table 4 – In sample and out sample properties IESI/Italian GDP – Period: 2003.1- 2015.1
Correlation function Granger causality test
(lags 2) Out sample performance (static - one step ahead)
IESI/PIL (cyclical components) IESI/PIL (annual growth rate)
ρ (0) 0.52 F-Statistic 3.84 Theil
Coefficient
Total Bias Variance Covariance
ρ max (lead) 0.68 (-2) Probability
0.03 0.098 0.361 0.004 0.635
Source: Own calculations on ISTAT data
In the period taken into consideration, the correlation between the IESI and GDP, though not
being particularly high in contemporaneous terms (0.52), in confirmation of the leading properties showed by the previous analysis based on the Bry Boschan methodology, reaches a maximum with a lead of two quarters (0.68).
In the light of considerations of convenience in the reading and interpretation of the results, it was decided to make the next in sample (the Granger causality test) and out of sample forecasting exercises using the GDP annual growth rate instead of the corresponding cyclical components.
In particular, looking at the in sample forecasting exercise, the estimation of the model built having included up to 2 delays into the equation, led to a definite refusal of the null hypothesis of non-causality in Granger’s terms between the IESI and the Italian GDP, for an α at least equal to 0.05 (0.03 the p-value of the F statistic).
Finally, with regard to the leading capabilities of the IESI, the out of sample forecast were performed using data up to the fourth quarter of 2010, therefore leaving, as a forecast horizon, the period between the first quarter of 2011 and the first of 2015. It was estimated a first model by inserting up to two lags of the dependent variable and two of the independent one. However, looking at the significance of the coefficients of parameters, the diagnostic related to the adequacy of the model and, finally, the analysis of residuals, a forecasting reduced model was reached, characterized also by measures of the RSME and MAE more favorable than the initial ones.
In particular, the final model that was reached through subsequent reductions, includes among the explanatory variables: two delays of GDP, both characterized by highly significant coefficients (0.000, the first and 0.002, the second) and the only contemporaneous value of the IESI (significant as well, although in a weaker measure: 0.03 the probability of the F statistic associated with it).
This model also presents very high values of R2 and adjusted R2 (respectively equal to: 0.89 and 0.88) and the F-test leads to the definite rejection of the null hypothesis that all coefficients, except for the intercept, are jointly null (0,000 the probability associated with the statistic test).
In order to test more thoroughly the effectiveness of the model, it was decided to analyse
43 In fact, the methodology provides that the IESI calculated as weighted average of the balances included in the definition of all confidence indi-
cators, are standardized. Lastly, for convenience in the interpretation of the results, the resulting weighted average is scaled to have a long-term mean of 100 and a standard deviation of 10.
44 The graphs, the correlograms and the results of the ADF test are available on request.
THE REVISED ISTAT ECONOMIC SENTIMENT INDICATOR
18 ISTITUTO NAZIONALE DI STATISTICA
residuals to test the absence of heteroskedasticity and of serial correlation. The presence of heteroskedasticity has been verified by resorting, in particular, to the Breush-Pagan-Godfrey test; the serial correlation was instead tested using the LM test45.
The results obtained seem to be encouraging in both cases. In the first one, the p-value associated with the test statistic, equal to 0.15, leads us to accept the null hypothesis of the presence of homoskedasticity between the residuals; in the second case, the p-value of the F statistic is equal to 0.088 and induce us to think that there is no serial correlation between the residuals (for α=0.05).
Having established the soundness of the forecasting model for out of sample estimates, the quite good leading capabilities of the IESI indicator are confirmed by the outcome of the Theil test. The latter, in fact, shows a good capacity of estimated values to approach real ones (0.098). Looking also at the proportions in which the coefficient is broken down into, the bias, indicative of the presence of systematic error, is equal to 0.36, while the covariance, the highest of among the three proportions, is equal to 0.6346.
After doing all the necessary analysis to verify the forecasting cability of the indicator calculated by ISTAT, the predictive performance of the IESI was compared with that of the same ESI indicator drawn up for Italy by the European Commission. To this end, naturally taking into account the same time span, in addition to the analysis of temporal coherence, all of the statistical and econometric tests already applied to the IESI are repeated by inserting into the equations the values of the time series of the ESI.
As for the analysis of time consistency, the methodology used for the analysis of the turning points47 does not allow one to achieve for the ESI indicator a maximum point corresponding to the beginning of the reference period. However, the leading characteristics of the ESI appear more pronounced compared to those detected in the case of IESI and that looking, in particular, at the average anticipation of the positive points of the cycle (-4).
Compared to that calculated for the IESI, the value of directional coherence appears to be higher (0.68 compared to 0.64) (Table 5).
45 Breusch, Pagan (1979). 46 Following an approach now widely used in operational practice, the ability of the IESI to predict the growth rate of GDP in the short term was
also tested, resorting to the use of a model bridge (Baffigi, Golinelli, Parigi, 2004; Golinelli, Parigi, 2005; Sédillot, Pain, 2003). For this pur-pose an attempt was made to include in the equation to estimate not only the lagged values of IESI but also lagged values of the index of indus-trial production (expressed in terms of trend changes). Applying a reduction process to the general model (having added up to two lags of the dependent variable, the IESI and IPI) gave a reduced equation in which the trend in changes in GDP is explained by the first lag of the depend-ent variable, the contemporary value of IESI, the contemporary value and the first delay of the IPI. The model, though presenting all the highly significant coefficients (with the exception of that relating to the contemporary value of IESI, significant only at 10%), an R2 and an adjusted R2 that are very good (respectively 0.98 and 0.97), the values of MAE and RMSE respectively equal to 0.0036 and 0.0028, fails the test of heteroskedasticity of the residuals.
47 See the methodological approach used previously to compare the cyclical trend of the IESI with the cyclical component of GDP.
ISTAT WORKING PAPERS N. 23/2015
ISTITUTO NAZIONALE DI STATISTICA 19
Table 5 – Turning points and directional coherence ESI/ Italian GDP – Period: 2003.1- 2015.1
Bry-Boschan Routine PIL (Cyclical components) ESI
Number of cycles 2 2
Average duration (from trough to trough) 16.0 14.5
Average lengh of an expansion 10.0 6.0
Average lengh of a recession 5.0 8.5
Tourning points
Peak 2004q2 /
Trough 2005q1 2005q2
Peak 2008q1 2006q3
Trough 2009q2 2009q1
Peak 2011q2 2010q4
Trough 2013q1 2012q3
Mean lead (-) /lag (+) at turning points
Total / ‐2.0
Upturns / ‐0.7
downturns / ‐4.0
Directional coherence 0.68
Source: Own calculations on ISTAT data
The cross-correlation coefficient between ESI and the cyclical components of GDP, the test results of Granger causality and the Theil index for the new estimated models are presented in table 6.
Table 6 – In sample and out sample properties ESI/Italian GDP – Period: 2003.1- 2015.1
FUNZIONE DI CORRELAZIONE
TEST CAUSALITA’ DI GRANGER (2 ritardi)
PREVISIONE OUT SAMPLE (statica - 1 passo avanti)
ESI/PIL (Componenti cicliche) ESI/ PIL (Tasso di variazione tendenziale)
ρ (0) 0,56 Statistica F 2,56 THEIL
Totale Bias Varianza Covarianza
ρmax (lead) 0,73 (-2) Probabilità 0,090 0,175 0,075 0,103 0,822
Source: Own calculations on ISTAT data
In this case, despite being higher than the results obtained with the IESI, the contemporary and lead correlation coefficients, the Granger causality test provides rather uncertain indications about the hypothesis that the ESI will not cause the GDP. The p-value of the F statistic falls, in fact, near the area of rejection, possibly leading one to accept the null hypothesis at best at a significance level of 10%.
As for the out of sample forecast, the model was estimated using data up to the fourth quarter of 2010. Proceeding from the unreduced specification used for the exercise of Granger causality the steps of successive eliminations led to the model that includes the first GDP lag, the contemporary value of the ESI and the first ESI lag. The coefficients of the parameters appear to be all highly significant (the first 0.000, 0.001 and 0.002 the second and the third) and the R2 and the adjusted R2 very high (equal to, respectively, 0.92 and 0.91). The soundness of the model appears finally confirmed by the outcome of the analysis of residuals that are in fact homoskedastic and not serially correlated (the F statistic associated with the Breusch-Pagan-Godfrey test for verification of the heteroskedasticity has a p-value equal to 0.72 and that associated with the LM test for serial correlation equal to 0.51).
As a conclusive act of the analysis, with the dual aim, firstly, to verify the actual contribution that IESI has in out of sample forecast of GDP and, secondly, to compare this contribution to that
THE REVISED ISTAT ECONOMIC SENTIMENT INDICATOR
20 ISTITUTO NAZIONALE DI STATISTICA
made instead by the analogous ESI, the forecasting properties of the model containing the IESI were compared with those of the model that contains within it the values of the indicator prepared by the European Commission. The autoregressive model that explains the evolution of GDP simply on the basis of its past dynamics is used, finally, as a benchmark.
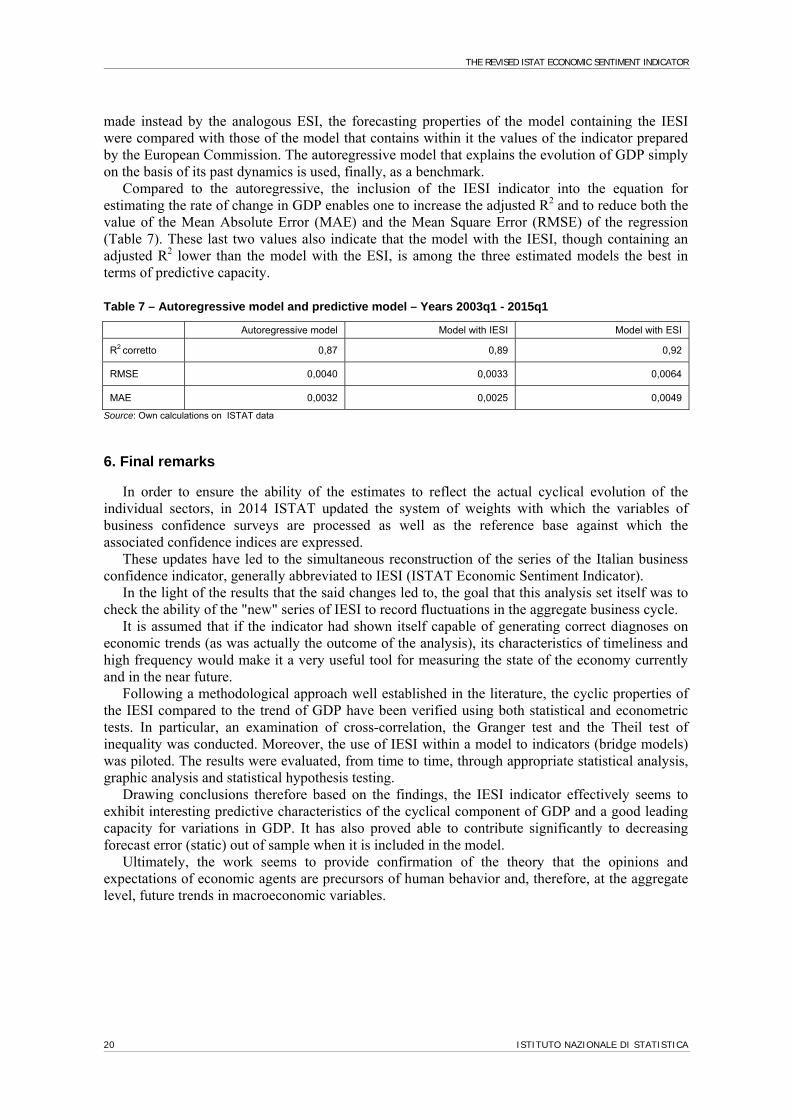
Compared to the autoregressive, the inclusion of the IESI indicator into the equation for estimating the rate of change in GDP enables one to increase the adjusted R2 and to reduce both the value of the Mean Absolute Error (MAE) and the Mean Square Error (RMSE) of the regression (Table 7). These last two values also indicate that the model with the IESI, though containing an adjusted R2 lower than the model with the ESI, is among the three estimated models the best in terms of predictive capacity.
Table 7 – Autoregressive model and predictive model – Years 2003q1 - 2015q1
Autoregressive model Model with IESI Model with ESI
R2 corretto 0,87 0,89 0,92
RMSE 0,0040 0,0033 0,0064
MAE 0,0032 0,0025 0,0049
Source: Own calculations on ISTAT data
6. Final remarks
In order to ensure the ability of the estimates to reflect the actual cyclical evolution of the individual sectors, in 2014 ISTAT updated the system of weights with which the variables of business confidence surveys are processed as well as the reference base against which the associated confidence indices are expressed.
These updates have led to the simultaneous reconstruction of the series of the Italian business confidence indicator, generally abbreviated to IESI (ISTAT Economic Sentiment Indicator).
In the light of the results that the said changes led to, the goal that this analysis set itself was to check the ability of the "new" series of IESI to record fluctuations in the aggregate business cycle.
It is assumed that if the indicator had shown itself capable of generating correct diagnoses on economic trends (as was actually the outcome of the analysis), its characteristics of timeliness and high frequency would make it a very useful tool for measuring the state of the economy currently and in the near future.
Following a methodological approach well established in the literature, the cyclic properties of the IESI compared to the trend of GDP have been verified using both statistical and econometric tests. In particular, an examination of cross-correlation, the Granger test and the Theil test of inequality was conducted. Moreover, the use of IESI within a model to indicators (bridge models) was piloted. The results were evaluated, from time to time, through appropriate statistical analysis, graphic analysis and statistical hypothesis testing.
Drawing conclusions therefore based on the findings, the IESI indicator effectively seems to exhibit interesting predictive characteristics of the cyclical component of GDP and a good leading capacity for variations in GDP. It has also proved able to contribute significantly to decreasing forecast error (static) out of sample when it is included in the model.
Ultimately, the work seems to provide confirmation of the theory that the opinions and expectations of economic agents are precursors of human behavior and, therefore, at the aggregate level, future trends in macroeconomic variables.
ISTAT WORKING PAPERS N. 23/2015
ISTITUTO NAZIONALE DI STATISTICA 21
References
Altissimo, F., D.J. Marchetti, G.P. Oneto. 1999. The Italian Business Cycle: New Coincident and Leading Indicators and Some Stylized Facts. Documento di Lavoro. ISAE n.8
Altissimo, F., Bassanetti, A., Cristadoro, R., Forni, M., Hallin, M., Lippi, M., Reichlin,L. and Veronese, G. (2001). A real Time Coincident Indicator for the euro area Business Cycle. CEPR Discussion Paper No. 3108. Altissimo, F., R. Cristadoro, M. Forni, M. Lippi e G. Veronese. 2007. New Eurocoin: Tracking
economic growth in real time. Banca d’Italia. Working Paper, 631, June.
Bachmann, R., S. Elstner, , Sims, E.R. 2010. Uncertainty and Economic Activity: Evidence from
Business Survey Data. NBER Working Paper, 16143.
Baffigi, A., A. Bassanetti. 2004. Turning-points indicators from business surveys: real-time detection for the euro area and its major member countries. Banca d’Italia. Temi di Discussione, 500, June.
Baffigi, A., R. Golinelli, G. Parigi. 2004. Bridge Models to forecast the euro area GDP. International Journal of Forecasting. Volume 20.
Bardaji, J., C. Minodier, L. Clavel, F. Tallet. 2008. Deux nouveaux indicateurs pour aider au diagnostic conjoncturel en France, INSEE, Note de conjoncture, Decembre.
Batchelor, R., P. Dua. 1998. Improving Macro-Economic Forecasts: The Role of Consumer Confidence. International Journal of Forecasting. 14(1): 71-81.
Bernardelli, M. 2014. The Procedure of Business Cycle Turning Points Identification Based on Hidden Markov Models. Paper presented at the 32nd CIRET Conference, 9-11 October, Hangzhou, P.R. China.
Breusch, T.S., A.R. Pagan. 1979. A Simple Test for Heteroscedasticy and Random Ceofficient Variation. Econometrica 47(5): 1287-1294.
Bry, G., C. Boschan. 1971. Cyclical Analysis of the Time Series: Selected Procedures and Computer Programs. NBER. Technical papers, 20.
Carnazza, P., G. Parigi. 2000. Towards the Elaboration of Business Climate Indicators for the Italian Economy. Paper presented at the 25th Ciret Conference, 10-14 October, Paris.
Carrol, C.D. 1992. The Buffer-Stock Theory of Saving: Some Macroeconomic Evidence. Brookings Papers on Economic Activity. Vol.2: 61-156.
Carrol, C.D., J. Fuhrer, D. Wilcox. 1994. Does Consumer sentiment forecast household spending? If so, why? American Economic Review. N° 84: 1397-1408.
CE. 1997. The Joint Harmonised EU Programme of Business and Consumer Surveys, European Economy, Reports and Studies N°6, Bruxelles.
CE. 2001. New Economic Sentiment Indicator, European Economy, Supplement B, Business and Consumer Survey Results, No 8/9 August/September.
Christian, G. 2005. Forecast Evaluation of European Commission Survey Indicators, OECD, CIRET, Journal of Business Cycle Measurement and Analysis JBCMA, 2, Issue 2: 157-184. Christiano, L.J., T.J. Fitzgerald. 1999. The band pass filter. NBER. Working paper W7257.
Cozzi, T. (a cura di). 2006. Teoria generale dell'occupazione, dell'interesse e della moneta. Keynes, J.M. Torino, UTET: p. 344.
Crosilla, L., S. Leproux. 2007. Leading indicators on construction and retail trade sectors based on ISAE survey data. ISAE, Working paper 77.
Deaton, A.S. 1992. Understanding Consumption. Oxford University Press. New York.
THE REVISED ISTAT ECONOMIC SENTIMENT INDICATOR
22 ISTITUTO NAZIONALE DI STATISTICA
European Business Cycle Indicators’ – Economic and Financial Affairs Directorate-General Directorate A – Policy strategy, coordination and communication Unit A4 – Forecasts and economic situation – March 2012.
European Commission. 2007. A User Manual to the Joint Harmonised EU Programme of Business and Consumer surveys. Methodological User guide. Brussels: Directorate-General for Economic and Financial Affairs.
Federal Reserve Consultant Committee on Consumer Survey Statistics. 1955. Smithies Committee Report in: Reports of the Federal Reserve Consultant Committee on Consumer Survey Statistics, Hearings of the Subcommittee on Economic Statistics of the Joint Committee on the Economic Report. 84th US Congress.
Flavin, M. 1981. The Adijustment of Consumption to Changing Expectations about Future Income. Journal of Political Economy. Vol. 89: 974-1009.
Garner, C. A. 1991. Forecasting Consumer Spending: Should Economists Pay Attention to Consumer Confidence Surveys? Economic Review (Federal Reserve Bank of Kansas City). N° 5-6: 57-68.
Gayer, C., J. Genet. 2006. Using factor models to construct composite indicators from BCS data - A comparison with European Commission confidence indicators. European Economy. Economic Papers. N° 240.
Gelper, S., C. Croux. 2010. On the construction of the european economic sentiment indicator, Oxford Bulletin of Economics and Statistics, 72 (1): 47-62.
Golinelli, R., G. Parigi. 2004. Consumer Sentiment and Economic Activity: A cross-country Analysis. Journal of Business and Cycle Measurement and Analysis. Vol.1, n°2:147-170.
Gomez, V., A. Maravall. 2000. Seasonal adjustment interface Demetra for Tramo/Seats and X-12- ARIMA. User manual vers. 1.4, EUROSTAT.
Grégoir, S., F. Lenglart. 2000. Measuring the Probability of a Business Cycle Turning Point by Using a Multivariate Qualitative Hidden Markov Model. Journal of Forecasting, 19(2): 81-102.
Harding D., A. Pagan. 2002. A comparison of two business cycle dating methods, Journal of Economic dynamics and control. Elsevier, 27 (9): 1681-1690, July.
Hodrick R.J., E.C. Prescott. 1980. Postwar U.S. business cycles: an empirical investigation. Carnegie-Mellon University. Discussion paper, 451.
Howrey, E. P. 2001. The Predictive Power of the Index of Consumer Sentiment. Brookings Papers on Economic Activity. N°1:175-216.
Hymans, S.H. 1970. Consumer Durables Spending: Explanation and Prediction. Brookings Papers on Economic Activity, 2:173-199.
INSEE (2008). Deux nouveaux indicateurs pour aider au diagnostic conjoncturel en France. Note de conjuncture de dècember.
ISTAT (2000). Guida all’utilizzo di Tramo-Seats per la destagionalizzazione delle serie storiche. Documenti Istat No 4.
ISTAT (2015). Indagini sul clima di fiducia delle imprese. Le nuove serie in base 2010=100, Nota informativa. Marzo.
Katona, G. 1951. Psychological Analysis of Economic Behaviour. New York. Mac Graw Hill.
Katona, G. 1960. The Powerful consumer. Psychological Studies of the American Economy. New York. Mac Graw Hill.
Katona, G. 1964. The Mass Consumption Society. New York. Mac Graw Hill.
Katona, G. 1975. Psychological Economics. New York. Elsevier Scientific Publishing.
Koopmans, T.C. 1965. Measurement without Theory. Readings in Business Cycles. Vol.10. Homewood, III:186 and following.
ISTAT WORKING PAPERS N. 23/2015
ISTITUTO NAZIONALE DI STATISTICA 23
Laszlo, K. 2004. Unit-root, cointegration and Granger causality test results for export and growth in OECD Countries. International Journal of Applied Econometrics and Quantitative Studies. Vol. 1-2.
Leeper, E. M. 1992. Consumer Attitudes: King for a Day. Economic Review (Federal Reserve Bank of Atlanta). Jul/Aug: 1-15.
Leproux, S., M. Malgarini. 2006. Clima di fiducia delle famiglie in Italia: un’analisi disaggregata secondo il reddito degli intervistati. ISAE. Documento di lavoro. N°65. Roma.
Locarno A., G. Parigi. 1997. Clima di Fiducia e Consumi delle Famiglie: Movente Economico o Psicologico? Ricerche Quantitative per la Politica Economica. Banca d’Italia. Roma. Vol. II.
Lovell M. C. 1975. Why Was the Consumer Feeling so Bad? Brookings Papers on Economic Activity. N° 2: 473-479.
Lucas, R. 1972. Expectations and the Neutrality of Money. Journal of Economic Theory. Vol. 4:103-l24.
Lucas, R. 1973. Some International Evidence on Output-Inflation Tradeoffs. The American Economic Review. Vol. 63, 3:326-334.
Ludvigson, S.C., A. Michaelides. 2001. Does Buffer-Stock Saving Explain the Smoothness and Excess Sensitività of Consumption? The American Economic Review. Vol.91(3): 631-647.
Marcellino, M. 2006. Dynamic factor models for survey-based confidence indicators. Final Report. European Commission.
Mishkin F.S. 1978. Consumer Sentiment and Spending on Durable Goods. Brookings Papers on Economic Activity. Vol.1: 217-232.
Moore, G.H., J. Shiskin. 1967. Indicators of business expansions and contractions. UMI.
Nilsson, R., G. Gyomai. 2011. Cycle Extraction: a comparison of the phase-Avearge trend method, the Hodrick-Prescott and Christiano-Fitzgerald filters, OECD, Statistic Directorate, Working paper No 39.
OECD. 1987. OECD leading indicators and business cycles in member countries, sources and methods 1960-1985, NO-39
OECD. 1997. Cyclical indicators and business tendency surveys. OECD/GD/(97) 58, General Distribution.
OECD. 2007. Current Period Performance of OECD Composite Leading Indicators (CLIs). Revision Analysis of CLIs for OECD Member Countries. OECD Statistics Working Paper.
OECD. 2012. System of Composite Leading Indicators. April.
Parigi, G.,G. Schlitzer. 1995. Quarterly forecasts of the italian business cycle by means of monthly economic indicators. Journal of forecasting, 14.
Schlitzer, G. 1993. Nuovi strumenti per la valutazione e la previsione del ciclo economico in Italia. Temi di discussione del Servizio studi della Banca d’Italia, 200.
Schlitzer, G. 1995. Business cycles in Italy: a statistical investigation. European journal of political economy, II.
Sédillot, F., N. Pain. 2003. Indicator Models or Real GDP Growth in Selected OECD Countries. Economics Department Working Papers n. 364. OECD.
Shapiro H.T. 1972. The Index of Consumer Sentiment and Economic Forecasting: a Reappraisal. In B. Strumpfel, J. N. Morgan and E. Zahn (eds): Human Behaviour in Economic Affairs: Essay in Honor of Giorge Katona. New York. Elsevier Scientific Publishing.
Silgoner, M.A. 2007. The economic sentiment indicator: leading indicator properties in old and New EU Member States. Journal of business cycle measurement and analysis, 3 (2).
THE REVISED ISTAT ECONOMIC SENTIMENT INDICATOR
24 ISTITUTO NAZIONALE DI STATISTICA
Silgoner, M.A. 2006. An Overview of European Economic Indicators. Great Variety of Data on the Euro Area, Need for more Extensive Coverage of the New EU Member States. 28th CIRET Conference, Rome.
Souleles, N. 2004. Expectations, Heterogeneous Forecast Errors, and Consumption: Micro Evidence from the Michigan Consumer Sentiment Surveys. Journal of Money, Credit and Banking. Vol.36(1): 39-72.
Wilcox, D.W. 1989. Social Security Benefits, Consumption Expenditure and the Life Cycle Hypothesis. Journal of Political Economy. 97(2): 288-304. April.
Zani, S. 1982. Indicatori statistici della congiuntura. Loescher Editore