Embed Size (px)
Citation preview

IMPORTANT DISCLOSURES AND ANALYST CERTIFICATIONS ARE IN THE DISCLOSURE APPENDIX. U.S. Disclosure: UNLU Menkul Degerler A.S. ("UNLU & Co") does and seeks to do business with companies covered in its research reports. As a result, investors should be aware that the Firm may have a conflict of interest that could affect the objectivity of this report. Investors should not consider this report as the only factor in making their investment decision. U.S. investors transacting in the securities featured or mentioned in this research report must deal directly through a U.S. Registered broker-dealer.
Eq
uit
y R
esea
rch
| T
urke
y | T
urki
sh D
aily
21 March 2017
Istanbul Calling
Event Diary:
23 March – Consumer Confidence Index (March) 27 March – Real Sector Confidence Index (March) 31 March – Foreign Trade Balance (February) 31 March – GDP Growth Rate (4Q16)
Sector and Company News:
Akbank employees postpone their strike action by 60 days Strongest ever domestic white goods demand recorded in February Arcelik eyes further international expansion One of Tekfen Holding’s minority shareholders registers 1.2m Tekfen
shares Turkish automotive sector’s exports increase by 18% y/y in February
Politics and Economy:
Moody’s cuts Turkish banks’ outlook to negative Companies which have been transferred to Turkish Sovereign Wealth Fund
are to be restructured
Research team
Vedat Mizrahi, PhD [email protected]
Can Ozguzel [email protected]
Can Oztoprak [email protected]
Emir Moran [email protected]
Esra Simsek [email protected]
Mete Ozbek [email protected]
Muharrem Gulsever [email protected]
M. Sinan Veziroglu [email protected]
Market snapshot
BIST indices Close Change Vol.($m)
BIST 30 111,133 0.26% 774
BIST 100 90,491 0.25% 1,131
BIST 30 futures Settl. Change Vol.($m)
April 111.300 0.63% 312.78
June 112.050 0.65% 3.24
BIST 30 top gainers Daily (TL) Vol.($m)
DOHOL 2.94% 2.28
TAVHL 2.80% 17.97
ULKER 2.24% 9.54
BIST 30 top losers Daily (TL) Vol.($m)
EKGYO -2.23% 39.57
PETKM -2.04% 37.48
PGSUS -1.09% 6.47
Global equity markets performance
Emerging markets Daily 3M Ytd
BIST 100 0.2% 16.6% 15.8%
MSCI EM 0.7% 14.2% 12.8%
Hang Seng 0.2% 12.5% 11.6%
Brasil-Bovespa 1.1% 13.6% 8.5%
Russia-MICEX 0.3% -7.8% -6.4%
India-Sensex 30 -0.1% 11.9% 10.8%
China-Shangai 0.2% 4.5% 5.0%
S. Africa-JSE 0.4% 5.8% 4.1%
Developed markets
Dow Jones 0.0% 5.1% 5.8%
S&P 500 -0.2% 4.9% 6.0%
FTSE 100 0.1% 5.9% 4.0%
Euro Stoxx 50 Pr -0.3% 5.5% 4.5%
DAX -0.4% 5.5% 5.3%
CAC 40 -0.3% 3.9% 3.1%
IBEX -0.3% 9.4% 9.2%
Nikkei -0.4% 0.3% 1.8%
Commodities
* futures Price Daily Ytd
Brent ($/bbl)* 51.6 -0.3% -9.2%
Gold ($/oz) 1,234 0.3% 7.1%
Silver ($/t oz) 17 0.1% 8.7%
Copper ($/lb) 272 -0.3% 7.8%
Fixed income and currency
Foreign exchange rates Price Daily Ytd
USD/TL 3.6123 -1.79% 2.46%
EUR/USD 1.0780 0.40% 2.10%
TL basket 3.7532 -0.69% 2.28%
Interest rates Yield Change Vol.($m)
Policy rate (sa) 8.00%
Benchmark (11-Jul-18) 11.6% 0.6% 1.38
Eurobonds Price Yield Spread
TR (15-Jan-30) 154.35 5.8% 3.3%
US (10-year) 2.5% 0.0%
Source: Rasyonet, Bloomberg

2Equity Research
Sector and Company News Akbank employees postpone their strike action by 60 days: According to an official announcement by Akbank, The Bank and Insurance Employees Union ("BANKSIS") decided to postpone its previously taken strike action for 60 days. Recall that it previously announced that an agreement could not be reached in the mediation phase with regards to the negotiations for the collective bargaining agreement between Akbank and BANKSIS. We do not expect any impact on the share price performance following this disclosure.
Strongest ever domestic white goods demand recorded in February: According to the White Goods Manufacturers’ Association data, domestic white goods sales volume in February reached almost 700k units, which implies a 42% y/y growth. We were expecting a 20% y/y growth in the wholesale volumes considering the inventory build-up at the retail channel in January. Therefore, Actual demand in February was much stronger than our estimate of 600k units. On a seasonally adjusted basis, February sales imply an annual volume of 10.4m units, which is the highest ever level. Although February trading update is a clear upside risk to our current full year estimates, we would wait until the end of the SCT incentive period, (end-April) as we believe that there is a significant pulled-forward demand in the market. Yet, our current full year growth estimate of 5% is ahead of Arcelik’s official guidance of 3%. Exports volume growth on the other hand was around 1%, in line with our estimates. Note that the deceleration in the UK market since 4Q16 would put a pressure on the international sales.
Arcelik eyes further international expansion: According to an interview with Arcelik’s CEO on daily Dunya, management explores new acquisition targets mainly in Asia. Key countries on Arcelik’s radar are Indonesia, Vietnam, Philippines, Bangladesh and India. We recall that the company invested in a production facility in Thailand and acquired Dawlance in Pakistan in the last two years. Arcelik generated 60% of its revenues from its international operations in 2016 and we expect international revenue share in 2017 to reach 65% after the consolidation of Dawlance, Arcelik’s CEO targets as much as 80% for international revenue share in the long-term. Although we have a hold rating on Arcelik, we argue that risks are clearly on the upside as we cannot incorporate the impact of a new M&A into our price target.
One of Tekfen Holding’s minority shareholders registers 1.2m Tekfen shares: According to official KAP disclosure, Habibe Bukay Unlusoy registered 1.2m Tekfen shares to sell in the market. This corresponds to 0.3% of the company’s paid-in capital. Ms Unlusoy is the wife of one the company’s previous CEOs. Given the size is rather small, we do not expect this to create a sizable overhang.
Turkish automotive sector’s exports increase by 18% y/y in February: According to the Automotive Manufacturing Association, the export volumes of Turkish automotive sector increased by 18% y/y in February to 116k units, driven by passenger cars (36% y/y) while LCV exports contracted by 12% y/y. The strong growth in February is a factor of new model launches by Tofas, Oyak Renualt and Toyota. Among listed players, Ford Otosan’s exports declined by 7% y/y to 23k units, bringing the YTD growth to 1% y/y. On the other hand, Tofas’ exports increased by 31% y/y in February to 30k units – the highest monthly export figure for Tofas (YTD growth at 33%). For the full year, we expect export units of Ford Otosan to increase by 7% y/y in 2017 vs. 21% y/y growth in Tofas thanks to the first full year production of Egea family.
Politics and Economy Moody’s cuts Turkish banks’ outlook to negative: The rating agency announced that it cut 14 Turkish banks’ (including the 6 Tier-I banks in our coverage) outlook to negative, from stable. This followed Moody’s announcement on Friday when it cut its outlook on Turkey’s rating to negative from stable. The next credit review on Turkey will be on 5 May by S&P followed by Fitch on 21 July.
Companies which have been transferred to Turkish Sovereign Wealth Fund are to be restructured: According to Dunya News, Turkey's Sovereign Wealth Fund is to launch a new project that will restructure the companies transferred to the fund, excluding Halkbank and Ziraat Bank. The restructuring reportedly aims at boosting the functionality, effectiveness and the transparency of the companies. In this context, Turksat’s retail services (internet, TV etc.) will be distinguished from its satellite management services, and the mining and boron production branches of ETI Mine Works will be restructured. The restructuring of Botas will be handled as a long-term project with the sale of contracts, which have been in force for a long time, and the plans for its transmission network to be managed separately. The total value of the assets transferred to the fund hovers around USD160bn, as announced by Undersecretary of the Treasury Osman Celik. The fund management, however, has not released any official data on the value of the SWF.

3Equity Research
Figure 1: Buyback Activities
Source: Public Disclosure Platform
Ticker CompanyBuyback
announcement dateBuyback status
Maximum number of shares for
buyback
Maximum funds to allocate
(TL)Total buyback (shares) Total amount paid (TL)
Shareholder
Activity (number of
shares)
ALBRK Albaraka 13-Jan-16 Approved No further information No further information 3,004,740 4,058,002 -
BIMAS BIM 16-Mar-17 Terminated No further information 300,000,000 1,223,961 61,116,862 -
DOAS Dogus Otomotiv 27-Jul-16 Approved 22,000,000 524,000,000 22,000,000 220,161,803 128,130
EKGYO Emlak GYO 07-Jan-16 Approved 259,929,138 1,039,716,552 No buyback yet No buyback yet -
ENKAI ENKA Insaat 25-Jul-16 Approved 4,200,000 60,000,000 8,400,000 37,806,975 741,389
KRDMD Kardemir 15-Dec-16 Approved No further information 50,000,000 550,000 698,200 -
TKFEN Tekfen 03-Mar-16 Terminated 10% of paid in capital 222,000,000 No buyback yet No buyback yet -
THYAO Turkish Airlines 04-Apr-16 Approved No further information No further information No buyback yet No buyback yet -
TCELL Turkcell 22-Jul-16 Approved No further information 300,000,000 6,521,923 62,856,999 -
ULKER Ülker Bisküvi - - - - - - 3,939,697
BIZIM Bizim Toptan 09-Mar-17 Approved No further information 40,000,000 138,000 1,637,967 324,980
ACSEL Aciselsan 22-Jul-16 Approved 150,000 600,000 20,450 74,602 -
AKFGY Akfen GYO 24-May-16 Approved 10% of paid in capital 41,950,000 2,284,000 3,174,533 -
AKSA Aksa Akrilik 22-Jul-16 Approved 1,000,000,000 60,000,000 No buyback yet No buyback yet -
ARSAN Arsan Tekstil 22-Jul-16 Approved No limitation No limitation 1,896,388 2,515,254 -
ATLAS Atlas Menkul Kıymetler 21-Jul-16 Approved 1,000,000 800,000 605,720 486,696 -
AVOD Avod Kurutulmus Gida 22-Jul-16 Approved 2,000,000 2,500,000 266,600 299,391 -
AVGYO Avrasya GYO 21-Jul-16 Approved 3,600,000 3,000,000 223,161 920,440 -
AVTUR Avrasya Petrol 21-Jul-16 Approved 2,250,000 3,200,000 No buyback yet No buyback yet -
BAKAB Bak Ambalaj 28-Jul-16 Terminated 500,000 1,250,000 437,424 1,108,142 -
BAKAN Bakanlar Medya 22-Jul-16 Approved 400,000 500,000 48,804 70,027 -
BNTAS Bantas Bandirma Ambalaj 25-Jul-16 Approved 500,000 500,000 No buyback yet No buyback yet -
BTCIM Baticim Bati Anadolu Cimento 01-Aug-16 Approved 80,000,000 5,000,000 23,557 147,065 -
BSOKE Batisoke Cimento 01-Aug-16 Approved 78,750,000 1,700,000 30,682 65,954 -
BLCYT Bilici Yatirim 01-Aug-16 Approved 3,500,000 9,000,000 1,935,188 2,212,613 -
BRYAT Borusan Yatırım 22-Jul-16 Approved 1,700,000 40,000,000 256,971 7,748,780 -
CRDFA Credit West 29-Jul-16 Rejected No further information No further information No buyback yet No buyback yet -
DAGI Dagi Giyim 25-Jul-16 Terminated 1,500,000 2,500,000 1,300,000 1,837,205 -
DAGHL Dagi Yatırım Holding 25-Jul-16 Terminated 2,500,000 3,500,000 1,551,500 2,383,133 -
DGATE Datagate Bilgisayar Malzemeleri 21-Jul-16 Approved No further information 5,000,000 23,713 213,055 -
DENGE Denge Yatırım Holding 22-Jul-16 Terminated 500,000 1,000,000 450,000 959,405 -
DOHOL Dogan Holding 01-Dec-16 Approved No further information 5,200,000 3,200,000 2,080,000 -
EMKEL Emek Elektrik 06-Sep-16 Approved 5,000,000 5,000,000 1,268,699 1,649,972 -
GEDZA Gediz Ambalaj 01-Aug-16 Approved 100,000 800,000 13,956 81,758 -
GEREL Gersan Elektrik 22-Feb-16 Approved 2,000,000 6,800,000 974,904 1,739,656 -
GSDDE GSD Denizcilik Gayrimenkul 22-Jul-16 Approved 5,218,000 5,000,000 2,815,000 2,601,430 -
GSDHO GSD Holding 22-Jul-16 Approved 25,000,000 40,000,000 20,550,000 19,135,498 -
GLRYH Guler Yatirim Holding 22-Jul-16 Approved 500,000 500,000 No buyback yet No buyback yet -
HDFGS Hedef Girisim Sermayesi 25-Jul-16 Pending 800,000 1,000,000 No buyback yet No buyback yet -
IDGYO Idealist GYO 01-Aug-16 Approved 400,000 500,000 107,720 141,437 -
IZFAS Izmir Fırca 26-Jul-16 Approved 400,000 500,000 154,398 197,239 -
KATMR Katmerciler Araç Üstü Ekipman 22-Jul-16 Approved 1,000,000 7,000,000 189,109 1,223,271 -
KRSTL Kristal Kola 25-Jul-16 Approved 4,000,000 6,000,000 2,621,133 3,412,827 -
LKMNH Lokman Hekim 29-Mar-15 Approved 10% of paid in capital No further information 973,260 2,414,676 -
MEPET Mepet Metro Petrol 21-Jul-16 Approved 3,750,000 7,900,000 No buyback yet No buyback yet -
METRP Metro Holding 21-Jul-16 Approved 15,000,000 8,400,000 No buyback yet No buyback yet -
NTHOL Net Holding 22-Jul-16 Approved 48,500,000 150,000,000 44,308,731 128,817,931 -
NTTUR Net Turizm 22-Jul-16 Approved 11,000,000 15,000,000 217,777 261,001 -
OSTIM Ostim 22-Jul-16 Approved 1,000,000 2,500,000 No buyback yet No buyback yet -
OYLUM Oylum Sinai Yatırımlar 25-Jul-16 Approved No limitation No limitation No buyback yet No buyback yet -
OZKGY Ozak GYO 25-Nov-16 Approved 3,000,000 6,000,000 88,560 157,051 -
OZGYO Ozderici Gayrimenkul 26-Jul-16 Approved 1,000,000 1,500,000 No buyback yet No buyback yet -
PIMAS Pimas Plastik Insaat Malzemeleri 29-Sep-16 Approved No further information 3,200,000 320,867 824,675 -
PSDTC Pergamon Status 25-Jul-16 Approved 300,000 1,000,000 8,100 -55,283 -
PRZMA Prizma Pres Matbaacılık 22-Jul-16 Approved 750,000 1,000,000 311,957 573,368 -
RYGYO Reysaș GYO 25-Jul-16 Pending No further information No further information No buyback yet No buyback yet -
RYSAS Reysas Tasimacilik 25-Jul-16 Pending No further information No further information No buyback yet No buyback yet -
RTALB RTA Laboratuar 22-Jul-16 Approved 100,000 1,250,000 12,000 93,800 -
SEKFK Seker Finansal Kiralama 21-Oct-16 Approved 4,500,000 5,500,000 1,404,699 1,967,160 -
SNKRN Senkron Güvenlik 25-Jul-16 Approved 300,000 500,000 18,200 29,735 -
TRNSK Transturk Holding 22-Jul-16 Approved 2,000,000 820,000 165,000 57,750 -
PRKAB Turk Prysmian 03-Aug-16 Approved 1,000,000 3,500,000 980,386 2,457,888 -
ULUUN Ulusoy Un 25-Jul-16 Approved 5,000,000 25,000,000 2,002,152 3,445,108 -
YATAS Yatas 21-Jul-16 Approved 4,279,969 16,049,884 No buyback yet No buyback yet -
VANGD Vanet Gıda 21-Jul-16 Approved 1,250,000 1,000,000 No buyback yet No buyback yet -
VERUS Verusa Holding 31-Sep-16 Approved 1,000,000 16,000,000 347,464 4,417,395 -

4Equity Research
Key charts
Figure 2: BIST-100 Index vs. MSCI EM Index price performance (in USD terms)
Source: Bloomberg Finance LP
Figure 3: One-year forward looking P/E multiple (BIST-100 Index vs. MSCI EM Index)
Source: Bloomberg Finance LP
Figure 4: BIST-100 Index one-year forward looking P/E evolution
Source: Bloomberg Finance LP
Figure 5: BIST-100 Index one-year forward looking P/E vs. benchmark bond yield
Source: Bloomberg Finance LP
Figure 6: Banks vs. Industrials Index
Source: Bloomberg Finance LP
Figure 7: BIST-100 Index level vs. daily trading volume
Source: Rasyonet
50
60
70
80
90
100
110
120
130
140
Jan-
11A
pr-1
1Ju
l-11
Oct
-11
Jan-
12A
pr-1
2Ju
l-12
Oct
-12
Jan-
13A
pr-1
3Ju
l-13
Oct
-13
Jan-
14A
pr-1
4Ju
l-14
Oct
-14
Jan-
15A
pr-1
5Ju
l-15
Oct
-15
Jan-
16A
pr-1
6Ju
l-16
Oct
-16
Jan-
17
BIST-100 vs. MSCI EM Index ($) Five- years average
7
8
9
10
11
12
13
14
Dec
-10
Mar
-11
Jun-
11Se
p-11
Dec
-11
Mar
-12
Jun-
12Se
p-12
Dec
-12
Mar
-13
Jun-
13Se
p-13
Dec
-13
Mar
-14
Jun-
14Se
p-14
Dec
-14
Mar
-15
Jun-
15Se
p-15
Dec
-15
Mar
-16
Jun-
16Se
p-16
Dec
-16
MSCI EM Index BIST-100 Index
7.0
7.5
8.0
8.5
9.0
9.5
10.0
10.5
11.0
11.5
12.0
Dec
-10
Mar
-11
Jun-
11Se
p-11
Dec
-11
Mar
-12
Jun-
12Se
p-12
Dec
-12
Mar
-13
Jun-
13Se
p-13
Dec
-13
Mar
-14
Jun-
14Se
p-14
Dec
-14
Mar
-15
Jun-
15Se
p-15
Dec
-15
Mar
-16
Jun-
16Se
p-16
Dec
-16
BIST-100 Index Two-years average
+2 STD
- 2 STD
3%
5%
7%
9%
11%
13%6.5
7.5
8.5
9.5
10.5
11.5
12.5
Dec
-10
Mar
-11
Jun-
11Se
p-11
Dec
-11
Mar
-12
Jun-
12Se
p-12
Dec
-12
Mar
-13
Jun-
13Se
p-13
Dec
-13
Mar
-14
Jun-
14Se
p-14
Dec
-14
Mar
-15
Jun-
15Se
p-15
Dec
-15
Mar
-16
Jun-
16Se
p-16
Dec
-16
BIST-100 Index Benchmark bond rate - inverted (RHS)
45
55
65
75
85
95
105
115
Dec
-10
Mar
-11
Jun-
11Se
p-11
Dec
-11
Mar
-12
Jun-
12Se
p-12
Dec
-12
Mar
-13
Jun-
13Se
p-13
Dec
-13
Mar
-14
Jun-
14Se
p-14
Dec
-14
Mar
-15
Jun-
15Se
p-15
Dec
-15
Mar
-16
Jun-
16Se
p-16
Dec
-16
XBANK Index vs. XUSIN Index average
0
400
800
1,200
1,600
2,000
2,400
85,000
86,000
87,000
88,000
89,000
90,000
91,000
92,000
28 F
eb
01 M
ar
02 M
ar
03 M
ar
06 M
ar
07 M
ar
08 M
ar
09 M
ar
10 M
ar
13 M
ar
14 M
ar
15 M
ar
16 M
ar
17 M
ar
Volume (USDm) (RHS) Index Level TL (LHS)

5Equity Research
Figure 8: Latest Research Reports
Date Report Analyst Contact
17 Mar 2017 Koc Holding - Best in class Can Oztoprak [email protected]
16 Mar 2017 Data Flash Note - CBRT MPC Meting – March 2017 Vedat Mizrahi [email protected]
15 Mar 2017 Arcelik - Strong growth to limit margin pressure Mete Ozbek [email protected]
15 Mar 2017 Data Flash Note - Unemployment – December 2016 Vedat Mizrahi [email protected]
08 Mar 2017 Data Flash Note – Balance of Payments – January 2017 Vedat Mizrahi [email protected]
08 Mar 2017 Data Flash Note – Industrial Production – January 2017 Vedat Mizrahi [email protected]
07 Mar 2017 Turkish Banking Sector - As good as it gets Vedat Mizrahi [email protected]
07 Mar 2017 The Market Oracle - Revision cycle remains strong Vedat Mizrahi [email protected]
03 Mar 2017 Data Flash Note - Inflation – February 2017 Vedat Mizrahi [email protected]
03 Mar 2017 Monthly Cherry Picks - March 2016 Vedat Mizrahi [email protected]
03 Mar 2017 Coca-Cola Icecek - Buy on weakness Can Oztoprak [email protected]
01 Mar 2017 Turkish Corporate Bonds - Trading volume continues to rise M. Sinan Veziroglu [email protected]
23 Feb 2017 Credit Research - Securitisation(VDMK) M. Sinan Veziroglu [email protected]
22 Feb 2017 Vakifbank - Vakifbank - Strong finish to the year Vedat Mizrahi [email protected]
15 Feb 2017 Halkbank - Provisioning burden weighs on profitability Vedat Mizrahi [email protected]
07 Feb 2017 Market Oracle - Banks continue to dominate EPS upgrades Can Ozguzel [email protected]
02 Feb 2017 Yapi Kredi - Capital and asset quality concerns escalate Vedat Mizrahi [email protected]
02 Feb 2017 Isbank - Ending the year in style Vedat Mizrahi [email protected]
01 Feb 2017 Turkish Corporate Bonds - Downgraded to speculative grade M. Sinan Veziroglu [email protected]
01 Feb 2017 Akbank - Meeting expectations Vedat Mizrahi [email protected]
01 Feb 2017 Garanti Bank - Well-positioned for a tough year Vedat Mizrahi [email protected]
30 Jan 2017 Turkish Equity Research - 4Q16 preview: A mixed bag Vedat Mizrahi [email protected]
26 Jan 2017 Data Vault - Introducing v2.0 with a wider coverage Vedat Mizrahi [email protected]
25 Jan 2017 Turkish Equities Strategy - Hoist your sail when the wind is fair Vedat Mizrahi [email protected]
19 Jan 2017 Turkish Banking Sector – Too attractive to ignore Vedat Mizrahi [email protected]
09 Jan 2017 Turkish Telecoms - Please call again later Can Oztoprak [email protected]
04 Jan 2017 Market Oracle - Looking for 17% y/y EPS growth in 2017 Can Ozguzel [email protected]
02 Jan 2017 Turkish Corporate Bonds - Expecting corporate issuances to rise M. Sinan Veziroglu [email protected]
20 Dec 2016 Ulker Biskuvi - Recent slump creates opportunity Can Oztoprak [email protected]
16 Dec 2016 Turkish auto sector - New trends with new taxes Can Ozguzel [email protected]
14 Dec 2016 Tupras - More bang for the buck Muharrem Gulsever [email protected]
01 Dec 2016 Turkish Corporate Bonds – Vast majority of issuers being rated M. Sinan Veziroglu [email protected]
Source: UNLU& Co analysis, *reports are available upon request
6Equity Research
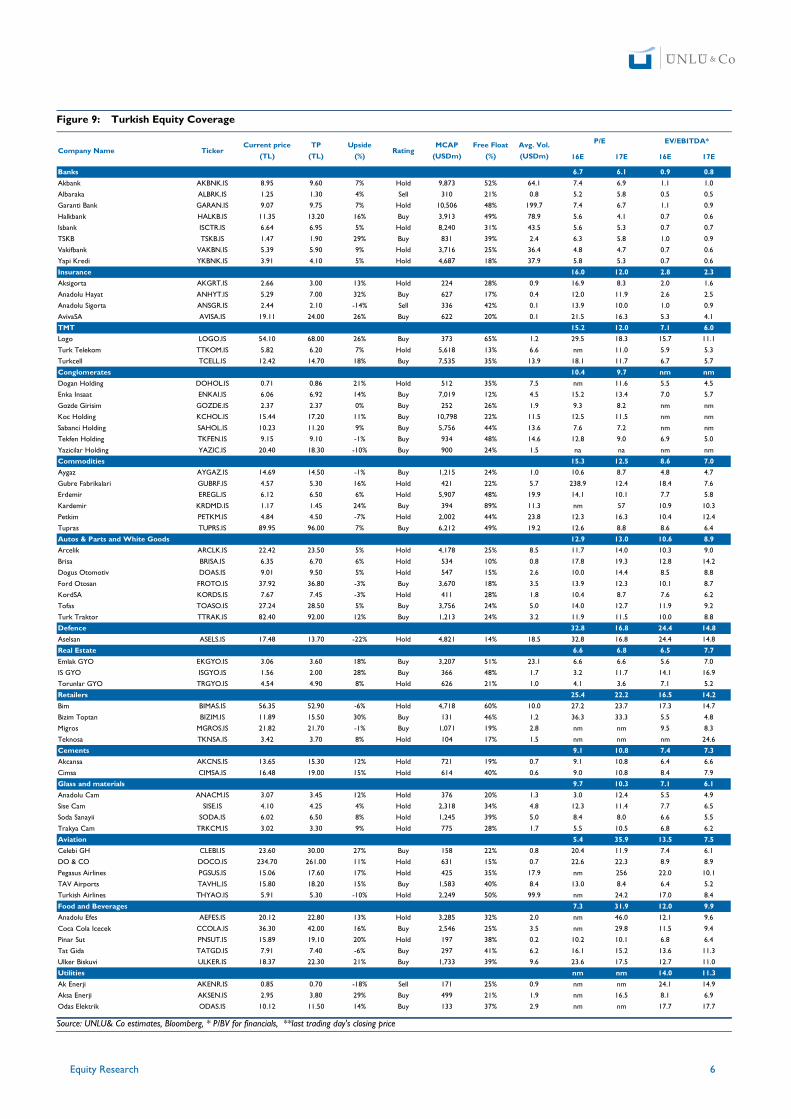
Figure 9: Turkish Equity Coverage
Source: UNLU& Co estimates, Bloomberg, * P/BV for financials, **last trading day's closing price
16E 17E 16E 17E
Banks 6.7 6.1 0.9 0.8
Akbank AKBNK.IS 8.95 9.60 7% Hold 9,873 52% 64.1 7.4 6.9 1.1 1.0
Albaraka ALBRK.IS 1.25 1.30 4% Sell 310 21% 0.8 5.2 5.8 0.5 0.5
Garanti Bank GARAN.IS 9.07 9.75 7% Hold 10,506 48% 199.7 7.4 6.7 1.1 0.9
Halkbank HALKB.IS 11.35 13.20 16% Buy 3,913 49% 78.9 5.6 4.1 0.7 0.6
Isbank ISCTR.IS 6.64 6.95 5% Hold 8,240 31% 43.5 5.6 5.3 0.7 0.7
TSKB TSKB.IS 1.47 1.90 29% Buy 831 39% 2.4 6.3 5.8 1.0 0.9
Vakifbank VAKBN.IS 5.39 5.90 9% Hold 3,716 25% 36.4 4.8 4.7 0.7 0.6
Yapi Kredi YKBNK.IS 3.91 4.10 5% Hold 4,687 18% 37.9 5.8 5.3 0.7 0.6
Insurance 16.0 12.0 2.8 2.3
Aksigorta AKGRT.IS 2.66 3.00 13% Hold 224 28% 0.9 16.9 8.3 2.0 1.6
Anadolu Hayat ANHYT.IS 5.29 7.00 32% Buy 627 17% 0.4 12.0 11.9 2.6 2.5
Anadolu Sigorta ANSGR.IS 2.44 2.10 -14% Sell 336 42% 0.1 13.9 10.0 1.0 0.9
AvivaSA AVISA.IS 19.11 24.00 26% Buy 622 20% 0.1 21.5 16.3 5.3 4.1
TMT 15.2 12.0 7.1 6.0
Logo LOGO.IS 54.10 68.00 26% Buy 373 65% 1.2 29.5 18.3 15.7 11.1
Turk Telekom TTKOM.IS 5.82 6.20 7% Hold 5,618 13% 6.6 nm 11.0 5.9 5.3
Turkcell TCELL.IS 12.42 14.70 18% Buy 7,535 35% 13.9 18.1 11.7 6.7 5.7
Conglomerates 10.4 9.7 nm nm
Dogan Holding DOHOL.IS 0.71 0.86 21% Hold 512 35% 7.5 nm 11.6 5.5 4.5
Enka Insaat ENKAI.IS 6.06 6.92 14% Buy 7,019 12% 4.5 15.2 13.4 7.0 5.7
Gozde Girisim GOZDE.IS 2.37 2.37 0% Buy 252 26% 1.9 9.3 8.2 nm nm
Koc Holding KCHOL.IS 15.44 17.20 11% Buy 10,798 22% 11.5 12.5 11.5 nm nm
Sabanci Holding SAHOL.IS 10.23 11.20 9% Buy 5,756 44% 13.6 7.6 7.2 nm nm
Tekfen Holding TKFEN.IS 9.15 9.10 -1% Buy 934 48% 14.6 12.8 9.0 6.9 5.0
Yazicilar Holding YAZIC.IS 20.40 18.30 -10% Buy 900 24% 1.5 na na nm nm
Commodities 15.3 12.5 8.6 7.0
Aygaz AYGAZ.IS 14.69 14.50 -1% Buy 1,215 24% 1.0 10.6 8.7 4.8 4.7
Gubre Fabrikalari GUBRF.IS 4.57 5.30 16% Hold 421 22% 5.7 238.9 12.4 18.4 7.6
Erdemir EREGL.IS 6.12 6.50 6% Hold 5,907 48% 19.9 14.1 10.1 7.7 5.8
Kardemir KRDMD.IS 1.17 1.45 24% Buy 394 89% 11.3 nm 57 10.9 10.3
Petkim PETKM.IS 4.84 4.50 -7% Hold 2,002 44% 23.8 12.3 16.3 10.4 12.4
Tupras TUPRS.IS 89.95 96.00 7% Buy 6,212 49% 19.2 12.6 8.8 8.6 6.4
Autos & Parts and White Goods 12.9 13.0 10.6 8.9
Arcelik ARCLK.IS 22.42 23.50 5% Hold 4,178 25% 8.5 11.7 14.0 10.3 9.0
Brisa BRISA.IS 6.35 6.70 6% Hold 534 10% 0.8 17.8 19.3 12.8 14.2
Dogus Otomotiv DOAS.IS 9.01 9.50 5% Hold 547 15% 2.6 10.0 14.4 8.5 8.8
Ford Otosan FROTO.IS 37.92 36.80 -3% Buy 3,670 18% 3.5 13.9 12.3 10.1 8.7
KordSA KORDS.IS 7.67 7.45 -3% Hold 411 28% 1.8 10.4 8.7 7.6 6.2
Tofas TOASO.IS 27.24 28.50 5% Buy 3,756 24% 5.0 14.0 12.7 11.9 9.2
Turk Traktor TTRAK.IS 82.40 92.00 12% Buy 1,213 24% 3.2 11.9 11.5 10.0 8.8
Defence 32.8 16.8 24.4 14.8
Aselsan ASELS.IS 17.48 13.70 -22% Hold 4,821 14% 18.5 32.8 16.8 24.4 14.8
Real Estate 6.6 6.8 6.5 7.7
Emlak GYO EKGYO.IS 3.06 3.60 18% Buy 3,207 51% 23.1 6.6 6.6 5.6 7.0
IS GYO ISGYO.IS 1.56 2.00 28% Buy 366 48% 1.7 3.2 11.7 14.1 16.9
Torunlar GYO TRGYO.IS 4.54 4.90 8% Hold 626 21% 1.0 4.1 3.6 7.1 5.2
Retailers 25.4 22.2 16.5 14.2
Bim BIMAS.IS 56.35 52.90 -6% Hold 4,718 60% 10.0 27.2 23.7 17.3 14.7
Bizim Toptan BIZIM.IS 11.89 15.50 30% Buy 131 46% 1.2 36.3 33.3 5.5 4.8
Migros MGROS.IS 21.82 21.70 -1% Buy 1,071 19% 2.8 nm nm 9.5 8.3
Teknosa TKNSA.IS 3.42 3.70 8% Hold 104 17% 1.5 nm nm nm 24.6
Cements 9.1 10.8 7.4 7.3
Akcansa AKCNS.IS 13.65 15.30 12% Hold 721 19% 0.7 9.1 10.8 6.4 6.6
Cimsa CIMSA.IS 16.48 19.00 15% Hold 614 40% 0.6 9.0 10.8 8.4 7.9
Glass and materials 9.7 10.3 7.1 6.1
Anadolu Cam ANACM.IS 3.07 3.45 12% Hold 376 20% 1.3 3.0 12.4 5.5 4.9
Sise Cam SISE.IS 4.10 4.25 4% Hold 2,318 34% 4.8 12.3 11.4 7.7 6.5
Soda Sanayii SODA.IS 6.02 6.50 8% Hold 1,245 39% 5.0 8.4 8.0 6.6 5.5
Trakya Cam TRKCM.IS 3.02 3.30 9% Hold 775 28% 1.7 5.5 10.5 6.8 6.2
Aviation 5.4 35.9 13.5 7.5
Celebi GH CLEBI.IS 23.60 30.00 27% Buy 158 22% 0.8 20.4 11.9 7.4 6.1
DO & CO DOCO.IS 234.70 261.00 11% Hold 631 15% 0.7 22.6 22.3 8.9 8.9
Pegasus Airlines PGSUS.IS 15.06 17.60 17% Hold 425 35% 17.9 nm 256 22.0 10.1
TAV Airports TAVHL.IS 15.80 18.20 15% Buy 1,583 40% 8.4 13.0 8.4 6.4 5.2
Turkish Airlines THYAO.IS 5.91 5.30 -10% Hold 2,249 50% 99.9 nm 24.2 17.0 8.4
Food and Beverages 7.3 31.9 12.0 9.9
Anadolu Efes AEFES.IS 20.12 22.80 13% Hold 3,285 32% 2.0 nm 46.0 12.1 9.6
Coca Cola Icecek CCOLA.IS 36.30 42.00 16% Buy 2,546 25% 3.5 nm 29.8 11.5 9.4
Pinar Sut PNSUT.IS 15.89 19.10 20% Hold 197 38% 0.2 10.2 10.1 6.8 6.4
Tat Gida TATGD.IS 7.91 7.40 -6% Buy 297 41% 6.2 16.1 15.2 13.6 11.3
Ulker Biskuvi ULKER.IS 18.37 22.30 21% Buy 1,733 39% 9.6 23.6 17.5 12.7 11.0
Utilities nm nm 14.0 11.3
Ak Enerji AKENR.IS 0.85 0.70 -18% Sell 171 25% 0.9 nm nm 24.1 14.9
Aksa Enerji AKSEN.IS 2.95 3.80 29% Buy 499 21% 1.9 nm 16.5 8.1 6.9
Odas Elektrik ODAS.IS 10.12 11.50 14% Buy 133 37% 2.9 nm nm 17.7 17.7
Company NameAvg. Vol.
(USDm)
Free Float
(%)Rating
MCAP
(USDm)
Upside
(%)
P/E EV/EBITDA*TP
(TL)
Current price
(TL)Ticker

7Equity Research
Figure 10: Corporate Bond Coverage
Source: Borsa Istanbul
Issuer ISIN codeType of
YieldIssuance Date Maturity Date
Total Issue Nominal
Amount (TLm)
Number of
Coupons
Next Coupon
Date
Next Coupon
Rate (%)
Spread
(bps)
Ayen Enerji TRSAYENK1813 FRN 01/12/2016 29/11/2018 50 4 01/06/2017 3.8415 475
Calik Enerji TRSCLKE21918 FRN 03/02/2017 01/02/2019 150 4 05/05/2017 3.8014 450
IC Ictas Enerji TRSICICA1713 FRN 18/12/2015 15/12/2017 135 4 16/06/2017 3.8965 450
Karsan Otomotiv TRSKRSNE1713 FRN 21/10/2014 17/10/2017 180 4 18/04/2017 3.7839 450
Karsan Otomotiv TRSKRSN31812 FRN 27/03/2015 23/03/2018 20 4 24/03/2017 3.6857 450
Palmet Enerji TRSPALM51713 FRN 11/05/2015 08/05/2017 50 4 08/05/2017 3.9277 500
Palmet Enerji TRSPALM31814 FRN 23/03/2016 21/03/2018 20 4 22/03/2017 3.9205 500
Soktas Tekstil TRSSKTS41717 FRN 07/04/2015 04/04/2017 25 4 04/04/2017 3.7313 475
8Equity Research
Disclosure Appendix
Important Global Disclosures
The information and opinions in this research report was prepared by UNLU Menkul Degerler A.S ("UNLU & Co"). For important disclosures, stock price charts and equity rating histories regarding companies that are the subject of this report, please contact UNLU & Co Research and / or Compliance - +90 212 367 3636. For valuation methodology and risks associated with any price targets referenced in this research report, please email: [email protected] with a request for valuation methodology and risks on a particular stock. The following analyst/s: Sinan Veziroglu, Vedat Mizrahi, PhD certify(ies), with respect to the companies or securities under analysis, that (1) the views expressed in this report accurately reflect his/her/their personal views about all of the subject companies and securities and (2) no part of their compensation was, is or will be directly or indirectly related to the specific recommendations or views expressed in this report. * Any other material conflict of interest of the research analyst or member (Unlu Securities Inc., the US broker-dealer) that the research analyst or an associated person of the member with the ability to influence the content of a research report knows or has reason to know at the time of the publication or distribution of a research report is as follows: NONE Please refer to Fig 9 for all other companies mentioned.
UNLU & Co distribution of stock rating is:
Ratings Distribution as of the date of this report BUY Hold Sell RESTRICTED
All Recommendations (%) 47 48 5 0
* our stock ratings of BUY, HOLD, and SELL most closely correspond to Buy, Hold, and Sell, respectively; however, the meanings are not the same, as our stock ratings are determined on a relative basis. (Please refer to definitions above.) An investor's decision to buy or sell a security should be based on investment objectives, current holdings, and other individual factors.
UNLU & Co policy is to update research reports as it deems appropriate, based on developments with the subject company, the sector or the market that may have a material impact on the research views or opinions stated herein.
UNLU & Co policy is only to publish investment research that is impartial, independent, clear, fair and not misleading. For more detail please contact the Compliance Division of UNLU & Co and request their Policies for Managing Conflicts of Interest in connection with Investment Research.
UNLU & Co does not provide any tax advice. Any statement herein regarding any US federal tax is not intended or written to be used, and cannot be used, by any taxpayer for the purposes of avoiding any penalties.
Unlu Menkul Degerler A.S. (“UNLU & Co”), is authorized and regulated by the Capital Markets Board of Turkey (“CMB”) and a member of Borsa Istanbul A.S. (“BIST”). Under CMB’s legislation, the information, comments and recommendations contained in this report fall outside of the definition of investment advisory services. Investment advisory services are provided by authorized entities by taking into account the risk and return preferences of the concerned persons. The comments and recommendations contained in this report have general nature. These recommendations may not fit to your financial status, risk and return preferences. For this reason, to make an investment decision by relying solely to this information stated here may not bring about outcomes that fit your expectations
Company Specific Disclosures: Important Disclosures, including price charts are available for compendium reports and all UNLU & Co covered companies by emailing [email protected] or calling +90 212 367 3690 with your request. UNLU & Co Research team may screen companies not covered by UNLU & Co. For important disclosures for these companies, please call + 90 212 367 3817 or e-mail [email protected]

9Equity Research
Important Regional Disclosures
This report covers the Turkish Daily Financial Markets Updates. All other companies were used for illustrative purposes only. We are not commenting on the investment merit of the securities of these companies Singapore recipients should contact a Singapore financial adviser for any matters arising from this research report. The analyst(s) involved in the preparation of this report have not visited the material operations of the subject company () within the past 12 months. As of the date of this report, UNLU & Co does not act as a market maker or liquidity provider in the equities securities that are the subject of this report. Principal is not guaranteed in the case of equities because equity prices are variable. Commission is the commission rate or the amount agreed with a customer when setting up an account or at any time after that. Investors should carefully consider their own investment risk. Investment results are the responsibility of the individual investor. Reports may not be reprinted without permission of UNLU & Co.
Important UNLU & Co Disclosures
Potential Conflicts Company Disclosure
Anadolu Cam D & F Aksa Enerji D Akfen D & F Ayen Enerji D, F & G Bizim Toptan D & G Calik Enerji D, F & G IC ICtas Enerji D Karsan Otomotiv D Gozde Girisim D & G Palmet Enerji D Soktas Tekstil D & G Ulker Biskuvi D, F & G A: The analyst, a team member, a member of the analyst's household or a team member's household serves as an officer, director or
advisory board member of the subject company B: The company beneficially owns 5% or more of the equity shares of UNLU & Co as at date of this report C: UNLU & Co beneficially owns 1% or more of the equity shares of the company D: The Company is a client of UNLU & Co E: UNLU & Co has lead managed or co-lead managed a public offering of securities in the Company or any related derivatives in the last
12 months F: UNLU & Co has received compensation for investment banking services from the company within the last 12 months G: UNLU & Co expects to receive, or intends to seek, compensation for investment banking services from the company during the next 3
months H: UNLU & Co has sent extracts of this research report to the subject company prior to publication for the purpose of verifying factual
accuracy. Based on information provided by the subject company, factual changes have been made as a result. I: Analyst or a member of their household holds long or short personal positions in a class of common equity securities of this company J: UNLU & Co is a market maker or liquidity provider in the financial instruments of the relevant issuer or any related derivatives K: UNLU & Co provided non-investment banking services, which may include Sales and Trading services, to the subject company within
the past 12 months L: UNLU & Co has received compensation for products and services other than investment banking services from the subject company
within the past 12 months M: UNLU & Co beneficially owns 5% or more of the equity shares of the Company * Disclosures are correct as of date of this report
For purposes CMB, in connection to the distribution of UNLU & Co research, UNLU & Co must disclose certain material conflicts of interest.
This report may include references to UNLU & Co’s research recommendations. For further information and for published UNLU & Co reports in their entirety, please visit the website at http://www.unluco.com For UNLU & Co disclosure information on other companies mentioned in this report, please visit the website at http://www.unluco.com. Disclaimers continue on next page.

10Equity Research
Disclaimer and Confidentiality Note
This report is not directed to, or intended for distribution to or use by, any person or entity who is a citizen or resident of or located in any locality, state, country or other jurisdiction where such distribution, publication, availability or use would be contrary to law or regulation or which would subject UNLU & Co to any registration or licensing requirement within such jurisdiction. All material presented in this report, unless specifically indicated otherwise, is under copyright to UNLU & Co. None of the material, nor its content, nor any copy of it, may be altered in any way, transmitted to, copied or distributed to any other party, without the prior express written permission of UNLU & Co. All trademarks, service marks and logos used in this report are trademarks or service marks or registered trademarks or service marks of UNLU & Co or their subsidiaries.
The information, tools and material presented in this report are provided to you for information purposes only and are not to be used or considered as an offer or the solicitation of an offer to sell or to buy or subscribe for securities or other financial instruments. UNLU & Co may not has taken any steps to ensure that the securities referred to in this report are suitable for any particular investor. UNLU & Co will not treat recipients as their customers by virtue of their receiving the report. The investments or services contained or referred to in this report may not be suitable for you and it is recommended that you consult an independent investment advisor if you are in doubt about such investments or investment services. Nothing in this report constitutes investment, legal, accounting or tax advice or a representation that any investment or strategy is suitable or appropriate to your individual circumstances or otherwise constitutes a personal recommendation to you. UNLU & Co does not offer advice on the tax consequences of investment and you are advised to contact an independent tax adviser. Please note in particular that the bases and levels of taxation may change.
UNLU & Co believe the information and opinions in the Disclosure Appendix of this report are accurate and complete. Information and opinions presented in the other sections of the report were obtained or derived from sources UNLU & Co believe are reliable, but UNLU & Co makes no representations as to their accuracy or completeness. Additional information is available upon request. UNLU & Co accepts no liability for loss arising from the use of the material presented in this report, except that this exclusion of liability does not apply to the extent that liability arises under specific statutes or regulations applicable to UNLU & Co. This report is not to be relied upon in substitution for the exercise of independent judgment. UNLU & Co may have issued, and may in the future issue, a trading call regarding this security. In addition, UNLU & Co may have issued, and may in the future issue, other reports that are inconsistent with, and reach different conclusions from, the information presented in this report. Those reports reflect the different assumptions, views and analytical methods of the analysts who prepared them and UNLU & Co is under no obligation to ensure that such other reports are brought to the attention of any recipient of this report. UNLU & Co are involved in many businesses that relate to companies mentioned in this report.
Descriptions of any company or issuer or their securities or the markets or developments mentioned in the Research are not intended to be complete. The Research should not be regarded by recipients as a substitute for the exercise of their own judgment as the Research has no regard to the specific investment objectives, financial situation or particular needs of any specific recipient.
Past performance should not be taken as an indication or guarantee of future performance, and no representation or warranty, express or implied, is made regarding future performance. Information, opinions and estimates contained in this report reflect a judgment at its original date of publication by UNLU & Co and are subject to change without notice. The price, value of and income from any of the securities or financial instruments mentioned in this report can fall as well as rise. The value of securities and financial instruments is subject to exchange rate fluctuation that may have a positive or adverse effect on the price or income of such securities or financial instruments. Investors in securities such as ADRs, the values of which are influenced by currency volatility, effectively assume this risk.
Structured securities are complex instruments, typically involve a high degree of risk and are intended for sale only to sophisticated investors who are capable of understanding and assuming the risks involved. The market value of any structured security may be affected by changes in economic, financial and political factors (including, but not limited to, spot and forward interest and exchange rates), time to maturity, market conditions and volatility, and the credit quality of any issuer or reference issuer. Any investor interested in purchasing a structured product should conduct their own investigation and analysis of the product and consult with their own professional advisers as to the risks involved in making such a purchase.
Some investments may not be readily realizable since the market in the securities is illiquid or there is no secondary market for the investor’s interest and therefore valuing the investment and identifying the risk to which the investor is exposed may be difficult to quantify. Investments in illiquid securities involve a high degree of risk and are suitable only for sophisticated investors who can tolerate such risk and do not require an investment easily and quickly converted into cash. Other risk factors affecting the price, value or income of an investment include but are not necessarily limited to political risks, economic risks, credit risks and market risks.
Some investments discussed in this report have a high level of volatility. High volatility investments may experience sudden and large falls in their value causing losses when that investment is realised. Those losses may equal your original investment. Indeed, in the case of some investments the potential losses may exceed the amount of initial investment, in such circumstances you may be required to pay more money to support those losses. Income yields from investments may fluctuate and, in consequence, initial capital paid to make the investment may be used as part of that income yield. Some investments may not be readily realisable and it may be difficult to sell or realise those investments, similarly it may prove difficult for you to obtain reliable information about the value, or risks, to which such an investment is exposed.

11Equity Research
UNLU & Co maintains information barriers between their Research Analysts and the rest of their and their shareholders business divisions, more specifically the Investment Banking business. UNLU & Co analysts’, strategists’ and economists’ compensation is not linked to Investment Banking or Capital Markets transactions performed by UNLU & Co or their shareholders. Facts and views presented in UNLU & Co research has not been reviewed by, and may not reflect information known to, professionals in other UNLU & Co business areas, including investment banking personnel.
This report may provide the addresses of, or contain hyperlinks to, websites. Except to the extent to which the report refers to website material of UNLU & Co has not reviewed the linked site and takes no responsibility for the content contained therein. Such address or hyperlink (including addresses or hyperlinks to UNLU & Co’s own website material) is provided solely for your convenience and information and the content of the linked site does not in any way form part of this document. Accessing such website or following such link through this report shall be at your own risk.
In jurisdictions where UNLU & Co is not already registered or licensed to trade in securities, transactions will only be effected in accordance with applicable securities legislation, which will vary from jurisdiction to jurisdiction and may require that the trade be made in accordance with applicable exemptions from registration or licensing requirements. US investors transacting in the securities featured or mentioned in this research report must deal directly through a U.S. Registered broker-dealer.
This document does not constitute or form part of, and should not be construed as, an offer or invitation to subscribe for or purchase any securities, and neither this document nor anything contained herein shall form the basis of or be relied on in connection with or act as an inducement to enter into any contract or commitment whatsoever. This document has not been published generally and has only been made available to institutional investors. Any decision to subscribe for or purchase securities in any offering must be made solely on the basis of the information contained in an offering memorandum (and supplements thereto) or any other offering document issued in connection with any proposed offering.
UNLU & Co does not form a fiduciary relationship or constitute advice and this Research is not and should not be construed as an offer or a solicitation of an offer of securities or related financial instruments or an invitation or inducement to engage in investment activity, and cannot be relied upon as a representation that any particular transaction necessarily could have been or can be effected at the stated price.
Please note that this report was originally prepared by UNLU & Co for distribution to market professionals and institutional investor customers. Recipients who are not market professionals or institutional investor customers of UNLU & Co should seek the advice of their independent financial advisor prior to taking any investment decision based on this report or for any necessary explanation of its contents.
UNLU & Co is a member of the BIST.
Copyright 2017 UNLU & Co All rights reserved.

12Equity Research
Head of Equity & Credit Research Head of Equity & Credit Sales Head of Equity Trading Vedat Mizrahi, PhD (90 212) 367 3690 Tunc Yildirim (90 212) 367 3675 Batur Ozyar (90 212) 367 3673
[email protected] [email protected] [email protected]
Equity Research Team Equity Sales Team Equity Trading Team Banks & Insurance Turkey Turkey Vedat Mizrahi, PhD (90 212) 367 3690 Tunc Yildirim (90 212) 367 3675 Batur Ozyar (90 212) 367 3673 [email protected] [email protected] [email protected] Emir Moran (90 212) 367 3687 Kagan Cevik (90 212) 367 3683 Engin Cebeci (90 212) 367 3674 [email protected] [email protected] [email protected] Real Estate Yasemin Ahmetoglu (90 212) 367 3671 Hakan Tezguler (90 212) 367 3677 Emir Moran (90 212) 367 3687 [email protected] [email protected] [email protected] Ozlem Turgay (90 212) 367 3676 Airlines [email protected] Muharrem Gulsever (90 212) 367 3694 [email protected] United States Autos & Parts Batur Ozyar (90 212) 367 3673 Can Ozguzel (90 212) 367 3678 [email protected] [email protected] Retail & Beverage Mete Özbek (90 212) 367 3689 [email protected] Food Can Oztoprak (90 212) 367 3692 [email protected] TMT Can Oztoprak (90 212) 367 3692 [email protected] White Goods Mete Özbek (90 212) 367 3689 [email protected] Conglomerates Can Oztoprak (90 212) 367 3692 [email protected] Oil and Gas Muharrem Gulsever (90 212) 367 3694 [email protected] Metals and Mining Muharrem Gulsever (90 212) 367 3694 [email protected] Building Materials Can Ozguzel (90 212) 367 3678 [email protected] Assistant Economist Esra Șimșek (90 212) 367 3696 [email protected] Credit Research Team Credit Sales Team Sinan Veziroglu (90 212) 367 3691 Tunc Yildirim (90 212) 367 3675 [email protected] [email protected] Vedat Mizrahi, PhD (90 212) 367 3690 Yasemin Ahmetoglu (90 212) 367 3671
[email protected] [email protected] Ozlem Turgay (90 212) 367 3676 [email protected]