Embed Size (px)
DESCRIPTION
RHB Investment
Citation preview

27
See important disclosures at the end of this report Powered by Enhanced Datasystems’ EFATM
Platform 1
Sector Update, 12 December 2014
Real Estate Neutral (Downgraded)
Not In a Mood To Buy
Macro
3
Risks
3
Growth
2
Value
2
Company
Previous Current
E&O 35% 50%
Glomac 45% 55%
Hua Yang 10% 10%
IJM Land Privatisation Privatisation
IOIPG 40% 40%
Mah Sing 15% 15%
MRCB 0% 25%
Matrix 10% 10%
Paramount 50% 55%
SP Setia 10% 10%
Sunway 30% 30%
Tambun 0% 0%
UEMS 40% 50%
UOAD 30% 45%
Discount to RNAV
Loong Kok Wen CFA +603 9207 7614
Alia Arwina +603 9207 7608
P/E (x) P/B (x) Yield (%)
Dec-15F Dec-15F Dec-15F
Eastern & Oriental MYR2.28 MYR2.27 20.5 1.6 1.6 NEUTRAL
Glomac MYR1.00 MYR0.88 7.9 0.7 5.6 SELL
Hua Yang MYR2.04 MYR2.74 5.4 1.1 6.5 BUY
IJM Land MYR3.30 MYR3.97 14.0 1.3 1.4 BUY
IOI Properties Group MYR2.30 MYR2.63 15.6 0.7 3.5 NEUTRAL
Mah Sing MYR2.24 MYR2.41 10.1 1.7 4.4 NEUTRAL
Malaysian Resources Corp MYR1.25 MYR1.50 19.4 1.2 1.6 NEUTRAL
Matrix Concepts Holdings MYR2.64 MYR3.93 6.6 1.6 6.1 BUY
Paramount Corp MYR1.48 MYR1.54 8.9 0.8 6.1 NEUTRAL
SP Setia MYR3.26 MYR4.08 15.9 1.4 3.6 BUY
Sunw ay MYR3.34 MYR3.90 10.1 1.0 3.6 BUY
Tambun Indah Land MYR1.69 MYR2.50 6.0 1.5 6.0 BUY
UEM Sunrise MYR1.52 MYR1.65 11.9 1.0 3.3 NEUTRAL
UOA Development MYR2.01 MYR1.84 8.1 1.0 7.0 NEUTRAL
Company Name Price Target Rating
Source: Company data, RHB estimates
We downgrade the property sector to NEUTRAL. Our stock picks are Sunway, IJM Land and Matrix Concepts. We expect 2015 property transaction volume to fall by 3-5% on the back of slower economic growth and high loan rejection rate, while property prices to stay flat, as developers will likely have difficulties in passing on incremental costs. We estimate new sales to drop by 10-20% from -25% in 2014.
Expect 1H15 transaction volume to fall by 5-10%. We expect overall
residential and commercial property transaction volume to fall by 5-10% in 1H15 (vs +2.8% HoH in 1H14) and 3-5% for 2015. The decline should be more severe in 2Q15 immediately after the implementation of GST from 1 Apr 2015. Based on Singapore’s experience, after the GST rate was raised to 7% from 5% in July 2007, residential property transaction volume contracted by 41% HoH in 2H07. We expect the Malaysian market to experience a similar trend but with a milder fall.
Sentiment hit. RHB economics team has cut its 2015 GDP growth forecast to 5.0% from 5.3% (vs 5.8% in 2014). The slower economic growth and the recent sharp drop in equity prices are hitting market sentiment. We expect this to dampen the demand for property next year.
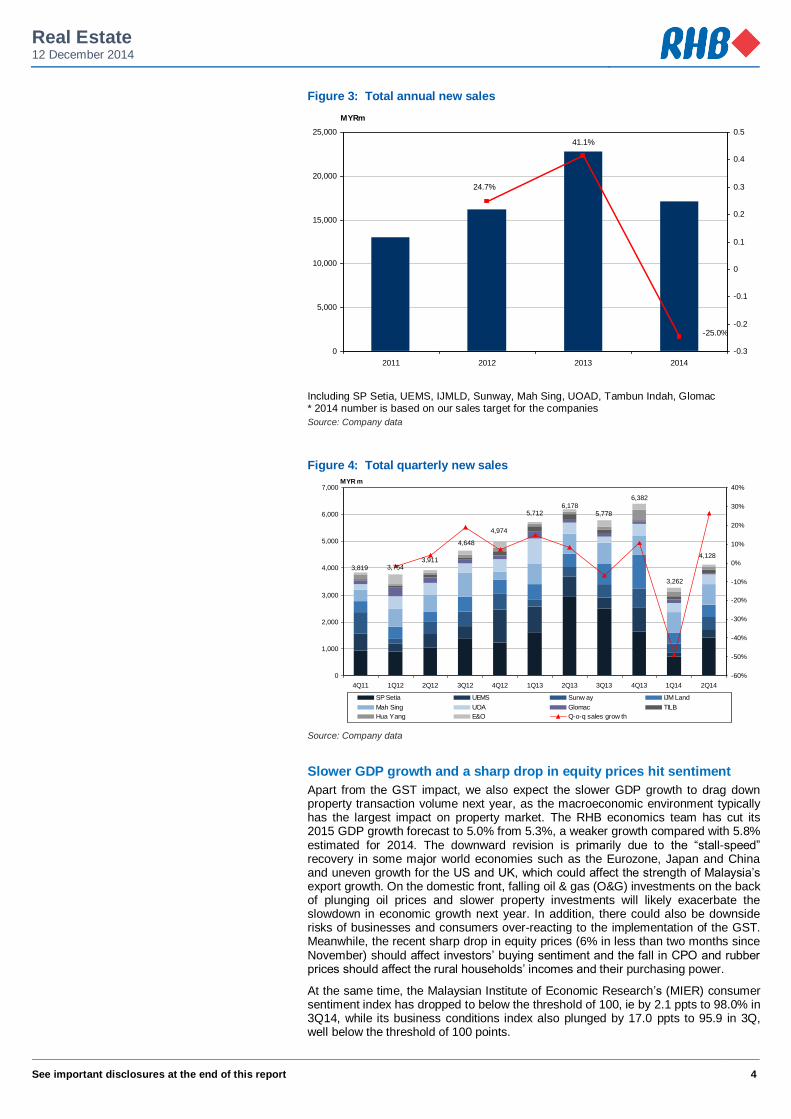
Average new sales to drop by 10-20%. We believe both buyers and developers will adopt a wait-and-see attitude, and hence launches and take ups will likely be slow. As we expect property prices to be flat or up slightly by 3-4%, given lower volume, we estimate new property sales to fall by an average 10-20% in 2015 from -25% in 2014 and +41% in 2013.
Less exciting earnings growth ahead. To reflect our expectations of the property market, developers’ earnings growth in FY16 should be negative, or flattish at best. The Penang property market, however, could fare slightly better as the weakening MYR should benefit both exports and tourism, which are the key economic activities of the state.
Downgrade to NEUTRAL. The sector is now trading at a 33% discount to RNAV, and we expect the discount to widen towards the mean level of about 40%. Overall, we raise our discount to RNAV by 5-15%. We prefer stocks with ongoing corporate exercise, such as Sunway and IJM Land, as the upside is more promising, and both also offer an exposure to the construction sector, where we have an OVERWEIGHT rating. Affordable housing players should also fare better, due to the resilient demand. Our Top Picks are Sunway, IJM Land and Matrix Concepts.
Real Estate 12 December 2014
See important disclosures at the end of this report 2
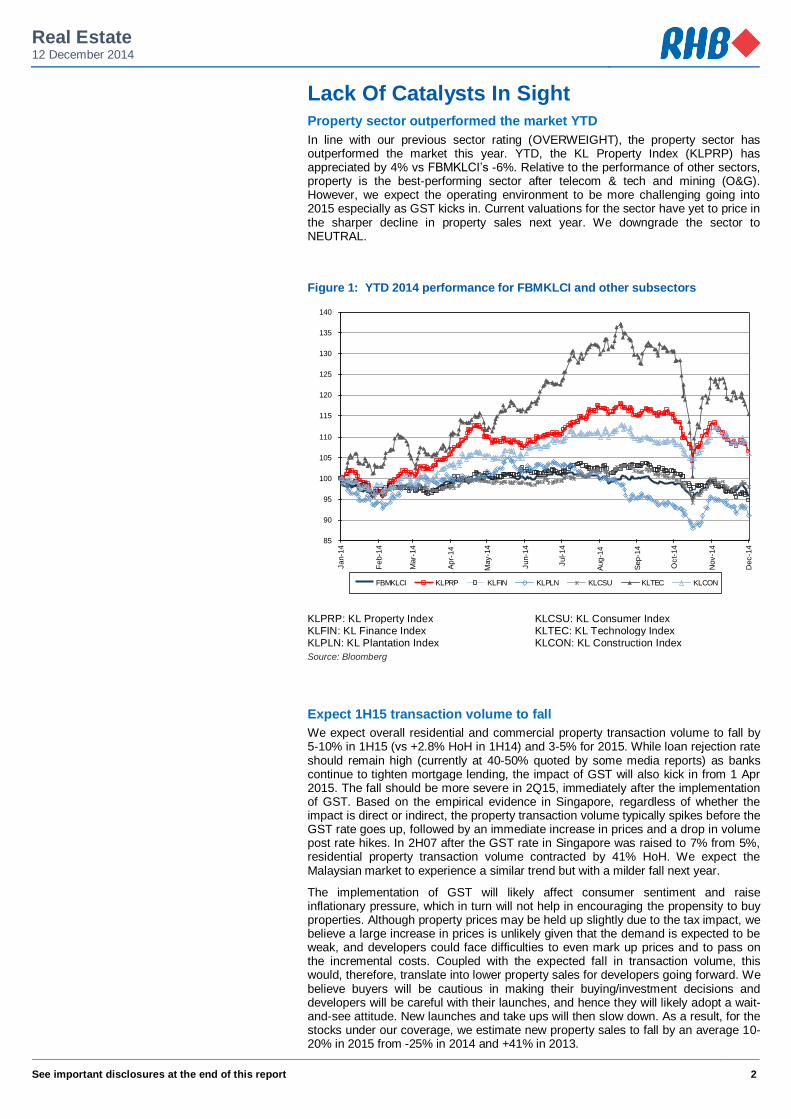
Lack Of Catalysts In Sight Property sector outperformed the market YTD
In line with our previous sector rating (OVERWEIGHT), the property sector has outperformed the market this year. YTD, the KL Property Index (KLPRP) has appreciated by 4% vs FBMKLCI’s -6%. Relative to the performance of other sectors, property is the best-performing sector after telecom & tech and mining (O&G). However, we expect the operating environment to be more challenging going into 2015 especially as GST kicks in. Current valuations for the sector have yet to price in the sharper decline in property sales next year. We downgrade the sector to NEUTRAL.
Figure 1: YTD 2014 performance for FBMKLCI and other subsectors
85
90
95
100
105
110
115
120
125
130
135
140
Jan-1
4
Feb-1
4
Mar-
14
Apr-
14
May-1
4
Jun-1
4
Jul-14
Aug-1
4
Sep-1
4
Oct-
14
Nov-1
4
Dec-1
4
FBMKLCI KLPRP KLFIN KLPLN KLCSU KLTEC KLCON
KLPRP: KL Property Index KLCSU: KL Consumer Index KLFIN: KL Finance Index KLTEC: KL Technology Index KLPLN: KL Plantation Index KLCON: KL Construction Index
Source: Bloomberg
Expect 1H15 transaction volume to fall
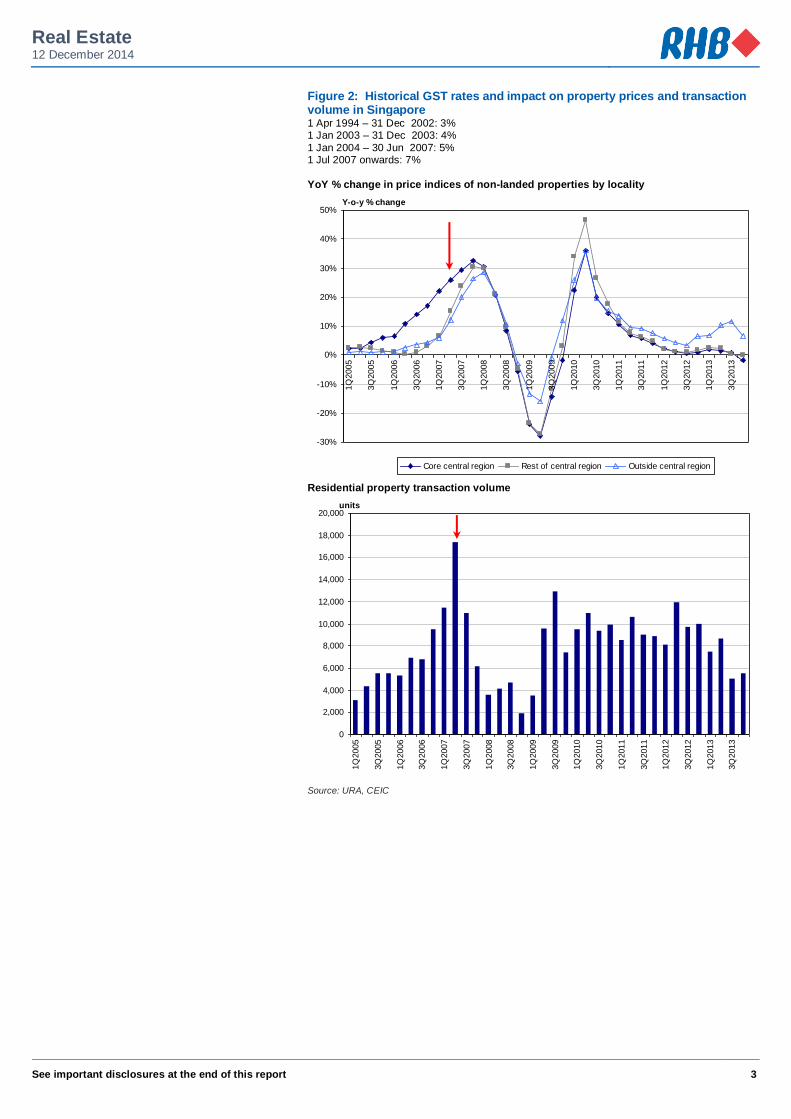
We expect overall residential and commercial property transaction volume to fall by 5-10% in 1H15 (vs +2.8% HoH in 1H14) and 3-5% for 2015. While loan rejection rate should remain high (currently at 40-50% quoted by some media reports) as banks continue to tighten mortgage lending, the impact of GST will also kick in from 1 Apr 2015. The fall should be more severe in 2Q15, immediately after the implementation of GST. Based on the empirical evidence in Singapore, regardless of whether the impact is direct or indirect, the property transaction volume typically spikes before the GST rate goes up, followed by an immediate increase in prices and a drop in volume post rate hikes. In 2H07 after the GST rate in Singapore was raised to 7% from 5%, residential property transaction volume contracted by 41% HoH. We expect the Malaysian market to experience a similar trend but with a milder fall next year.
The implementation of GST will likely affect consumer sentiment and raise inflationary pressure, which in turn will not help in encouraging the propensity to buy properties. Although property prices may be held up slightly due to the tax impact, we believe a large increase in prices is unlikely given that the demand is expected to be weak, and developers could face difficulties to even mark up prices and to pass on the incremental costs. Coupled with the expected fall in transaction volume, this would, therefore, translate into lower property sales for developers going forward. We believe buyers will be cautious in making their buying/investment decisions and developers will be careful with their launches, and hence they will likely adopt a wait-and-see attitude. New launches and take ups will then slow down. As a result, for the stocks under our coverage, we estimate new property sales to fall by an average 10-20% in 2015 from -25% in 2014 and +41% in 2013.
Real Estate 12 December 2014
See important disclosures at the end of this report 3
Figure 2: Historical GST rates and impact on property prices and transaction volume in Singapore 1 Apr 1994 – 31 Dec 2002: 3% 1 Jan 2003 – 31 Dec 2003: 4%
1 Jan 2004 – 30 Jun 2007: 5% 1 Jul 2007 onwards: 7%
YoY % change in price indices of non-landed properties by locality
-30%
-20%
-10%
0%
10%
20%
30%
40%
50%
1Q
2005
3Q
2005
1Q
2006
3Q
2006
1Q
2007
3Q
2007
1Q
2008
3Q
2008
1Q
2009
3Q
2009
1Q
2010
3Q
2010
1Q
2011
3Q
2011
1Q
2012
3Q
2012
1Q
2013
3Q
2013
Y-o-y % change
Core central region Rest of central region Outside central region
Residential property transaction volume
0
2,000
4,000
6,000
8,000
10,000
12,000
14,000
16,000
18,000
20,000
1Q
2005
3Q
2005
1Q
2006
3Q
2006
1Q
2007
3Q
2007
1Q
2008
3Q
2008
1Q
2009
3Q
2009
1Q
2010
3Q
2010
1Q
2011
3Q
2011
1Q
2012
3Q
2012
1Q
2013
3Q
2013
units
Source: URA, CEIC
Real Estate 12 December 2014
See important disclosures at the end of this report 4
Figure 3: Total annual new sales
-25.0%
41.1%
24.7%
0
5,000
10,000
15,000
20,000
25,000
2011 2012 2013 2014
MYRm
-0.3
-0.2
-0.1
0
0.1
0.2
0.3
0.4
0.5
Including SP Setia, UEMS, IJMLD, Sunway, Mah Sing, UOAD, Tambun Indah, Glomac * 2014 number is based on our sales target for the companies Source: Company data
Figure 4: Total quarterly new sales
4,128
5,778
6,1785,712
3,7543,819
3,911
4,648
4,974
6,382
3,262
0
1,000
2,000
3,000
4,000
5,000
6,000
7,000
4Q11 1Q12 2Q12 3Q12 4Q12 1Q13 2Q13 3Q13 4Q13 1Q14 2Q14
MYR m
-60%
-50%
-40%
-30%
-20%
-10%
0%
10%
20%
30%
40%
SP Setia UEMS Sunw ay IJM Land
Mah Sing UOA Glomac TILB
Hua Yang E&O Q-o-q sales grow th
Source: Company data
Slower GDP growth and a sharp drop in equity prices hit sentiment
Apart from the GST impact, we also expect the slower GDP growth to drag down property transaction volume next year, as the macroeconomic environment typically has the largest impact on property market. The RHB economics team has cut its 2015 GDP growth forecast to 5.0% from 5.3%, a weaker growth compared with 5.8% estimated for 2014. The downward revision is primarily due to the “stall-speed” recovery in some major world economies such as the Eurozone, Japan and China and uneven growth for the US and UK, which could affect the strength of Malaysia’s export growth. On the domestic front, falling oil & gas (O&G) investments on the back of plunging oil prices and slower property investments will likely exacerbate the slowdown in economic growth next year. In addition, there could also be downside risks of businesses and consumers over-reacting to the implementation of the GST. Meanwhile, the recent sharp drop in equity prices (6% in less than two months since November) should affect investors’ buying sentiment and the fall in CPO and rubber prices should affect the rural households’ incomes and their purchasing power.
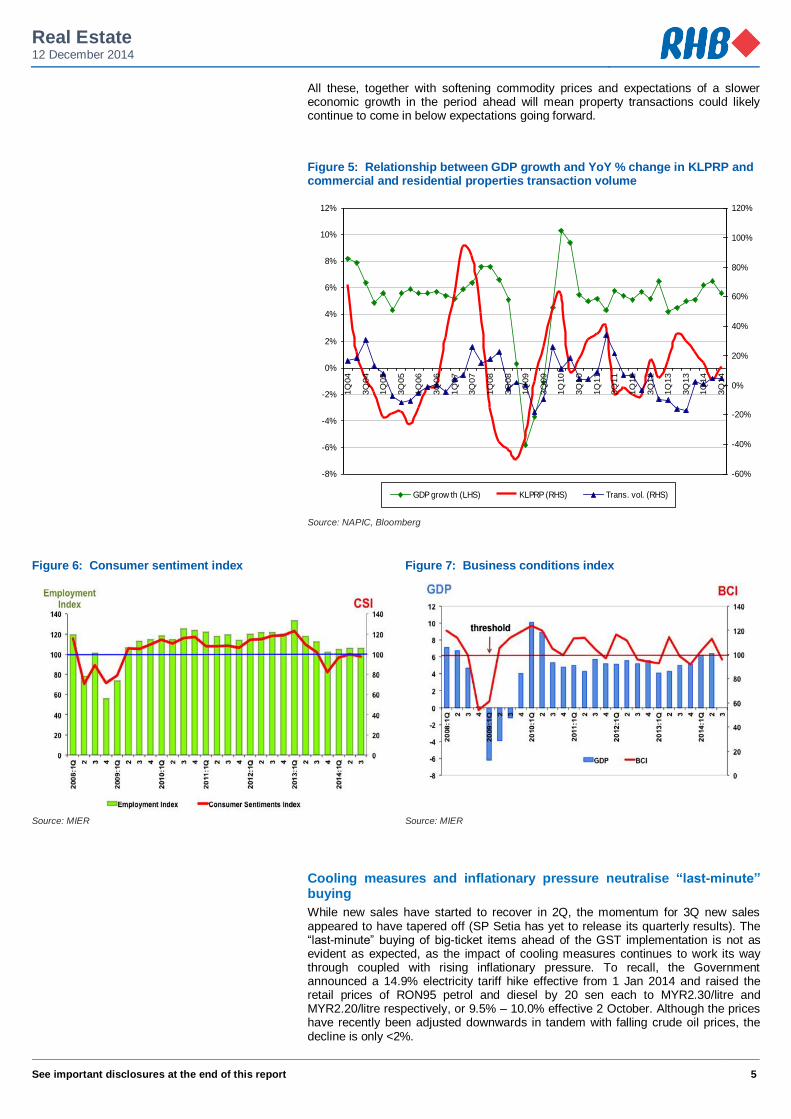
At the same time, the Malaysian Institute of Economic Research’s (MIER) consumer sentiment index has dropped to below the threshold of 100, ie by 2.1 ppts to 98.0% in 3Q14, while its business conditions index also plunged by 17.0 ppts to 95.9 in 3Q, well below the threshold of 100 points.
Real Estate 12 December 2014
See important disclosures at the end of this report 5
All these, together with softening commodity prices and expectations of a slower economic growth in the period ahead will mean property transactions could likely continue to come in below expectations going forward.
Figure 5: Relationship between GDP growth and YoY % change in KLPRP and commercial and residential properties transaction volume
-8%
-6%
-4%
-2%
0%
2%
4%
6%
8%
10%
12%
1Q
04
3Q
04
1Q
05
3Q
05
1Q
06
3Q
06
1Q
07
3Q
07
1Q
08
3Q
08
1Q
09
3Q
09
1Q
10
3Q
10
1Q
11
3Q
11
1Q
12
3Q
12
1Q
13
3Q
13
1Q
14
3Q
14
-60%
-40%
-20%
0%
20%
40%
60%
80%
100%
120%
GDP grow th (LHS) KLPRP (RHS) Trans. vol. (RHS)
Source: NAPIC, Bloomberg
Figure 6: Consumer sentiment index Figure 7: Business conditions index
Source: MIER Source: MIER
Cooling measures and inflationary pressure neutralise “last-minute” buying
While new sales have started to recover in 2Q, the momentum for 3Q new sales appeared to have tapered off (SP Setia has yet to release its quarterly results). The “last-minute” buying of big-ticket items ahead of the GST implementation is not as evident as expected, as the impact of cooling measures continues to work its way through coupled with rising inflationary pressure. To recall, the Government announced a 14.9% electricity tariff hike effective from 1 Jan 2014 and raised the retail prices of RON95 petrol and diesel by 20 sen each to MYR2.30/litre and MYR2.20/litre respectively, or 9.5% – 10.0% effective 2 October. Although the prices have recently been adjusted downwards in tandem with falling crude oil prices, the decline is only <2%.
Real Estate 12 December 2014
See important disclosures at the end of this report 6
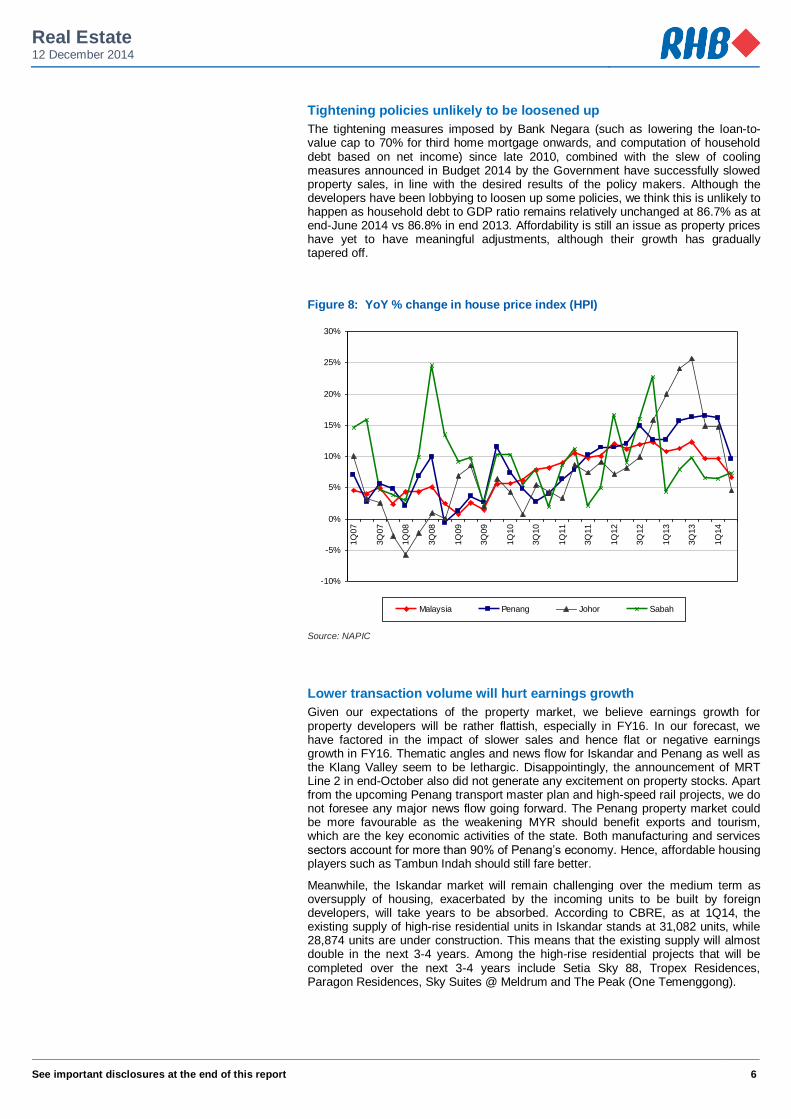
Tightening policies unlikely to be loosened up
The tightening measures imposed by Bank Negara (such as lowering the loan-to-value cap to 70% for third home mortgage onwards, and computation of household debt based on net income) since late 2010, combined with the slew of cooling measures announced in Budget 2014 by the Government have successfully slowed property sales, in line with the desired results of the policy makers. Although the developers have been lobbying to loosen up some policies, we think this is unlikely to happen as household debt to GDP ratio remains relatively unchanged at 86.7% as at end-June 2014 vs 86.8% in end 2013. Affordability is still an issue as property prices have yet to have meaningful adjustments, although their growth has gradually tapered off.
Figure 8: YoY % change in house price index (HPI)
-10%
-5%
0%
5%
10%
15%
20%
25%
30%
1Q
07
3Q
07
1Q
08
3Q
08
1Q
09
3Q
09
1Q
10
3Q
10
1Q
11
3Q
11
1Q
12
3Q
12
1Q
13
3Q
13
1Q
14
Malaysia Penang Johor Sabah
Source: NAPIC
Lower transaction volume will hurt earnings growth
Given our expectations of the property market, we believe earnings growth for property developers will be rather flattish, especially in FY16. In our forecast, we have factored in the impact of slower sales and hence flat or negative earnings growth in FY16. Thematic angles and news flow for Iskandar and Penang as well as the Klang Valley seem to be lethargic. Disappointingly, the announcement of MRT Line 2 in end-October also did not generate any excitement on property stocks. Apart from the upcoming Penang transport master plan and high-speed rail projects, we do not foresee any major news flow going forward. The Penang property market could be more favourable as the weakening MYR should benefit exports and tourism, which are the key economic activities of the state. Both manufacturing and services sectors account for more than 90% of Penang’s economy. Hence, affordable housing players such as Tambun Indah should still fare better.
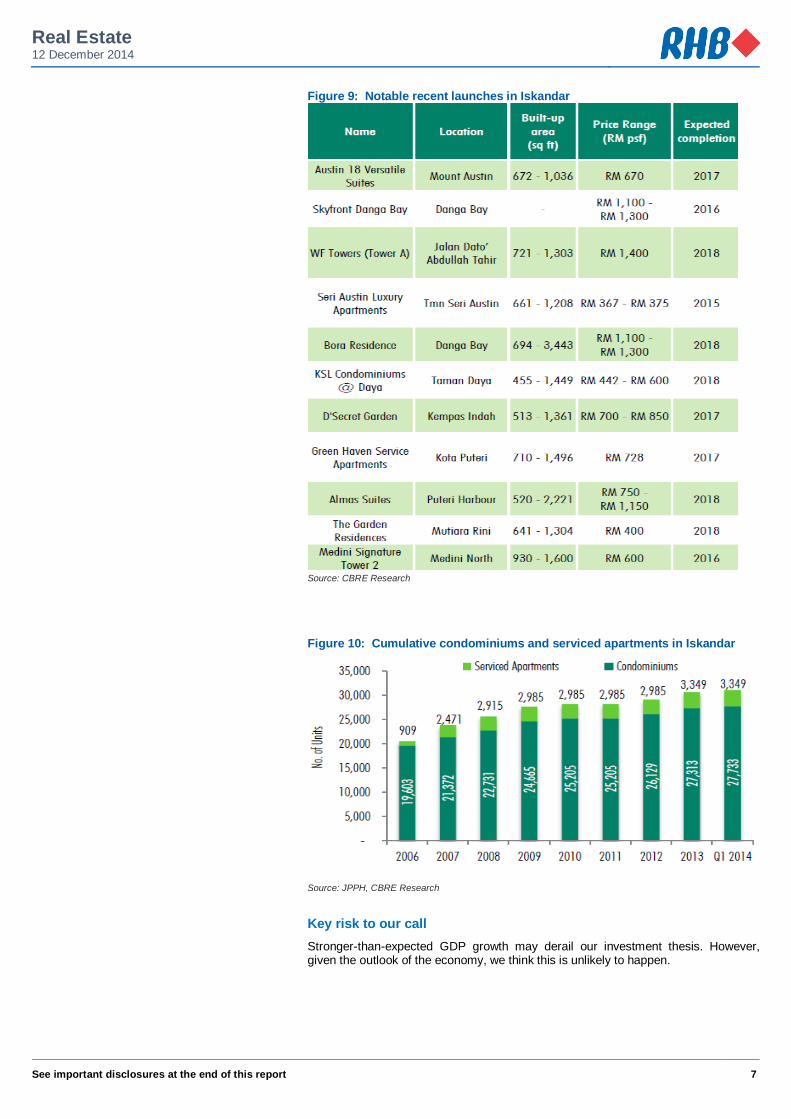
Meanwhile, the Iskandar market will remain challenging over the medium term as oversupply of housing, exacerbated by the incoming units to be built by foreign developers, will take years to be absorbed. According to CBRE, as at 1Q14, the existing supply of high-rise residential units in Iskandar stands at 31,082 units, while 28,874 units are under construction. This means that the existing supply will almost double in the next 3-4 years. Among the high-rise residential projects that will be completed over the next 3-4 years include Setia Sky 88, Tropex Residences, Paragon Residences, Sky Suites @ Meldrum and The Peak (One Temenggong).
Real Estate 12 December 2014
See important disclosures at the end of this report 7
Figure 9: Notable recent launches in Iskandar
Source: CBRE Research
Figure 10: Cumulative condominiums and serviced apartments in Iskandar
Source: JPPH, CBRE Research
Key risk to our call
Stronger-than-expected GDP growth may derail our investment thesis. However, given the outlook of the economy, we think this is unlikely to happen.
Real Estate 12 December 2014
See important disclosures at the end of this report 8
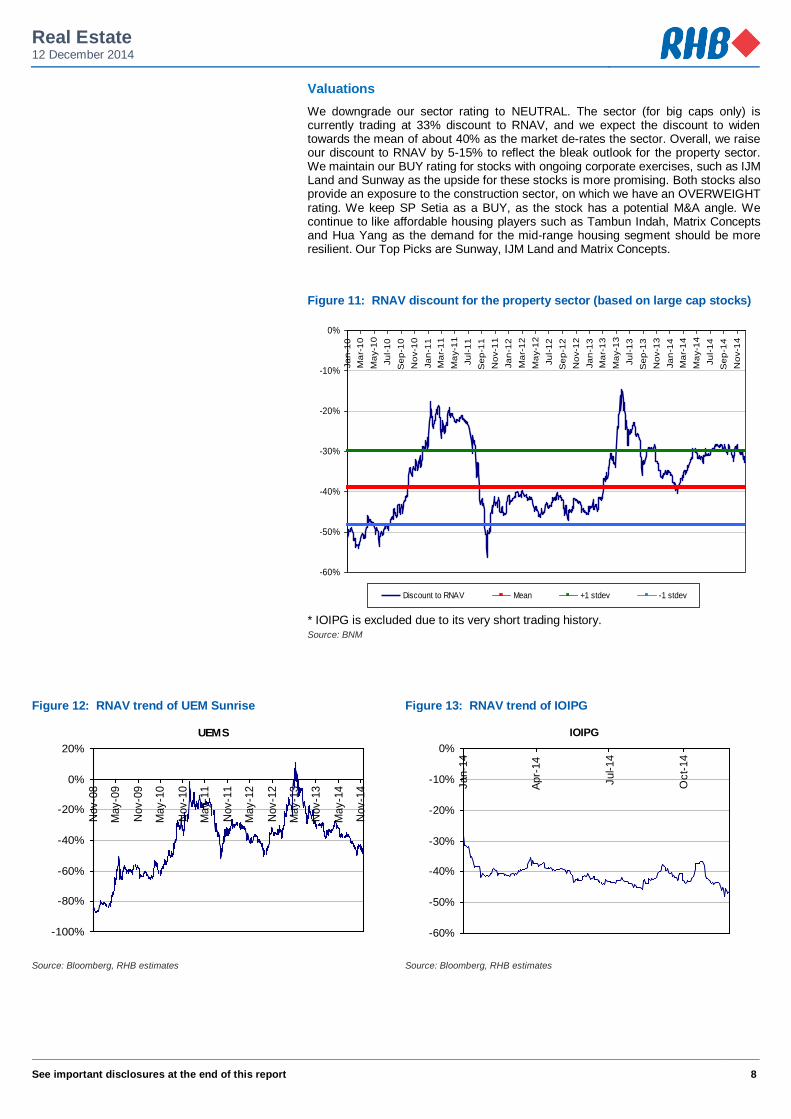
Valuations
We downgrade our sector rating to NEUTRAL. The sector (for big caps only) is currently trading at 33% discount to RNAV, and we expect the discount to widen towards the mean of about 40% as the market de-rates the sector. Overall, we raise our discount to RNAV by 5-15% to reflect the bleak outlook for the property sector. We maintain our BUY rating for stocks with ongoing corporate exercises, such as IJM Land and Sunway as the upside for these stocks is more promising. Both stocks also provide an exposure to the construction sector, on which we have an OVERWEIGHT rating. We keep SP Setia as a BUY, as the stock has a potential M&A angle. We continue to like affordable housing players such as Tambun Indah, Matrix Concepts and Hua Yang as the demand for the mid-range housing segment should be more resilient. Our Top Picks are Sunway, IJM Land and Matrix Concepts.
Figure 11: RNAV discount for the property sector (based on large cap stocks)
-60%
-50%
-40%
-30%
-20%
-10%
0%
Ja
n-1
0
Ma
r-1
0
Ma
y-1
0
Ju
l-1
0
Se
p-1
0
No
v-1
0
Ja
n-1
1
Ma
r-1
1
Ma
y-1
1
Ju
l-1
1
Se
p-1
1
No
v-1
1
Ja
n-1
2
Ma
r-1
2
Ma
y-1
2
Ju
l-1
2
Se
p-1
2
No
v-1
2
Ja
n-1
3
Ma
r-1
3
Ma
y-1
3
Ju
l-1
3
Se
p-1
3
No
v-1
3
Ja
n-1
4
Ma
r-1
4
Ma
y-1
4
Ju
l-1
4
Se
p-1
4
No
v-1
4
Discount to RNAV Mean +1 stdev -1 stdev
* IOIPG is excluded due to its very short trading history. Source: BNM
Figure 12: RNAV trend of UEM Sunrise Figure 13: RNAV trend of IOIPG
UEMS
-100%
-80%
-60%
-40%
-20%
0%
20%
Nov-0
8
May-0
9
Nov-0
9
May-1
0
Nov-1
0
May-1
1
Nov-1
1
May-1
2
Nov-1
2
May-1
3
Nov-1
3
May-1
4
Nov-1
4
IOIPG
-60%
-50%
-40%
-30%
-20%
-10%
0%
Jan-1
4
Apr-
14
Jul-14
Oct-
14
Source: Bloomberg, RHB estimates Source: Bloomberg, RHB estimates
Real Estate 12 December 2014
See important disclosures at the end of this report 9
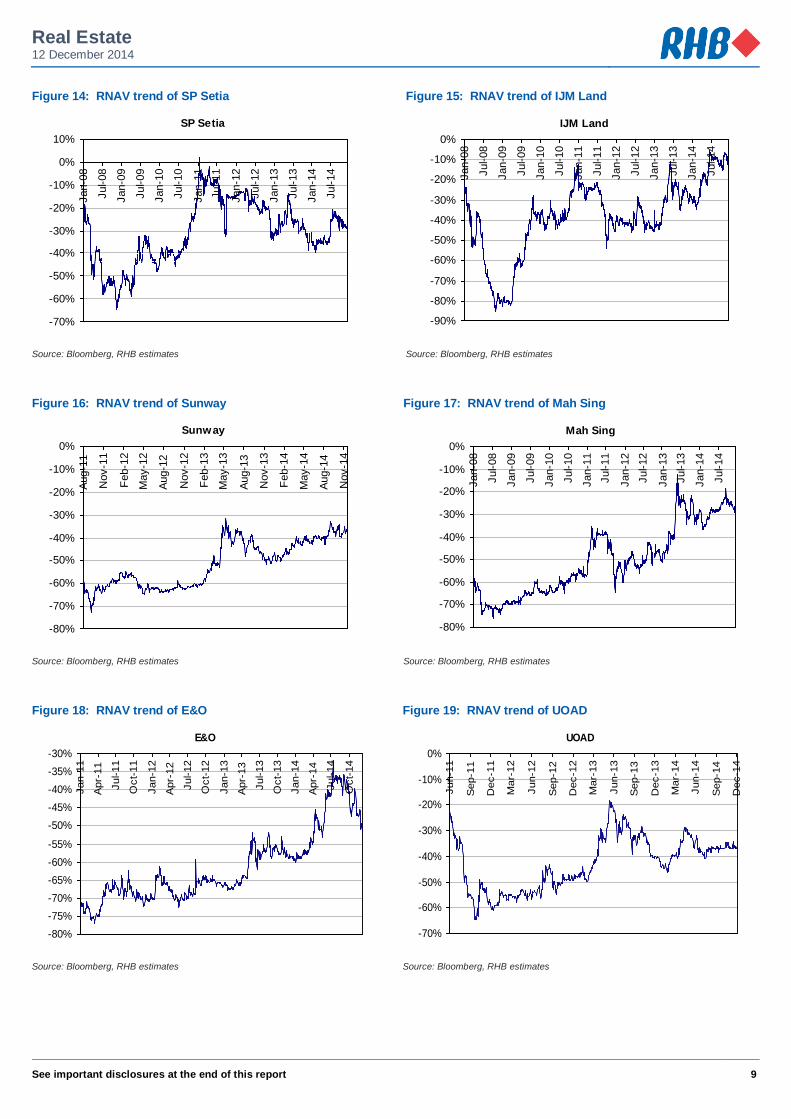
Figure 14: RNAV trend of SP Setia Figure 15: RNAV trend of IJM Land
SP Setia
-70%
-60%
-50%
-40%
-30%
-20%
-10%
0%
10%
Jan-0
8
Jul-08
Jan-0
9
Jul-09
Jan-1
0
Jul-10
Jan-1
1
Jul-11
Jan-1
2
Jul-12
Jan-1
3
Jul-13
Jan-1
4
Jul-14
IJM Land
-90%
-80%
-70%
-60%
-50%
-40%
-30%
-20%
-10%
0%
Jan-0
8
Jul-08
Jan-0
9
Jul-09
Jan-1
0
Jul-10
Jan-1
1
Jul-11
Jan-1
2
Jul-12
Jan-1
3
Jul-13
Jan-1
4
Jul-14
Source: Bloomberg, RHB estimates Source: Bloomberg, RHB estimates
Figure 16: RNAV trend of Sunway Figure 17: RNAV trend of Mah Sing
Sunway
-80%
-70%
-60%
-50%
-40%
-30%
-20%
-10%
0%
Aug-1
1
Nov-1
1
Feb-1
2
May-1
2
Aug-1
2
Nov-1
2
Feb-1
3
May-1
3
Aug-1
3
Nov-1
3
Feb-1
4
May-1
4
Aug-1
4
Nov-1
4
Mah Sing
-80%
-70%
-60%
-50%
-40%
-30%
-20%
-10%
0%
Jan-0
8
Jul-08
Jan-0
9
Jul-09
Jan-1
0
Jul-10
Jan-1
1
Jul-11
Jan-1
2
Jul-12
Jan-1
3
Jul-13
Jan-1
4
Jul-14
Source: Bloomberg, RHB estimates Source: Bloomberg, RHB estimates
Figure 18: RNAV trend of E&O Figure 19: RNAV trend of UOAD
E&O
-80%
-75%
-70%
-65%
-60%
-55%
-50%
-45%
-40%
-35%
-30%
Jan-1
1
Apr-
11
Jul-11
Oct-
11
Jan-1
2
Apr-
12
Jul-12
Oct-
12
Jan-1
3
Apr-
13
Jul-13
Oct-
13
Jan-1
4
Apr-
14
Jul-14
Oct-
14
UOAD
-70%
-60%
-50%
-40%
-30%
-20%
-10%
0%
Jun-1
1
Sep-1
1
Dec-1
1
Mar-
12
Jun-1
2
Sep-1
2
Dec-1
2
Mar-
13
Jun-1
3
Sep-1
3
Dec-1
3
Mar-
14
Jun-1
4
Sep-1
4
Dec-1
4
Source: Bloomberg, RHB estimates Source: Bloomberg, RHB estimates
Real Estate 12 December 2014
See important disclosures at the end of this report 10
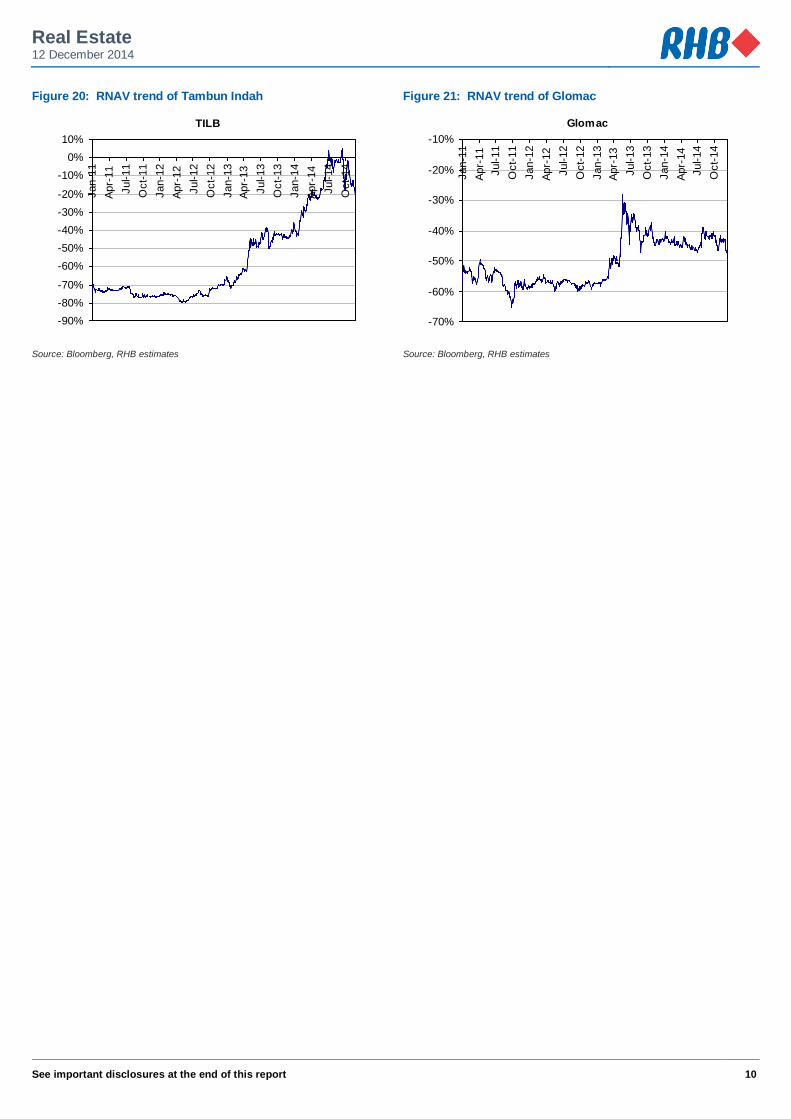
Figure 20: RNAV trend of Tambun Indah Figure 21: RNAV trend of Glomac
TILB
-90%
-80%
-70%
-60%
-50%
-40%
-30%
-20%
-10%
0%
10%
Jan-1
1
Apr-
11
Jul-11
Oct-
11
Jan-1
2
Apr-
12
Jul-12
Oct-
12
Jan-1
3
Apr-
13
Jul-13
Oct-
13
Jan-1
4
Apr-
14
Jul-14
Oct-
14
Glomac
-70%
-60%
-50%
-40%
-30%
-20%
-10%
Jan-1
1
Apr-
11
Jul-11
Oct-
11
Jan-1
2
Apr-
12
Jul-12
Oct-
12
Jan-1
3
Apr-
13
Jul-13
Oct-
13
Jan-1
4
Apr-
14
Jul-14
Oct-
14
Source: Bloomberg, RHB estimates Source: Bloomberg, RHB estimates
11
RHB Guide to Investment Ratings Buy: Share price may exceed 10% over the next 12 months
Trading Buy: Share price may exceed 15% over the next 3 months, however longer-term outlook remains uncertain Neutral: Share price may fall within the range of +/- 10% over the next 12 months Take Profit: Target price has been attained. Look to accumulate at lower levels
Sell: Share price may fall by more than 10% over the next 12 months Not Rated: Stock is not within regular research coverage
Disclosure & Disclaimer
All research is based on material compiled from data considered to be reliable at the time of writing, but RHB does not make any representation or warranty, express or implied, as to its accuracy, completeness or correctness. No part of this report is to be construed as an offer or solicitation of an offer to transact any securities or financial instruments whether referred to herein or otherwise. This report is general in nature and has been prepared for
information purposes only. It is intended for circulation to the clients of RHB and its related companies. Any recommendation contained in this report does not have regard to the specific investment objectives, financial situation and the particular needs of any specific addressee. This report is for the information of addressees only and is not to be taken in substitution for the exercise of judgment by addressees, who should obtain separate legal or
financial advice to independently evaluate the particular investments and strategies. RHB, its affiliates and related companies, their respective directors, associates, connected parties and/or employees may own or have positions in
securities of the company(ies) covered in this research report or any securities related thereto, and may from time to time add to, or dispose off, or may be materially interested in any such securities. Further, RHB, its affiliates and related companies do and seek to do business with the company(ies) covered in this research report and may from time to time act as market maker or have assumed an underwriting commitment in securities of such company(ies),
may sell them or buy them from customers on a principal basis and may also perform or seek to perform significant investment banking, advisory or underwriting services for or relating to such company(ies), as well as solicit such investment, advisory or other services from any entity mentioned in this research report.
RHB and its employees and/or agents do not accept any liability, be it directly, indirectly or consequential losses, loss of profits or damages that may arise from any reliance based on this report or further communication given in relation to this report, including where such losses, loss of profits or damages
are alleged to have arisen due to the contents of such report or communication being perceived as defamatory in nature. The term “RHB” shall denote where applicable, the relevant entity distributing the report in the particular jurisdiction ment ioned specifically herein below
and shall refer to RHB Research Institute Sdn Bhd, its holding company, affiliates, subsidiaries and related companies.
All Rights Reserved. This report is for the use of intended recipients only and may not be reproduced, distributed or published for any purpose without prior consent of RHB and RHB accepts no liability whatsoever for the actions of third parties in this respect. Malaysia
This report is published and distributed in Malaysia by RHB Research Institute Sdn Bhd (233327-M), Level 11, Tower One, RHB Centre, Jalan Tun Razak, 50400 Kuala Lumpur, a wholly-owned subsidiary of RHB Investment Bank Berhad (RHBIB), which in turn is a wholly-owned subsidiary of RHB Capital
Berhad. Singapore
This report is published and distributed in Singapore by DMG & Partners Research Pte Ltd (Reg. No. 200808705N), a wholly-owned subsidiary of DMG & Partners Securities Pte Ltd, a joint venture between Deutsche Asia Pacific Holdings Pte Ltd (a subsidiary of Deutsche Bank Group) and OSK Investment
Bank Berhad, Malaysia which have since merged into RHB Investment Bank Berhad (the merged entity is referred to as “RHBIB”, which in turn is a wholly-owned subsidiary of RHB Capital Berhad). DMG & Partners Securities Pte Ltd is a Member of the Singapore Exchange Securities T rading Limited. DMG & Partners Securities Pte Ltd may have received compensation from the company covered in this report for its corporate finance or its dealing activities; this
report is therefore classified as a non-independent report. As of 5 September 2013, DMG & Partners Securities Pte Ltd and its subsidiaries, including DMG & Partners Research Pte Ltd, do not have proprietary
positions in the securities covered in this report, except for: a) -
As of 5 September 2013, none of the analysts who covered the securities in this report has an interest in such securities, except for: a) -
Special Distribution by RHB
Where the research report is produced by an RHB entity (excluding DMG & Partners Research Pte Ltd) and distributed in Singapore, it is only distributed to "Institutional Investors", "Expert Investors" or "Accredited Investors" as defined in the Securities and Futures Act, CAP. 289 of Singapore. If you are not an "Institutional Investor", "Expert Investor" or "Accredited Investor", this research report is not intended for you and you should disregard this research
report in its entirety. In respect of any matters arising from, or in connection with this research report, you are to contact our Singapore Office, DMG & Partners Securities Pte Ltd.
Hong Kong This report is published and distributed in Hong Kong by RHB OSK Securities Hong Kong Limited (“RHBSHK”) (formerly known as OSK Securities Hong
Kong Limited), a subsidiary of OSK Investment Bank Berhad, Malaysia which have since merged into RHB Investment Bank Berhad (the merged entity is referred to as “RHBIB”), which in turn is a wholly-owned subsidiary of RHB Capital Berhad.
RHBSHK, RHBIB and/or other affiliates may beneficially own a total of 1% or more of any class of common equity securit ies of the subject company. RHBSHK, RHBIB and/or other affiliates may, within the past 12 months, have received compensation and/or within the next 3 months seek to obtain compensation for investment banking services from the subject company.
12
Risk Disclosure Statements The prices of securities fluctuate, sometimes dramatically. The price of a security may move up or down, and may become valueless. It is as likely that
losses will be incurred rather than profit made as a result of buying and selling securities. Past performance is not a guide to future performance. RHBSHK does not maintain a predetermined schedule for publication of research and will not necessarily update this report
Indonesia This report is published and distributed in Indonesia by PT RHB OSK Securities Indonesia (formerly known as PT OSK Nusadana Securities Indonesia), a
subsidiary of OSK Investment Bank Berhad, Malaysia, which have since merged into RHB Investment Bank Berhad, which in turn is a wholly-owned subsidiary of RHB Capital Berhad.
Thailand This report is published and distributed in Thailand by RHB OSK Securities (Thailand) PCL (formerly known as OSK Securities (Thailand) PCL), a
subsidiary of OSK Investment Bank Berhad, Malaysia, which have since merged into RHB Investment Bank Berhad, which in turn is a wholly-owned subsidiary of RHB Capital Berhad.
Other Jurisdictions In any other jurisdictions, this report is intended to be distributed to qualified, accredited and professional investors, in compliance with the law and
regulations of the jurisdictions.
DMG & Partners Research Guide to Investment Ratings Buy: Share price may exceed 10% over the next 12 months
Trading Buy: Share price may exceed 15% over the next 3 months, however longer-term outlook remains uncertain Neutral: Share price may fall within the range of +/- 10% over the next 12 months Take Profit: Target price has been attained. Look to accumulate at lower levels
Sell: Share price may fall by more than 10% over the next 12 months Not Rated: Stock is not within regular research coverage
DISCLAIMERS
This research is issued by DMG & Partners Research Pte Ltd and it is for general distribution only. It does not have any regard to the specific investment objectives, financial situation and particular needs of any specific recipient of this research report. You should independently evaluate particular investments and consult an independent financial adviser before making any investments or entering into any transaction in relation to any securities or investment instruments mentioned in this report.
The information contained herein has been obtained from sources we believed to be reliable but we do not make any representat ion or warranty nor accept any responsibility or liability as to its accuracy, completeness or correctness. Opinions and views expressed in this report are subject to change
without notice. This report does not constitute or form part of any offer or solicitation of any offer to buy or sell any securities.
DMG & Partners Research Pte Ltd is a wholly-owned subsidiary of DMG & Partners Securities Pte Ltd, a joint venture between OSK Investment Bank Berhad, Malaysia which have since merged into RHB Investment Bank Berhad (the merged entity is referred to as “RHBIB” which in turn is a wholly-
owned subsidiary of RHB Capital Berhad) and Deutsche Asia Pacific Holdings Pte Ltd (a subsidiary of Deutsche Bank Group). DMG & Partners Securities Pte Ltd is a Member of the Singapore Exchange Securities Trading Limited.
DMG & Partners Securities Pte Ltd and their associates, directors, and/or employees may have positions in, and may effect transactions in the securities covered in the report, and may also perform or seek to perform broking and other corporate finance related services for the corporations whose securities are covered in the report. This report is therefore classified as a non-independent report.
As of 5 September 2013, DMG & Partners Securities Pte Ltd and its subsidiaries, including DMG & Partners Research Pte Ltd, do not have proprietary positions in the subject companies, except for:
a) - As of 5 September 2013, none of the analysts who covered the stock in this report has an interest in the subject companies covered in this report, except
for: a) -
DMG & Partners Research Pte. Ltd. (Reg. No. 200808705N)
Kuala Lumpur Hong Kong Singapore
Malaysia Research Office
RHB Research Institute Sdn Bhd Level 11, Tower One, RHB Centre
Jalan Tun Razak Kuala Lumpur
Malaysia Tel : +(60) 3 9280 2185 Fax : +(60) 3 9284 8693
RHB OSK Securities Hong Kong Ltd.
(formerly known as OSK Securities Hong Kong Ltd.) 12th Floor
World-Wide House 19 Des Voeux Road Central, Hong Kong
Tel : +(852) 2525 1118 Fax : +(852) 2810 0908
DMG & Partners
Securities Pte. Ltd. 10 Collyer Quay
#09-08 Ocean Financial Centre Singapore 049315
Tel : +(65) 6533 1818 Fax : +(65) 6532 6211
Jakarta Shanghai Phnom Penh
PT RHB OSK Securities Indonesia
(formerly known as PT OSK Nusadana Securities Indonesia)
Plaza CIMB Niaga 14th Floor
Jl. Jend. Sudirman Kav.25 Jakarta Selatan 12920, Indonesia
Tel : +(6221) 2598 6888 Fax : +(6221) 2598 6777
RHB OSK (China) Investment Advisory Co. Ltd.
(formerly known as OSK (China) Investment Advisory Co. Ltd.)
Suite 4005, CITIC Square 1168 Nanjing West Road
Shanghai 20041 China
Tel : +(8621) 6288 9611 Fax : +(8621) 6288 9633
RHB OSK Indochina Securities Limited
(formerly known as OSK Indochina Securities Limited)
No. 1-3, Street 271 Sangkat Toeuk Thla, Khan Sen Sok
Phnom Penh Cambodia
Tel: +(855) 23 969 161 Fax: +(855) 23 969 171
Bangkok
RHB OSK Securities (Thailand) PCL
(formerly known as OSK Securities (Thailand) PCL) 10th Floor, Sathorn Square Office Tower
98, North Sathorn Road,Silom Bangrak, Bangkok 10500
Thailand Tel: +(66) 862 9999
Fax : +(66) 108 0999


