Embed Size (px)
Citation preview

Issues andProspects
of thePhilippine
Corn Industry
Hazel Tanchuling
Editors:Editors:Editors:Editors:Editors:Joyce Sierra
Jessica Reyes-Cantos
RICE WATCH AND ACTION NETWORK
4
Issues and Prospects on the Philippine Corn Industry
Copyright 2007Rice Watch and Action NetworkAll rights reserved.
R1 encourages the use of this monograph, with appropriate creditgiven to the author and publisher. The content of this monographmay be reproduced by civil society groups for non-commercial pur-poses. Any form of reproduction, storage, in a retrieval system ortransmission by any means for commercial purposes requires R1’s per-mission.
Production management: Hazel TanchulingCover, layout & photography: Nonoy Regalado
5
Rice Watch and Action Network
Rationale
Corn is an important crop in the Philippines. Just like rice, itis also a staple for Filipinos specifically those from theSouthern Philippines.
Rice Watch and Action Network (R1) wanted to work on bothrice and corn in its earlier stage. However, the network decided toinitially focus on rice crops because corn was as complex a sectorwith multifaceted issues as rice. It might be difficult for R1 to pursuethe different issues covering the sector.
After two years of existence, R1 now sees the need to study thecorn sector and bring to the front of the network’s issues and agenda.But this is actually a perfect time to study the sector.
6
Issues and Prospects on the Philippine Corn Industry
In recent years, the rising cost of oil propels the need to developrenewable sources of energy such as the use of bio-fuels. The UnitedStates—a major producer of corn has been saving its corn producefor its bio fuel industry for some time now. This has pushed the cornprices at its highest in recent history. While the farmers are happyabout it, the livestock sector is not. Although consumed as food, corn’sother biggest purpose is the production of animal feeds. And thegrowing livestock and poultry sectors are already complaining aboutthe high cost of inputs.
To guide R1 in its attempt to develop its position on the cornsector, this paper provides an overview of the sector’s performance,the industry’s major issues and concerns as well as trends and expe-riences in the international market.
7
Rice Watch and Action Network
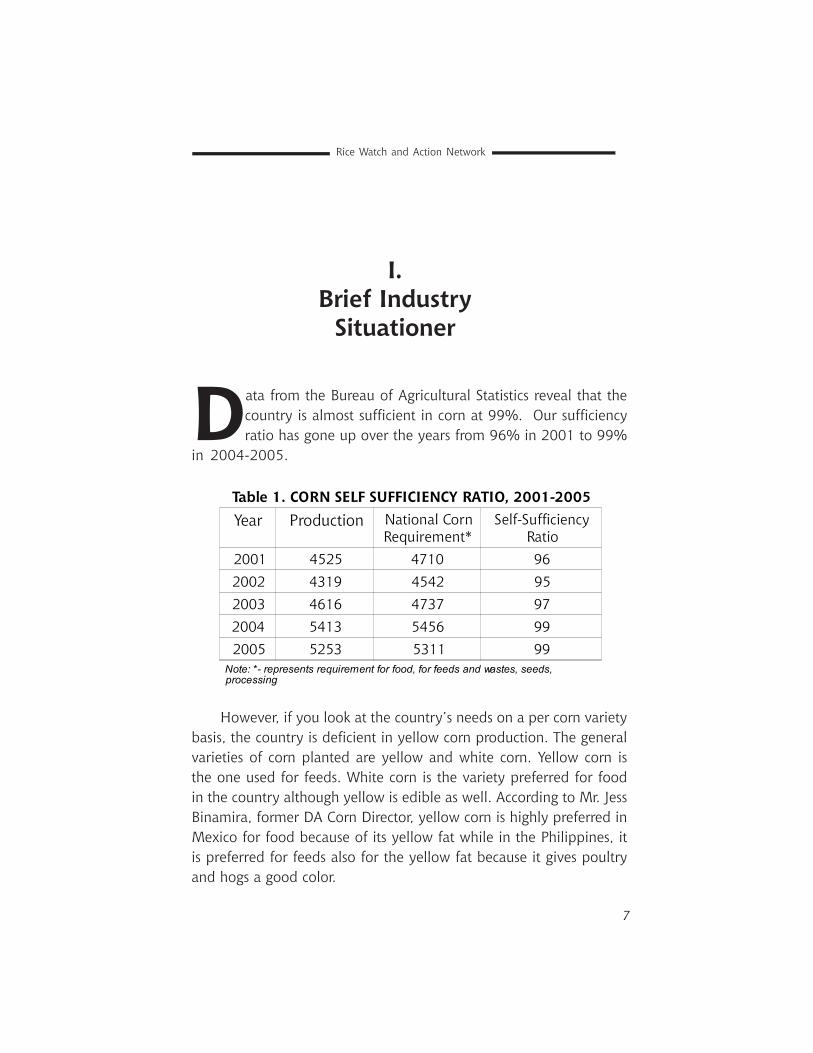
Table 1. CORN SELF SUFFICIENCY RATIO, 2001-2005Year Production National Corn
Requirement*Self-Sufficiency
Ratio2001 4525 4710 962002 4319 4542 952003 4616 4737 972004 5413 5456 992005 5253 5311 99
Note: *- represents requirement for food, for feeds and wastes, seeds,processing
However, if you look at the country’s needs on a per corn varietybasis, the country is deficient in yellow corn production. The generalvarieties of corn planted are yellow and white corn. Yellow corn isthe one used for feeds. White corn is the variety preferred for foodin the country although yellow is edible as well. According to Mr. JessBinamira, former DA Corn Director, yellow corn is highly preferred inMexico for food because of its yellow fat while in the Philippines, itis preferred for feeds also for the yellow fat because it gives poultryand hogs a good color.
Data from the Bureau of Agricultural Statistics reveal that thecountry is almost sufficient in corn at 99%. Our sufficiencyratio has gone up over the years from 96% in 2001 to 99%
in 2004-2005.
I.Brief Industry
Situationer
8
Issues and Prospects on the Philippine Corn Industry
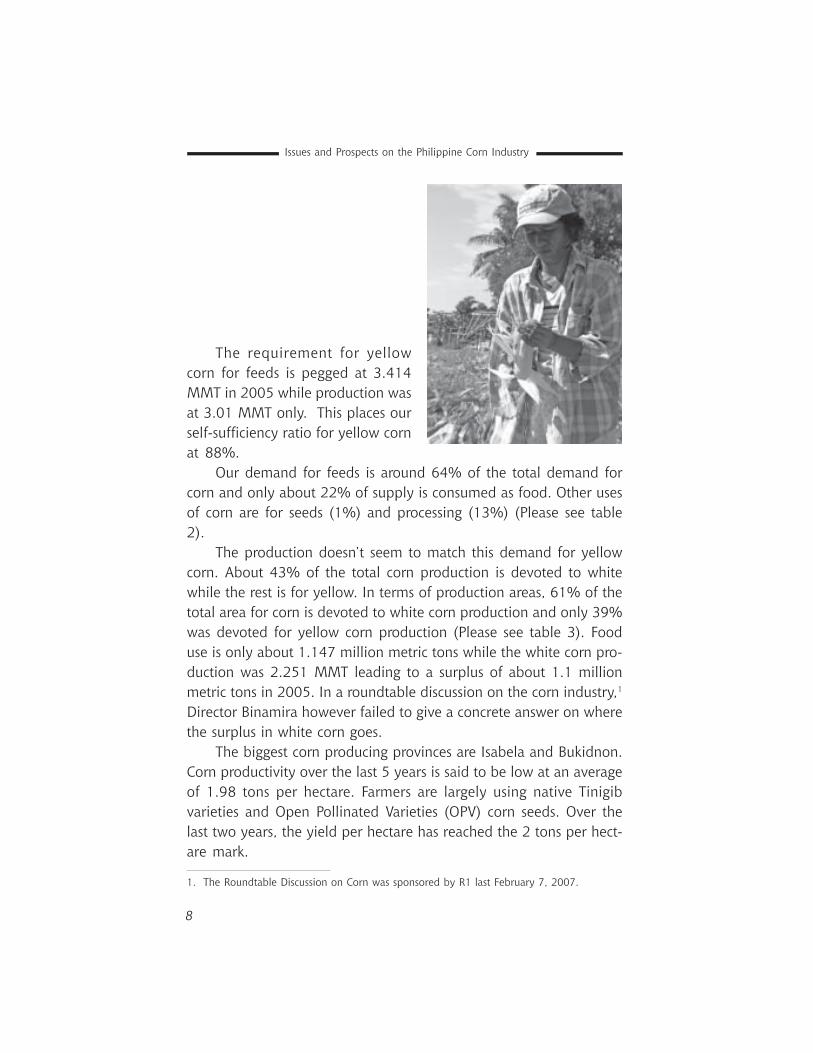
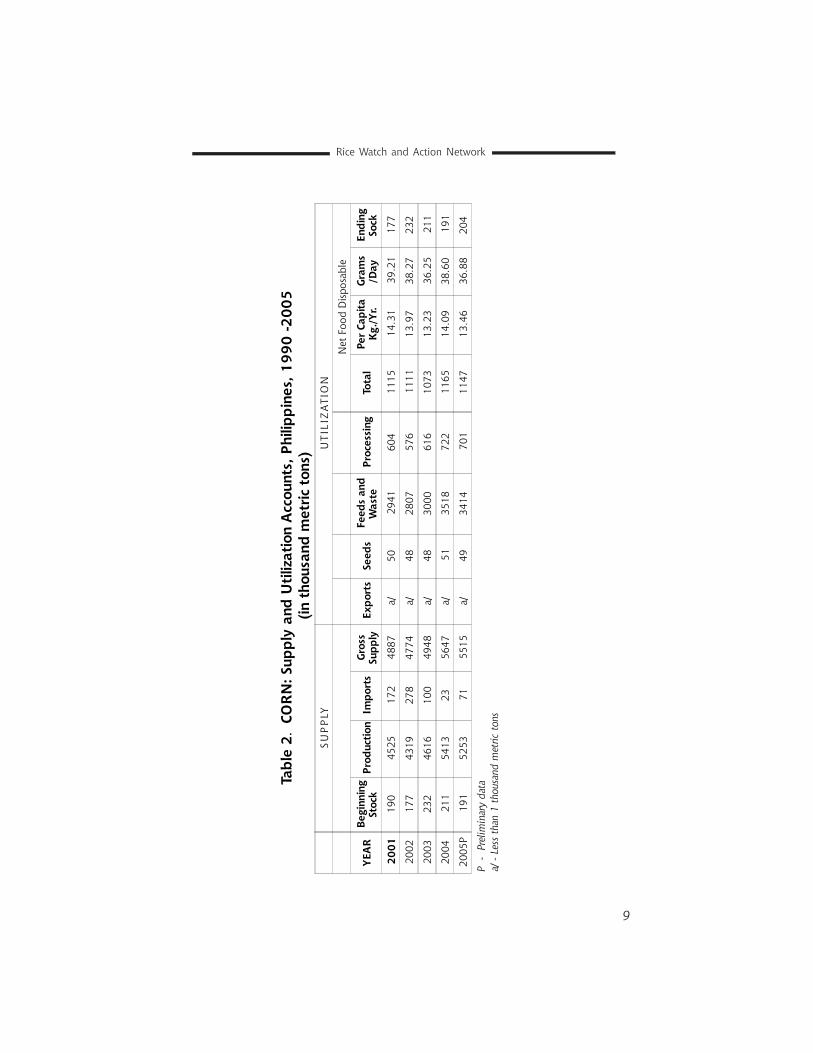
The requirement for yellowcorn for feeds is pegged at 3.414MMT in 2005 while production wasat 3.01 MMT only. This places ourself-sufficiency ratio for yellow cornat 88%.
Our demand for feeds is around 64% of the total demand forcorn and only about 22% of supply is consumed as food. Other usesof corn are for seeds (1%) and processing (13%) (Please see table2).
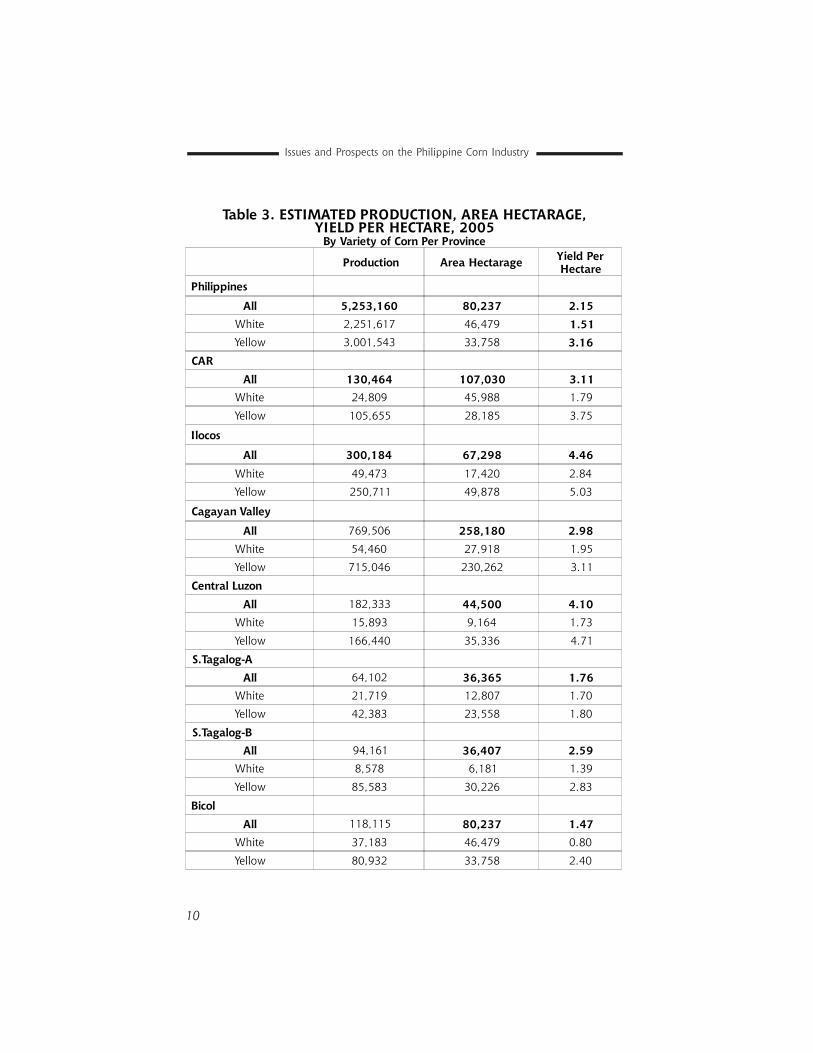
The production doesn’t seem to match this demand for yellowcorn. About 43% of the total corn production is devoted to whitewhile the rest is for yellow. In terms of production areas, 61% of thetotal area for corn is devoted to white corn production and only 39%was devoted for yellow corn production (Please see table 3). Fooduse is only about 1.147 million metric tons while the white corn pro-duction was 2.251 MMT leading to a surplus of about 1.1 millionmetric tons in 2005. In a roundtable discussion on the corn industry,1
Director Binamira however failed to give a concrete answer on wherethe surplus in white corn goes.
The biggest corn producing provinces are Isabela and Bukidnon.Corn productivity over the last 5 years is said to be low at an averageof 1.98 tons per hectare. Farmers are largely using native Tinigibvarieties and Open Pollinated Varieties (OPV) corn seeds. Over thelast two years, the yield per hectare has reached the 2 tons per hect-are mark.
1. The Roundtable Discussion on Corn was sponsored by R1 last February 7, 2007.
9
Rice Watch and Action Network
Tabl
e 2.
CO
RN
: Sup
ply
and
Util
izat
ion
Acc
ount
s, P
hilip
pine
s, 1
990
-200
5 (
in t
hous
and
met
ric t
ons)
SUP
PLY
UTI
LIZ
ATI
ON
Net
Foo
d D
ispos
able
YEA
RBe
ginn
ing
Stoc
kPr
oduc
tion
Impo
rts
Gros
sSu
pply
Expo
rts
Seed
sFe
eds
and
Was
tePr
oces
sing
Tota
lPe
r Ca
pita
Kg.
/Yr.
Gram
s/D
ayEn
ding
Sock
2001
190
4525
172
4887
a/50
2941
604
1115
14.3
139
.21
177
2002
177
4319
278
4774
a/48
2807
576
1111
13.9
738
.27
232
2003
232
4616
100
4948
a/48
3000
616
1073
13.2
336
.25
211
2004
211
5413
2356
47a/
5135
1872
211
6514
.09
38.6
019
1
2005
P19
152
5371
5515
a/49
3414
701
1147
13.4
636
.88
204
P -
Pre
limin
ary
data
a/ -
Less
than
1 th
ousa
nd m
etric
tons
10
Issues and Prospects on the Philippine Corn Industry
Table 3. ESTIMATED PRODUCTION, AREA HECTARAGE,YIELD PER HECTARE, 2005
By Variety of Corn Per Province
Production Area Hectarage Yield PerHectare
Philippines
All 5,253,160 80,237 2.15White 2,251,617 46,479 1.51Yellow 3,001,543 33,758 3.16
CARAll 130,464 107,030 3.11
White 24,809 45,988 1.79
Yellow 105,655 28,185 3.75
Ilocos
All 300,184 67,298 4.46White 49,473 17,420 2.84Yellow 250,711 49,878 5.03
Cagayan Valley
All 769,506 258,180 2.98White 54,460 27,918 1.95Yellow 715,046 230,262 3.11
Central LuzonAll 182,333 44,500 4.10
White 15,893 9,164 1.73
Yellow 166,440 35,336 4.71
S.Tagalog-AAll 64,102 36,365 1.76
White 21,719 12,807 1.70Yellow 42,383 23,558 1.80
S.Tagalog-BAll 94,161 36,407 2.59
White 8,578 6,181 1.39
Yellow 85,583 30,226 2.83
BicolAll 118,115 80,237 1.47
White 37,183 46,479 0.80
Yellow 80,932 33,758 2.40
11
Rice Watch and Action Network
Table 3. continued Production Area Hectarage Yield Per
HectareWestern Visayas
All 193,736 107,030 1.47White 52,821 45,988 0.80Yellow 140,915 61,042 2.40
Central Visyas
All 188,525 246,463 1.81White 170,859 235,094 1.15Yellow 17,666 11,369 2.31
Eastern Visayas
All 68,416 58,589 0.76White 63,772 55,264 0.73Yellow 4,644 3,325 1.55
Zamboanga PeninsulaAll 223,208 163,365 1.37
White 206,847 157,218 1.32
Yellow 16,361 6,147 2.66
Northern MindanaoAll 938,227 381,499 2.46
White 339,889 219,401 1.55Yellow 598,338 162,098 3.69
DavaoAll 293,413 200,409 1.46
White 215,174 172,257 1.25Yellow 78,239 28,152 2.78
SOCCSKSARGENAll 959,286 398,343 2.41
White 397,273 196,406 2.02
Yellow 562,013 201,937 2.78
CARAGAAll 98,595 55,765 1.77
White 75,521 49,129 1.54
Yellow 23,074 6,636 3.48
ARMMAll 630,889 265,328 2.38
White 517,346 227,651 2.27
Yellow 113,543 37,677 3.01
12
Issues and Prospects on the Philippine Corn Industry
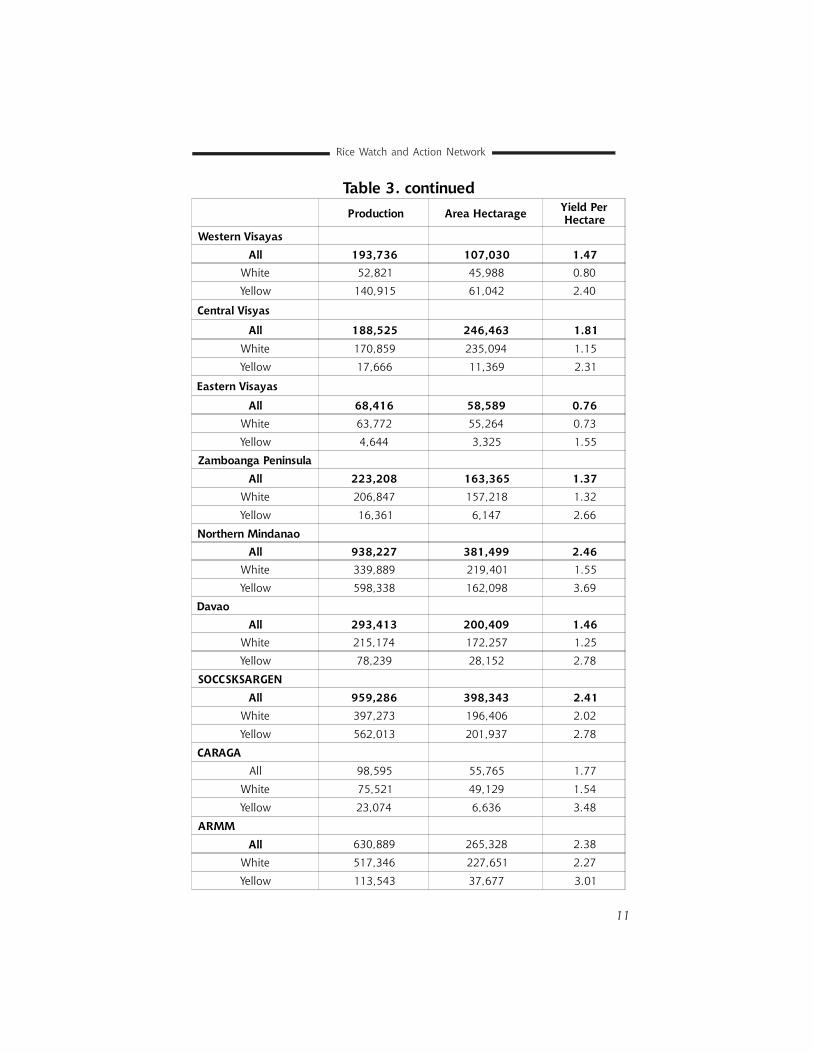
Topping the white corn producers are ARMM, SOCKSARGEN andNorthern Mindanao regions. The biggest yellow corn producers areCagayan Valley, Northern Mindanao and SOCKSARGEN regions. Sincelivestock raisers are mostly in Laguna, Batangas and Rizal inCALABARZON area, yellow corn are transported either as processedfeeds or raw materials to these areas.
Meanwhile, the country imports yellow corn as well as makeuse of cheaper corn substitutes to address the supply gap. Corn im-ports comprise 3% of the total importation in 2005 while corn sub-stitutes represent 13% and the bulk of these come from the US.
Corn substitutes are soybean meal, wheat, and the like that costlower than locally grown corn. Feedmillers, livestock and poultry in-dustries are trying to find ways to lower production costs and areusing cheaper corn substitutes as an option to tide them over theshortage. Feedmillers sometimes prefer imported corn because thisnormally meets the 14 percent moisture content requirement thatwould prevent formation of aflatoxin.
Prices of corn have increased from PH6.50 to Ph 7 rate before2004 to the current price of PH 12.20 per kilo.
13
Rice Watch and Action Network
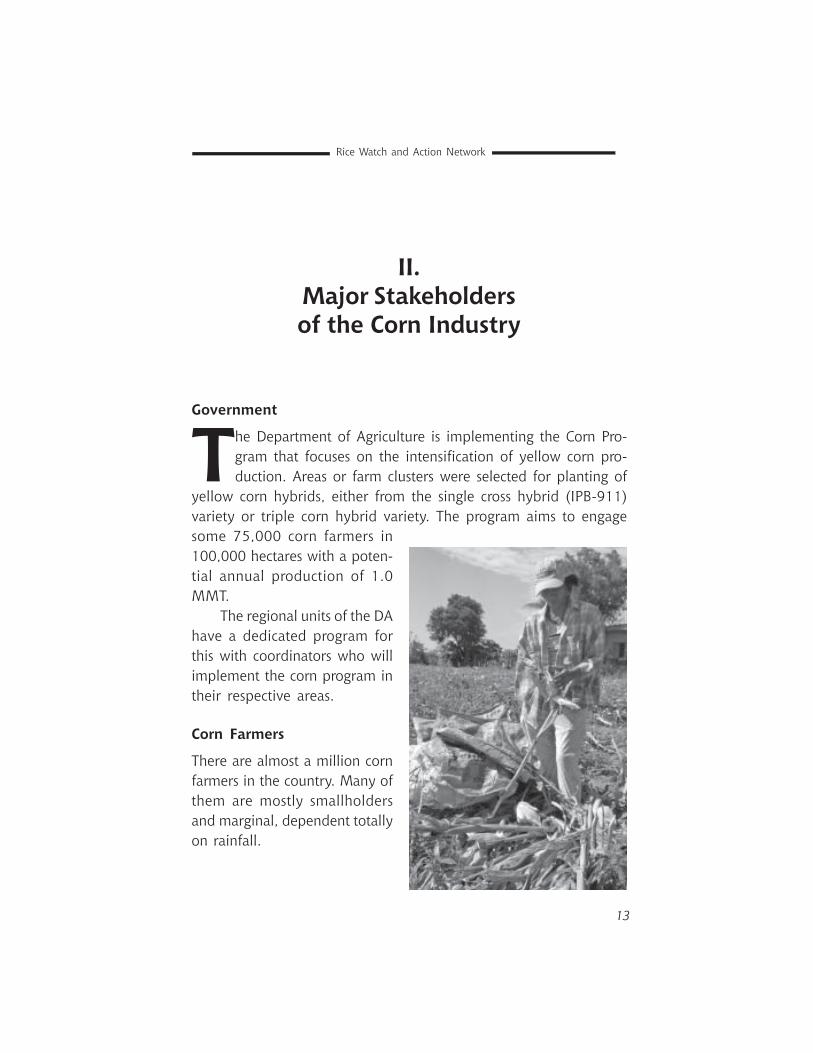
Government
The Department of Agriculture is implementing the Corn Pro-gram that focuses on the intensification of yellow corn pro-duction. Areas or farm clusters were selected for planting of
yellow corn hybrids, either from the single cross hybrid (IPB-911)variety or triple corn hybrid variety. The program aims to engagesome 75,000 corn farmers in100,000 hectares with a poten-tial annual production of 1.0MMT.
The regional units of the DAhave a dedicated program forthis with coordinators who willimplement the corn program intheir respective areas.
Corn Farmers
There are almost a million cornfarmers in the country. Many ofthem are mostly smallholdersand marginal, dependent totallyon rainfall.
II.Major Stakeholdersof the Corn Industry
14
Issues and Prospects on the Philippine Corn Industry
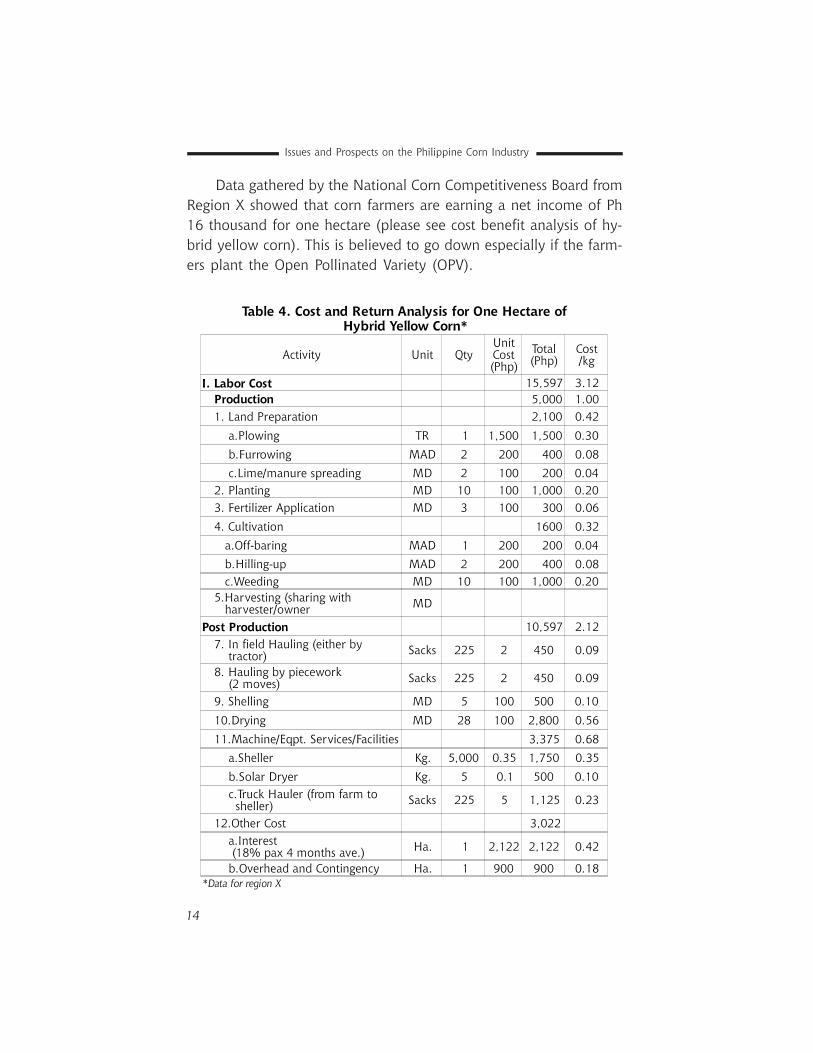
Data gathered by the National Corn Competitiveness Board fromRegion X showed that corn farmers are earning a net income of Ph16 thousand for one hectare (please see cost benefit analysis of hy-brid yellow corn). This is believed to go down especially if the farm-ers plant the Open Pollinated Variety (OPV).
Table 4. Cost and Return Analysis for One Hectare ofHybrid Yellow Corn*
Activity Unit QtyUnitCost(Php)
Total(Php)
Cost/kg
I. Labor Cost 15,597 3.12 Production 5,000 1.00 1. Land Preparation 2,100 0.42 a.Plowing TR 1 1,500 1,500 0.30 b.Furrowing MAD 2 200 400 0.08 c.Lime/manure spreading MD 2 100 200 0.04 2. Planting MD 10 100 1,000 0.20 3. Fertilizer Application MD 3 100 300 0.06 4. Cultivation 1600 0.32 a.Off-baring MAD 1 200 200 0.04 b.Hilling-up MAD 2 200 400 0.08 c.Weeding MD 10 100 1,000 0.20 5.Harvesting (sharing with harvester/owner MD
Post Production 10,597 2.12 7. In field Hauling (either by tractor) Sacks 225 2 450 0.09
8. Hauling by piecework (2 moves) Sacks 225 2 450 0.09
9. Shelling MD 5 100 500 0.10 10.Drying MD 28 100 2,800 0.56 11.Machine/Eqpt. Services/Facilities 3,375 0.68 a.Sheller Kg. 5,000 0.35 1,750 0.35 b.Solar Dryer Kg. 5 0.1 500 0.10 c.Truck Hauler (from farm to sheller) Sacks 225 5 1,125 0.23
12.Other Cost 3,022 a.Interest (18% pax 4 months ave.) Ha. 1 2,122 2,122 0.42
b.Overhead and Contingency Ha. 1 900 900 0.18*Data for region X
15
Rice Watch and Action Network
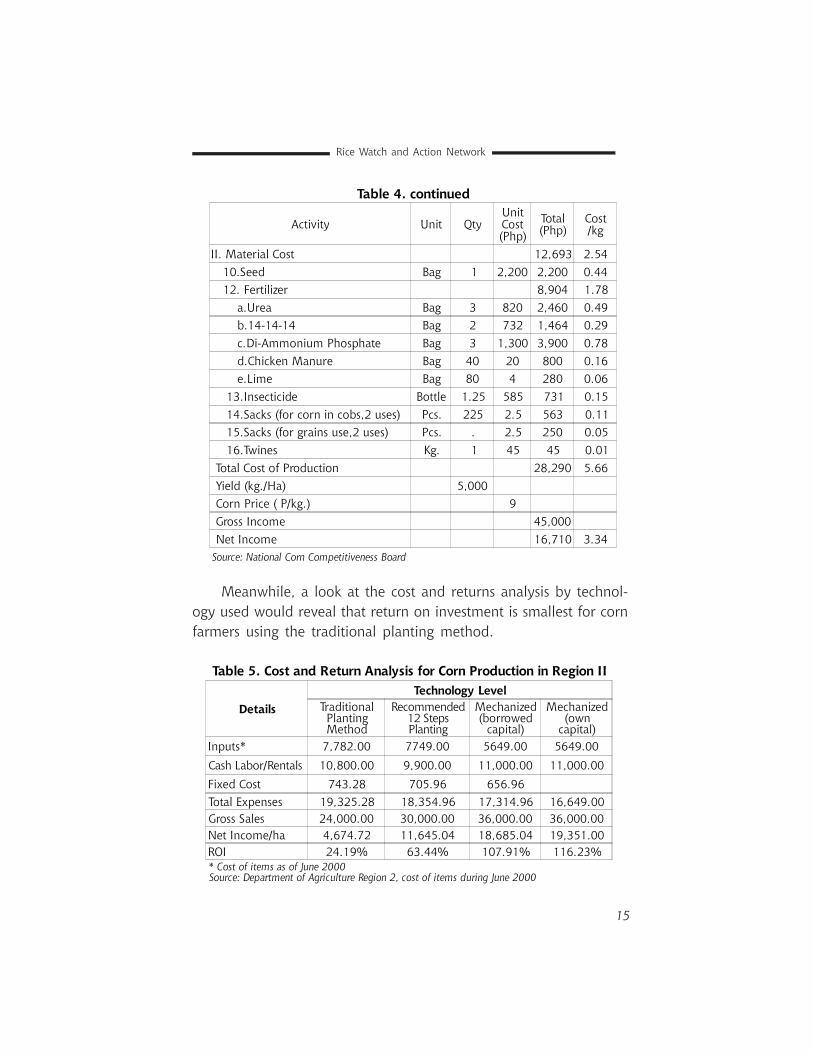
Meanwhile, a look at the cost and returns analysis by technol-ogy used would reveal that return on investment is smallest for cornfarmers using the traditional planting method.
Table 4. continued
Activity Unit QtyUnitCost(Php)
Total(Php)
Cost/kg
II. Material Cost 12,693 2.54 10.Seed Bag 1 2,200 2,200 0.44 12. Fertilizer 8,904 1.78 a.Urea Bag 3 820 2,460 0.49 b.14-14-14 Bag 2 732 1,464 0.29 c.Di-Ammonium Phosphate Bag 3 1,300 3,900 0.78 d.Chicken Manure Bag 40 20 800 0.16 e.Lime Bag 80 4 280 0.06 13.Insecticide Bottle 1.25 585 731 0.15 14.Sacks (for corn in cobs,2 uses) Pcs. 225 2.5 563 0.11 15.Sacks (for grains use,2 uses) Pcs. . 2.5 250 0.05 16.Twines Kg. 1 45 45 0.01 Total Cost of Production 28,290 5.66 Yield (kg./Ha) 5,000 Corn Price ( P/kg.) 9 Gross Income 45,000 Net Income 16,710 3.34Source: National Corn Competitiveness Board
Table 5. Cost and Return Analysis for Corn Production in Region II
DetailsTechnology Level
TraditionalPlantingMethod
Recommended12 StepsPlanting
Mechanized(borrowed
capital)
Mechanized(own
capital)Inputs* 7,782.00 7749.00 5649.00 5649.00Cash Labor/Rentals 10,800.00 9,900.00 11,000.00 11,000.00Fixed Cost 743.28 705.96 656.96Total Expenses 19,325.28 18,354.96 17,314.96 16,649.00Gross Sales 24,000.00 30,000.00 36,000.00 36,000.00Net Income/ha 4,674.72 11,645.04 18,685.04 19,351.00ROI 24.19% 63.44% 107.91% 116.23%* Cost of items as of June 2000Source: Department of Agriculture Region 2, cost of items during June 2000
16
Issues and Prospects on the Philippine Corn Industry
A group of corn farmers have formed PHILMAIZE or the Philip-pine Federation of Corn Producers. It has around 3000 membersnationwide and is quite supportive of emerging technologies in corn,including BT corn or genetically-engineered corn. PHILMAIZE sits atthe National Corn Competitiveness Board as the corn producer rep-resentative.
Meanwhile, the National Corn Competitiveness Board is a pri-vate sector initiative that brings together all the stakeholders of theindustry-from input suppliers, producers, transport and logistics tofeedmillers and end users. It aims to raise the level of competitive-ness of the industry by jointly solving problems from pre-productionto post production issues.
Feedmillers
Feedmillers are the ones who process yellow corn as feeds. The endusers of feeds are the livestock and poultry sectors. The PhilippineAssociation of Feed Millers, Incorporated (PAFMI) represents someof the biggest stakeholders in the feedmilling sector. PAFMI is com-posed of companies also known to have big stakes in agri-agro pro-duction, like San Miguel Foods, VITARICH, General Milling Corpora-tion, Universal Robina Corporation, Swift Foods, Liberty Flour Mills,Far East Agricultural Supply, Foremost Farms, Purefoods Corporationand a lot more from the big agribusiness companies.
In 2006, PAFMI requested the government to increase the WTO-approved Minimum Access Volume (MAV) Plus mechanism increas-ing corn imports from 216,000 tons to 336,000 tons or 120,000tons more. This would allow the Philippines to import corn at thepreferred tariff duty of 35 percent as opposed to over-MAV tariffrate of 50.2
2. http://www.grains.org/galleries/market_perspectives/Market%20Perspectives%206- 2-06.pdf, US Grains Council, 2 JUNE 2006 MARKET PERSPECTIVES
17
Rice Watch and Action Network
Livestock and Poultry Sector
Both the livestock and poultry industries are among the end users ofcorn. Livestock industry includes the swine, carabao, cattle, goat anddairy industries. The demand for corn by the livestock and poultrysectors is expected to increase by 1 million metric tons in 2007.
The swine industry dominates this sector. For the swine industryalone, the three top-producing provinces are Batangas, Laguna andRizal. By region, Central Luzon produces the highest number of swinesat 15.86% in 2005 followed by CALABARZON at 13.42%.
Meanwhile, the poultry sector, particularly the broiler industryis also expected to grow. The industry’s 2005 output totalled 1.215million metric tons in liveweight, valued at P48.07 billion. It com-prises 73% of the total value of poultry production at P79.687 bil-lion. The broiler egg production contributes about Ph20.820 billionpesos in additional production value.
Both sectors are complaining of increasing costs of inputs. Ac-cording to the hogs sector, the high cost of inputs such as importedsoybean meal and corn pushes pork and poultry prices to rise.
Corn is about 20% of the total costs in hog production and 21%in poultry. Over-all, the feeds’ cost constitutes about 40% in the costof total swine production and about 60% in poultry. Prices of inputs
18
Issues and Prospects on the Philippine Corn Industry
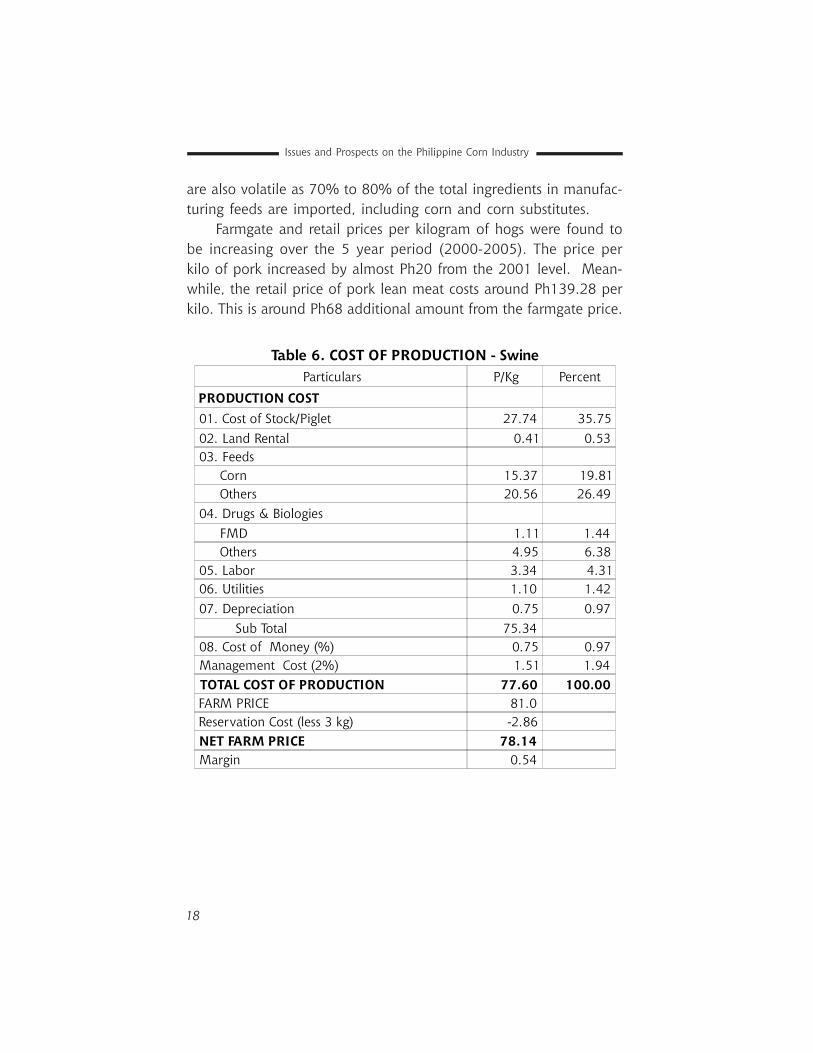
Table 6. COST OF PRODUCTION - SwineParticulars P/Kg Percent
PRODUCTION COST01. Cost of Stock/Piglet 27.74 35.7502. Land Rental 0.41 0.5303. Feeds Corn 15.37 19.81 Others 20.56 26.4904. Drugs & Biologies FMD 1.11 1.44 Others 4.95 6.3805. Labor 3.34 4.3106. Utilities 1.10 1.4207. Depreciation 0.75 0.97 Sub Total 75.3408. Cost of Money (%) 0.75 0.97Management Cost (2%) 1.51 1.94TOTAL COST OF PRODUCTION 77.60 100.00FARM PRICE 81.0Reservation Cost (less 3 kg) -2.86NET FARM PRICE 78.14Margin 0.54
are also volatile as 70% to 80% of the total ingredients in manufac-turing feeds are imported, including corn and corn substitutes.
Farmgate and retail prices per kilogram of hogs were found tobe increasing over the 5 year period (2000-2005). The price perkilo of pork increased by almost Ph20 from the 2001 level. Mean-while, the retail price of pork lean meat costs around Ph139.28 perkilo. This is around Ph68 additional amount from the farmgate price.
19
Rice Watch and Action Network
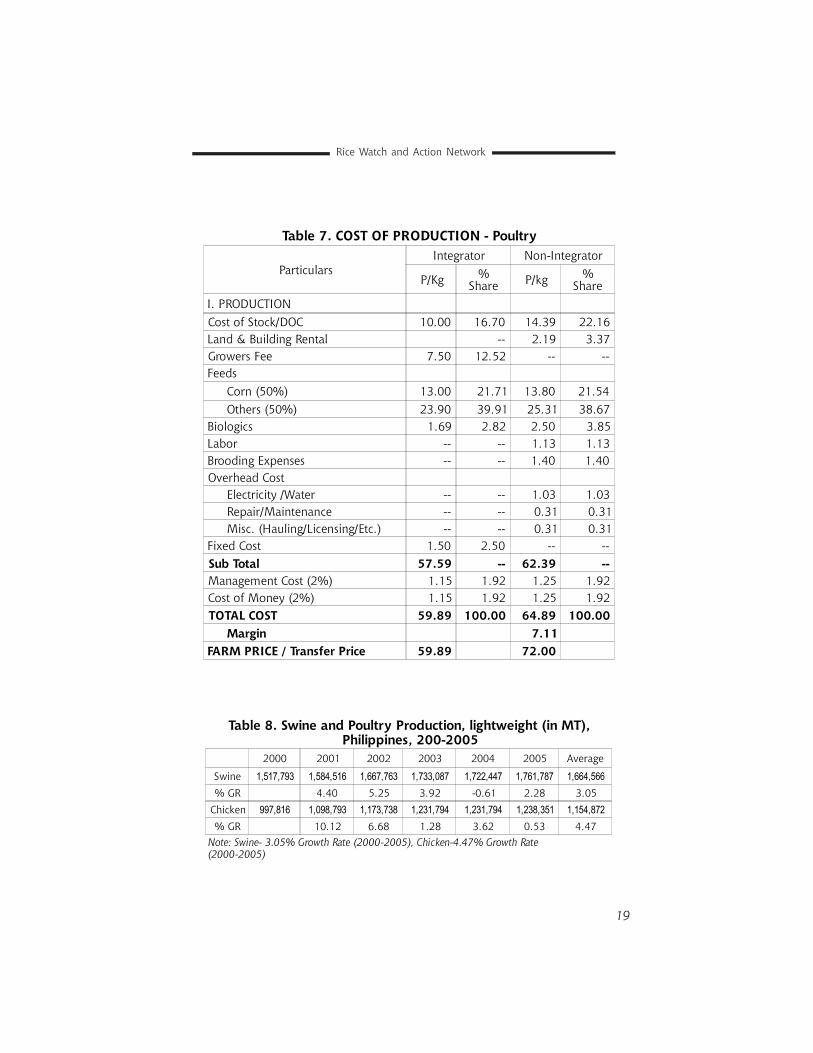
Table 8. Swine and Poultry Production, lightweight (in MT),Philippines, 200-2005
2000 2001 2002 2003 2004 2005 Average
Swine 1,517,793 1,584,516 1,667,763 1,733,087 1,722,447 1,761,787 1,664,566% GR 4.40 5.25 3.92 -0.61 2.28 3.05
Chicken 997,816 1,098,793 1,173,738 1,231,794 1,231,794 1,238,351 1,154,872% GR 10.12 6.68 1.28 3.62 0.53 4.47
Note: Swine- 3.05% Growth Rate (2000-2005), Chicken-4.47% Growth Rate(2000-2005)
Table 7. COST OF PRODUCTION - Poultry
ParticularsIntegrator Non-Integrator
P/Kg %Share P/kg %
ShareI. PRODUCTIONCost of Stock/DOC 10.00 16.70 14.39 22.16Land & Building Rental -- 2.19 3.37Growers Fee 7.50 12.52 -- --Feeds Corn (50%) 13.00 21.71 13.80 21.54 Others (50%) 23.90 39.91 25.31 38.67Biologics 1.69 2.82 2.50 3.85Labor -- -- 1.13 1.13Brooding Expenses -- -- 1.40 1.40Overhead Cost Electricity /Water -- -- 1.03 1.03 Repair/Maintenance -- -- 0.31 0.31 Misc. (Hauling/Licensing/Etc.) -- -- 0.31 0.31Fixed Cost 1.50 2.50 -- --Sub Total 57.59 -- 62.39 --Management Cost (2%) 1.15 1.92 1.25 1.92Cost of Money (2%) 1.15 1.92 1.25 1.92TOTAL COST 59.89 100.00 64.89 100.00 Margin 7.11FARM PRICE / Transfer Price 59.89 72.00
20
Issues and Prospects on the Philippine Corn Industry
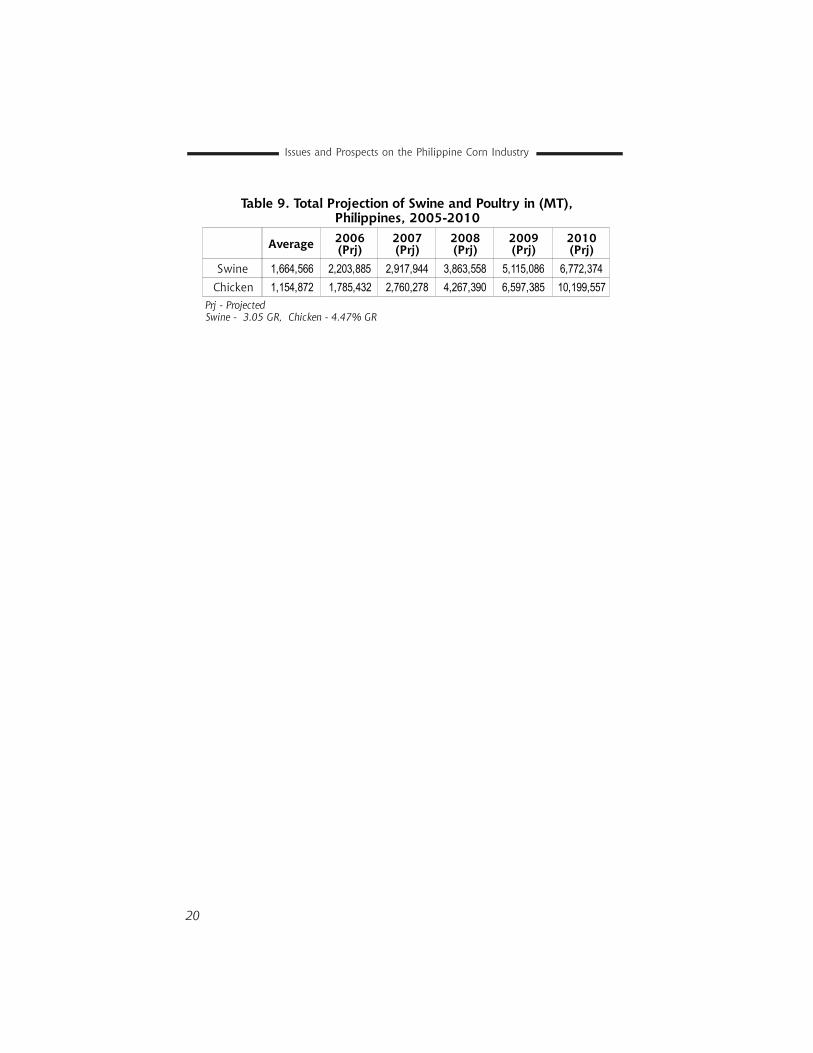
Table 9. Total Projection of Swine and Poultry in (MT),Philippines, 2005-2010
Average 2006(Prj)
2007(Prj)
2008(Prj)
2009(Prj)
2010(Prj)
Swine 1,664,566 2,203,885 2,917,944 3,863,558 5,115,086 6,772,374Chicken 1,154,872 1,785,432 2,760,278 4,267,390 6,597,385 10,199,557
Prj - ProjectedSwine - 3.05 GR, Chicken - 4.47% GR
21
Rice Watch and Action Network
In 2005, the United States Department of Agriculture (USDA) re-ported that the year registered the lowest in international cornsupply stocks in 25 years because consumption is indeed increas-
ing. Prices increased further due to falling global wheat production-a corn substitute. Wheat production in recent years has suffered pro-duction losses due to drought and other calamities. According to animporter, “Eight percent of US wheat is having drought. Russia andwheat-producing areas in Eastern Europe are being hit by Russiancane or winter kill. Southern hemisphere-producing wheat (Argen-tina) will also produce less”3
3. Statement by trader Eric Bailon of Paritas Trading Corp as cited by Melody Aguiba inhttp://www.mb.com.ph/issues/2006/02/11/BSNS2006021156079.html, Melody Aguiba ,Manila Bulletin Online
III.Trends in World CornSupply and Demand
22
Issues and Prospects on the Philippine Corn Industry
However, the US lowered its corn exports in 2005 when its cornuse for ethanol doubled from 17% in 2003 to 27% in 2005. The useof corn for ethanol is said to contribute to the increasing demand forcorn.
China is as well believed to be gearing up for increased use ofbiofuels as its economy grows bigger. It is already investing in otherbiofuel crops like sorghum as in the case in the Philippines throughthe recently-signed RP-China Agreement. In recent years, the Philip-pines has been buying most of its corn from China as freight costsfrom Chinese ports were seen to be much lower than the rates fromthe ports of US and Argentina .
Dr. Binamira summarized the US’ possible hand in the increas-ing corn prices. The US, by developing and subsidizing its ethanolindustry, has created an assured domestic market for corn. They cancommand the movement of corn prices in the world market becausethey are, by far, the biggest corn producer in the world. According toMr. Binamira, this saves the US government on subsidies to corn farm-
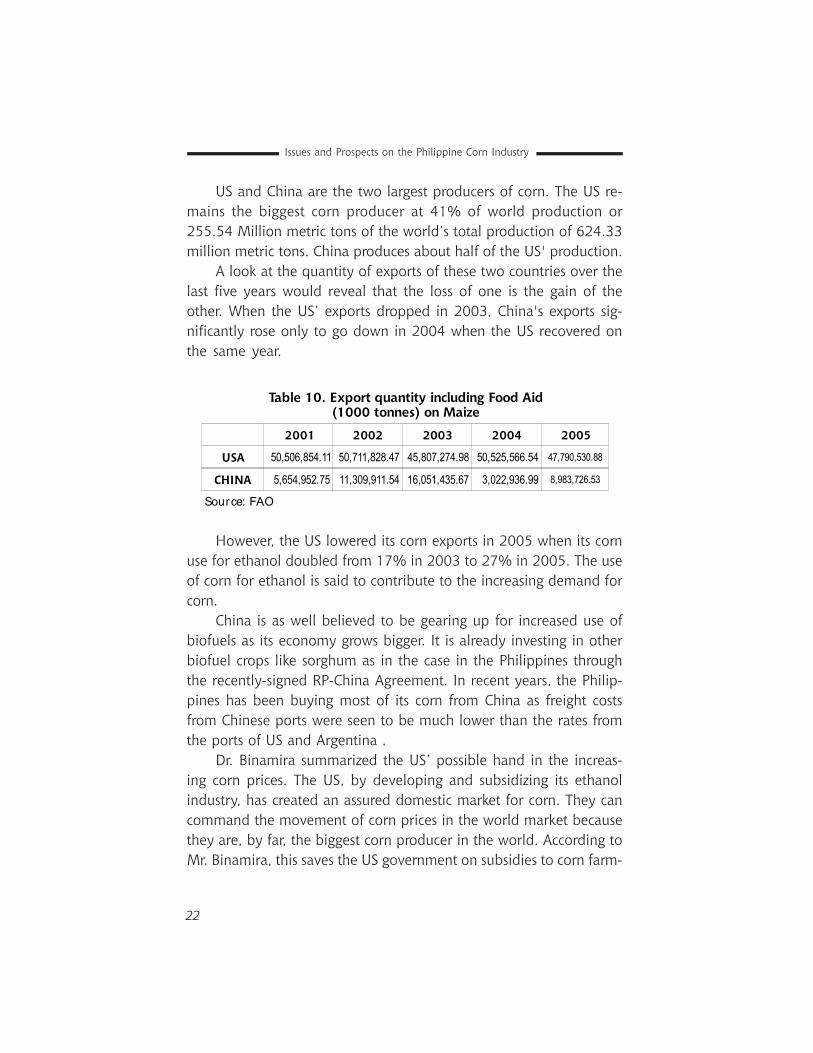
Table 10. Export quantity including Food Aid(1000 tonnes) on Maize
2001 2002 2003 2004 2005
USA 50,506,854.11 50,711,828.47 45,807,274.98 50,525,566.54 47,790,530.88
CHINA 5,654,952.75 11,309,911.54 16,051,435.67 3,022,936.99 8,983,726.53
Source: FAO
US and China are the two largest producers of corn. The US re-mains the biggest corn producer at 41% of world production or255.54 Million metric tons of the world’s total production of 624.33million metric tons. China produces about half of the US' production.
A look at the quantity of exports of these two countries over thelast five years would reveal that the loss of one is the gain of theother. When the US’ exports dropped in 2003, China's exports sig-nificantly rose only to go down in 2004 when the US recovered onthe same year.
23
Rice Watch and Action Network
ers by around US$20 billion dollars. At the same time, the US isassured of their corn market in the ethanol industry and a renewablesource of ifs energy use.
But some are raising another question of whether this overwhelm-ing demand for corn will remain. The development of other biofuelsources such as cellulose is feared to make this demand for corn forbiofuels, a history. Cellulose, a fibrous molecule found in all plants,is abundant and is a favoured subject of renewable, plant-basedbiofuels research.

24
Issues and Prospects on the Philippine Corn Industry
25
Rice Watch and Action Network
The corn sector is a vital industry. Addressing the needs of thecorn sector would also lead to benefiting its allied industries-livestock and poultry sectors, etc. The competitive advantage
of local livestock and poultry in the domestic and export marketswill depend on the cost-efficiency of the domestic corn industry. Corn,on the other hand will have to contend with cheaper imported cornand feed substitutes.
Corn in terms of importance, remains second only to rice. Thesector received very little public investment compared to rice.
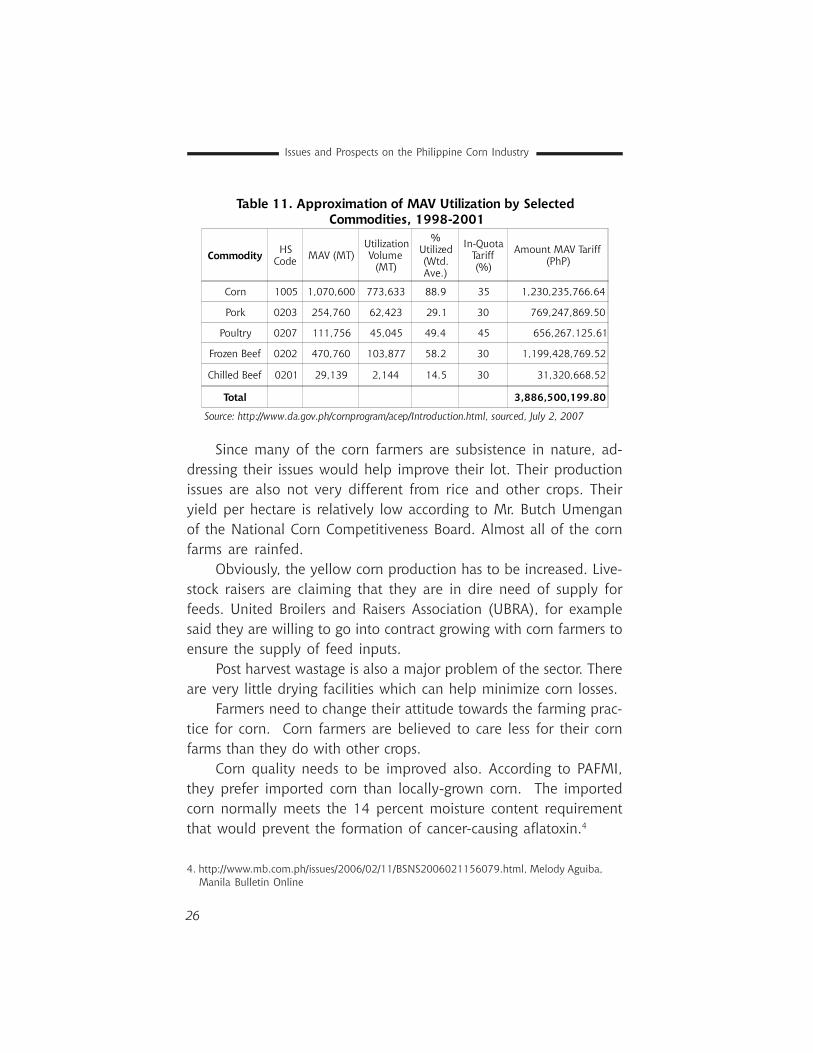
PHILMAIZE is advocating for more support to the corn industrycoming from ACEF to improve its competitiveness and effectivelysupporting poultry and livestock industries in the end. They arguethat all tariffs generated by corn imports should go to a competitive-ness fund for the corn industry. Please see table below for actualamount of tariff earnings from corn from 1998 to 2001 (see lastcolumn of Table 11).
IV.Identifying PotentialPolicy Issues in Corn
26
Issues and Prospects on the Philippine Corn Industry
Since many of the corn farmers are subsistence in nature, ad-dressing their issues would help improve their lot. Their productionissues are also not very different from rice and other crops. Theiryield per hectare is relatively low according to Mr. Butch Umenganof the National Corn Competitiveness Board. Almost all of the cornfarms are rainfed.
Obviously, the yellow corn production has to be increased. Live-stock raisers are claiming that they are in dire need of supply forfeeds. United Broilers and Raisers Association (UBRA), for examplesaid they are willing to go into contract growing with corn farmers toensure the supply of feed inputs.
Post harvest wastage is also a major problem of the sector. Thereare very little drying facilities which can help minimize corn losses.
Farmers need to change their attitude towards the farming prac-tice for corn. Corn farmers are believed to care less for their cornfarms than they do with other crops.
Corn quality needs to be improved also. According to PAFMI,they prefer imported corn than locally-grown corn. The importedcorn normally meets the 14 percent moisture content requirementthat would prevent the formation of cancer-causing aflatoxin.4
Table 11. Approximation of MAV Utilization by SelectedCommodities, 1998-2001
Commodity HSCode MAV (MT)
UtilizationVolume
(MT)
%Utilized(Wtd.Ave.)
In-QuotaTariff(%)
Amount MAV Tariff(PhP)
Corn 1005 1,070,600 773,633 88.9 35 1,230,235,766.64
Pork 0203 254,760 62,423 29.1 30 769,247,869.50
Poultry 0207 111,756 45,045 49.4 45 656,267.125.61
Frozen Beef 0202 470,760 103,877 58.2 30 1,199,428,769.52
Chilled Beef 0201 29,139 2,144 14.5 30 31,320,668.52
Total 3,886,500,199.80
Source: http://www.da.gov.ph/cornprogram/acep/Introduction.html, sourced, July 2, 2007
4. http://www.mb.com.ph/issues/2006/02/11/BSNS2006021156079.html, Melody Aguiba, Manila Bulletin Online
27
Rice Watch and Action Network
Transportation from farm to market is also a major hurdle. Sincelivestock and poultry farms are mostly in Luzon, logistics and han-dling of corn from the corn growing provinces of Cagayan Valley andMindanao is crucial. As of now, transporting is getting a big share intheir cost of production, as well.
This is the very same rationale behind the Grains Highway Pro-gram of the government that was implemented by the Office of theMillion Jobs under former DA Secretary Cito Lorenzo and has alsobeen revived by Secretary Arthur Yap. Under the program, it has iden-tified interventions from seed to shelf, including increasing produc-tion to make any investments in post harvest and bulk handling fa-cilities viable.
The introduction of BT corn came with this program. The BT cornwas expected to trigger corn production throughout the year.5 Thegovernment’s claim is that this will ensure there is corn cargo thewhole year, maximizing the investments provided for the post-har-vest and bulk-handling facilities.
Currently, the logistics cost of corn remains high because accord-ing to the Domestic Shipowners Association, cargo volume is low andthe hauling of corn products is done manually. The ports have nobulk-handling facilities that can handle fast roll off-roll on of cargoes.
With the projected tightening of supply a major likelihood inthe years to come,6 expect the livestock and poultry industries to usethe same issue to justify the high domestic prices of pork, beef andother meat products. As of now, the government is promoting theplanting of more corn to take advantage of projected increase inprices.
The dilemma that this situation poses is that it is advantageousto farmers while dreaded by the livestock and poultry sector andpossibly to the meat-eating public. This is probably one policy issuethat has to be resolved.
5. BT Corn claims to be corn borer resistant. Hence, it will be possible to plant corn even during months when corn borer normally attacks.6. USDA, GAIN Report, 2003

28
Issues and Prospects on the Philippine Corn Industry
Although the demand for corn for bio ethanol is valid, the politi-cal economy of corn has to also be given some thought. The US is abig player in world corn production that in the end, having a soundpolicy for corn self-sufficiency should be foremost in the government’sagenda.
The rising cost of oil—a major input in fertilizers can also beseen as an opportunity to demand for the shift to organic inputs. Theuse of Bio-N—a biological fertilizer that replaces the chemical fertil-izer, for example, has been found to be effective in reducing require-ments for chemical inputs in corn. Bio-N has been promoted in Cebuwhere corn is a staple crop. The use of Bio-N increased corn produc-tion by up to 6.0 tons/ha from the average of 0.5-2.0 tons/ha.7
Another issue is the accessibility of inputs. If this becomes ac-cessible and affordable, then farmers would surely use the rightamount of inputs for their corn farms. According to Mr. Umengan,farmers normally use lower amounts of needed inputs.
Finally, the productivity issue also brings to fore the contentiousissue of the use of BT corn. The commercialization of Bt corn is stillallowed although the Department of Agriculture has not pursued itwith the same vigor as during the time of Sec. Cito Lorenzo. Thisimplies that the BT corn issue will remain and this is something thatorganizations, like R1, that are opposed to genetic engineering oflife forms, such as crops should think about as it tries to developfurther its campaign and analysis on GMOs.
7. USE OF BIO-N AS FERTILIZER IN CORN PRODUCTION (BIOTECHNOLOGY) Philippines, sourced from the internet on June 30, 2007, http://www.unesco.or.id/ APGEST/pdf/philippines/phi-bp-bt.pdfphilippines/phi-bp-bt.pdf
29
Rice Watch and Action Network