Embed Size (px)
Citation preview

Sustainable Design & Applied Researchin Engineering and the Built Environment
Journal
Issue 9 December 2019
The SDAR Journal is a scholarly journal in sustainable design and publishes peer-reviewed applied research papers.
Cover SDAR Journal 2019 Alt.indd 1 28/11/2019 14:48

Enhance your career prospects —
Join CIBSE IrelandCIBSE Ireland promotes the careers of building services engineers by accrediting courses of study in higher education. It also approves work-based training programmes and provides routes to full professional registration and membership, including Chartered Engineer, Incorporated Engineer and Engineering Technician.
a range of services, all focused on maintaining and enhancing professional excellence throughout your career.
CIBSE members in Ireland are represented by an active Regional Committee that organises an extensive programme of CPD events, technical evenings, training courses and an annual conference. The programme also includes social events such as the annual golf outing and the annual Christmas lunch.
CIBSE Ireland also hosts a number of awards each year, in collaboration with the Dublin Institute of Technology. These include the Young Lighter and Irish Lighter competitions, the Student Awards, and the Sustainable Design and Research Awards (SDAR Awards).
CIBSE Ireland membership means you can avail of all these events and activities, and is complemented by direct online access to CIBSE’s full range of design guides and other publications.
Email: [email protected]
www.cibseireland.org
CIBSE Enhance Career Advert 2016.indd 1 06/11/2018 11:24

Editorial
Do it now! In this era of talking sustainability, you may be interested to hear that G20 countries used nearly twice as much fossil fuels in 2018 as they did in 1990. Over 80% of the energy mix of the G20 is still fossil fuel. The building sector showed the highest emission increase of all sectors in the G20 countries. The G20 countries account for around 80% of global greenhouse gas emissions, as well as around 85% of global gross domestic product. In the G20 countries, around 70% of the effects of climate change could be prevented by limiting global warming to 1.5°C rather than 3°C. (Germanwatch 2019 – Brown to green report: https://www.germanwatch.org/de/17200)
Ireland ranks 48th in the new Climate Change Performance Index. Despite our Taoiseach reacting to this by claiming our greenhouse gas emissions decreased in 2017, the five-year trend is up by 7.5%. (Burck, Germanwatch).
Young people all over the world are asking those in power and authority what they intend to do about this impending catastrophe. We are already feeling the effects of global warming in our climate and weather patterns. We cannot wait until tomorrow … we must do it now and walk the walk rather than just talk the talk about it.
All of this can be somewhat overwhelming and is a serious challenge. What exactly will our personal and professional contribution be? Every time we board a flight or sit in a car we contribute personally to emissions. Apart from taking personal responsibility we must act as leading building professionals and contribute towards the drive for Zero Energy Buildings. Our contribution individually might not seem significant but if, as a professional community of engineers and building professionals we work together, then we can make a difference.
Examples of how members of the building services engineering fraternity are making their contribution are detailed overleaf in this, the 9th edition of the SDAR Journal.
Editor: Professor Kevin Kelly, TUDublin and CIBSE Contact: [email protected]
Deputy Editor: Dr Barry McAuleyContact: [email protected]
Editorial Team: Dr Barry McAuley , Kevin Gaughan, Yvonne Desmond, Keith Sutherland, Avril Behan, Michael McDonald, Mona Holtkoetter, Brian Widdis, Pat Lehane, Kevin Kelly.
Reviewing Panel: Brian West, Mona Holtkoetter, Mark Costello, Brian Clare, Kevin Gaughan, Dr Ruth Kelly, Dr Mandana Sarey Khanie, Dr Barry McAuley, Dr Keith Sunderland, Dr Avril Behan.
Upload papers and access articles online:http://arrow.dit.ie/sdar/
Published by: CIBSE Ireland and the College of Engineering & Built Environment, TUDublin.
Produced by: Pressline Ltd, Carraig Court, George’s Avenue, Blackrock, Co Dublin. Tel: 01 - 288 5001/2/3.
email: [email protected]
Printed by: Turners Printing Co Ltd, Longford
ISSN 2009-549X
© SDAR Research Journal.
Additional copies can be purchased for 50
Contents
5 In-Use Energy Performance Study of Automated Smart Homes Kat Kelly, Atamate Ltd, Oxford. [email protected] P Sassi, Oxford Brookes University, Oxford. [email protected] J Miles, Atamate Ltd, Oxford. [email protected]
19 Indoor air quality, humidity and thermal conditions: CIBSE review of recent research and guidance in criteria and solutions Julie Godefroy, Technical Manager, CIBSE. [email protected] Anastasia Mylona, Head of Research, CIBSE. [email protected]
31 A Critical Literature Review of Spatio-Temporal Simulation Methods for Daylight Glare Assessment
Stephen Wasilewski, Lucerne University of Applied Sciences and Arts, Horw, Switzerland. [email protected] Lars Oliver Grobe, Lucerne University of Applied Sciences and Arts, Horw, Switzerland. [email protected] Jan Wienold, École Polytechnique Fédérale de Lausanne, Switzerland. [email protected] Marilyne Andersen, École Polytechnique Fédérale de Lausanne, Switzerland. [email protected]
45 Digital engineering: a case study in an Irish consultancy practice Raymond Reilly, AECOM Ireland. [email protected]
55 Undergraduate engineers’ preferences for a range of professional roles Darren Carthy. [email protected] Maarten Pinxten. [email protected] Kevin Gaughan. [email protected] Brian Bowe. [email protected]
Kevin Kelly
SDAR Intro pages 2019.indd 1 26/11/2019 13:07
SDAR Journal 2019
2
Editorial Board
Professor Brian NortonTUDublin
Professor Andy FordLondon South Bank University
Professor Tim DwyerUniversity College London
Dr Hywel DaviesCIBSE
Mona HoltkoetterChair, CIBSE Ireland
Professor Gerald FarrellTUDublin
Professor John MardaljevicLoughborough University
Professor Michael ConlonTUDublin
Professor David KennedyTUDublin
Professor Tony DayInternational Energy Research Centre – Cork
Professor Kevin KellyEmeritus Professor TUDublin, CIBSE Vice-President
Dr Kat Kelly examines in-use energy performance of automated smart homes. This research study tests whether automated demand-controlled heating and ventilation can provide a good indoor environment, while reducing energy consumption in “real-life” homes. A year-long case study was conducted using six occupied, neighbouring dwellings installed with a low-cost automated building control system. The energy consumption figures recorded were compared to the values predicted by the Standard Assessment Procedure and by a Dynamic Simulation Model, and compared to Passivhaus standard. Significant savings have been identified. The results of this study show that an automated control system can lead to very low energy, and hence low carbon homes. This means that such systems have the potential to make a considerable contribution to reducing the carbon footprint of housing stock, and hence to meeting carbon reduction targets.
Dr Julie Godefroy, Technical Manager and Dr Anastasia Mylona, Head of Research, two CIBSE senior technical staff members, evaluate indoor air quality, humidity and thermal conditions in a CIBSE review of recent research and guidance in criteria and solutions. This paper presents a summary of recent CIBSE guidance on health and wellbeing in buildings, including how to define indoor environmental criteria. In a rapidly-evolving field, it also summarises key areas of current research and development, how to evaluate such studies, and what to look out for when reviewing emerging products. The paper focuses on indoor air quality, thermal comfort and humidity, but many of its principles are valid for other aspects of indoor environments. Overall, CIBSE guidance advocates for source control, the precautionary principle and monitoring of building performance in order to avoid unintended consequences.
Stephen Wasilewski, Lars Oliver Grobe, Jan Wienold and Marilyne Andersen join us from the Lucerne University and École Polytechnique Fédérale de Lausanne, Switzerland with a critical literature review of spatio-temporal simulation methods for daylight glare assessment. A well daylighted space can provide a highly satisfying visual environment. However, if that environment causes us visual discomfort, it can become such a nuisance that we, sometimes literally, turn our backs on this powerful connection to the outside world. Given this,
A Reader’s Guide
SDAR Intro pages 2019.indd 2 26/11/2019 08:11
there is enormous value in quantifying the occurrence of discomfort glare within buildings, and in glare models that may guide architects and engineers in design. With the success of climate-based modelling techniques for daylight illuminance, there is now a focus on including discomfort glare metrics in spatio-temporal evaluations. This paper conducts a literature review of research focused on spatio-temporal simulations for glare assessment. While the existing research included in this review outline a wide range of possible methods for spatio-temporal glare simulation, none of the proposed methods offer a path towards a method that is both generally applicable and efficient. The authors conclude that future research should consider the problem from a wider lens, interrogating the required level of detail needed across time, position, and view direction.
Raymond Reilly, a doctoral candidate, looks at embracing digital technology to transform the building services engineering design process. In a case study of an Irish consultancy practice, he examines how digitalisation encapsulates people, processes and technology to improve the design process in Irish BSE practice, thus providing the basis for promoting a sustainable design process during and after design. He concludes that by understanding, adopting and implementing specific digital constructs, Irish BSE practices are in a position to pave the way for an improved design process through digital engineering.
Darren Carthy’s paper covers a slightly unusual topic but is published because Ireland has been the subject of scrutiny at European level with regard to some key indicators on the European Skills Index (European SkillsIndex Technical report, 2018). Ireland ranks 22nd out of the 28 EU member states for occupational skill mismatch, which is defined as a nation’s ability to match skills to the relevant job. In particular, engineering professionals and technicians were identified as a sector with a high degree of mismatch (Skills challenges in Europe, 2014). Darren examines this in relation to 109 first-year engineering students at TU Dublin, Ireland and 159 third-year engineering students at KU Leuven, Belgium. He finds that initial data suggests students at both TU Dublin and KU Leuven have a strong preference to work in product-facing roles and a lack of preference for working in client-facing roles. This has implications for engineering recruiters, particularly those recruiting into consultancy, where a large amount of time is spent working with clients. It also has wider implications for the field of engineering as a whole, as engineers spend as little as 7% of their time working on design and innovation, and 60% of their time managing projects and carrying out tests and inspections (Trevelyan and Williams, 2019). There certainly seems to be a mismatch emerging between what an engineer does and what undergraduate engineers would like to do.
How to get published in the SDAR JournalThe SDAR Journal is intended as a platform for you, as working engineers and building professionals, to publish your innovative work. Since the first issue in 2011 we have published over 50 papers that have attracted just on 55,000 downloads from 162 countries and 2,287 Institutions. We are averaging about 7,000+ downloads a year and hence sharing authors work with the world to help make it more sustainable.
The SDAR Journal is a free-to-publish journal that is listed in the Directory of Open Access Journals and it is thus free to download papers from it. It is a joint publication between Technological University Dublin and CIBSE Ireland. We have generous support from CIBSE UK, our reviewers, editorial team and editorial board, all of whom contribute their time and input free. We are here to support you publish your insightful cutting-edge designs and post-occupancy evaluations of low energy design.
Your interests are our interests, with the intention of moving engineers from ideologically-based green initiatives towards evidence-based sustainable built environment solutions. Authors will critically reflect on their own work. We want to publish your work if it will help contribute to a more sustainable world. We will help and support you to do that.
SDAR Journal 2019
3
SDAR Intro pages 2019.indd 3 26/11/2019 08:11

School of Multidisciplinary Technologies
College of Engineering & Built Environment
The School of Multidisciplinary Technologies provides modules and programmes, at undergraduate and postgraduate levels, which link engineering and built environment disciplines for the design and operation of healthy, low-energy buildings and infrastructure for a modern sustainable world. These full-time and part-time programmes are founded on a research base and promote multidisciplinary themes across the Technological University Dublin, and with external partners. Themes include energy, sustainability, engineering analytics, digital construction, construction analytics, building information modelling and management (BIM), and educational research.
Undergraduate Programmes
Bachelor of Engineering (Hons) Engineering (Gen. Entry) Full Time TU805 (formerly DT066)
Bachelor Engineering Technology (Ord) Engineering (Gen. Entry) Full Time TU709 (formerly DT097)
Bachelor of Science (Hons) in BIM (Digital Construction) One year Part Time Code Awaited
Check out our video “Engineering General Entry” on YouTube.
Postgraduate Programmes
MSc in Applied Building Information Modelling Part Time DT9876and Management (aBIMM)
Postgraduate Diploma in Collaborative BIM Part Time DT9876
Postgraduate Certificate in BIM Technologies Part Time DT9876
Check out our video “BIM@TU Dublin Promotion” on YouTube.
Research Programmes
PhD and MPhil opportunities in areas such as Engineering Education, Engineering Ethics, Sustainability in Engineering & the Built Environment, Building Information Modelling and Management (BIM), Collaborative Digital Construction, Energy Management and Analytics /Computation/Critical Digital Literacy for Engineering and Built Environment Applications.
CPD
By successfully completing modules from our Postgraduate Suite in areas such as BIM and Analytics for Engineering & Built Environment, you can upskill in emerging areas and progress your career through the accumulation of credits into postgraduate awards.
Review our available programmes and modules on:www.dit.ie/bim and www.dit.ie/multidisciplinarytechnologies
Please contact us if you have any queries about our programmes, research, or other activities.
School Administrator: Jane Cullen. Tel: 01 – 402 4014. email: [email protected]
School of Multidisciplinary Technologies Advert 2020.indd 1 26/11/2019 08:13
Enhancing Thermal Mass Performance of Concrete
In-Use Energy Performance Study of Automated Smart Homes
Dr K A Kelly ATAMATE LTD, OXFORD
Dr P Sassi OXFORD BROOKES UNIVERSITY, OXFORD
J Miles, CEng ATAMATE LTD, OXFORD
Kat Kelly 2019.indd 1 26/11/2019 08:15

Abstract
Domestic energy demand has been high on the carbon
reduction agenda for some time. Today new homes are
being designed following the “fabric first” principle which is
reducing heat demand, but it is shifting the design challenge
to ventilation.
Further energy reductions and comfort improvements are
needed. It is frequently proposed that automated control
systems can achieve this. However, the technologies involved
are currently considered expensive and complicated. There
is little published evidence of how these types of systems
perform in use, which leads to scepticism.
This research study aims to test the hypothesis that
automated demand-controlled heating and ventilation can
provide a good indoor environment while reducing energy
consumption in “real-life” homes. A year-long case study
was conducted using six occupied, neighbouring dwellings
installed with a low-cost automated building control system.
The energy consumption figures recorded were compared to
the values predicted by the Standard Assessment Procedure
and by a Dynamic Simulation Model, and compared to
Passivhaus standard. Significant savings have been identified.
The results of this study show that an automated control
system can lead to very low energy, and hence low carbon
homes at a price-point that would incentivise widespread
role out. This means that such systems have the potential
to make a considerable contribution to reducing the carbon
footprint of housing stock, and hence to meeting carbon
reduction targets.
Keywords
Smart homes, smart ventilation, domestic energy
management, automated building control, energy
efficiency, low carbon homes, low energy homes,
building performance.
SDAR Journal 2019
6
Kat Kelly 2019.indd 2 26/11/2019 08:15
1. Introduction
It is widely accepted that in order to meet the UK’s legally-binding carbon reduction targets, significant changes must be made to the nation’s energy system. Large reductions can be achieved via supply-side technology shifts to low and zero carbon generators, but this requires substantial infrastructural changes that are, and will continue to take, considerable investment of time and money. The importance of energy demand reduction is rightly being recognised by engineers and strategists.
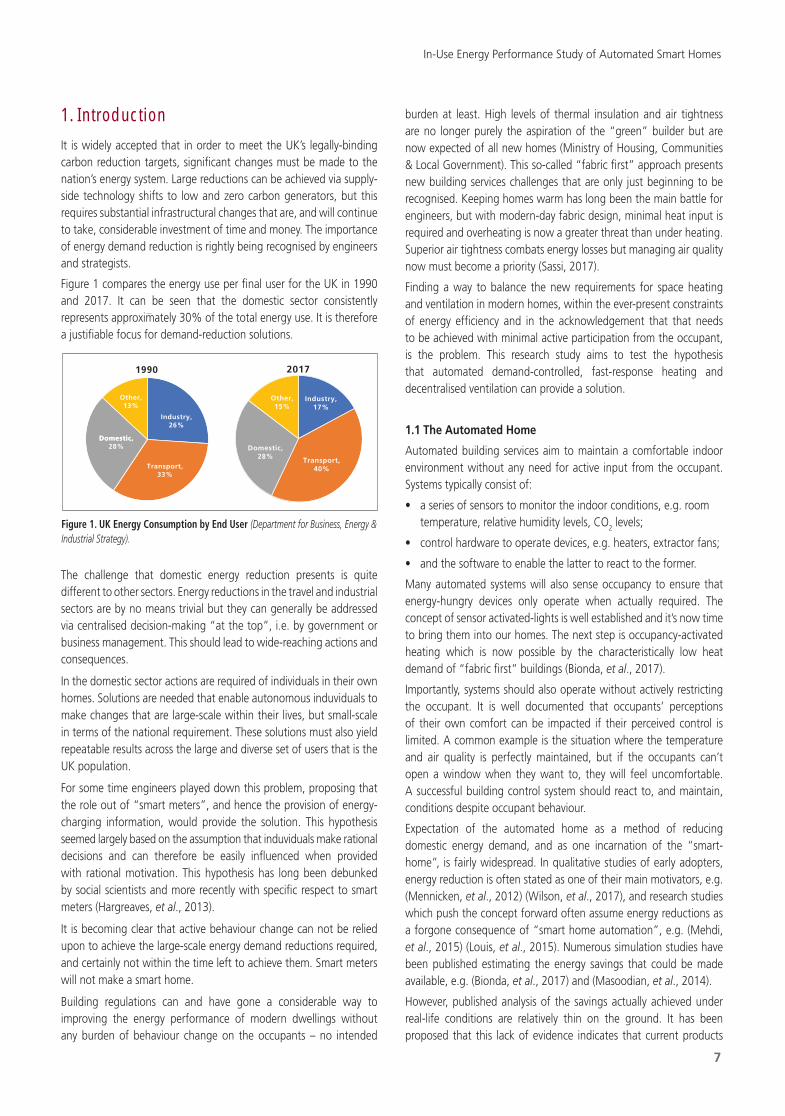
Figure 1 compares the energy use per final user for the UK in 1990 and 2017. It can be seen that the domestic sector consistently represents approximately 30% of the total energy use. It is therefore a justifiable focus for demand-reduction solutions.
The challenge that domestic energy reduction presents is quite different to other sectors. Energy reductions in the travel and industrial sectors are by no means trivial but they can generally be addressed via centralised decision-making “at the top”, i.e. by government or business management. This should lead to wide-reaching actions and consequences.
In the domestic sector actions are required of individuals in their own homes. Solutions are needed that enable autonomous induviduals to make changes that are large-scale within their lives, but small-scale in terms of the national requirement. These solutions must also yield repeatable results across the large and diverse set of users that is the UK population.
For some time engineers played down this problem, proposing that the role out of “smart meters”, and hence the provision of energy-charging information, would provide the solution. This hypothesis seemed largely based on the assumption that induviduals make rational decisions and can therefore be easily influenced when provided with rational motivation. This hypothesis has long been debunked by social scientists and more recently with specific respect to smart meters (Hargreaves, et al., 2013).
It is becoming clear that active behaviour change can not be relied upon to achieve the large-scale energy demand reductions required, and certainly not within the time left to achieve them. Smart meters will not make a smart home.
Building regulations can and have gone a considerable way to improving the energy performance of modern dwellings without any burden of behaviour change on the occupants – no intended
burden at least. High levels of thermal insulation and air tightness are no longer purely the aspiration of the “green” builder but are now expected of all new homes (Ministry of Housing, Communities & Local Government). This so-called “fabric first” approach presents new building services challenges that are only just beginning to be recognised. Keeping homes warm has long been the main battle for engineers, but with modern-day fabric design, minimal heat input is required and overheating is now a greater threat than under heating. Superior air tightness combats energy losses but managing air quality now must become a priority (Sassi, 2017).
Finding a way to balance the new requirements for space heating and ventilation in modern homes, within the ever-present constraints of energy efficiency and in the acknowledgement that that needs to be achieved with minimal active participation from the occupant, is the problem. This research study aims to test the hypothesis that automated demand-controlled, fast-response heating and decentralised ventilation can provide a solution.
1.1 The Automated Home
Automated building services aim to maintain a comfortable indoor environment without any need for active input from the occupant. Systems typically consist of:
• a series of sensors to monitor the indoor conditions, e.g. room temperature, relative humidity levels, CO
2 levels;
• control hardware to operate devices, e.g. heaters, extractor fans;
• and the software to enable the latter to react to the former.
Many automated systems will also sense occupancy to ensure that energy-hungry devices only operate when actually required. The concept of sensor activated-lights is well established and it’s now time to bring them into our homes. The next step is occupancy-activated heating which is now possible by the characteristically low heat demand of “fabric first” buildings (Bionda, et al., 2017).
Importantly, systems should also operate without actively restricting the occupant. It is well documented that occupants’ perceptions of their own comfort can be impacted if their perceived control is limited. A common example is the situation where the temperature and air quality is perfectly maintained, but if the occupants can’t open a window when they want to, they will feel uncomfortable. A successful building control system should react to, and maintain, conditions despite occupant behaviour.
Expectation of the automated home as a method of reducing domestic energy demand, and as one incarnation of the “smart-home”, is fairly widespread. In qualitative studies of early adopters, energy reduction is often stated as one of their main motivators, e.g. (Mennicken, et al., 2012) (Wilson, et al., 2017), and research studies which push the concept forward often assume energy reductions as a forgone consequence of “smart home automation”, e.g. (Mehdi, et al., 2015) (Louis, et al., 2015). Numerous simulation studies have been published estimating the energy savings that could be made available, e.g. (Bionda, et al., 2017) and (Masoodian, et al., 2014).
However, published analysis of the savings actually achieved under real-life conditions are relatively thin on the ground. It has been proposed that this lack of evidence indicates that current products
In-Use Energy Performance Study of Automated Smart Homes
7
Other,13%
Domestic,28%
Industry,26%
Domestic,
Transport,33%
1990
Figure 1. UK Energy Consumption by End User (Department for Business, Energy & Industrial Strategy).
Other,15%
Industry,17%
Domestic,28% Transport,
40%
2017
Kat Kelly 2019.indd 3 26/11/2019 08:15

SDAR Journal 2019
8
have little, or even a detrimental effect on energy efficiency (Darby, 2018). The NHBC Foundation recently published a report that attempted to look into the future. It suggests that current control systems are too complex to achieve the energy reduction potential made available by the concept. However, the Foundation prophesises that “by 2050 a single [technology] will emerge, tackling the existing issues …” (NHBC Foundation, 2018).
1.2 The case study
This case study provides an in-use evaluation of one of the simplest and inexpensive control systems currently available on the market. Data was collected over one year from six neighbouring, modern- built flats in Cardiff. Every flat benefits from modern fabric construction and all have the same control system fitted. The system was in control of most of the building services of the homes but this analysis focuses on the heating and ventilation. It was felt that these were the most important, in terms of energy use and comfort maintenance, but also as the most interesting given the shifting needs of modern homes.
All flats were rented and occupied during the study, the ground and first floor flats in both buildings by undergraduate students, and the smaller, top-floor flats by young professionals.
With respect to heating and ventilation only, the data collected has been analysed to observe the system operation and assess whether the target conditions for occupant comfort were realised. Total heat energy consumption figures are used to evaluate the energy performance of the system. In order to quantify the energy savings achieved, the actual energy consumption of the dwellings is compared to the estimates or thresholds generated by the three environmental design/compliance methods suggested in CIBSE’s recent technical memorandum for homes (Lelyveld, et al., 2018), that of:
• Standard Assessment Procedure (SAP)As the dwellings are real, it was obligatory that a SAP was carried out and that an Energy Performance Certificate (EPC) was issued. The estimates made via this method form the primary basis for comparison and therefore, for quantifying energy savings made;
• Dynamic Simulation Modelling (DSM)Virtual representations of the case study properties were built using the thermal modelling package IES. This was done to better understand the thermal performance of the buildings overall, and to provide some reference estimates of heating demand. Simulations were run to generate annual space heating demands for more conventional ventilation strategies to which the case study consumption figures were compared;
• Passivhaus standard The houses were not designed via the highly-prescriptive Passivhaus standard, so therefore the full Passivhaus Planning Package was not used. However, mechanical ventilation with heat recovery (MVHR) is stipulated by the Passivhaus standard and this was simulated via the DSM. For an overall direct comparison, the totals per unit floor area are compared to the requirements set down by Passivhaus in order to show the level of environmental design achieved via the control system.
Considerable energy efficiencies were identified when compared to the values generated by the SAP. It is shown that the energy performance of the properties are comparable to Passivhaus standard, but importantly without any of the restrictive design and additional expenditure typically associated with that method. The construction costs of the case study properties were, in fact, less than typical new-builds and less time was required on site for installation.
The results of this study show that the combination of good, but not extraordinary, fabric design and an automated control system can lead to very low energy, and hence low carbon homes at a price point that would incentivise widespread role out. This means that the system has the potential to make a considerable contribution to reducing the carbon footprint of new and retrofitted housing stock, and to meeting the UK carbon reduction targets.
2. Case study detailsThe flats are built on the site of two demolished Victorian terraces on Cogan Terrace in the Welsh city of Cardiff. Cardiff has a characteristically mild, maritime climate. Winters are typically wet and windy but frosts are rare, with an average minimum winter temperature reported at 2°C (Met Office UK). The buildings face approximately north-west.
The buildings have retained the addresses of No.14 and No.16 Cogan Terrace and are mirror images of each other with each consisting of three flats. In both buildings there is a 3-bed flat “A” on the ground floor, a 3-bed flat “B” on the 1st floor, and a 1-bed flat “C on the top floor.
Table 1 provides the total floor areas of each of the case study properties.
Flat Flat Size (m2)
No.14A 67
No.14B 58
No.14C 34
No.16A 67
No.16B 58
No.16C 34
The key fabric components used, their main material type and their representative U-values are provided in Table 2. It can be seen that the thermal properties of the fabrics used are good, but not in excess of what is typically expected of a new-build dwelling. Importantly, the total building expenditure was similar to a typical new build.
2.3 Automated control system
Both buildings were fitted with building services under the control of the Atamate building control system. The system connects to and controls all the building services in the properties. Those that are relevant to the heating and ventilation analysis conducted here are as follows:
Table 1. Floor areas of all flats in No.14 and No.16 Cogan Terrace.
Kat Kelly 2019.indd 4 26/11/2019 08:15

• a ceiling-mounted sensor unit in each room measuring temperature (both ambient and wall temperature using a thermopile infrared sensor), humidity, passive infrared (PIR) and CO
2;
• a central Linux computer known as the “hub” that receives sensor input, processes it using original software and then activates output commands;
• Standard and inexpensive cabling between sensors and the hub, and the hub and devices – either CAT5 for low voltage or conventional mains cables, e.g. twin and earth.
2.4 Ventilation
The control system constantly monitors the air quality in the rooms using CO
2, humidity and temperature sensors. With this information
it can control both the incoming air and air extraction to ensure the best air quality throughout the building with the minimum amount of ventilation and associated heat loss.
2.4.1 Fresh air supplyNo.14 Cogan Terrace was fitted with “Demand Controlled Ventilation Inlets” (DCVi) comprising 100mm vent pipes drilled through the wall of all “dry rooms” (bedrooms and living rooms). The DCVi has an electrically-operated damper valve which can be controlled by the control system to vent the room when the air quality is poor. This means that background ventilation is only provided to bedrooms and reception rooms when the CO
2 or humidity levels are high enough
to require it. When the air quality was judged to be poor, the DCVi was opened and the MEV was activated. As soon as the air quality of the room was good, then the DCVi was closed to minimise the ventilation heat losses.
No.16 Cogan Terrace was not fitted with DCVi but all rooms were finished with a 100mm diameter trickle vent.
2.4.2 Stale air extractionBoth properties used MEV for extracting the stale air from the “wet rooms” (bathrooms and kitchens). The MEV system chosen had a micro heat pump which extracts the heat from the exhaust air and feeds it into the domestic hot water storage. In these properties the extracts to individual bathrooms and kitchens could be controlled with “Demand Controlled Ventilation outlets” (DCVos). This allows better control of the MEV to extract air from only rooms that need it, not across the whole building.
2.5 Heating
Table 3 provides a schedule of the heating devices installed in the heated rooms across the case study properties.
Occupancy was one of the key triggers for heating, along with temperature, and was monitored via PIR and CO
2 sensors. The control
system restricted the devices so that the heating would only turn on when the room was occupied and the temperature was below the set point of 21°C. Consequently, there was no heating when the rooms were unoccupied. The heat loss of the rooms was quite low at around a maximum of 300W at a temperature differential of 22°C. In a typical year, outside temperatures in Cardiff would not be expected to drop below freezing (Met Office UK), so the panel heaters were thought sufficient to raise the temperature of the room rapidly to comfort thresholds when required.
The fast response of the heating devices should also quickly cease heat input when set point temperatures were achieved, and hence help to avoid overheating. An added benefit of direct electrical heating devices are that they are much quicker, and hence cheaper, to install then wet heating systems.
None of bathrooms in the flats had any external walls and the heat losses in these rooms were predicted to be negligible, so only the bathroom in No.16C was heated by an infra-red heater. Kitchens were not heated as it was predicted that the additional internal gains of cooking would be sufficient to heat these rooms when occupied. Hallways were also not heated.
2.6 Comments on the test periodThe data was recorded from the 15 September 2017 to 14 September 2018. This was a period of uncharacteristic extreme temperatures with the winter having the “Beast from the East” and the summer having a sustained heat wave.
During the year there were only two short periods where data was not collected due to change of system database. The first was two days in November. It was decided to leave these days blank as if the flat was unoccupied for a weekend, rather than fill the gap with an estimate. The second was two days in April, when the temperature trends recorded in days before and after were above the heating set point anyway.
In-Use Energy Performance Study of Automated Smart Homes
9
Envelope Main Material Overall component component U-value, (W/m2k)
External Walls Insulated Concrete 0.16 Form (ICF) Block
Windows Aluminium and Timber 0.92 Composite Windows
Roof Wood Fibre Insulation 0.15
Floors Concrete Slab 0.11
Table 2. Characteristics of key building fabric components of No.14 and No.16 Cogan Terrace.
Flat Bedroom Living Room
No. 14A 400W medium response No heater electric panel heaters
No. 14B 400W medium response 400W medium response electric panel heaters electric panel heaters
No. 14C 400W medium response 400W medium response electric panel heaters electric panel heaters
No. 16A 400W medium response No heater electric panel heaters
No. 16B 400W medium response 400W medium response electric panel heaters electric panel heaters
No. 16C Fast response Fast response infra-red heater infra-red heater
Table 3. Devices used in heated rooms across No.14 and No.16 Cogan Terrace.
Kat Kelly 2019.indd 5 26/11/2019 08:15

3. System operation
Data gathered from the case study properties during the test period is examined to observe the system operation and assess whether the resulting indoor environment met the design requirements.
3.1 HeatingFigure 2 shows the resulting operation profile across most of the winter heating period in No.14B in Bedroom 2 only. When the room is occupied the room temperature is kept above 21°C. If the temperature sensor registers that it has dropped below set point, the heaters turn on; if they register that set point has been achieved, the
heaters switch off, although the room temperature may continue to rise due the presence and activities of the occupant. When the room is vacated, the heaters stay off and the temperature drops.
A sustained drop in temperature can be seen when the room is left vacant for the Christmas break. However, it can also be seen that the room warms up quickly when it is reoccupied. It can also be seen that, at the end of January and beginning of February, the room temperature is kept at set point by internal gains only when occupied, so the heater does not turn on. Bedroom 2 in No.14B is selected to show this, but the behaviour is the same across both buildings.
SDAR Journal 2019
10
Figure 2. Heating operation against occupancy and ambient air temperature of No.14B, bedroom 2 during winter, Dec-Feb. (Atamate Ltd, 2018).
Figure 3. Air temperatures across all flats in No.14 Cogan Terrace (DCVis fitted). (Atamate Ltd, 2018).
Kat Kelly 2019.indd 6 26/11/2019 08:15

In-Use Energy Performance Study of Automated Smart Homes
Figures 3 and 4 show the temperature profiles in all the bedrooms and common lounges over the whole year studied. They show that the automated control system not only worked, but maintained the desired levels of temperature at all times. The temperature in the lounges in both ground floor flats, No.14A and No.16A, track the other room temperatures well and are comfortably warm despite not having a heater installed.
The temperatures dropped significantly over the two holidays periods of Christmas and Easter, when the flats were unoccupied. Due to a sensor error in No.16A, the control system thought that Bedroom 1 was consistently occupied over the winter and a flat line at 21°C can be seen over the Christmas break. Although this is obviously not how the system was designed to operate, it does demonstrate how much temperature variation occurs when the properties are occupied and hence how responsive the system is.
3.2 Ventilation
Only 14 Cogan was fitted with automated control DCVis, while 16 Cogan was fitted with trickle vents. Figure 5 shows how the control system reacts to air quality data to operate the DCV in order to quickly improve the indoor conditions.
• the scale on the left is devised from a combination of air quality threshold ranges such that a score of “0” means the air is OK, i.e. at acceptable levels for all air quality indicators, and “-1” means the air is bad, i.e. at unacceptable levels for all air quality indicators;
• the scale on the right shows the proportion that the valve is open, i.e. 0% is closed and 100% is fully open.
The valve operation profile is shown in green and it can be seen how the valve opening profile is inverse to the air quality, which is shown in orange. When the air quality is judged to be poor, the valve begins to open. As the air quality continues to deteriorate, the valve opening widens. As the bad air clears, the air quality improves and the valve closes again.
4. Heat energy consumption and comparisonsIn order to quantify the energy savings achieved, the actual recorded energy consumption of the dwellings is compared to the estimates or thresholds generated by the three environmental design/compliance methods suggested in CIBSE’s recent technical memorandum for homes (Lelyveld, et al., 2018), that of:
• Standard Assessment Procedure (SAP);
• Dynamic Simulation Modelling (DSM);
• Passivhaus Standard.
11
Figure 4. Heating operation against occupancy and ambient air temperature of No.14B, bedroom 2 during winter, Dec-Feb. (Atamate Ltd, 2018).
Figure 5. DCVi operation against air quality over a 2 hour period in No.14 Cogan Terrace. (Atamate Ltd, 2018).
Kat Kelly 2019.indd 7 26/11/2019 08:15
4.1 SAPAs with all new buildings a Full SAP was obligatory and an Energy Performance Certifi cate (EPC) was issued. The estimates made via this method form the primary basis for comparison and therefore, for quantifying energy savings made.
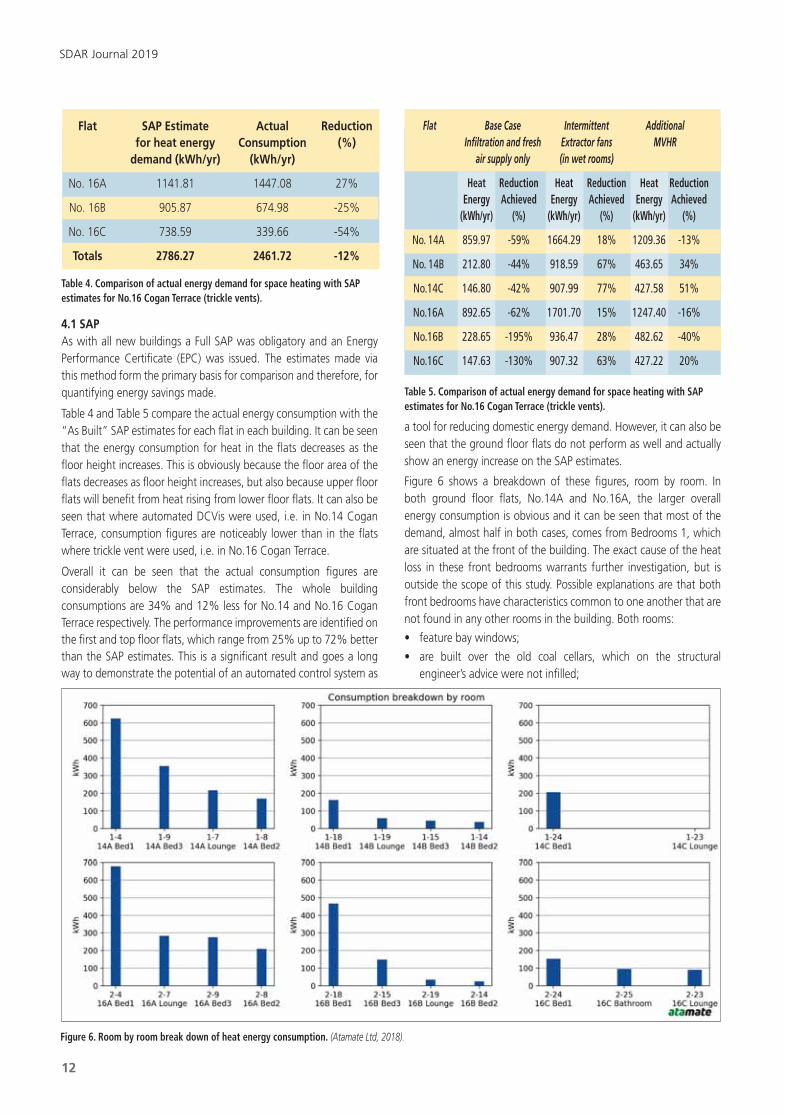
Table 4 and Table 5 compare the actual energy consumption with the “As Built” SAP estimates for each fl at in each building. It can be seen that the energy consumption for heat in the fl ats decreases as the fl oor height increases. This is obviously because the fl oor area of the fl ats decreases as fl oor height increases, but also because upper fl oor fl ats will benefi t from heat rising from lower fl oor fl ats. It can also be seen that where automated DCVis were used, i.e. in No.14 Cogan Terrace, consumption fi gures are noticeably lower than in the fl ats where trickle vent were used, i.e. in No.16 Cogan Terrace.
Overall it can be seen that the actual consumption fi gures are considerably below the SAP estimates. The whole building consumptions are 34% and 12% less for No.14 and No.16 Cogan Terrace respectively. The performance improvements are identifi ed on the fi rst and top fl oor fl ats, which range from 25% up to 72% better than the SAP estimates. This is a signifi cant result and goes a long way to demonstrate the potential of an automated control system as
a tool for reducing domestic energy demand. However, it can also be seen that the ground fl oor fl ats do not perform as well and actually show an energy increase on the SAP estimates.
Figure 6 shows a breakdown of these fi gures, room by room. In both ground fl oor fl ats, No.14A and No.16A, the larger overall energy consumption is obvious and it can be seen that most of the demand, almost half in both cases, comes from Bedrooms 1, which are situated at the front of the building. The exact cause of the heat loss in these front bedrooms warrants further investigation, but is outside the scope of this study. Possible explanations are that both front bedrooms have characteristics common to one another that are not found in any other rooms in the building. Both rooms:
• feature bay windows;
• are built over the old coal cellars, which on the structural engineer’s advice were not infi lled;
SDAR Journal 2019
12
Flat SAP Estimate Actual Reduction for heat energy Consumption (%) demand (kWh/yr) (kWh/yr)
No. 16A 1141.81 1447.08 27%
No. 16B 905.87 674.98 -25%
No. 16C 738.59 339.66 -54%
Totals 2786.27 2461.72 -12%
Table 4. Comparison of actual energy demand for space heating with SAP estimates for No.16 Cogan Terrace (trickle vents).
Figure 6. Room by room break down of heat energy consumption. (Atamate Ltd, 2018).
Table 5. Comparison of actual energy demand for space heating with SAP estimates for No.16 Cogan Terrace (trickle vents).
Flat Base Case Intermittent Additional Infi ltration and fresh Extractor fans MVHR air supply only (in wet rooms)
Heat Reduction Heat Reduction Heat Reduction Energy Achieved Energy Achieved Energy Achieved (kWh/yr) (%) (kWh/yr) (%) (kWh/yr) (%)
No. 14A 859.97 -59% 1664.29 18% 1209.36 -13%
No. 14B 212.80 -44% 918.59 67% 463.65 34%
No.14C 146.80 -42% 907.99 77% 427.58 51%
No.16A 892.65 -62% 1701.70 15% 1247.40 -16%
No.16B 228.65 -195% 936.47 28% 482.62 -40%
No.16C 147.63 -130% 907.32 63% 427.22 20%
Kat Kelly 2019.indd 8 26/11/2019 08:15

• have signifi cant rebar reinforcing in the external concrete-form walls due to the lack of support on the party walls;
• may suffer from exposure to a communal corridor next to the front door of the building.
The thermal dynamic simulation model offers some insights into why the ground fl oor fl ats performed more poorly than estimated by the SAP, see Section 4.2. However, further investigation is necessary. The next step would be an investigation with a thermal imaging camera.
It is also worth saying here that it is very common for buildings to perform worse post-occupancy when compared to the SAP estimates. This is often referred to as the “performance gap”. This also makes the reductions in the upper fl oor fl ats all the more signifi cant.
4.2 Dynamic simulation modelling
Virtual representations of the case study properties were built using the thermal modelling package IES. This was done to better understand the thermal performance of the buildings overall, and to provide some reference estimates of heating demand. Figure 7 provides an image of the virtual representation of the properties constructed for DSM.
A dynamic thermal model is typically regarded as more refi ned than a static model, as used by the SAP. It is generally expected that energy demand estimates would be more “realistic” and this usually means greater than that estimated by the SAP.
All simulated scenarios assume the following:
• the heating set point for heated rooms is 21°C during the day (7:00-22:00) and 16°C at night (22:00-7:00);
• internal gains in all rooms can be represented by the default values for lighting, occupants and other miscellaneous sources;
• the infi ltration rate is the default value of 0.25ach;
• the fresh air supply is 8l/s/person, where the number of people per room is derived from the fl oor area.
Three simulation scenarios were run to generate annual heating loads for more conventional ventilation strategies to which the case study loads were compared.
• The “Base Case” simulation assumes no additional ventilation system;
• The “Intermittent Extractor Fans” simulation includes MEV in the kitchens and bathrooms at a fl ow rate of 8ach, operating for one hour in the morning (7:00-8:00) and for two hours in the evening (20:00-22:00);
• The “Additional MVHR” simulation has the same MEV as above but with a heat recovery system operating at a seasonal effi ciency ratio of 0.65. As no specifi c research was done into what MVHR
system would be appropriate for the properties, it was thought most transparent to select a default value from the modelling package at 0.65 was the highest available.
Table 6 lists the annual energy consumption for heat in each fl at as estimated by each of the simulation scenarios. As might be expected, the “Base Case” that has no active ventilation system yields the lowest consumption fi gures and these are lower than the actual consumption in all cases. The “Intermittent Extractor Fans” simulation yields the highest fi gures and these are higher than the actual consumption in all cases.
The fl ats in No.16 Cogan Terrace had no automated inlet ventilation, only trickle vents, so comparing the actual consumption fi gures for the fl ats in this building with the results from the “Intermittent Extractor Fans” simulation gives the best indication of the energy savings that can be achieved by occupancy-based automated heating.
It is interesting to observe that the DSM results show that the fl ats in No.16 Cogan Terrace fairly consistently consume more heat energy
In-Use Energy Performance Study of Automated Smart Homes
13
Figure 7. Virtual representation of No.12-18 Cogan Terrace, looking from the west.
+
-++
1++
>++
0++
2+++
2-++
21++
2>++
20++
21A 21B 21CDAE A=&$5F 9DG*B5%; 9DG*HI&'5=&*J05=@K 9DG*GLMN>8
+
-++
1++
>++
0++
2+++
2-++
21++
2>++
20++
2>A 2>B 2>CDAE A=&$5F 9DG*B5%; 9DG*HI&'5=& 9DG*GLMN>8
Figure 8. Heat energy profi les for 14 Cogan Terrace (DCVis). Figure 9. Heat energy profi les for 16 Cogan Terrace (trickle vents).
Kat Kelly 2019.indd 9 26/11/2019 08:15
than their opposite flats in No.14 Cogan Terrace. This implies that the actual recorded differences in the properties may not be due only to the differences in the ventilation schemes, and there is some extra demand due to other characteristics, e.g. orientation.
Perhaps most significant is how close the actual consumption figures are to the results from the “Additional MVHR” simulation; three out of six of the case study flats have higher actual consumption figures than those generated by the “Additional MVHR” simulation but, importantly, three out of six have lower actual consumption figures, and by margins of 20%-51%. High insulation levels with an MVHR system is generally considered the highest energy efficiency option for building design. To have achieved such comparable results with a control technology, that can be considered cheaper and easier to install, suggests it is a realistic and appealing alternative.
Furthermore, in the real-life Cogan Terrace properties heat is actually recovered from the stale air but via a micro heat pump that feeds the domestic hot water (DHW). If an MVHR system had been used an additional energy source would have been required to heat the DHW. An analysis of the energy performance inclusive of the DHW would be required to prove it, but it seems likely that the case study properties would outperform the alternatives overall. This is outside the scope of this study but will be important in future studies.
Figure 8 and Figure 9 plot all of the heat energy consumption estimates generated by both models and the actual consumption figures recorded. The profile of the consumption figures generated by the DSM follows that of the actual consumptions much more closely than the estimates generated by the SAP. Specifically, in the DSM the ground floor flats have a proportionally much higher energy demand than that of the upper floor flats, in line with the recorded demand. The SAP estimates appear fairly linear. This further confirms the theory that the apparently poor performance of the ground floor flats against the SAP estimates can, at least in part, be explained by dimensional features that were not well represented in the SAP, such as the bay windows in the front bedrooms.
The figures also show how close the actual consumption figures are to the “Additional MVHR” DSM estimates in absolute terms. Previous studies have shown that the use of MVHR can be omitted in mild climates, such as the UK, without compromising energy savings (Sassi, 2013), and the results of this study suggest that greater energy savings could be available via automated control technology.
Further refinement and calibration of the DSM is clearly required to generate better heating profiles before a rigorous assessment of the performance differences could be considered. Equally, further data gathering is required at the case study properties over a number of years to generate a more representative average annual consumption figure.
4.3 Passivhaus
MVHR is stipulated in Passivhaus design and the DSM results above have already demonstrated that the energy consumption recorded at the case study properties is likely to be comparable had an MVHR system been adopted. This is an interesting result given the high energy efficiency status that MVHR systems are accredited, particularly by the Passivhaus standard. However, as already stated, the DSM model requires more work before it could be used for a full comparative performance assessment.
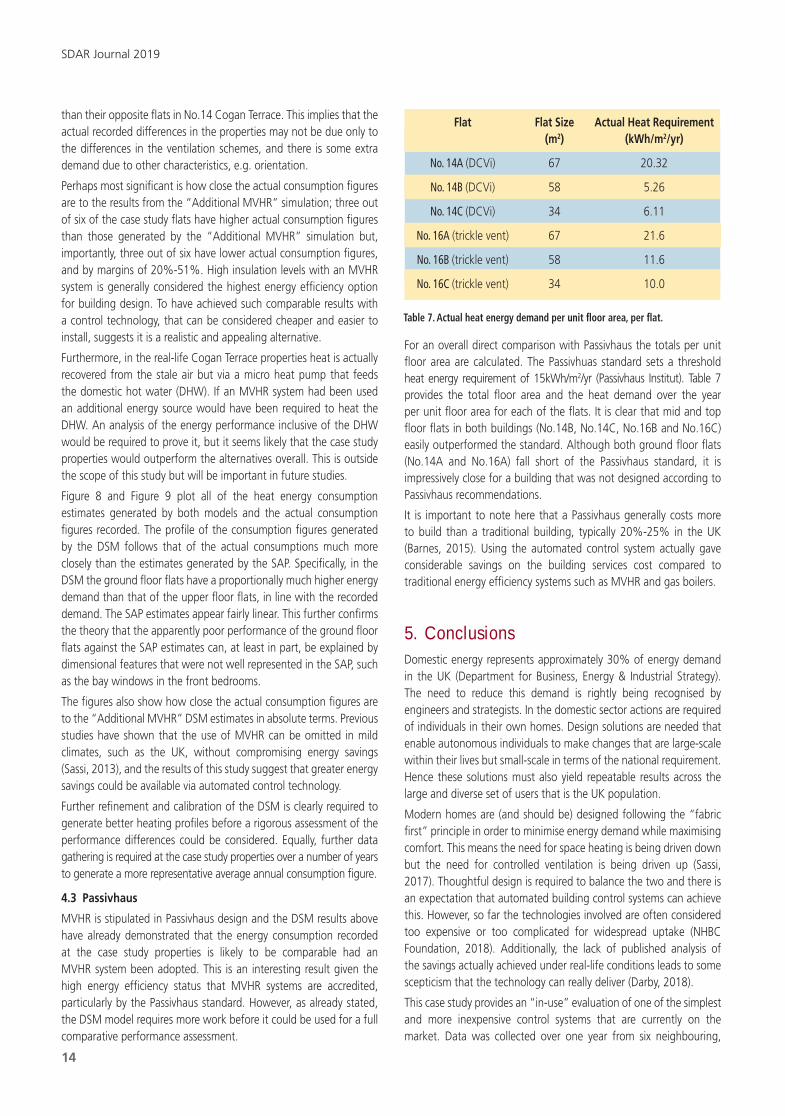
For an overall direct comparison with Passivhaus the totals per unit floor area are calculated. The Passivhuas standard sets a threshold heat energy requirement of 15kWh/m2/yr (Passivhaus Institut). Table 7 provides the total floor area and the heat demand over the year per unit floor area for each of the flats. It is clear that mid and top floor flats in both buildings (No.14B, No.14C, No.16B and No.16C) easily outperformed the standard. Although both ground floor flats (No.14A and No.16A) fall short of the Passivhaus standard, it is impressively close for a building that was not designed according to Passivhaus recommendations.
It is important to note here that a Passivhaus generally costs more to build than a traditional building, typically 20%-25% in the UK (Barnes, 2015). Using the automated control system actually gave considerable savings on the building services cost compared to traditional energy efficiency systems such as MVHR and gas boilers.
5. ConclusionsDomestic energy represents approximately 30% of energy demand in the UK (Department for Business, Energy & Industrial Strategy). The need to reduce this demand is rightly being recognised by engineers and strategists. In the domestic sector actions are required of individuals in their own homes. Design solutions are needed that enable autonomous individuals to make changes that are large-scale within their lives but small-scale in terms of the national requirement. Hence these solutions must also yield repeatable results across the large and diverse set of users that is the UK population.
Modern homes are (and should be) designed following the “fabric first” principle in order to minimise energy demand while maximising comfort. This means the need for space heating is being driven down but the need for controlled ventilation is being driven up (Sassi, 2017). Thoughtful design is required to balance the two and there is an expectation that automated building control systems can achieve this. However, so far the technologies involved are often considered too expensive or too complicated for widespread uptake (NHBC Foundation, 2018). Additionally, the lack of published analysis of the savings actually achieved under real-life conditions leads to some scepticism that the technology can really deliver (Darby, 2018).
This case study provides an “in-use” evaluation of one of the simplest and more inexpensive control systems that are currently on the market. Data was collected over one year from six neighbouring,
Table 7. Actual heat energy demand per unit floor area, per flat.
Flat Flat Size Actual Heat Requirement (m2) (kWh/m2/yr)
No. 14A (DCVi) 67 20.32
No. 14B (DCVi) 58 5.26
No. 14C (DCVi) 34 6.11
No. 16A (trickle vent) 67 21.6
No. 16B (trickle vent) 58 11.6
No. 16C (trickle vent) 34 10.0
SDAR Journal 2019
14
Kat Kelly 2019.indd 10 26/11/2019 08:15

modern-build flats in Cardiff. Every flat benefits from good, but relatively inexpensive, fabric construction and all are fitted with the Atamate building control system.
The energy performance of the case study properties was analysed with respect to heating and ventilation only. The data collected was used to assess whether the target conditions for occupant comfort were obtained and to evaluate the demand reductions made available by the system. In order to quantify the energy savings achieved, the actual recorded energy consumption of the dwellings is compared to the estimates or thresholds generated by the three environmental design/compliance methods suggested in CIBSE’s recent technical memorandum for homes (Lelyveld, et al., 2018):
• Standard Assessment Procedure (SAP)
• Dynamic Simulation Modelling (DSM)
• Passivhaus Standard
Considerable energy efficiencies were identified when compared to the values generated by the SAP in all but the ground floor flats. A number of suggestions were proposed to explain why the ground floor flats performed worse than expected and these warrant further investigation. It is noted however that post-occupancy buildings often perform worse than predicted by the design model, and this is termed the “performance gap”. It is a substantial result that four out of six properties performed better and by a considerable margin.
The DSM provided reference consumption estimates for alternative ventilation systems, given continuous daytime and night time temperature set points. The results of the DSM also show that savings were achieved by the automated heating system at the case study properties. The recorded heat energy consumption figures proved to be comparable to that estimated by simulating an MVHR system. However, it is acknowledged that the DSM requires further refinement before rigorous comparisons can be made.
It was also hypothesised that if the energy demand for DHW were included in a future analysis, then the case study properties could comprehensively outperform the ventilation alternatives considered. This is because the properties use a micro heat pump to recover heat from extracted air for DHW; the alternative ventilation options would require an additional energy source for DHW. The DSM also provided evidence that the poorer performance of the ground floor flats when compared with SAP was due to dimensional features that could be represented in the DSM but not in the SAP, such as bay windows.
It was shown that the energy performance of the properties are comparable to Passivhaus standard, but importantly without any of the restrictive design and additional expenditure typically associated with that method. The construction costs of the case study properties were, in fact, less than typical new buildings with more conventional building service systems and less time was required on site for installation. The low capital expenditure and the reduced lead time, has the potential to appeal to volume house builders, even if the improved energy performance does not.
The results of this study show that the combination of good, but not extraordinary, fabric design and an automated control system can lead to very low energy, and hence low carbon, homes at a price
point that would incentivise widespread role out. This means that the system has the potential to make a considerable contribution to reducing the carbon footprint of new and retrofitted housing stock, and, hence, to meeting the UK carbon reduction targets.
6. Further workFurther investigation of the thermal performance of the buildings needs to be carried out in order to better understand the heat energy consumption figures gathered. As already mentioned, the next step is to use a thermal imaging camera. The results of that investigation will help refine the DSM. This will provide further context for the energy efficiencies achieved but should help improve the design for further installations.
The DSM should be used to investigate a number of other areas more thoroughly. For instance, the impact of using better-performing MVHR systems and the effect of orientation on the energy performance.
Data from the study year was collected for energy use for domestic hot water and lighting. This data is yet to be assessed as rigorously as heating and ventilation have been here. An overall energy performance assessment is required.
The flats became reoccupied in September 2018 and a new study began. During this study year a series of structured occupant interviews will be carried out in order to assess the comfort provided from the tenant perspective. This will be in addition to a full set of sensor data that will be collected again.
Data gathering at the Cogan Terrace properties will be ongoing. As the flats are mostly student rentals, it is likely that the tenants will change most academic years. This provides the opportunity to assess the system with a large pool of users. The intention is that end-of-year results will be compiled regularly. With this data more representative average annual consumption figures can be generated for comparison with modelled estimates and a greater depth of understanding will accumulate.
Exploring the opportunities and challengers presented by buildings with different occupancy patterns will be particularly significant. This study shows that high-response, occupancy-controlled electrical heating can provide occupant comfort with very low overall energy demand in intermittently-occupied buildings such as student accommodation or most family homes. However, it is unlikely to do so in continuously-occupied buildings, such as elderly care accommodation. Identifying the tipping point where an alternative set up is required and what that set-up would be will be an important consideration.
An investigation into how automated systems of this kind could, and are being, retrofitted into existing housing stock, and how they are performing in this sector, is desirable. Working out the ways in which automated systems could reduce the cost and increase the speed of retrofit projects could make a very powerful contribution towards meeting the UK’s low carbon aspirations.
In-Use Energy Performance Study of Automated Smart Homes
15
Kat Kelly 2019.indd 11 26/11/2019 08:15

References
Atamate Ltd. 2018. Atamate Database: 14-16 Cogan Terrace. Oxford : www.atamate.com, 2018.
Barnes, J. 2015. Passivhaus Captital Cost Research Project. UK : Passivhaus Trust, 2015.
Bionda, D and Domingo-Irigoyen, S. 2017. Energy saving potential of occunpancy-based heating control in residential buildings. CISBAT 2017 International Conference - Future Buildings & Districts – Energy Efficiency from Nano to Urban Scale : Energy Procedia, 2017. vol.122: pp.27-31.
Darby, S J. 2018. Smart technology in the home: time for more clarity. UK : Building Research & Information, 2018. vol. 46: pp. 140-147.
Department for Business, Energy & Industrial Strategy. Digest of UK Energy Statistics. [Online] [Cited: 1/ 11/ 2018.] https://www.gov.uk/government/statistics/energy-chapter-1-digest-of-united-kingdom-energy-statistics-dukes.
Hargreaves, T, Nye, M and Burgess, J. 2013. Keeping energy visible? Exploring how householders interact with feedback from smart monitors in the longer term. UK : Energy Policy, 2013. Vol. 52. vol 52: pp.126-134.
Kelly, K A, Sassi, P and Miles, J. 2019. Putting Some Sense into Smart Homes: Proving the Case for Automated Domestic Heating and Ventilation. University of Sheffield : 9th CIBSE Technical Symposium, “Transforming Built Environments – Driving Change with Engineering”, 2019. https://www.cibse.org/knowledge/knowledge-items/detail?id=a0q0O00000GQpIq.
Lelyveld, T, Livingstone, M and Ross, D. 2018. Good practice in the design of homes. UK : Chartered Institute of Building Services Engineers, 2018. TM60.
Louis, J-N, et al. 2015. Environmental Impacts and Benefits of Smart Home Automation: Life Cycle Assessment of Home Energy Management System. Austria : IFAC Conference Paper Archive, 2015. vol. 48-1: pp.880-885.
Masoodian, M, et al. 2014. USEM: A Ubiquitous Smart Energy Management System for Residential Homes. International : Journal on Advances in Intelligent Systems, 2014. vol.7: pp.519-532.
Mehdi, G and Roshchin, M. 2015. Electricity consumption constraints for smart-home automation: An overview of models and applications. 7th International Conference on Sustainability in Energy and Buildings : Energy Procedia, 2015. vol. 83: pp. 60-68.
Mennicken, S and Huang, E.M. 2012. Hacking the natural habitat: An in-the-wild study of smart homes, their development, and the people who live in them. Switzerland : Pervasive Computing, 2012. vol. 7319: pp.143-160.
Met Office UK. Cardiff climate: Averages table. [Online] [Cited: 1/ 11/ 2018.] https://www.metoffice.gov.uk/public/weather/climate/gcjszmp44.
Ministry of Housing, Communities & Local Government. Conservation of fuel and power: Approved Cocument L. [Online] [Cited: 1/ 11/ 2018.] https://www.gov.uk/government/publications/conservation-of-fuel-and-power- approved-document-l.
NHBC Foundation. 2018. NF 80 Futurology: the new home in 2050. 2018. page 26.
Passivhaus Institut. Passive House requirements. [Online] [Cited: 11/ 10/ 2018.] https://passivehouse.com/02_informations/02_passive-house-requirements/ 02_passive-house-requirements.htm.
Sassi, P. 2013. A Natural Ventilation Alternative to the Passivhaus Standard for a Mild Maritime Climate. UK : Buildings, 2013. vol.3: pp.61-78.
Sassi, P. 2017. Thermal comfort and indoor air quality in super-insulated housing with natural and decentralized ventilation systems in the south of the UK. UK : Architectural Science Review, 2017. vol.60: pp. 167-179.
Wilson, C, Hargreaves, T and Hauxwell-Baldwin, R. 2017. Benefits and risks of smart home technologies. UK : Energy Policy, 2017. vol. 103: pp. 72-83.
Acknowledgements
The research reported here was made possible by the support of all at Atamate Ltd and the facilities made available by Oxford Brookes University.
The authors would like to thank all involved with the 2019 CIBSE Technical Symposium, at which the research was first presented.
The authors would also like to thank the anonymous reviewers at SDAR for their time and input.
SDAR Journal 2019
16
Kat Kelly 2019.indd 12 26/11/2019 08:15

fastrack to the top
CIBSE IrelandBoost your work opportunities by joining the group of relevance
You need to be in the room with the group that supports your designs, accredits your course and sets the highest standards for your industry
Join
www.cibseireland.org
www.cibseireland.org
Untitled-4 1 23/11/2019 11:42

BEngTech in Electrical Services Engineering
Level 7
BE
School of Electrical and Electronic Engineering The School of Electrical and Electronic Engineering, Technological University Dublin
(SEEE), is the largest education provider in the electrical and electronic engineering space
in Ireland in terms of programme diversity (apprentice to PhD), staff and student numbers.
TU Dublin (City Campus), formerly DIT (Kevin Street), is based in Dublin city centre and will
be at new facilities at Grangegorman by September 2020. The University is founded on a
long educational heritage (since 1887) and it prides itself on providing practice-based and
professionally-accredited programmes across a variety of full-time and part-time options.
The School also focuses on applied research with a strong emphasis on producing useful
and novel ideas to help Irish industry compete globally. SEEE research is recognised for
its impact and quality, which in many cases is on a par with that of the very best groups
internationally.
SEEE Programmes
Level 9 (Masters)
MSc in Energy Management DT711 or DT015
ME in Sustainable Electrical Energy Systems DT704 or DT705
MSc in Electronic and Communications Engineering DT086
Level 8 (Hons)
BE in Electrical and Electronic Engineering DT021A
BE in Computer and Communications Engineering DT081
BSc in Electrical Services and Energy Management DT035A, DT712 or DT018
BSc in Networking Applications and Services DT080B
Level 7
BEng in Electrical and Communications Engineering DT008
BEngTech in Electrical and Control Engineering DT009
BEngTech in Electrical Services Engineering DT010
BETech in Networking Technologies DT080A
For further information on the SEEE contact:
School of Electrical and Electronic Engineering,
Technological University Dublin, City Campus, Dublin 8
Tel: + 353 1 402 4617/4650/4550 Email: [email protected]
www.dit.ie/electricalelectronicengineering/
TU SEEE SDAR Advert 2019.indd 1 25/11/2019 16:18

Enhancing Thermal Mass Performance of Concrete
Indoor air quality, humidity and thermal conditions: CIBSE review of recent research and guidance in criteria and solutions
Dr Julie GodefroyCHARTERED INSTITUTION OF BUILDING SERVICES ENGINEERS
Dr Anastasia Mylona CHARTERED INSTITUTION OF BUILDING SERVICES ENGINEERS
Julie Godefrey 2019.indd 1 26/11/2019 08:19
Abstract
This paper presents a summary of recent CIBSE guidance
on health and wellbeing in buildings, including how to
define indoor environmental criteria. In a rapidly-evolving
field, it also summarises key areas of current research and
development, how to evaluate such studies, and what to
look out for when reviewing emerging products. The paper
focuses on indoor air quality, thermal comfort and humidity,
but many of its principles are valid for other aspects of
indoor environments.
Overall, CIBSE guidance advocates for source control,
the precautionary principle, and monitoring of building
performance in order to avoid unintended consequences.
Key themes of active research, with potential for significant
improvements to health and comfort, include:
• improving our understanding of conditions best suited to
a range of populations (e.g. the elderly, children);
• assessing the impact of, and designing for, exposure to
a range of environmental stressors. This would be an
evolution from current guidelines which tend to respond
to one factor alone (e.g. responding to combined excessive
heat and noise, rather than to one or the other);
• building our knowledge of impacts and solutions in
the housing retrofit sector, considering jointly the effects
on energy consumption, comfort, indoor air quality
and humidity.
Keywords
Comfort; health; building performance; indoor
environmental conditions; air quality; overheating;
humidity.
SDAR Journal 2019
20
Julie Godefrey 2019.indd 2 26/11/2019 08:19

1. Introduction
The past decade has seen significant advances in our understanding of how environmental factors such as light and air quality affect our health and wellbeing. At the same time, life expectancy is increasing around the world [1]; while this is clearly to be welcomed, it also increases pressures on care and healthcare systems due to ageing populations [2]. In many countries this is accompanied by a rise in non-communicable diseases (NCDs), often related to lifestyles and our physical, social and economic environments [3], [4], and by a rise in health inequalities: in the UK, people in areas of lower incomes live on average nine years less, and spend 18 years more in poor health[5], [6]. Worldwide, our physical environments are also under- going huge changes, from the new dominance of urban living to the ubiquity of electro-magnetic fields from electricity and communications networks. There is therefore increasing attention from health professionals and policy-makers on preventive public health approaches.
In addition, there is a growing realisation of the impact of indoor environments in workplaces, as we spend most of our time indoors, and an increased attention to productivity and well-being, in order to improve competitiveness and attract and retain valued employees [7].
In response to these trends, CIBSE has been doing substantial work to update its guidance on healthy environments, with the publication of revised TM40 – Health and Wellbeing in Building Services – in late 2019. This article presents a summary of key updates including guidance on what constitutes good indoor environments, key areas of knowledge gaps, active research and technical developments. It focuses on indoor air quality, humidity and thermal conditions. TM40 also advocates a similar approach to other environmental factors such as light and acoustics, i.e.:
• Defining clear health-based performance criteria;
• Assessing the site’s characteristics to inform the design strategy;
• Applying the precautionary principle and source control approaches first;
• Monitoring and assessing performance in use, sharing lessons and striving for continuous improvement.
2. Defining environmental criteria for health, comfort and cognitive performance: Proposed approach
Defining criteria for health
An important part of CIBSE’s work has been to define environmental criteria for health, comfort and cognitive performance. This has been done in collaboration with health experts, including Public Health England, and based on a review of the scientific and regulatory background. The aim is not to turn built environment professionals into health experts, but to equip them with a basic understanding of the effects of environments, of core principles such as source control and the precautionary principle, and of the background and caveats behind recommended guidelines.
The new recommended guidelines have been derived from a systematic review of existing health-based guidelines, regulations
(focusing on the UK), and best practice guidance from established
industry sources. The recommendations are expressed in terms of
building performance outcomes for each environmental factor (light,
humidity, thermal conditions etc), using a number of metrics: for example,
pollutant levels in the case of air quality, and recommended ranges and
maximum exceedance levels of operative temperature in the case of
thermal conditions. These recommendations may be used as targets, for
example in new buildings, substantial fit-outs and refurbishments, or as
benchmarks in existing buildings to define priorities and short to longer-
term improvement programmes.
For health purposes, as a very minimum it is recommended to meet
regulatory requirements and recognised health-based guidelines including
those from the World Health Organisation (WHO) (or its recognised
agencies, as in case of electromagnetic fields) and Public Health England.
This is broadly consistent with trends emerging from other recent
guidance documents such as BS ISO 17772:2018, the revised BB101,
2018 [8], and BS EN 16798-1:2019.
What the new approach means, compared to regulatory minima
In many cases in the UK and EU, regulations incorporate and
are more onerous than WHO guidelines; notable exceptions are
indoor air quality and overheating, where there are currently no
comprehensive regulations. Professionals are therefore strongly advised
to refer to WHO guidelines for air quality, and best practice industry
guidance for thermal comfort, including CIBSE TM52 (2013) for non-
domestic buildings and CIBSE TM59 (2017) for dwellings – see
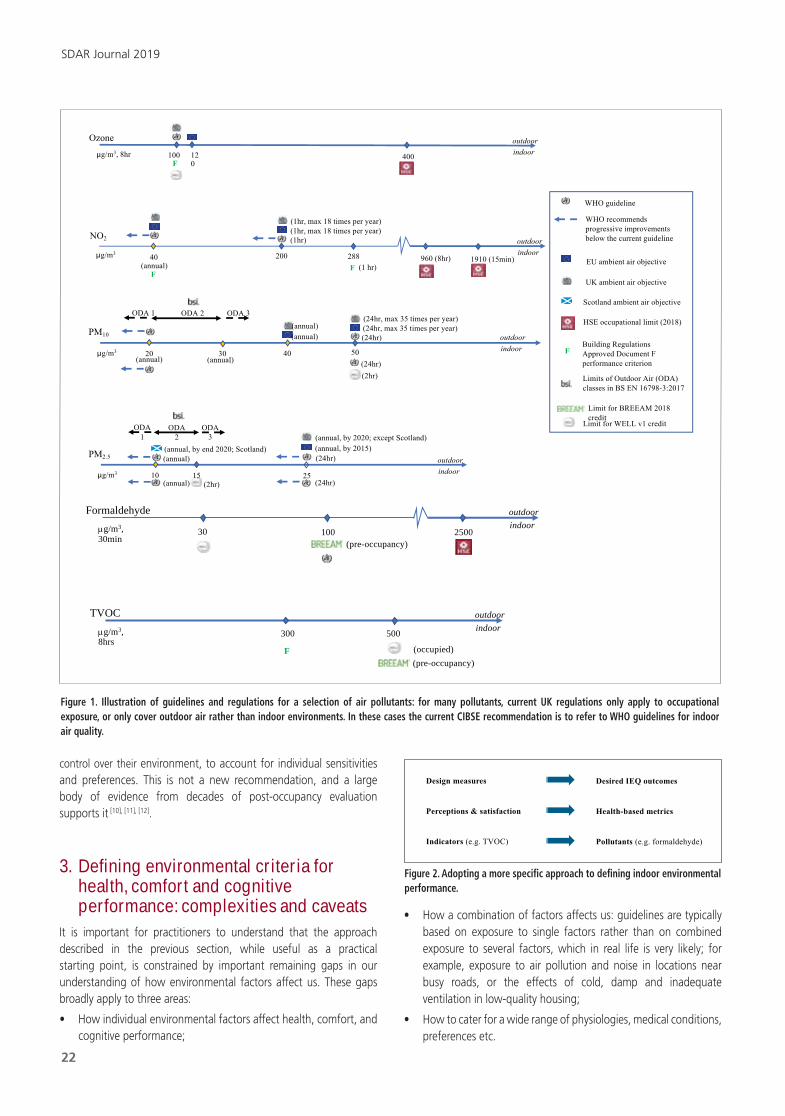
Figure 1, next page.
In some areas such as air quality, the approach proposed in CIBSE
TM40 to define indoor performance criteria represents a significant
shift from current practice: the term “air quality” is often used
by built environment professionals when actually referring to
design measures (e.g. ventilation rates), indicators (e.g. Total Volatile
Organic Compounds – TVOCs) or occupant perceptions (e.g. smells,
complaints of “stuffiness”) – see Figure 2, next page. Ventilation and
indicators without consideration of potential indoor and outdoor
pollutant sources are no guarantee of good indoor air quality.
Similarly, while occupant feedback is useful to gauge comfort and
satisfaction, it does not guarantee health-based outcomes, a stark
example being carbon monoxide which can be lethal but is not detected
by humans. It is also recommended to avoid the term “sick building
syndrome”, which covers a range of possible symptoms and causes,
rather than being specific about what the problem (and therefore the
solution) may be [9].
Defining criteria for comfort
For comfort purposes, current good practice recommendations from
CIBSE have been found to be largely valid, at least in most environments
with healthy populations, which is typically where recommendations were
established in the first place. In these environments, most occurrences
of discomfort reported by users occur in situations when the internal
environment differs from current good practice guidelines. This stresses
the importance of good design and operation, and of user choice and
Indoor air quality, humidity and thermal conditions: CIBSE review of recent research and guidance in criteria and solutions
21
Julie Godefrey 2019.indd 3 26/11/2019 08:19
SDAR Journal 2019
22
control over their environment, to account for individual sensitivities and preferences. This is not a new recommendation, and a large body of evidence from decades of post-occupancy evaluation supports it [10], [11], [12].
3. Defining environmental criteria for health, comfort and cognitive performance: complexities and caveatsIt is important for practitioners to understand that the approach described in the previous section, while useful as a practical starting point, is constrained by important remaining gaps in our understanding of how environmental factors affect us. These gaps broadly apply to three areas:
• How individual environmental factors affect health, comfort, and cognitive performance;
• How a combination of factors affects us: guidelines are typically based on exposure to single factors rather than on combined exposure to several factors, which in real life is very likely; for example, exposure to air pollution and noise in locations near busy roads, or the effects of cold, damp and inadequate ventilation in low-quality housing;
• How to cater for a wide range of physiologies, medical conditions, preferences etc.
Ozone
μg/m3, 8hr 100 120F
400
outdoorindoor
outdoorindoor
PM2.5
μg/m3 1510 25
(24hr)
(annual, by 2020; except Scotland)(annual, by 2015)
(2hr)
(annual, by end 2020; Scotland)(annual) outdoor
indoor(annual) (24hr)
PM10
μg/m3 40 50
(24hr, max 35 times per year)(24hr)
(2hr)
20
(annual)(annual)
(24hr, max 35 times per year)
(annual)
outdoorindoor
(24hr)
288μg/m3 40F
NO2
F
200
(1hr, max 18 times per year)
(annual)
(1hr)
(1 hr)
(1hr, max 18 times per year)
F
WHO guideline
WHO recommends progressive improvements below the current guideline
EU ambient air objective
UK ambient air objective
Scotland ambient air objective
HSE occupational limit (2018)
Building Regulations Approved Document F performance criterion
Limit for BREEAM 2018credit
Limit for WELL v1 creditODA 1
ODA 3
ODA 2
ODA 1 ODA 3ODA 2
(annual)30
Limits of Outdoor Air (ODA) classes in BS EN 16798-3:2017
960 (8hr) 1910 (15min)
Figure 1. Illustration of guidelines and regulations for a selection of air pollutants: for many pollutants, current UK regulations only apply to occupational exposure, or only cover outdoor air rather than indoor environments. In these cases the current CIBSE recommendation is to refer to WHO guidelines for indoor air quality.
TVOCμg/m3, 8hrs
300 500
F
Formaldehydeμg/m3, 30min
30 100 2500
outdoorindoor
outdoorindoor
(occupied)(pre-occupancy)
(pre-occupancy)
Figure 2. Adopting a more specifi c approach to defi ning indoor environmental performance.
Design measures
Perceptions & satisfaction
Indicators (e.g. TVOC)
Desired IEQ outcomes
Health-based metrics
Pollutants (e.g. formaldehyde)
Julie Godefrey 2019.indd 4 26/11/2019 08:19

Some of these knowledge gaps may be filled in the future. For others, their complexity likely means that we will need to rely on a precautionary approach and on knowledge accumulated over time on the range of environmental conditions and design measures which do not show detrimental effects.
3.1 Dealing with varied populations
Current guidelines are necessarily simplified to apply to most cases for healthy adult populations. Guidance for specific parts of the populations which have different sensitivities, such as children, pregnant women, the elderly, or people with existing medical conditions is in general much less established. In comfort terms, guidance is often weighted towards men, due to the fact that many guidelines were initially developed on offices in the 1970s. This may have implications on occupant comfort and satisfaction now. For example, a review of building use studies over 47 non-domestic buildings found that that women had significantly more negative perceptions of air quality and of winter conditions[13]; more research attention is now being placed to better understand comfort for some populations, in particular the elderly [14].
The complexity of catering to a range of populations is illustrated by allergies, asthma and sensitivities, an area where our understanding of cause and effect is still relatively limited: in some cases, individuals exhibiting strong responses to exposure to one substance may be seen as “canaries in the coal mine” i.e. they exhibit a more immediate, obvious and acute reaction to something that affects us all but to lesser degrees. In others, such as food allergies, the reactions are specific to these individuals, whether due to medical conditions or other factors such as medication or drug use, and the rest of the population does not risk harmful effects from exposure. Finally, in other cases individuals are convinced that exposure to a particular factor is causing them harm, and they suffer from very real symptoms, but the current science does not support a causal link to the factor
being blamed. This is the case for example with “electro-sensitivity”, or perceived hyper-sensitivity to electro-magnetic fields (EMFs), where available meta-analyses and double-blind experiments do not support a link between such symptoms and short- or long-term exposure to EMFs [15], [16].
Some evidence suggests there may be broader causes, such as personal circumstances or the acceptance (or not) of new technologies, particularly when these technologies are perceived as imposed without people’s control [17]. This means that built environment professionals sometimes need to show an understanding of people’s very real distress, while being able to support their design proposals with the best available knowledge at the time.
3.2 Indoor air quality
Broad guidelines for indoor air quality (IAQ) are now available as a starting point. In England for example, the National Institute for Care Excellence (NICE) has recently published draft ones on IAQ in homes, for consultation[18]. There are, however, still gaps in a number of areas, such as:
• Cumulative effects of exposure to multiple pollutants, including a combination of particulates, NOx and volatile organic compounds from furniture, finishes and consumer products;
• Mixture effects between these multiple pollutants (“cocktails”) which may reduce or dampen the effect of individual pollutants;
• Emerging pollutants, whether they are new or not much studiedpreviously. One example is pollutants emitted by consumer products such as air fresheners and cleaning or personal care products. Another is fire-retardant materials in furniture, furnishings etc, which are slowly released in our environments. These are often subject to little testing other than on their capacity to delay the onset and spread of fire. Some, such as brominated fire retardants, are known to have detrimental effects and are subject to some limits in parts of the world. There are also concerns that some may increase the risk to health during a fire by releasing toxic fumes, with effects not only on building occupants but also on firefighter populations [19].
3.3 Thermal conditions
There is currently a lack of health-based guidelines on temperatures, especially in terms of upper thresholds and applying to different populations, including the elderly or very young, vulnerable etc. The CIBSE guidelines instead build on decades of empirical research on acceptable comfortable ranges. Research on the impact of thermal conditions on health and comfort sometimes leads to different or even contradictory thresholds and guidelines. Some of the themes being explored are:
• While guidance on temperatures often focuses on experienced thermal comfort, exposure to lower temperatures may have benefits for our metabolism, possibly even more if exposure is for short periods, which prevents acclimatisation [20],[21];
• Current criteria tend to focus on “average” conditions. However, as for all health effects, the notion of exposure is important [22] i.e. how long someone is exposed to a certain temperature, how often, and the extent of the departure from “neutral”. CIBSE TM52 already includes a criterion for severity of overheating in
Indoor air quality, humidity and thermal conditions: CIBSE review of recent research and guidance in criteria and solutions
23
Figure 3: Simple illustration of some of the gaps in our understanding of the effects of environmental factors.
Cocktail effects? A * B
New / unknown stressors
Combined stressors
A + B
Effects???
Stressor A Effect 1
Stressor B Effect 2
Reasonable understanding
Much uncertainty
Figure 4: Simplified representation of the current state of knowledge and certainty in how IEQ guidelines apply to a range of populations.
IEQ guidelines confidence & details
Julie Godefrey 2019.indd 5 26/11/2019 08:19
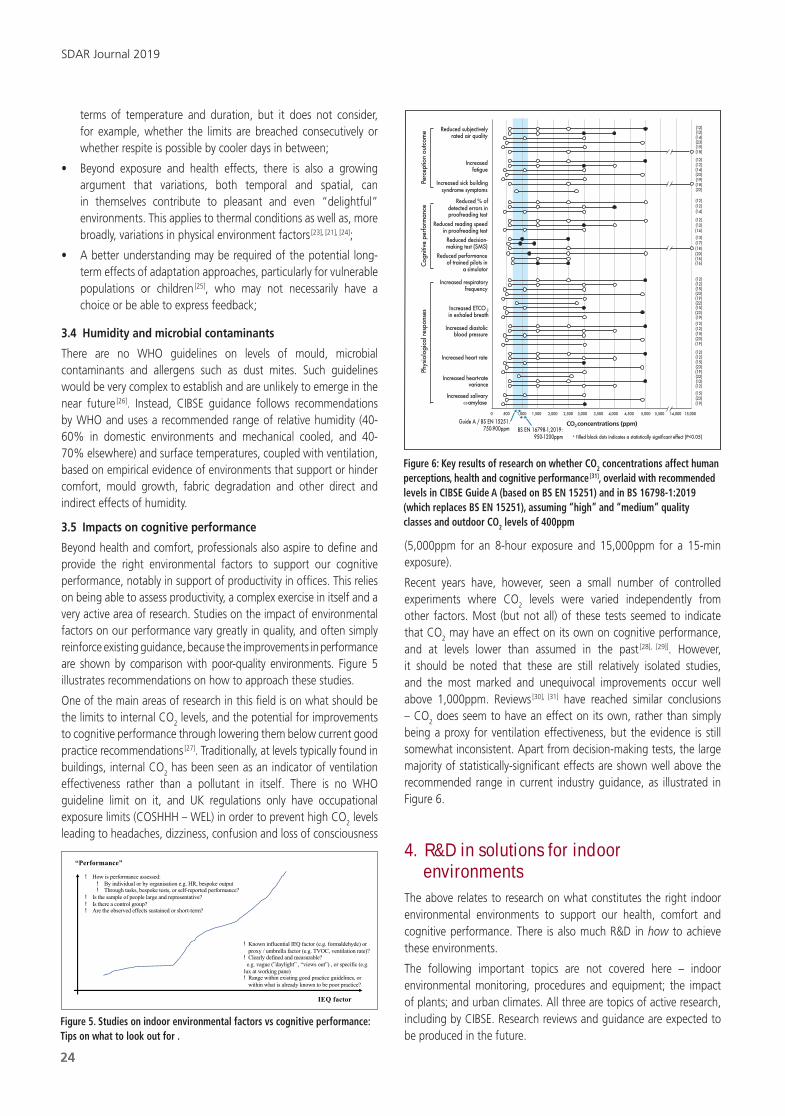
terms of temperature and duration, but it does not consider, for example, whether the limits are breached consecutively or whether respite is possible by cooler days in between;
• Beyond exposure and health effects, there is also a growing argument that variations, both temporal and spatial, can in themselves contribute to pleasant and even “delightful” environments. This applies to thermal conditions as well as, more broadly, variations in physical environment factors [23], [21], [24];
• A better understanding may be required of the potential long-term effects of adaptation approaches, particularly for vulnerable populations or children [25], who may not necessarily have a choice or be able to express feedback;
3.4 Humidity and microbial contaminants
There are no WHO guidelines on levels of mould, microbial contaminants and allergens such as dust mites. Such guidelines would be very complex to establish and are unlikely to emerge in the near future [26]. Instead, CIBSE guidance follows recommendations by WHO and uses a recommended range of relative humidity (40-60% in domestic environments and mechanical cooled, and 40-70% elsewhere) and surface temperatures, coupled with ventilation, based on empirical evidence of environments that support or hinder comfort, mould growth, fabric degradation and other direct and indirect effects of humidity.
3.5 Impacts on cognitive performance
Beyond health and comfort, professionals also aspire to define and provide the right environmental factors to support our cognitive performance, notably in support of productivity in offices. This relies on being able to assess productivity, a complex exercise in itself and a very active area of research. Studies on the impact of environmental factors on our performance vary greatly in quality, and often simply reinforce existing guidance, because the improvements in performance are shown by comparison with poor-quality environments. Figure 5 illustrates recommendations on how to approach these studies.
One of the main areas of research in this field is on what should be the limits to internal CO
2 levels, and the potential for improvements
to cognitive performance through lowering them below current good practice recommendations [27]. Traditionally, at levels typically found in buildings, internal CO
2 has been seen as an indicator of ventilation
effectiveness rather than a pollutant in itself. There is no WHO guideline limit on it, and UK regulations only have occupational exposure limits (COSHHH – WEL) in order to prevent high CO
2 levels
leading to headaches, dizziness, confusion and loss of consciousness
(5,000ppm for an 8-hour exposure and 15,000ppm for a 15-min exposure).
Recent years have, however, seen a small number of controlled experiments where CO
2 levels were varied independently from
other factors. Most (but not all) of these tests seemed to indicate that CO
2 may have an effect on its own on cognitive performance,
and at levels lower than assumed in the past [28], [29][. However, it should be noted that these are still relatively isolated studies, and the most marked and unequivocal improvements occur well above 1,000ppm. Reviews [30], [31] have reached similar conclusions – CO
2 does seem to have an effect on its own, rather than simply
being a proxy for ventilation effectiveness, but the evidence is still somewhat inconsistent. Apart from decision-making tests, the large majority of statistically-significant effects are shown well above the recommended range in current industry guidance, as illustrated in Figure 6.
4. R&D in solutions for indoor environmentsThe above relates to research on what constitutes the right indoor environmental environments to support our health, comfort and cognitive performance. There is also much R&D in how to achieve these environments.
The following important topics are not covered here – indoor environmental monitoring, procedures and equipment; the impact of plants; and urban climates. All three are topics of active research, including by CIBSE. Research reviews and guidance are expected to be produced in the future.
SDAR Journal 2019
24
Figure 5. Studies on indoor environmental factors vs cognitive performance: Tips on what to look out for .
IEQ factor
“Performance”
! How is performance assessed: ! By individual or by organisation e.g. HR, bespoke output ! Through tasks, bespoke tests, or self-reported performance?
! Is the sample of people large and representative? ! Is there a control group?! Are the observed effects sustained or short-term?
! Known influential IEQ factor (e.g. formaldehyde) or proxy / umbrella factor (e.g. TVOC, ventilation rate)?
! Clearly defined and measurable? e.g. vague (”daylight” , “views out”) , or specific (e.g.
lux at working pane)! Range within existing good practice guidelines, or
within what is already known to be poor practice?
Figure 6: Key results of research on whether CO2 concentrations affect human perceptions, health and cognitive performance [31], overlaid with recommended levels in CIBSE Guide A (based on BS EN 15251) and in BS 16798-1:2019 (which replaces BS EN 15251), assuming “high” and “medium” quality classes and outdoor CO2 levels of 400ppm
Reduced subjectively rated air quality
Perc
eptio
n ou
tcom
e
Increased fatigue
Cogn
itive
per
form
ance
Reduced % of detected errors in proofreading test
Reduced reading speed in proofreading test
Reduced decision-making test (SMS)
Reduced performance of trained pilots in
a simulator
Phys
iolo
gica
l res
pons
es
Increased respiratory frequency
Increased ETCO 2 in exhaled breath
Increased diastolic blood pressure
Increased heart rate
Increased heart-rate variance
Increased salivary α-amylase
(12)(12)(14)(23)(19)(18)
(12)(12)(14)(23)(19)(18)(22)
(12)(12)(14)
(12)(12)(14)(13)(17)(18)(20)(16)(16)
(12)(12)(15)(23)(19)(22)(15)(23)(19)(12)(12)(15)(23)(19)
(12)(12)(15)(23)(19)(22)(12)(12)
(15)(23)(19)
0 500 1,000 1,500 2,000 2,500 3,000 3,500 4,000 4,500 5,000 5,500 14,000 15,000
CO2 concentrations (ppm)
* Filled black dots indicates a statistically significant effect (P<0.05)
Increased sick building syndrome symptoms
Guide A / BS EN 15251. 750-900ppm BS EN 16798-1;2019:
950-1200ppm
Julie Godefrey 2019.indd 6 26/11/2019 08:19
Indoor air quality, humidity and thermal conditions: CIBSE review of recent research and guidance in criteria and solutions
4.1 Indoor air quality
Many products are being researched and developed to improve indoor air quality, often focusing on how to “remove” pollutants. The first thing to note is that, as a core principle, source control should be applied in priority, preventing the generation and introduction of pollutants in a space, before attempting to remove them. Following this, known and tested solutions such as filters can be applied (whether established and well-proven, such as particle filters, or more niche solutions starting to be applied to broader contexts, such as carbon filters targeting NOx or VOCs). Notwithstanding this, this section provides an overview of some of the “removal” solutions being researched.
Some, such as traditional building materials, have been in use for a number of years and the main uncertainty is about the claims being made. There is much more uncertainty and risk of unintended consequences with new products, or with well-intentioned phase-outs and substitutions. For example, some concerns have been expressed that the use of low-VOC paints may lead to increased risks of bacteria and mould growth, or to the use of biocides which themselves have adverse effects [17].
The following approach is recommended when examining potential new solutions:
• Are the product’s claimed benefits based on real-world
experiments? If so, how were the multiple parameters of a real-world environment controlled? In the case of laboratory studies, how representative are they of real-life situations?
• Are the effects expected and proven in the long-term?
• The proposed solution may have proven positive impacts on
specific target pollutants, but have possible reactions with other components in the air been considered?
• What is the required extent of application of the system or product (e.g. in exposed area per room volume), and is this realistic?
• If a pollutant is claimed to be “removed”, by which process is
this? In the case of absorption (or other “fixation” process), is it proven over time, taking account of possible re-release? In the case of decomposition, what are the by-products and their effects?
• Are the claims based on independent research?
• Is data available from existing case studies?
The following examples illustrate the importance of these questions.
Photocatalytic removal using titanium dioxide – This has been studied for many years to address a range of pollutants, with potential indoor and outdoor applications including paints or covering on walls and internal duct surfaces. A recent independent comprehensive review [32] on its potential to reduce NOx levels concluded there is little evidence of impact in outdoor applications, or the impact would be very small and require very large exposed areas. It does seem to reduce NOx levels when applied indoors, but there remains much uncertainty on other possible consequences e.g. other hazardous pollutants such as ozone may be generated from the photocatalytic decomposition of NOx or of other air pollutants.
VOC-reducing materials – A number of claims are being made about materials which may help reduce indoor VOC levels, typically either
by absorbing or decomposing them. One example is wool, which has been shown to have VOC absorbent properties. The extent would depend on the type of wool, and the air would need to be in contact with the wool, which implies applications for furniture and flooring/wall coverings rather than insulation [33]. The body of evidence is not yet substantial, and the effect may be small, but long-standing historic applications mean there is little risk of unintended consequence.
Other new products claim to decompose VOCs into “inert products” which would then be either released into the air or bound to the product in question. However, there is little public data on the mechanisms and by-products, and claims should be examined carefully.
Air ionisation – It has been suggested that the ion balance of the air is an important factor in human comfort, with negative ions tending to produce sensations of freshness and well-being, and positive ions causing headache, nausea and general malaise. There is no clear evidence on this. From a medical health point of view (rather than feelings of comfort and wellbeing), a recent review concluded that exposure to negative or positive air ions does not appear to play an appreciable role in respiratory function, with no clear evidence to link exposure to negative air ions with benefits in respiratory function or asthmatic symptom alleviation, nor to link exposure to positive air ions with a significant detrimental effect on respiratory measures [34].
4.2 Thermal comfort
There have been a number of advances in the past few years in how practitioners can assess and respond to overheating risk. The tools available have evolved significantly and now cover a range of contexts and levels of complexity, such as:
• steady-state methods, such as the Passivhaus method (PHPP)or BRE’s Home Quality Mark summer temperature tool, are still constrained by their very nature (typically using monthly whole-dwelling average air temperatures) but have evolved to take account of feedback from completed projects and from more complex methods;
• dynamic modelling is more widely used and has benefitedfrom the framework provided by CIBSE TM59 in residential applications;
• a recent addition to the range of tools available is the guidance produced by the Good Homes Alliance [35]. This provides a simple risk assessment meant for the early stages of design. While the range of factors contributing to overheating risk has been well known for a while, especially thanks to the work of the Zero Carbon Hub, until recently this was typically provided as a long list. The Good Home Alliance guidance attempts to address this by drawing the most important factors (glazing, site context, ventilation strategy and design of the openings) for designers to focus on at the early stages;
• the need for simple and clear guidance based on property type and site context to inform early design decisions was also reinforced by the recently published research into overheating in new homes by MHCLG (https://www.gov.uk/government/publications/research-into-overheating-in-new-homes).
25
Julie Godefrey 2019.indd 7 26/11/2019 08:19
It will be important for these tools to keep evolving and learning from each other and from real-life feedback, as all contain necessary assumptions and simplifications which need to be tested and balanced. See for example recent investigations into modelling vs monitored temperatures in the recent BSERT Special Issue on overheating [36].
Design – it is possible that the evolution of some design approaches will help reduce the risk of overheating risk to a certain extent. For example, we may improve our understanding of where and how to exploit thermal mass in dwellings. While conventionally it has been beneficial in traditional, often rural settings, there are concerns about its use in urban settings where the urban heat island effect reduces the drop in night-time outside temperature and where noise may prevent occupants from opening their windows and cooling down the thermal mass. Furthermore, post-occupancy evaluation often shows that UK occupants are unfamiliar with the concept and, as a result, do not operate it usefully. This may evolve over time with more research, better user education, and technical improvements such as quieter mechanical ventilation systems, acoustically-attenuated openings, and more attention to the location of thermal mass (e.g. away from bedrooms, where it would release heat at night but maybe in other rooms and/or on the outer face of walls).
Product development may also help – Summer bypass functions are currently not always provided on mechanical ventilation with heat recovery (MVHR) units and, when they are, show a wide variety of approaches, some of them likely to compound overheating risk (e.g. reducing the ventilation rate). Ceiling fans may become more commonly available and quieter, ideally used in combination with higher floor-to-ceiling heights. It would also be useful to develop sensors or control strategies that better reflect the conditions experienced by occupants, i.e. at least the operative temperature, rather being based on air temperature only. In highly-glazed buildings this is a known cause of discrepancy between “satisfactory BMS readings” and feedback from occupants.
However, the above are likely only to play a small part in reducing overheating risk. The real benefits will occur by improving our practices of collaboration between clients and engineers to implement passive design strategies from the very early design stages, including site layout and façade design. These are where the most effective measures can be implemented to limit the risk of excessive solar gains, and to ensure heat dissipation through effective ventilation. This should come along with the provision of choice for users, whether it is over temperature, air movement or seating area.
Management – Beyond the design and operation of the buildings themselves, the negative effects of overheating can also be reduced through management, both at the building level (e.g. the relaxation of dress code, as seen during the recent heatwaves in a number of British institutions such as the Lords cricket ground in England and schools in Wales) and at a wider public health policy level. Public Health England estimates that a proportion of excessive summer deaths are preventable through precautions such as awareness and education campaigns. Examples include encouraging regular hydration and social networks around vulnerable populations, and the principles of individual and community preparedness as published in the Heatwave Plan [37] which need to be widely disseminated.
Recent figures give reason for optimism in this area. While the 2003 and 2006 heatwaves are estimated to have caused over 2,000 excessive deaths in England [38], [39], the 2018 heatwave is associated with less than half the number of excessive deaths, below 900, despite having similar temperatures to the 2003 summer. This improvement may, at least partly, be attributed to the presence of a public heatwave planning [39].
4.3 Housing retrofit
Energy efficiency improvements to the existing housing stock have been recommended for a number of years for energy savings and carbon reduction purposes. In addition, housing conditions such as cold and damp are linked to negative health outcomes, particularly for people in fuel poverty [40], [41]. Energy efficient homes in Europe, whether new or retrofitted, are on average linked to better health [42].
Home energy efficiency improvements are therefore recommended by recent EU EPBD amendments [43] and by public health professionals [40], and regulations are increasingly put in place to this effect. In the UK these include the Minimum Energy Efficiency Standards for rented properties in England and Wales [44], the government’s statutory target that all homes in fuel poverty should have an Energy Performance Certificate (EPC) of C by 2030, and its ambition that as many of the other homes as possible should achieve it by 2035 [45].
Reviews of energy efficiency improvements to UK homes have usually found small but significant positive impacts on health, particularly for households on low incomes and on children, the elderly and people in poor health. The benefits can be wide-ranging but are particularly noticeable on specific medical conditions, especially respiratory symptoms and mental health [46], [47], [48], as well as general comfort and living conditions [49]. There is, however, also evidence of potential unintended adverse impacts, chiefly from insufficient ventilation rates leading to high humidity levels promoting mould growth and HDM [50], [51], high levels of indoor pollutants [51] and increased overheating risk [52], [53], [54]. In some cases there is also a risk of fabric degradation, particularly with solid wall insulation programmes which are poorly assessed or implemented [53].
As retrofit programmes are expected to increase in order for the UK (and Ireland) to meet its carbon reduction targets, it will be crucial to avoid unintended consequences on the health and comfort of occupants. The recently-released PAS 2035 provides a first step to whole-house retrofit approaches, and work is already starting on its future revision. Research shows that achieving energy efficiency savings as well as health benefits is possible, but relies on careful consideration and a holistic balance of measures including the following [42],[50],[53],[55], [56]:
• Adequate ventilation rates (energy savings would still be achievable through the overall retrofit);
• Consideration of the need for additional shading and night-time ventilation to limit overheating risk;
• Source control to limit indoor pollutants such as combustion by- products and harmful VOCs;
• Careful assessment of the existing fabric, heat and moisture flows, and proposed technical solutions, including risk of thermal bridging and condensation;
• Good workmanship and quality control procedures;
SDAR Journal 2019
26
Julie Godefrey 2019.indd 8 26/11/2019 08:19

• Training of occupants post-refurbishment, e.g. regular opening of windows, operation and maintenance of mechanical ventilation systems.
In order to address current knowledge gaps and deliver continuous improvements to building performance and to our understanding of effects on occupants’ health and comfort, the impacts of retrofit programmes should be monitored more systematically:
• Joint analysis of impacts on energy consumption, comfort and health: pre- and post-retrofit studies often focus on a particular aspect in isolation, for example investigating changes to health outcomes, but not assessing whether actual energy savings were delivered. As already detailed, retrofit works can impact a number of inter-related factors, including internal temperatures, relative humidity, indoor air quality, fabric degradation and energy consumption. These outcomes should therefore all be examined and reported on jointly. For example, in some cases energy savings may be limited (or non-existent) as heating behaviours change (often described as the rebound effect), but this may in itself have positive effects on thermal comfort and health, particularly in low-income households.
• Monitoring actual outcomes: The impacts in terms of energy savings, the indoor environment or health and wellbeing are often modelled or assessed using proxies (e.g. temperature, VOC levels) rather than being based on measured evidence of energy and health outcomes;
• Data on long-term impacts: currently, the majority of studies focus on the first 12 months after improvement works [46], which may not capture long-term impacts on health outcomes or on fabric degradation.
5. ConclusionThere are still significant areas where our understanding of how to define and deliver indoor environmental conditions could improve our health, comfort and possibly our cognitive performance. Key areas include improving our understanding of conditions best suited to a range of populations (e.g. the elderly, children); assessing the impact of and designing for exposure to a range of environmental stressors, as an evolution from current guidelines which tend to respond to one factor alone (e.g. responding to combined excessive heat and noise); and building our knowledge of impacts and solutions in the housing retrofit sector, considering jointly the effects on energy consumption, comfort, indoor air quality and humidity.
An important conclusion from this evolving field is to follow the precautionary principle and apply source control, since some effects on health many only manifest themselves in the long-term, as in the case of asbestos and lead paint. This does not prevent innovation, but requires a cautious review of claims, possible effects, and monitoring and evaluation to keep new uses under review.
References
1. WHO, Global Health Observatory data, Life Expectancy at Birth, 2015, last updated 6th June 2016 © WHO 2017.
2. House of Lords Select Committee, The Long-term Sustainability of the NHS and Adult Social Care.
3. WHO, Noncommunicable Diseases, Progress Monitor 2017.
4. WHO, A Prüss-Ustün, J Wolf, C Corvalán, R Bos and M Neira, Preventing disease through healthy environments – A global assessment of the burden of disease from environmental risks © World Health Organization 2016.
5. Public Health England, Health Profile for England, September 2018.
6. Marmot Review, Fair Society, Healthy Lives – Strategic Review of Health Inequalities in England Post-2010, Published by The Marmot Review February 2010 © The Marmot Review.
7. British Council for Offices, Wellness Matters, June 2018.
8. Department for Education, Guidelines on ventilation, thermal comfort and indoor air quality in schools, Building Bulletin 101, August 2018.
9. Wolkoff P., Indoor air pollutants in office environments: Assessment of comfort, health, and performance, International Journal of Hygiene and Environmental Health, Volume 216, Issue 4, July 2013, Pages 371–394.
10. Leaman A. and Bordass B., Strategies for Better Occupant Satisfaction, Presented to the Fifth Indoor Air Quality Conference, Thursday 10 July 1997, British Library, London.
11. Leaman A. and Bordass B., ‘Productivity in buildings: the ‘killer’ variables’ Building Research and Information 27 (1) 4–19, 1999.
12. Leaman A., Productivity in Buildings: The Killer Variables Updated, Drawing on material developed jointly with Bill Bordass, Open Plan Working Group, Corporate Consortium XII, McCormick Place Chicago, 4-5pm Thursday April 21, 2005.
13. Aidan T. Parkinson, Richard Reid, Harriet McKerrow & Darren Wright (2018) Evaluating positivist theories of occupant satisfaction: a statistical analysis, Building Research & Information, 46:4, 430-443, DOI: 10.1080/09613218.2017.1314148.
14. Mylona A., Assessing and mitigating overheating in buildings, editorial, BSERT Special Issue – Overheating, Volume: 40 issue: 4, page(s): 385-388, First Published May 12, 2019, Issue published: July 1, 2019.
15. SCENIHR, Opinion on Potential health effects of exposure to electromagnetic fields (EMF), © European Commission 2015.
16. WHO, Electromagnetic fields and public health – Electromagnetic hypersensitivity, Backgrounder, December 2005.
17. Cullinan P., Building health and ill-health, Presentation at annual BSRIA Briefing, November 2016, London.
18. https://www.nice.org.uk/guidance/indevelopment/gid-ng10022/consultation/html-content-2.
19. Stec A., Fire toxicity of construction and building materials; at ASBP conference, February 2018.
20. Johnson F, Mavrogianni A, Ucci M, Vidal-Puig A, Wardle J, Could increased time spent in a thermal comfort zone contribute to population increases in obesity?, Obesity Reviews, 12(7), 543-551, 2011.
21. Lichtenbelt W. vM, Hanssen M., Pallubinsky H., Kingma B., Schellen L., Healthy excursions outside the thermal comfort zone, Building Research & Information special issue: Rethinking Thermal Comfort, 2017.
22. W. Victoria Lee & Koen Steemers, Exposure duration in overheating assessments: a retrofit modelling study, Building Research & Information Vol. 45, Iss. 1-2, 2017.
23. De Dear R, Thermal counterpoint in the phenomenology of architecture – A Phsychophysiological explanation of Heschong’s ‘Thermal Delight’, PLEA 2014, Ahmedabad, 2014.
Indoor air quality, humidity and thermal conditions: CIBSE review of recent research and guidance in criteria and solutions
27
Julie Godefrey 2019.indd 9 26/11/2019 08:19

24. Clements-Croome D (2018) ‘Effects of the built environment on health and wellbeing’, in Clements-Croome D (ed.) Creating the Productive Workplace (3rd edn.) (Routledge).
25. Wargocki P., How Poor Indoor Environmental Quality Affects Performance in Work Environments and Educational Buildings, presentation at UCL IEDE Conference ‘Health, Wellbeing and Productivity in Non-Domestic Buildings’, London, November 2016.
26. WHO, Guidelines for indoor air quality: dampness and mould, © World Health Organization 2009.
27. Bell, J., J. Mabb, V. Garcia-Hansen, B. Bergman, and L. Morawska (2003) “Occupant Health and Productivity: An Australian Perspective.” Proceedings of the CIB 2003 International Conference on Smart and Sustainable Built Environment (SASBE 2003) (Edited by Yang J., P.S. Brandon, and A.C. Sidwell), pp. 687–694.
28. Satish, U., Mendell, M. J., Shekhar K., Hotchi T., Sullivan D., Streufert S., Fisk Z. J. (2012) “Is CO
2 an Indoor Air Pollutant? Direct Effects of Low-to-Moderate
CO2 Concentrations on Human Decision-Making Performance.” Environmental
Health Perspectives 120: 1671–1677.
29. Allen JG, MacNaughton P, Satish U, Santanam S, Vallarino J, Spengler JD. 2016. Associations of cognitive function scores with carbon dioxide, ventilation, and volatile organic compound exposures in office workers: a controlled exposure study of green and conventional office environments. Environ Health Perspect 124:805–812 http://dx.doi.org/10.1289/ehp.1510037.
30. Godefroy J., upcoming joint CIBSE-ASHRAE article in CIBSE Journal September 2019 & ASHRAE Journal, September 2019.
31. Fisk W., Wargowcki P., Zhang X., Do indoor CO2 levels directly affect health or
work performance? CIBSE Journal, September 2019.
32. Defra, Air Quality Expert Group, Paints and Surfaces for the Removal of Nitrogen Oxides, Prepared for: Department for Environment, Food and Rural Affairs; Scottish Government; Welsh Government; and Department of the Environment in Northern Ireland, © Crown copyright 2016
33. Mansour E., Marriott R., Ormondroyd G., Sheep wool insulation for the absorption of volatile organic compounds, Young Researchers’ Forum III Innovation in Construction Materials 12 April 2016.
34. Alexander D D, Bailey W H, Perez V, Mitchell M, Su S, Air ions and respiratory function outcomes: a comprehensive review, Journal of Negative Results in BioMedicine 201312:14 https://doi.org/10.1186/1477-5751-12-14 © Alexander et al.; licensee BioMed Central Ltd. 2013.
35. Good Homes Alliance, Overheating in new homes – Overheating tool and guidance, July 2019 https://goodhomes.org.uk/overheating-in-new-homes.
36. B M Roberts, D Allinson, S Diamond, B Abel, C D Bhaumik, N Khatami and K J Lomas, Predictions of summertime overheating: comparison of dynamic thermal models and measurements in synthetically occupied test houses, BSERT Special Issue – Overheating, Volume: 40 issue: 4, July 1, 2019.
37. https://www.gov.uk/government/publications/heatwave-plan-for-england
38. Met Office, Learning – Learn about the weather – Weather phenomena – Case studies The heatwave of 2003, 2015 .
39. Public Health England, PHE heatwave mortality monitoring - Summer 2018 , 2019.
40. NICE, Excess winter deaths and illness and the health risks associated with cold homes, 2015.
41. Marmot Review Team, The health impacts of cold homes and fuel poverty, 2011.
42. EU JRC, Kephalopoulos S, Geiss O, Barrero-Moreno J, D’Agostino D, Paci D, Promoting healthy and energy efficient buildings in the European Union - National implementation of related requirements of the Energy Performance Buildings Directive (2010/31/EU), 2016.
43. OJEU, Directive (EU) 2018/844 of the European Parliament and of the Council of 30 May 2018 amending Directive 2010/31/EU on the energy performance of buildings and Directive 2012/27/EU on energy efficiency.
44. TSO, Draft Statutory Instruments 2015 No. 0000, Energy Conservation, England and Wales, The Energy Efficiency (Private Rented Property) (England and Wales) Regulations 2015.
45. HM Governement, Clean Growth Strategy, October 2017.
46. Maidment, C.D., et al., The impact of household energy efficiency measures on health: A meta-analysis. Energy Policy, 2013.
47. Liddell, C., Morris, C., Fuel poverty and human health: A review of recent evidence. Energy Policy 38, 2987–2997, 2010.
48. PHIS, Health impact assessment of housing improvements: a guide. Public Health Institute of Scotland and MRC Social and Public Health Sciences Unit, Glasgow, 2013.
49. Poortinga W, Rodgers SE, Lyons RA, Anderson P, Tweed C, Grey C, Jiang S, Johnson R, Watkins A, Winfield TG. The health impacts of energy performance investments in low-income areas: a mixed-methods approach, Southampton (UK): NIHR Journals Library; 2018 Mar. Public Health Research.
50. Ucci, M (2016) Healthy indoor environments: Snapshot of some evidence, solutions and gaps, Presentation at “Breathe Easy – Engineering Air Quality Solutions Now”, 21st October 2016.
51. Bone, A., Murray, V., Myers, I., Dengel, A., Crump, D. (2010) Will drivers for home energy efficiency harm occupant health? Perspect. Publ Health 130, 233–238.
52. DCLG, Housing Health and Safety Rating System, Operating Guidance, February 2006.
53. BRE, Solid wall heat losses and the potential for energy saving – Literature review, Coordinated and collated by Andrew Gemmell at BRE, Prepared for DECC, 2014.
54. X Li, J Taylor and P Symonds, Indoor overheating and mitigation of converted lofts in London, UK, BSERT Special Issue – Overheating, Volume: 40 issue: 4, July 1, 2019.
55. BRE, Weeks C, Ward T, King C, Reducing thermal bridging at junctions when designing and installing solid wall insulation © IHS 2013.
56. Mawditt I., Can we rely on good ventilation? IAQ and ventilation effectiveness, Presentation at “Healthy Buildings” ASBP Conference and Expo, 15th February 2017.
SDAR Journal 2019
28
Julie Godefrey 2019.indd 10 26/11/2019 08:19

Unlimited journal online accessIn addition to the print edition of Building Services News,
the online version is freely accessible and
has an average of 3000+ impressions
every month. To access or download
articles from back issues, or even an
entire journal, simply log on to
www.buildingservices news.com
Or take an online trip down memory laneYou can also read the history and
development of building services
engineering dating back to the early
1960s by accessing back-issues of
Building Services News. Originally
known as the Irish Heating & Plumbing
Engineer, the journal has been in
continuous publication since April
1961 and every single copy of
Building Services News to the
present day is available on the
TU Dublin Arrow site at
http://arrow.dit.ie/bsn/
BSnews Arrow Advert 2019.indd 1 23/11/2019 10:58

Sustainable EngineeringDesign
The SDAR*JournalSeptember 2011
The journal of Applied Research in Innovative Engineering of the Built Environment
Issue 1
SustainableDesign &
Applied Research
in Engineering of the Built Environment
Sustainable Design & Applied Research
in Engineering and the Built EnvironmentJournalIssue 6 December 2016
The SDAR Journal is a scholarly journal in sustainable design and publishes peer reviewed applied research papers.
i dd 1
08/11/2016 14:20
SDAR Journal back-catalogue at your finger tips The SDAR Journal archive goes back over eight previous publications, each one of which includes a wealth of evidence-based research data on a diverse range of building services topics. This treasure trove of highly-informative papers can be accessed freely, and directly, at www.arrow.dit.ie/sdar/
Institutional Repositories (IRs) bring together all of a university’s research under one umbrella, the objective being to preserve the information and to make it available to all interested parties.
www.arrow.dit.ie is TU Dublin’s repository service. It currently hosts 12,614 research papers, has had total downloads of 6.8 million to date, and 1.2 million alone in the last 12 months.
The SDAR Journal home page on the site includes a dramatic readership guide showing real-time downloads in progress on a world map. Since its launch in 2011 we have published 51 papers up to December 2019. We have 55,000 total downloads from 162 countries and from 2,287 individual Institutions. We are averaging about 7,000+ downloads a year.
www.arrow.dit.ie/sdar/
The SDAR Journal is a scholarly journal in sustainable design and publishes peer reviewed applied research papers
Sustainable Design & Applied Research
in Engineering and the Built Environment
Journal
Issue 8 December 2018
Cover SDAR Journal 2018.indd 1
SDAR Promo Advert 2019.indd 1 25/11/2019 16:17

Enhancing Thermal Mass Performance of Concrete
A Critical Literature Review of Spatio-Temporal Simulation Methods for Daylight Glare Assessment
Stephen WasilewskiLUCERNE UNIVERSITY OF APPLIED SCIENCES AND ARTS, HORW, SWITZERLAND
ÉCOLE POLYTECHNIQUE FÉDÉRALE DE LAUSANNE, SWITZERLAND
Lars Oliver Grobe LUCERNE UNIVERSITY OF APPLIED SCIENCES AND ARTS, HORW, SWITZERLAND
Jan Wienold ÉCOLE POLYTECHNIQUE FÉDÉRALE DE LAUSANNE, SWITZERLAND
jan.wienold@epfl .ch
Marilyne Andersen ÉCOLE POLYTECHNIQUE FÉDÉRALE DE LAUSANNE, SWITZERLAND
marilyne.andersen@epfl .ch
Stephen Wasilewski 2019.indd 1 26/11/2019 08:21

Abstract
A well daylighted space can provide a highly satisfying
visual environment. However, if that environment causes
us visual discomfort, it can become such a nuisance that
we, sometimes literally, turn our backs on this powerful
connection to the outside world. Given this, there is
enormous value in quantifying the occurrence of discomfort
glare within buildings, and in glare models that may guide
architects and engineers in design.
With the success of climate-based modeling techniques
for daylight illuminance, there is now a focus on including
discomfort glare metrics in spatio-temporal evaluations. This
article conducts a literature review of research focused on
spatio-temporal simulations for glare assessment. Studies are
reviewed according to their objectives, metrics calculated,
spatial scope, temporal scope and scene variety. The goal is
to document the limitations of current simulation methods,
the potential to generally apply these methods, and how
well these methods incorporate empirical glare research.
This review finds that, due to computational constraints,
there is an over-reliance on illuminance-based metrics
for spatio-temporal glare assessment, even while user
assessment research reinforces the importance of including
contrast-based measures. To achieve an accurate zonal glare
assessment, future research should focus on improving
simulation efficiency and identifying ways to reduce the
spatial, temporal and angular scope of the simulation,
while maintaining high accuracy.
Nomenclature
Eh Horizontal illuminance (lux)
Ev Vertical illuminance (lux)
Lb Background luminance (cd/m2)
Ls Source luminance (cd/m2)
s Source solid angle (steradians)
ASE Annual Sunlight Exposure (IESNA, 2012)
CGI CIE Glare Index (Einhorn, 1979)
DGI Daylight Glare Index (Hopkinson, 1972)
DGP Daylight Glare Probability (Wienold and Christoffersen, 2006)
DGPs A simplified approximation of DGP based only on Ev (Wienold, 2007)
eDGPs Daylight Glare Probability (Wienold, 2009)
UDI Useful Daylight Illuminance (Nabil and Mardaljevic, 2005)
UDIe Useful Daylight Illuminance Exceeded (Nabil and Mardaljevic, 2005)
UGP Unified Glare Probability (Hirning et al, 2014)
UGR Unified Glare Rating (International Commission on Illumination, 1995)
SDAR Journal 2019
32
Stephen Wasilewski 2019.indd 2 26/11/2019 08:21
1. Introduction
1.1 Measuring glare from daylight in buildings
Discomfort glare from daylight is a multi-faceted phenomenon resulting from physical, psychological and physiological factors acting on building occupants. Unlike electric lighting, which operates in a fixed range of states and can be specifically designed and positioned to control the lighting distribution, daylight relies on the ever-changing sky and the complicated pathway between the sky and the occupants’ eyes that interacts with much of the built environment. This combination of the many factors associated with glare, and the dynamic nature of daylight, make measuring and predicting discomfort glare from daylight exceptionally more difficult than either assessing glare from electric lighting or determining more basic photometric quantities, like illuminance, commonly used as an indicator of daylight performance.
In user assessments, metrics and quantities associated with visual comfort (Ev, DGP, luminance ratios) show a stronger relationship with user satisfaction than horizontal desktop illuminance values (Van Den Wymelenberg, 2014), but horizontal illuminance metrics prevail as the dominant metric for building standards. Examples include the IES Lighting Handbook (DiLaura and IESNA, 2011) and the IES Daylight Standard (IESNA, 2012). This is partially a legacy inherited from electric lighting and standards determined first by what electric lighting could deliver and then later by energy costs (Osterhaus, 1993).
The new European Standard EN 17037 (European Committee for Standardisation CEN, 2019) begins to address this, as it includes a glare evaluation using DGP alongside illuminance-based daylight metrics, but the standard is only a recommendation and is not yet required for any certification. However, it can be expected that national legislation as well as certifications will refer to the methods and thresholds and use them as a requirement in future. Perhaps the biggest factor for continued reliance on horizontal illuminance metrics is the efficiency with which they can be calculated, visualised and analysed zonally with a well-established, if arbitrary, acceptance criteria (Tregenza and Mardaljevic, 2018). In addition to being an important factor in determining indoor environmental quality, glare that is unaccounted for in the design stage leads to occupant intervention, such as lowering blinds etc, and has a direct impact on daylight availability and lighting energy use.
Without reliable and efficient methods for predicting glare throughout a building and over the course of a year, it is not possible to accurately assess the daylight performance of a building, in terms of either visual comfort or daylight availability. To this end, a number of published articles in the past decade have proposed, tested or reviewed simplified simulation methods as a path towards spatio-temporal glare (herein defined as assessing glare spatially throughout a building zone accounting for temporally changing sky conditions). This paper reviews these articles to determine what progress has been made, what areas of inquiry require more research, and how compatible these approaches are with current instantaneous user assessment glare research.
The need for a method to determine spatio-temporal glare metrics for building design is clear. A spatio-temporal approach enables the
formulation of zonal metrics that are the standard for thermal comfort, electric lighting and, increasingly, for daylight availability (Atzeri et al, 2016). Active façade systems like venetian blinds and roller blinds are typically controlled zonally, and in open office areas there is not a one-to-one relationship between window and occupant because one person’s glare can reduce another person’s view and daylight illumination. For wide-ranging purposes from advanced façade control to compliance modeling and design optimisation, it is essential to have a metric from which a zonal determination can be made, even if a single metric cannot capture the natural variability of daylight across the space.
Increasingly, building regulations and standards are adopting visual comfort metrics for daylight visual comfort. These standards either rely on proxy measurements (like ASE) that do not account for material properties, prescriptive recommendations, or simulation requirements that rely on the practitioners to determine the pointof evaluation. The new European Standard (EN 17037) includes a performance path which includes an annual glare assessment from a worst-case point, but there is no criteria for determining that point and view direction (European Committee for Standardization CEN, 2019).
LEED daylighting requirements are built around daylight autonomy and glare is addressed implicitly in the annual sun exposure calculation (IESNA, 2012). This only indicates the presence of uncontrolled direct sun and does not assess glare through perforated, fabric, diffusing or otherwise redirecting materials. The WELL building standard also uses an ASE calculation buttressed by a number of prescriptive requirements to reduce the likelihood of glare (International WELL Building Institute, 2019). In the United Kingdom, public schools must meet standards according to Useful Daylight Illuminance (UDI) which uses an upper threshold (UDIe) as its discomfort glare metric (Education Funding Agency, 2014).
1.2 Relevant factors for glare assessment
While the methods and metrics for predicting glare are still widely questioned, there is a reasonable consensus on what the principal factors are that contribute to glare. The current understanding of these factors is well documented in a review article by Pierson et al, (2018). The factors related to discomfort glare can be divided into two broad categories – external (pertaining to the environment or an occupant’s position therein) or internal (pertaining to the specific nature of the occupant). Daylight simulation will principally focus only on the external factors. Incorporating internal factors to a glare analysis could be achieved through a correction factor or other post- processing of the data, and it is unlikely that an internal factor would increase the simulation requirements beyond the identified external requirements. As established in the review by Pierson et al, (2018), the external factors most consistently linked to glare are the:
• Saturation effect; • Contrast effect;
• Luminance of the glare source; • Size of the glare source;
• Adaptation level; • Position of the glare source.
Accurate simulation of glare conditions will thus require, at a minimum, the luminance distribution in all directions seen from a point, knowledge of the occupant view direction, and the adaptation of the eye (possibly related to both the light incident on the eye and
A Critical Literature Review of Spatio-Temporal Simulation Methods for Daylight Glare Assessment
33
Stephen Wasilewski 2019.indd 3 26/11/2019 08:21

SDAR Journal 2019
34
Figure 1. Simulation scope for luminance and illuminance-based simulations. Note that a single luminance image will contain the resolution squared number of samples, while the illuminance produces a single value. With a luminance image, sun, sky, task and background can all be extracted as separate statistics, whereas an illuminance value must be calculated separately for each source and ambient parameter.
the luminance of the object of focus). A good example of this level of detail is demonstrated in a paper by Amundadottir et al, (2017).
A recently-published validation study by Wienold et al, (2019) looked at the performance of established glare prediction metrics and found that for daylight-dominated workspaces, metrics that combine the contrast effect (which require the luminance distribution to calculate) and the saturation effect as input perform the best and are more robust across different lighting conditions. For the conditions included in the subject studies (typically window adjacent workspaces), DGP, which prioritises the saturation effect, performs the best.
There is still a question as to how to balance the two effects in deep floor plate buildings where there have not been the same number of user assessment studies. A field study of open plan buildings by Hirning et al, (2014) found that metrics (like UGR), which only measure contrast effects, perform the best, although Osterhaus (2005) demonstrates that UGR is inaccurate for large area glare sources such as nearby windows. Future research will need to resolve this transition from saturation-dominated environments to contrast-driven ones, but in any case, simulation methods will need to provide for both when used for glare assessments of building designs.
1.3 Simulation methods
When simulation (used to mean the physical simulation of light propagation into buildings) for glare assessment is extended to include multiple positions and times, sampling occurs across the dimensions of position (three degrees of freedom), view direction (two degrees of freedom), and sky condition (two degrees of freedom when represented spatially). While each of these dimensions require some level of detail to perform a zonal and climate-based spatio-temporal assessment, a high-resolution sampling across all seven of these dimensions requires a large, and typically infeasible, number of calculations. Instead, depending on the objectives of the reviewed papers, one or more of these dimensions are collapsed to a single value. Within the context of these objectives, this review is organised around each of these dimensions.
The angular resolution of the incident light is determined by either the simulation method employed or the requirements of the physical
quantities needed to calculate a desired metric. All of the reviewed articles use established or novel methods to efficiently perform the large number of simulations required. Figure 1 illustrates the scope of a single position and point-in-time illuminance or luminance- based simulation, and what discrete information can potentially be extracted from the output. Table 1 identifies which scope is needed to calculate the set of instantaneous metrics (measuring glare for a single time-step and point-in-time) included in at least one of the reviewed papers. Assuming a backwards ray-tracing algorithm, simulating a single pixel of a luminance map (representing some discrete s) requires calculating the illuminance at every point a view ray intersects the scene. This means that each view ray (image pixel) can take as much time as calculating a single illuminance value.
Glare Required RequiredMetric or Quantity SimulationQuantity Scope*
DGI Ls , Lb, s Luminance
DGP Ls , Ev , s Luminance
eDGPs Ls, E
v, s Luminance (direct view) +
Illuminance
DGPs Ev Illuminance
UGR Ls , Lb , s Luminance
Ev - Illuminance
Eh - Illuminance
Eh,dir - Illuminance (sun only)
2. Literature review
2.1 Scope
The purpose of this review is to gather the breadth of simulation techniques employed and to summarise what the current state-of-the-art is in simulation for glare assessment across time and space. An extensive search yielded the set of peer-reviewed journal articles, conference papers and academic theses published between 2007 and 2019 shown in Table 2.
Publications for this literature review were initially found using Google Scholar. The search methods used were keyword searches, “cited by” searches, and checking the citations of found publications to conduct additional rounds of “cited by” searches. Keywords included common daylight glare indices and terms for annual simulation, glare and contrast. “Cited by” searches were performed both on publications identified for inclusion in the review set and publications used as general reference for this article. The journals of included studies were also searched for additional articles that otherwise were not found. This process was repeated iteratively over the course of writing this review, from April to September 2019. A publication was included in the review set if it met all of the following criteria:
• Is published in a peer-reviewed journal or conference proceedings, or is an accepted graduate level thesis from an accredited university;
Table 1. Single position and time glare metrics and their dependencies (*Luminance or Illuminance).
Vertical
Horizontal
Luminance Sampling Illuminance Sampling
SunSkyTaskBackground
Direct SunOther
Stephen Wasilewski 2019.indd 4 26/11/2019 08:21
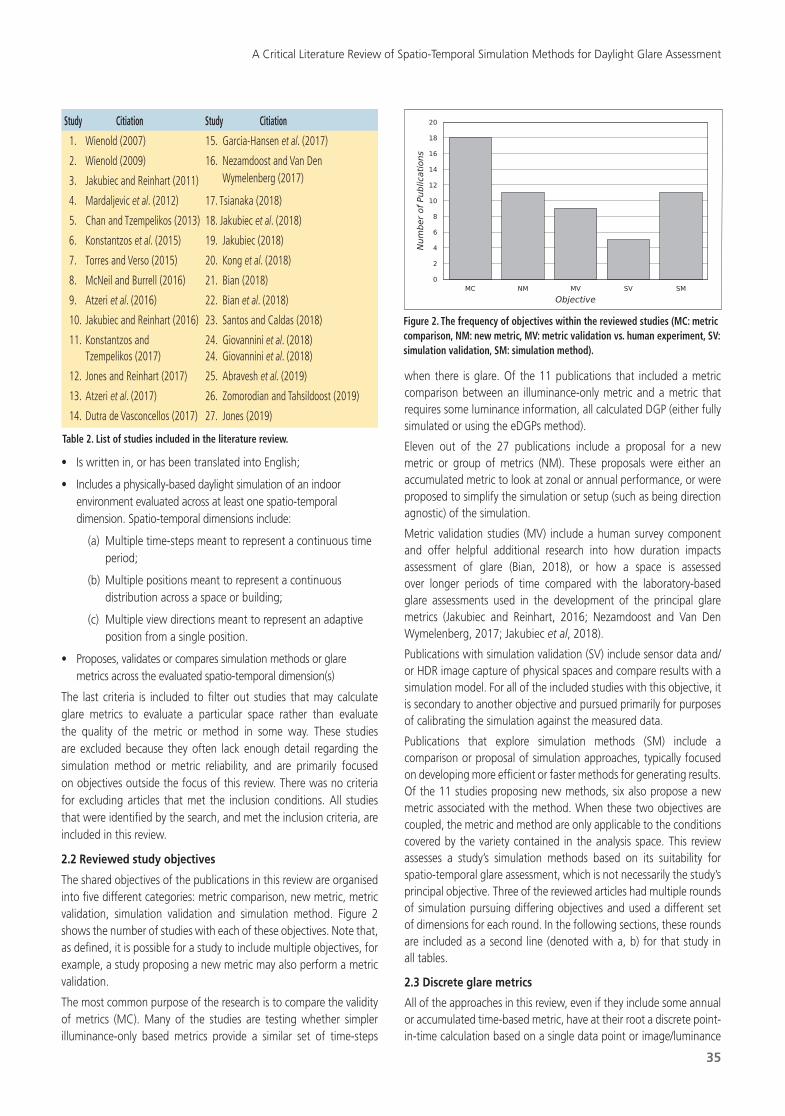
• Is written in, or has been translated into English;
• Includes a physically-based daylight simulation of an indoor environment evaluated across at least one spatio-temporal dimension. Spatio-temporal dimensions include:
(a) Multiple time-steps meant to represent a continuous time period;
(b) Multiple positions meant to represent a continuous distribution across a space or building;
(c) Multiple view directions meant to represent an adaptive position from a single position.
• Proposes, validates or compares simulation methods or glare metrics across the evaluated spatio-temporal dimension(s)
The last criteria is included to filter out studies that may calculate glare metrics to evaluate a particular space rather than evaluate the quality of the metric or method in some way. These studies are excluded because they often lack enough detail regarding the simulation method or metric reliability, and are primarily focused on objectives outside the focus of this review. There was no criteria for excluding articles that met the inclusion conditions. All studies that were identified by the search, and met the inclusion criteria, are included in this review.
2.2 Reviewed study objectives
The shared objectives of the publications in this review are organised into five different categories: metric comparison, new metric, metric validation, simulation validation and simulation method. Figure 2 shows the number of studies with each of these objectives. Note that, as defined, it is possible for a study to include multiple objectives, for example, a study proposing a new metric may also perform a metric validation.
The most common purpose of the research is to compare the validity of metrics (MC). Many of the studies are testing whether simpler illuminance-only based metrics provide a similar set of time-steps
when there is glare. Of the 11 publications that included a metric comparison between an illuminance-only metric and a metric that requires some luminance information, all calculated DGP (either fully simulated or using the eDGPs method).
Eleven out of the 27 publications include a proposal for a new metric or group of metrics (NM). These proposals were either an accumulated metric to look at zonal or annual performance, or were proposed to simplify the simulation or setup (such as being direction agnostic) of the simulation.
Metric validation studies (MV) include a human survey component and offer helpful additional research into how duration impacts assessment of glare (Bian, 2018), or how a space is assessed over longer periods of time compared with the laboratory-based glare assessments used in the development of the principal glare metrics (Jakubiec and Reinhart, 2016; Nezamdoost and Van Den Wymelenberg, 2017; Jakubiec et al, 2018).
Publications with simulation validation (SV) include sensor data and/or HDR image capture of physical spaces and compare results with a simulation model. For all of the included studies with this objective, it is secondary to another objective and pursued primarily for purposes of calibrating the simulation against the measured data.
Publications that explore simulation methods (SM) include a comparison or proposal of simulation approaches, typically focused on developing more efficient or faster methods for generating results. Of the 11 studies proposing new methods, six also propose a new metric associated with the method. When these two objectives are coupled, the metric and method are only applicable to the conditions covered by the variety contained in the analysis space. This review assesses a study’s simulation methods based on its suitability for spatio-temporal glare assessment, which is not necessarily the study’s principal objective. Three of the reviewed articles had multiple rounds of simulation pursuing differing objectives and used a different set of dimensions for each round. In the following sections, these rounds are included as a second line (denoted with a, b) for that study in all tables.
2.3 Discrete glare metrics
All of the approaches in this review, even if they include some annual or accumulated time-based metric, have at their root a discrete point-in-time calculation based on a single data point or image/luminance
A Critical Literature Review of Spatio-Temporal Simulation Methods for Daylight Glare Assessment
35
Study Citiation Study Citiation
1. Wienold (2007) 15. Garcia-Hansen et al. (2017)
2. Wienold (2009) 16. Nezamdoost and Van Den
3. Jakubiec and Reinhart (2011) Wymelenberg (2017)
4. Mardaljevic et al. (2012) 17. Tsianaka (2018)
5. Chan and Tzempelikos (2013) 18. Jakubiec et al. (2018)
6. Konstantzos et al. (2015) 19. Jakubiec (2018)
7. Torres and Verso (2015) 20. Kong et al. (2018)
8. McNeil and Burrell (2016) 21. Bian (2018)
9. Atzeri et al. (2016) 22. Bian et al. (2018)
10. Jakubiec and Reinhart (2016) 23. Santos and Caldas (2018)
11. Konstantzos and 24. Giovannini et al. (2018) Tzempelikos (2017) 24. Giovannini et al. (2018)
12. Jones and Reinhart (2017) 25. Abravesh et al. (2019)
13. Atzeri et al. (2017) 26. Zomorodian and Tahsildoost (2019)
14. Dutra de Vasconcellos (2017) 27. Jones (2019)
Table 2. List of studies included in the literature review.
Figure 2. The frequency of objectives within the reviewed studies (MC: metric comparison, NM: new metric, MV: metric validation vs. human experiment, SV: simulation validation, SM: simulation method).
Stephen Wasilewski 2019.indd 5 26/11/2019 08:21
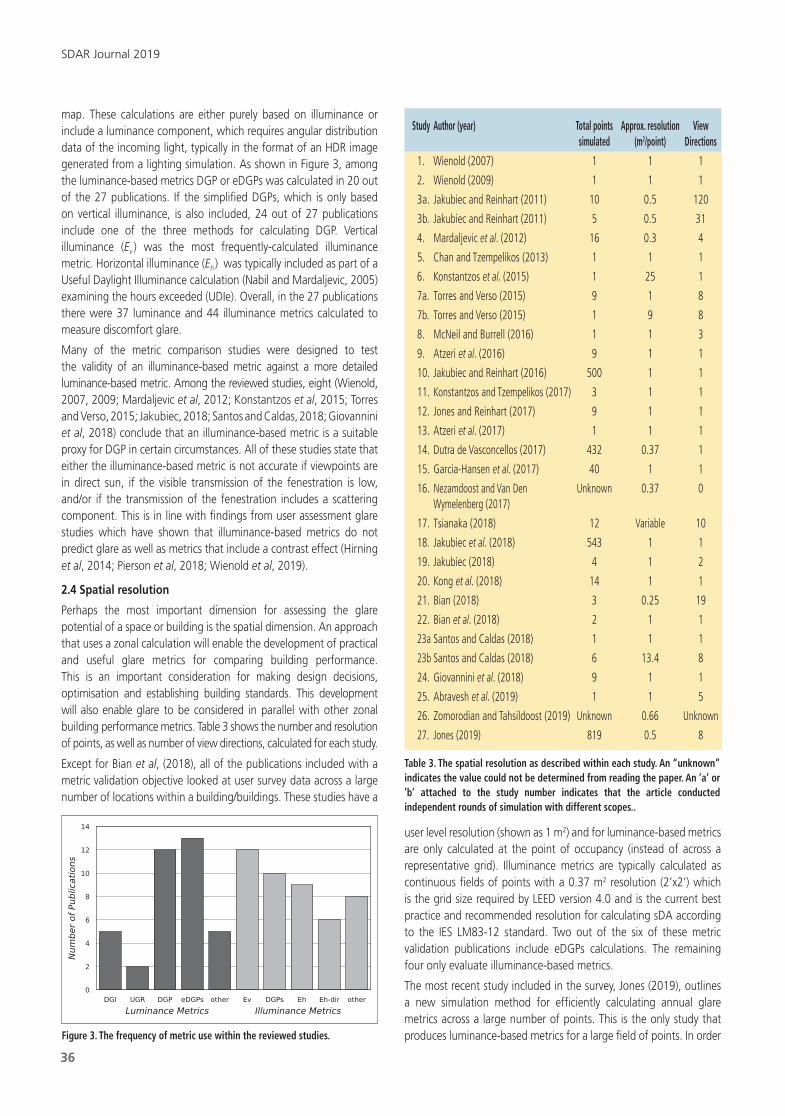
map. These calculations are either purely based on illuminance or include a luminance component, which requires angular distribution data of the incoming light, typically in the format of an HDR image generated from a lighting simulation. As shown in Figure 3, among the luminance-based metrics DGP or eDGPs was calculated in 20 out of the 27 publications. If the simplified DGPs, which is only based on vertical illuminance, is also included, 24 out of 27 publications include one of the three methods for calculating DGP. Vertical illuminance (Ev ) was the most frequently-calculated illuminance metric. Horizontal illuminance (Eh ) was typically included as part of a Useful Daylight Illuminance calculation (Nabil and Mardaljevic, 2005) examining the hours exceeded (UDIe). Overall, in the 27 publications there were 37 luminance and 44 illuminance metrics calculated to measure discomfort glare.
Many of the metric comparison studies were designed to test the validity of an illuminance-based metric against a more detailed luminance-based metric. Among the reviewed studies, eight (Wienold, 2007, 2009; Mardaljevic et al, 2012; Konstantzos et al, 2015; Torres and Verso, 2015; Jakubiec, 2018; Santos and Caldas, 2018; Giovannini et al, 2018) conclude that an illuminance-based metric is a suitable proxy for DGP in certain circumstances. All of these studies state that either the illuminance-based metric is not accurate if viewpoints are in direct sun, if the visible transmission of the fenestration is low, and/or if the transmission of the fenestration includes a scattering component. This is in line with findings from user assessment glare studies which have shown that illuminance-based metrics do not predict glare as well as metrics that include a contrast effect (Hirning et al, 2014; Pierson et al, 2018; Wienold et al, 2019).
2.4 Spatial resolution
Perhaps the most important dimension for assessing the glare potential of a space or building is the spatial dimension. An approach that uses a zonal calculation will enable the development of practical and useful glare metrics for comparing building performance. This is an important consideration for making design decisions, optimisation and establishing building standards. This development will also enable glare to be considered in parallel with other zonal building performance metrics. Table 3 shows the number and resolution of points, as well as number of view directions, calculated for each study.
Except for Bian et al, (2018), all of the publications included with a metric validation objective looked at user survey data across a large number of locations within a building/buildings. These studies have a
user level resolution (shown as 1 m2) and for luminance-based metrics are only calculated at the point of occupancy (instead of across a representative grid). Illuminance metrics are typically calculated as continuous fields of points with a 0.37 m2 resolution (2’x2’) which is the grid size required by LEED version 4.0 and is the current best practice and recommended resolution for calculating sDA according to the IES LM83-12 standard. Two out of the six of these metric validation publications include eDGPs calculations. The remaining four only evaluate illuminance-based metrics.
The most recent study included in the survey, Jones (2019), outlines a new simulation method for efficiently calculating annual glare metrics across a large number of points. This is the only study that produces luminance-based metrics for a large field of points. In order
SDAR Journal 2019
36
Figure 3. The frequency of metric use within the reviewed studies.
Study Author (year) Total points Approx. resolution View simulated (m2/point) Directions
1. Wienold (2007) 1 1 1
2. Wienold (2009) 1 1 1
3a. Jakubiec and Reinhart (2011) 10 0.5 120
3b. Jakubiec and Reinhart (2011) 5 0.5 31
4. Mardaljevic et al. (2012) 16 0.3 4
5. Chan and Tzempelikos (2013) 1 1 1
6. Konstantzos et al. (2015) 1 25 1
7a. Torres and Verso (2015) 9 1 8
7b. Torres and Verso (2015) 1 9 8
8. McNeil and Burrell (2016) 1 1 3
9. Atzeri et al. (2016) 9 1 1
10. Jakubiec and Reinhart (2016) 500 1 1
11. Konstantzos and Tzempelikos (2017) 3 1 1
12. Jones and Reinhart (2017) 9 1 1
13. Atzeri et al. (2017) 1 1 1
14. Dutra de Vasconcellos (2017) 432 0.37 1
15. Garcia-Hansen et al. (2017) 40 1 1
16. Nezamdoost and Van Den Unknown 0.37 0 Wymelenberg (2017)
17. Tsianaka (2018) 12 Variable 10
18. Jakubiec et al. (2018) 543 1 1
19. Jakubiec (2018) 4 1 2
20. Kong et al. (2018) 14 1 1
21. Bian (2018) 3 0.25 19
22. Bian et al. (2018) 2 1 1
23a Santos and Caldas (2018) 1 1 1
23b Santos and Caldas (2018) 6 13.4 8
24. Giovannini et al. (2018) 9 1 1
25. Abravesh et al. (2019) 1 1 5
26. Zomorodian and Tahsildoost (2019) Unknown 0.66 Unknown
27. Jones (2019) 819 0.5 8
Table 3. The spatial resolution as described within each study. An “unknown” indicates the value could not be determined from reading the paper. An ’a’ or ’b’ attached to the study number indicates that the article conducted independent rounds of simulation with different scopes..
Stephen Wasilewski 2019.indd 6 26/11/2019 08:21
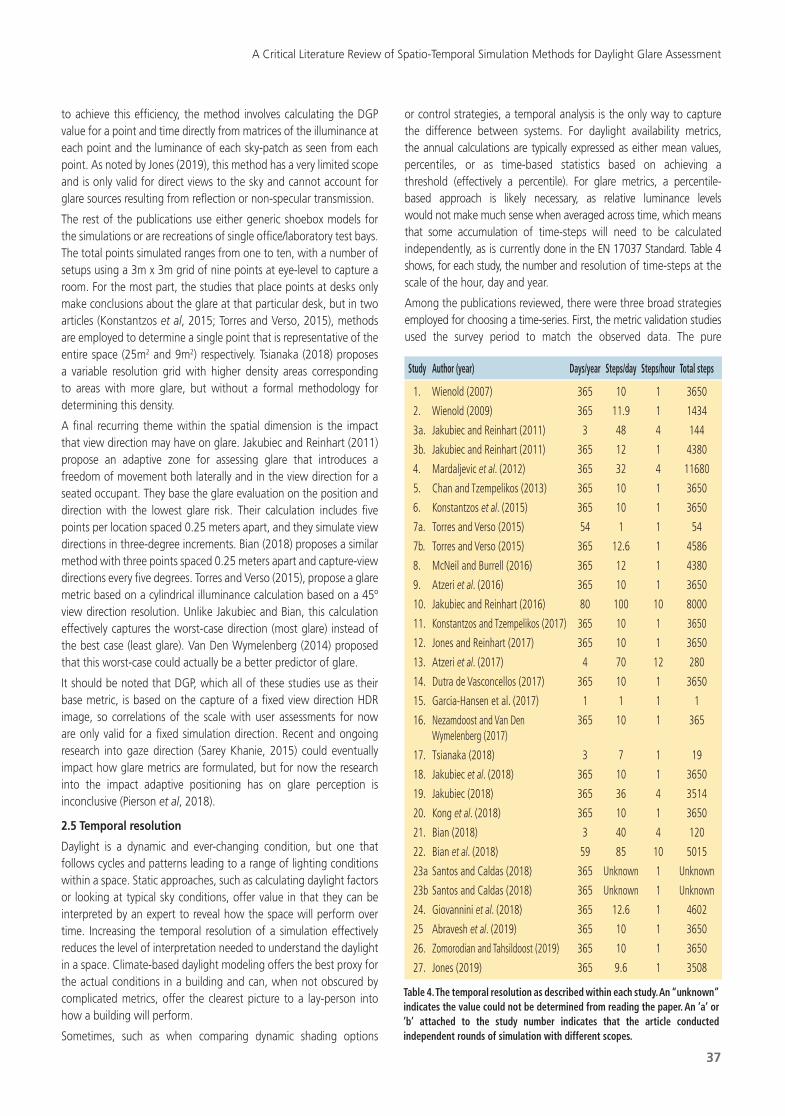
A Critical Literature Review of Spatio-Temporal Simulation Methods for Daylight Glare Assessment
to achieve this efficiency, the method involves calculating the DGP value for a point and time directly from matrices of the illuminance at each point and the luminance of each sky-patch as seen from each point. As noted by Jones (2019), this method has a very limited scope and is only valid for direct views to the sky and cannot account for glare sources resulting from reflection or non-specular transmission.
The rest of the publications use either generic shoebox models for the simulations or are recreations of single office/laboratory test bays. The total points simulated ranges from one to ten, with a number of setups using a 3m x 3m grid of nine points at eye-level to capture a room. For the most part, the studies that place points at desks only make conclusions about the glare at that particular desk, but in two articles (Konstantzos et al, 2015; Torres and Verso, 2015), methods are employed to determine a single point that is representative of the entire space (25m2 and 9m2) respectively. Tsianaka (2018) proposes a variable resolution grid with higher density areas corresponding to areas with more glare, but without a formal methodology for determining this density.
A final recurring theme within the spatial dimension is the impact that view direction may have on glare. Jakubiec and Reinhart (2011) propose an adaptive zone for assessing glare that introduces a freedom of movement both laterally and in the view direction for a seated occupant. They base the glare evaluation on the position and direction with the lowest glare risk. Their calculation includes five points per location spaced 0.25 meters apart, and they simulate view directions in three-degree increments. Bian (2018) proposes a similar method with three points spaced 0.25 meters apart and capture-view directions every five degrees. Torres and Verso (2015), propose a glare metric based on a cylindrical illuminance calculation based on a 45º view direction resolution. Unlike Jakubiec and Bian, this calculation effectively captures the worst-case direction (most glare) instead of the best case (least glare). Van Den Wymelenberg (2014) proposed that this worst-case could actually be a better predictor of glare.
It should be noted that DGP, which all of these studies use as their base metric, is based on the capture of a fixed view direction HDR image, so correlations of the scale with user assessments for now are only valid for a fixed simulation direction. Recent and ongoing research into gaze direction (Sarey Khanie, 2015) could eventually impact how glare metrics are formulated, but for now the research into the impact adaptive positioning has on glare perception is inconclusive (Pierson et al, 2018).
2.5 Temporal resolution
Daylight is a dynamic and ever-changing condition, but one that follows cycles and patterns leading to a range of lighting conditions within a space. Static approaches, such as calculating daylight factors or looking at typical sky conditions, offer value in that they can be interpreted by an expert to reveal how the space will perform over time. Increasing the temporal resolution of a simulation effectively reduces the level of interpretation needed to understand the daylight in a space. Climate-based daylight modeling offers the best proxy for the actual conditions in a building and can, when not obscured by complicated metrics, offer the clearest picture to a lay-person into how a building will perform.
Sometimes, such as when comparing dynamic shading options
or control strategies, a temporal analysis is the only way to capture the difference between systems. For daylight availability metrics, the annual calculations are typically expressed as either mean values, percentiles, or as time-based statistics based on achieving a threshold (effectively a percentile). For glare metrics, a percentile- based approach is likely necessary, as relative luminance levels would not make much sense when averaged across time, which means that some accumulation of time-steps will need to be calculated independently, as is currently done in the EN 17037 Standard. Table 4 shows, for each study, the number and resolution of time-steps at the scale of the hour, day and year.
Among the publications reviewed, there were three broad strategies employed for choosing a time-series. First, the metric validation studies used the survey period to match the observed data. The pure
37
Study Author (year) Days/year Steps/day Steps/hour Total steps
1. Wienold (2007) 365 10 1 3650
2. Wienold (2009) 365 11.9 1 1434
3a. Jakubiec and Reinhart (2011) 3 48 4 144
3b. Jakubiec and Reinhart (2011) 365 12 1 4380
4. Mardaljevic et al. (2012) 365 32 4 11680
5. Chan and Tzempelikos (2013) 365 10 1 3650
6. Konstantzos et al. (2015) 365 10 1 3650
7a. Torres and Verso (2015) 54 1 1 54
7b. Torres and Verso (2015) 365 12.6 1 4586
8. McNeil and Burrell (2016) 365 12 1 4380
9. Atzeri et al. (2016) 365 10 1 3650
10. Jakubiec and Reinhart (2016) 80 100 10 8000
11. Konstantzos and Tzempelikos (2017) 365 10 1 3650
12. Jones and Reinhart (2017) 365 10 1 3650
13. Atzeri et al. (2017) 4 70 12 280
14. Dutra de Vasconcellos (2017) 365 10 1 3650
15. Garcia-Hansen et al. (2017) 1 1 1 1
16. Nezamdoost and Van Den 365 10 1 365 Wymelenberg (2017)
17. Tsianaka (2018) 3 7 1 19
18. Jakubiec et al. (2018) 365 10 1 3650
19. Jakubiec (2018) 365 36 4 3514
20. Kong et al. (2018) 365 10 1 3650
21. Bian (2018) 3 40 4 120
22. Bian et al. (2018) 59 85 10 5015
23a Santos and Caldas (2018) 365 Unknown 1 Unknown
23b Santos and Caldas (2018) 365 Unknown 1 Unknown
24. Giovannini et al. (2018) 365 12.6 1 4602
25 Abravesh et al. (2019) 365 10 1 3650
26. Zomorodian and Tahsildoost (2019) 365 10 1 3650
27. Jones (2019) 365 9.6 1 3508
Table 4. The temporal resolution as described within each study. An “unknown” indicates the value could not be determined from reading the paper. An ’a’ or ’b’ attached to the study number indicates that the article conducted independent rounds of simulation with different scopes.
Stephen Wasilewski 2019.indd 7 26/11/2019 08:21
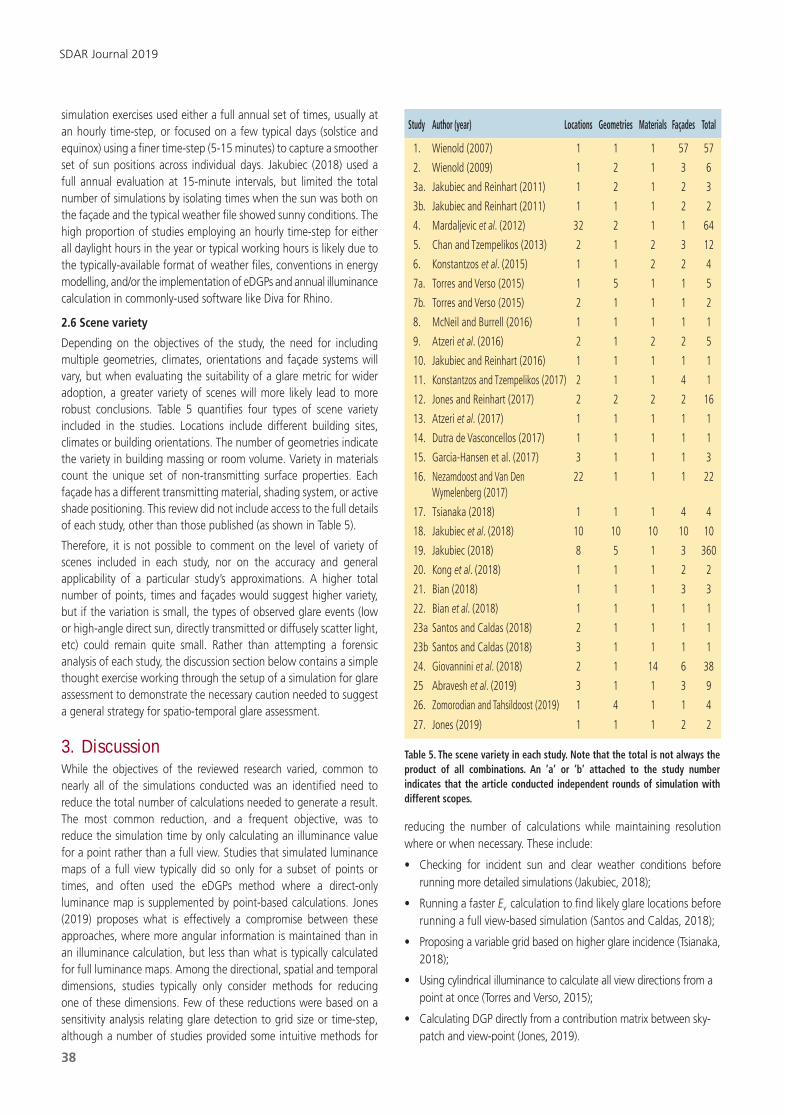
simulation exercises used either a full annual set of times, usually at an hourly time-step, or focused on a few typical days (solstice and equinox) using a finer time-step (5-15 minutes) to capture a smoother set of sun positions across individual days. Jakubiec (2018) used a full annual evaluation at 15-minute intervals, but limited the total number of simulations by isolating times when the sun was both on the façade and the typical weather file showed sunny conditions. The high proportion of studies employing an hourly time-step for either all daylight hours in the year or typical working hours is likely due to the typically-available format of weather files, conventions in energy modelling, and/or the implementation of eDGPs and annual illuminance calculation in commonly-used software like Diva for Rhino.
2.6 Scene variety
Depending on the objectives of the study, the need for including multiple geometries, climates, orientations and façade systems will vary, but when evaluating the suitability of a glare metric for wider adoption, a greater variety of scenes will more likely lead to more robust conclusions. Table 5 quantifies four types of scene variety included in the studies. Locations include different building sites, climates or building orientations. The number of geometries indicate the variety in building massing or room volume. Variety in materials count the unique set of non-transmitting surface properties. Each façade has a different transmitting material, shading system, or active shade positioning. This review did not include access to the full details of each study, other than those published (as shown in Table 5).
Therefore, it is not possible to comment on the level of variety of scenes included in each study, nor on the accuracy and general applicability of a particular study’s approximations. A higher total number of points, times and façades would suggest higher variety, but if the variation is small, the types of observed glare events (low or high-angle direct sun, directly transmitted or diffusely scatter light, etc) could remain quite small. Rather than attempting a forensic analysis of each study, the discussion section below contains a simple thought exercise working through the setup of a simulation for glare assessment to demonstrate the necessary caution needed to suggest a general strategy for spatio-temporal glare assessment.
3. DiscussionWhile the objectives of the reviewed research varied, common to nearly all of the simulations conducted was an identified need to reduce the total number of calculations needed to generate a result. The most common reduction, and a frequent objective, was to reduce the simulation time by only calculating an illuminance value for a point rather than a full view. Studies that simulated luminance maps of a full view typically did so only for a subset of points or times, and often used the eDGPs method where a direct-only luminance map is supplemented by point-based calculations. Jones (2019) proposes what is effectively a compromise between these approaches, where more angular information is maintained than in an illuminance calculation, but less than what is typically calculated for full luminance maps. Among the directional, spatial and temporal dimensions, studies typically only consider methods for reducing one of these dimensions. Few of these reductions were based on a sensitivity analysis relating glare detection to grid size or time-step, although a number of studies provided some intuitive methods for
reducing the number of calculations while maintaining resolution where or when necessary. These include:
• Checking for incident sun and clear weather conditions before running more detailed simulations (Jakubiec, 2018);
• Running a faster Ev calculation to find likely glare locations before running a full view-based simulation (Santos and Caldas, 2018);
• Proposing a variable grid based on higher glare incidence (Tsianaka, 2018);
• Using cylindrical illuminance to calculate all view directions from a point at once (Torres and Verso, 2015);
• Calculating DGP directly from a contribution matrix between sky- patch and view-point (Jones, 2019).
SDAR Journal 2019
38
Study Author (year) Locations Geometries Materials Façades Total
1. Wienold (2007) 1 1 1 57 57
2. Wienold (2009) 1 2 1 3 6
3a. Jakubiec and Reinhart (2011) 1 2 1 2 3
3b. Jakubiec and Reinhart (2011) 1 1 1 2 2
4. Mardaljevic et al. (2012) 32 2 1 1 64
5. Chan and Tzempelikos (2013) 2 1 2 3 12
6. Konstantzos et al. (2015) 1 1 2 2 4
7a. Torres and Verso (2015) 1 5 1 1 5
7b. Torres and Verso (2015) 2 1 1 1 2
8. McNeil and Burrell (2016) 1 1 1 1 1
9. Atzeri et al. (2016) 2 1 2 2 5
10. Jakubiec and Reinhart (2016) 1 1 1 1 1
11. Konstantzos and Tzempelikos (2017) 2 1 1 4 1
12. Jones and Reinhart (2017) 2 2 2 2 16
13. Atzeri et al. (2017) 1 1 1 1 1
14. Dutra de Vasconcellos (2017) 1 1 1 1 1
15. Garcia-Hansen et al. (2017) 3 1 1 1 3
16. Nezamdoost and Van Den 22 1 1 1 22 Wymelenberg (2017)
17. Tsianaka (2018) 1 1 1 4 4
18. Jakubiec et al. (2018) 10 10 10 10 10
19. Jakubiec (2018) 8 5 1 3 360
20. Kong et al. (2018) 1 1 1 2 2
21. Bian (2018) 1 1 1 3 3
22. Bian et al. (2018) 1 1 1 1 1
23a Santos and Caldas (2018) 2 1 1 1 1
23b Santos and Caldas (2018) 3 1 1 1 1
24. Giovannini et al. (2018) 2 1 14 6 38
25 Abravesh et al. (2019) 3 1 1 3 9
26. Zomorodian and Tahsildoost (2019) 1 4 1 1 4
27. Jones (2019) 1 1 1 2 2
Table 5. The scene variety in each study. Note that the total is not always the product of all combinations. An ’a’ or ’b’ attached to the study number indicates that the article conducted independent rounds of simulation with different scopes.
Stephen Wasilewski 2019.indd 8 26/11/2019 08:21
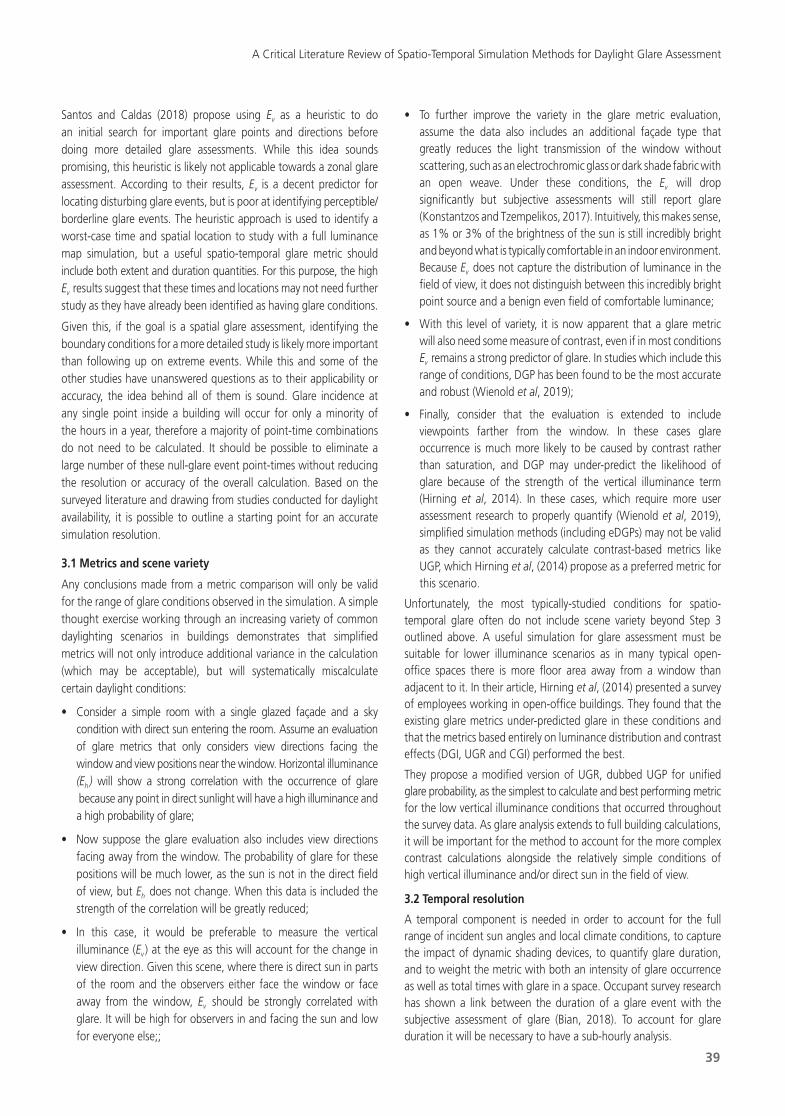
Santos and Caldas (2018) propose using Ev as a heuristic to do an initial search for important glare points and directions before doing more detailed glare assessments. While this idea sounds promising, this heuristic is likely not applicable towards a zonal glare assessment. According to their results, Ev is a decent predictor for locating disturbing glare events, but is poor at identifying perceptible/borderline glare events. The heuristic approach is used to identify a worst-case time and spatial location to study with a full luminance map simulation, but a useful spatio-temporal glare metric should include both extent and duration quantities. For this purpose, the high Ev results suggest that these times and locations may not need further study as they have already been identified as having glare conditions.
Given this, if the goal is a spatial glare assessment, identifying the boundary conditions for a more detailed study is likely more important than following up on extreme events. While this and some of the other studies have unanswered questions as to their applicability or accuracy, the idea behind all of them is sound. Glare incidence at any single point inside a building will occur for only a minority of the hours in a year, therefore a majority of point-time combinations do not need to be calculated. It should be possible to eliminate a large number of these null-glare event point-times without reducing the resolution or accuracy of the overall calculation. Based on the surveyed literature and drawing from studies conducted for daylight availability, it is possible to outline a starting point for an accurate simulation resolution.
3.1 Metrics and scene variety
Any conclusions made from a metric comparison will only be valid for the range of glare conditions observed in the simulation. A simple thought exercise working through an increasing variety of common daylighting scenarios in buildings demonstrates that simplified metrics will not only introduce additional variance in the calculation (which may be acceptable), but will systematically miscalculate certain daylight conditions:
• Consider a simple room with a single glazed façade and a sky condition with direct sun entering the room. Assume an evaluation of glare metrics that only considers view directions facing the window and view positions near the window. Horizontal illuminance (Eh ) will show a strong correlation with the occurrence of glare because any point in direct sunlight will have a high illuminance and a high probability of glare;
• Now suppose the glare evaluation also includes view directions facing away from the window. The probability of glare for these positions will be much lower, as the sun is not in the direct field of view, but Eh does not change. When this data is included the strength of the correlation will be greatly reduced;
• In this case, it would be preferable to measure the vertical illuminance (Ev ) at the eye as this will account for the change in view direction. Given this scene, where there is direct sun in parts of the room and the observers either face the window or face away from the window, Ev should be strongly correlated with glare. It will be high for observers in and facing the sun and low for everyone else;;
• To further improve the variety in the glare metric evaluation, assume the data also includes an additional façade type that greatly reduces the light transmission of the window without scattering, such as an electrochromic glass or dark shade fabric with an open weave. Under these conditions, the Ev will drop significantly but subjective assessments will still report glare (Konstantzos and Tzempelikos, 2017). Intuitively, this makes sense, as 1% or 3% of the brightness of the sun is still incredibly bright and beyond what is typically comfortable in an indoor environment. Because Ev does not capture the distribution of luminance in the field of view, it does not distinguish between this incredibly bright point source and a benign even field of comfortable luminance;
• With this level of variety, it is now apparent that a glare metric will also need some measure of contrast, even if in most conditions Ev remains a strong predictor of glare. In studies which include this range of conditions, DGP has been found to be the most accurate and robust (Wienold et al, 2019);
• Finally, consider that the evaluation is extended to include viewpoints farther from the window. In these cases glare occurrence is much more likely to be caused by contrast rather than saturation, and DGP may under-predict the likelihood of glare because of the strength of the vertical illuminance term (Hirning et al, 2014). In these cases, which require more user assessment research to properly quantify (Wienold et al, 2019), simplified simulation methods (including eDGPs) may not be valid as they cannot accurately calculate contrast-based metrics like UGP, which Hirning et al, (2014) propose as a preferred metric for this scenario.
Unfortunately, the most typically-studied conditions for spatio-temporal glare often do not include scene variety beyond Step 3 outlined above. A useful simulation for glare assessment must be suitable for lower illuminance scenarios as in many typical open-office spaces there is more floor area away from a window than adjacent to it. In their article, Hirning et al, (2014) presented a survey of employees working in open-office buildings. They found that the existing glare metrics under-predicted glare in these conditions and that the metrics based entirely on luminance distribution and contrast effects (DGI, UGR and CGI) performed the best.
They propose a modified version of UGR, dubbed UGP for unified glare probability, as the simplest to calculate and best performing metric for the low vertical illuminance conditions that occurred throughout the survey data. As glare analysis extends to full building calculations, it will be important for the method to account for the more complex contrast calculations alongside the relatively simple conditions of high vertical illuminance and/or direct sun in the field of view.
3.2 Temporal resolution
A temporal component is needed in order to account for the full range of incident sun angles and local climate conditions, to capture the impact of dynamic shading devices, to quantify glare duration, and to weight the metric with both an intensity of glare occurrence as well as total times with glare in a space. Occupant survey research has shown a link between the duration of a glare event with the subjective assessment of glare (Bian, 2018). To account for glare duration it will be necessary to have a sub-hourly analysis.
A Critical Literature Review of Spatio-Temporal Simulation Methods for Daylight Glare Assessment
39
Stephen Wasilewski 2019.indd 9 26/11/2019 08:21

Except for very large whole building simulations, the temporal dimension of a spatio-temporal analysis typically has the largest magnitude. Fortunately, a number of straightforward approaches exist to reduce the magnitude of time-steps. Some, like only running the simulations for daylight hours or working hours, are trivial. Others, like calculating a grid of sun positions and then looking up the closest value for each time-step, are more subtle, but have been well developed and documented (Reinhart and Walkenhorst, 2001). Both of these approaches are well incorporated into existing simulation methods. Jakubiec (2018) has proposed the most novel approach for reducing the number of time-steps needed by including additional pre-checks to ensure that the sun is incident on a relevant façade. In their study, glare was calculated at 15-minute increments, which when combined with this initial filter, resulted in fewer total simulations than a typical annual-hourly calculation.
In order to extend glare simulation to include both a sub-hourly time-step and a large spatial dimension (which could also include multiple view directions), it would be beneficial to investigate additional methods for further reducing the number of time-steps calculated. While the grid of sun positions reduces the calculation overhead substantially for hourly simulations, the resolution required in order to capture sub-hourly time-steps undermines this efficiency. The change in sun position from one hour to the next is far greater than the change from day to day, but none of the reviewed studies investigates approaches that could balance these increments. More flexibility in the filtering and estimation of sun positions needed to calculate annual performance could lead to methods that are both more accurate (with a finer time-step) and more efficient (fewer total calculations).
3.3 Spatial resolution
Compared with a zonal metric, where the area of interest can be well defined by the building plan, relying on the modeler to select the analysis point requires expert knowledge of the likely glare conditions in the space. This makes the standardisation of performance impossible to validate. Existing illuminance standards have established methods for defining point grids representative of building zones. The LM-83-12 specification for spatial daylight autonomy requires a two-foot grid throughout the occupied area. A sensitivity analysis showed that results of annual calculations were fairly close for a range of grid spacings less than one meter (Brembilla et al, 2015). Based on their results, the authors recommend a grid spacing of less than one meter. While a similar sensitivity analysis has not been published for glare calculations, given the typical dimensions found in most office spaces, it is reasonable to assume that a grid much larger than one meter will miss important variation within a space.
Only two studies (Jakubiec and Reinhart, 2016 and Jones, 2019) calculated a luminance metric for more than 12 points, and both studies used methods that only calculate luminance values for the glare sources and not the background. To calculate a high density of points across a large space or building using brute force is not practical without access to powerful computing clusters. Two of the reviewed studies (Santos and Caldas, 2018 and Tsianaka, 2018) propose methods for reducing the density of points where glare is unlikely to occur. Tsianaka hypothesises that such a method exists, and Santos and Caldas (2018) use Ev as a heuristic to identify worst-case glare.
This heuristic may not be suitable for calculating generalised spatial metrics, as Ev categorically misses some glare events, such as low illuminance conditions with very bright small sources.
Other heuristics or importance sampling methods that vary the positional density of simulations or the resolution of those simulations have not been thoroughly researched. Especially when combined with novel temporal sampling, a variable spatial density could be a powerful tool for making spatio-temporal glare simulation and assessment practical and efficient without reducing accuracy.
4. ConclusionThe development of climate-based daylight modelling techniques and the adoption of these calculations in commonly-used software packages (DIVA, Ladybug, OpenStudio) has made it simple and efficient to calculate annual illuminance for a grid of points. Compared to this, calculating DGP with full luminance images is impractical. This review has found that commonly-used approximations to simplify glare calculation will generate results that are expected to be inconsistent with the findings of user assessment glare research. While there have not been a large number of published articles looking specifically at spatial and temporal glare analysis, a number of common themes have emerged from those that do exist:
• The focus of the simulation methodology is typically on efficiency of the calculation, leading to a simplification of calculated metrics;
• The most commonly-used method for annual glare analysis is eDGPs. Since this method uses DGP as a glare metric it might underestimate the glare for viewpoints deep in a space and low vertical illuminance values. While eDGPs maintains the accuracy of the DGP, it can only be used to calculate DGP and cannot be used for glare metrics that require a background luminance term. Although it is far more efficient than a full ambient simulation, it is still not fast enough to practically calculate glare across a large number of positions and times;
• Well spatialised studies (more than a few typical points) typically reduce the calculation to simple illuminance calculations.
• Proposed methods for increasing efficiency tend to focus on a single dimension, either spatial, temporal or angular (collapsing luminance data into illuminance or a reduced angular resolution).
Based on the requirements of current best practice glare evaluation and the current limitations of computation, extending simulations for glare assessment to a spatial-temporal analysis will require the development of new simulation techniques to efficiently produce high accuracy luminance maps for a large number of points and times across a space. A number of methods for consolidating glare metrics into annual performance exist (Wienold, 2009, Jakubiec and Reinhart, 2011; Atzeri et al, 2016; Jakubiec et al, 2018) and could be easily adapted to a high-resolution temporal glare evaluation.
Resolving the difference between human subject glare research, which indicates that a high degree of angular and temporal resolution is necessary, and current simulation capabilities, which cannot produce this resolution in reasonable timeframes, should be a priority for future research. While the existing research included in this review outlines a wide range of possible methods for spatio-
SDAR Journal 2019
40
Stephen Wasilewski 2019.indd 10 26/11/2019 08:21

temporal glare simulation, none of the proposed methods offer a path towards a method that is both generally applicable and efficient. One reason for this could be that current approaches are built on top of simulation methods used for illuminance-based calculations. Many of the shortcuts and approximations that have enabled the wide acceptance of climate-based daylight modeling are not valid for accurately evaluating discomfort glare.
Future research should consider the problem from a wider lens, interrogating the required level of detail needed across time, position and view direction. Across all of these dimensions the focus should be on the specific objectives and requirements of a high-accuracy glare evaluation.
AcknowledgementsThis research was supported by the Swiss National Science Foundation as part of the ongoing research project “Light fields in climate-based daylight modeling for spatio-temporal glare assessment” (SNSF #179067). We thank Stephen Wittkopf, the project’s principal investigator, for accompanying the work with his constructive and critical feed-back, and our colleague Roland Schregle for contributing his expertise in daylight simulation techniques.
References
Abravesh, M., Bueno, B., Heidari, S., and Kuhn, T. E. A method to evaluate glare risk from operable fenestration systems throughout a year. Building and Environment, June 2019. http://doi.org/10.1016/j.buildenv.2019.106213
Amundadottir, M. L., Rockcastle, S., Sarey Khanie, M., and Andersen, M. A human-centric approach to assess daylight in buildings for non-visual health potential, visual interest and gaze behavior. Building and Environment, 113:5–21, February 2017. http://doi.org/10.1016/j.buildenv.2016.09.033
Atzeri, A. M., Cappelletti, F., Tzempelikos, A., and Gasparella, A. Comfort metrics for an integrated evaluation of buildings performance. Energy and Buildings, 127: 411–424, June 2016. http://doi.org/10.1016/j.enbuild.2016.06.007
Atzeri, A. M., Cappelletti, F., and Gasparella, A. Comparison of Different Glare Indices through Metrics for Long Term and Zonal Visual Comfort Assessment. In Proceedings of the 15th IBPSA Conference, San Francisco, CA, USA, pages 1194–1203, August 2017. http://www.ibpsa.org/proceedings/BS2017/BS2017
Bian, Y. Investigating Time-Based Glare Allowance Based On Realistic Short Time Duration. In 5th International High Performance Buildings Conference at Purdue, pages 3721,1–6, July 2018. https://docs.lib.purdue.edu/ihpbc/337
Bian, Y., Leng, T., and Ma, Y. A proposed discomfort glare evaluation method based on the concept of ’adaptive zone’. Building and Environment, 143:306– 317, October 2018. http://doi.org/10.1016/j.buildenv.2018.07.025
Brembilla, E., Mardaljevic, J., and Anselmo, F. The effect of the analysis grid on daylight simulations with climate-based daylight modelling. In 28th Session of the International Commission on Illumination CIE, June 2015.
Chan, Y.-C. and Tzempelikos, A. Efficient venetian blind control strategies considering daylight utilization and glare protection. Solar Energy, 98:241–254, December 2013. http://doi.org/10.1016/j.solener.2013.10.005
DiLaura, D. L. and IESNA. The lighting handbook. Illuminating Engineering Society of North America, New York, 2011. ISBN 978-0-87995-241-9
Dutra de Vasconcellos, G. Evaluation of Annual Sunlight Exposure (ASE) as a Proxy to Glare. Master’s thesis, University of California, Berkeley, April 2017. https://escholarship.org/uc/item/3js1z0b8
Education Funding Agency. Efa daylight design guide. 2014.
Einhorn, H. Discomfort glare: a formula to bridge differences. Lighting Research & Technology, 11:90–94, June 1979. http://doi.org/10.1177/14771535790110020401
European Committee for Standardisation CEN. EN17037:2019 Daylight in buildings. 2019.
Garcia-Hansen, V., Allan, A. C., Isoardi, G., Wagdy, A., and Smith, S. S. Evaluating visual comfort in open-plan offices. In CIE 2017 – Smarter Lighting for Better Life, 20-28 October 2017, Jeju, South Korea., pages 1–9, October 2017. https://eprints.qut.edu.au/114261/
Giovannini, L., Favoino, F., Lo Verso, V. R. M., Pellegrino, A., and Serra, V. A Simplified Approach for the Annual and Spatial Evaluation of the Comfort Classes of Daylight Glare Using Vertical Illuminances. Buildings, 8:171, December 2018. http://doi.org/10.3390/buildings8120171
Hirning, M. B., Isoardi, G. L., and Cowling, I. Discomfort glare in open plan green buildings. Energy and Buildings, 70:427–440, February 2014. http://doi.org/10.1016/j.enbuild.2013.11.053
A Critical Literature Review of Spatio-Temporal Simulation Methods for Daylight Glare Assessment
41
Stephen Wasilewski 2019.indd 11 26/11/2019 08:21

Hopkinson, R. Glare from daylighting in buildings. Applied Ergonomics, 3: 206– 215, December 1972. https://doi.org/10.1016/0003-6870%2872%2990102-0
IESNA. IES LM- 83-12, Approved Method: IES Spatial Daylight Autonomy (sDA) and Annual Sunlight Exposure (ASE), 2012.
International Commission on Illumination. Discomfort Glare in Interior Lighting. CIE technical report. Commission Internationale de l’Éclairage, 1995. https://books.google.ch/books?id=cM1SAAAAMAAJ
International WELL Building Institute. WELL Building Standard® | WELL Standard, 2019. https://standard.wellcertified.com/well
Jakubiec, J. A. Validation of Simplified Visual Discomfort Calculations. In Proceedings of BSO 2018: 4th Building Simulation and Optimization Conference, Cambridge, UK, pages 17–23, September 2018. http://www.ibpsa.org/proceedings/BSO2018/1A-3.pdf
Jakubiec, J. A. and Reinhart, C. F. The adaptive zone – A concept for assessing discomfort glare throughout daylit spaces. Lighting Research and Technology, 44:149–170, October 2011. http://doi.org/10.1177/1477153511420097
Jakubiec, J. A. and Reinhart, C. F. A Concept for Predicting Occupants’ Long-Term Visual Comfort within Daylit Spaces. LEUKOS, 12:185–202, November 2016. http://doi.org/10.1080/15502724.2015.1090880
Jakubiec, J. A., Quek, G., and Srisamranrungruang, T. Towards Subjectivity in Annual Climate-Based Daylight Metrics. In Proceedings of BSO 2018: 4th Building Simulation and Optimization Conference, Cambridge, UK, pages 24–31, September 2018. http://www.ibpsa.org/proceedings/BSO2018/1A-4.pdf.
Jones, N. L. (in press) fast Climate-Based Glare Analysis and Spatial Mapping. In Proceedings of Building Simulation 2019: 16th Conference of IBPSA, Rome, Italy, September 2019.
Jones, N. L. and Reinhart, C. F. Experimental validation of ray tracing as a means of image-based visual discomfort prediction. Building and Environment, 113:131–150, February 2017. http://doi.org/10.1016/j.buildenv.2016.08.023
Kong, Z., Utzinger, D. M., Freihoefer, K., and Steege, T. The impact of interior design on visual discomfort reduction. Building and Environment, 138:135–148, June 2018. http://doi.org/10.1016/j.buildenv.2018.04.025
Konstantzos, I. and Tzempelikos, A. A holistic approach for improving visual environment in private offices. Procedia Environmental Sciences, 38:372–380, 2017. http://doi.org/10.1016/j.proenv.2017.03.104
Konstantzos, I., Tzempelikos, A., and Chan, Y.-C. Experimental and simulation analysis of daylight glare probability in offices with dynamic window shades. Building and Environment, 87:244–254, May 2015. http://doi.org/10.1016/j.buildenv.2015.02.007
Mardaljevic, J., Andersen, M., Roy, N., and Christoffersen, J. Daylighting metrics: Is there a relation between useful daylight illuminance and daylight glare probability? In Proceedings of BSO 2018: First Building Simulation and Optimization Conference, Loughborough, UK, pages 189–196, September 2012. http://www.ibpsa.org/proceedings/BSO2012/3B1.pdf
McNeil, A. and Burrell, G. Applicability of dgp and dgi for evaluating glare in a brightly daylit space. In Proceedings of SimBuild, August 2016. http://ibpsa-usa.org/index.php/ibpusa/article/view/339
Nabil, A. and Mardaljevic, J. Useful daylight illuminance: A new paradigm for assessing daylight in buildings. Lighting Research & Technology, 37:41–59, 03 2005. http://doi.org/10.1191/1365782805li128oa
Nezamdoost, A. and Van Den Wymelenberg, K. A daylighting field study using human feedback and simulations to test and improve recently adopted annual daylight performance metrics. Journal of Building Performance Simulation, 10:471–483, November 2017. http://doi.org/10.1080/19401493.2017.1334090
Osterhaus, W. K. E. Office lighting: a review of 80 years of standards and rec- ommendations. In Conference Record of the 1993 IEEE Industry Applications Conference Twenty-Eighth IAS Annual Meeting, pages 2365–2374 vol.3, October 1993. http://doi.org/10.1109/IAS.1993.299211
Osterhaus, W. K. E. Discomfort glare assessment and prevention for daylight applications in office environments. Solar Energy, 79(2):140–158, August 2005. ISSN 0038-092X. http://doi.org/10.1016/j.solener.2004.11.011
Pierson, C., Wienold, J., and Bodart, M. Review of Factors Influencing Discomfort Glare Perception from Daylight AU – Pierson, Clotilde. LEUKOS, 14:111–148, July 2018. http://doi.org/10.1080/15502724.2018.1428617
Reinhart, C. F. and Walkenhorst, O. Validation of dynamic RADIANCE-based daylight simulations for a test office with external blinds. Energy and Buildings, 33:683–697, September 2001. https://doi.org/10.1016/S0378-7788%2801%2900058-5
Santos, L. and Caldas, L. Assessing the Glare Potential of Complex Fenestration Systems. In Passive Low Energy Architecture (PLEA) 2018: Smart and Healthy within the 2-degree Limit, Hong Kong, December 2018.
Sarey Khanie, M. Human responsive daylighting in offices. PhD thesis, EPFL, 2015.
Torres, S. and Verso, V. R. M. L. Comparative Analysis of Simplified Daylight Glare Methods and Proposal of a new Method Based on the Cylindrical Illuminance. Energy Procedia, 78:699–704, November 2015. http://doi.org/10.1016/j.egypro.2015.11.074
Tregenza, P. and Mardaljevic, J. Daylighting buildings: Standards and the needs of the designer. Lighting Research & Technology, 50:63–79, January 2018. http://doi.org/10.1177/1477153517740611
Tsianaka, E. E. A concept to evaluate dynamic daylight glare. Master’s thesis, Lund University, 2018. https://lup.lub.lu.se/student-papers/search/publication/8964204
Wienold, J., Iwata, T., Sarey Khanie, M., Erell, E., Kaftan, E., Rodriguez, R., Yamin Garreton, J., Tzempelikos, T., Konstantzos, I., Christoffersen, J., Kuhn, T., Pierson, C., and Andersen, M. Cross-validation and robustness of daylight glare metrics. Lighting Research & Technology, March 2019. http://doi.org/10.1177/1477153519826003
Wienold, J. Dynamic simulation of blind control strategies for visual comfort and energy balance analysis. pages 1197–1204, 2007. http://doi.org/10.1191/1365782805li128oa
Wienold, J. Dynamic daylight glare evaluation. In 11th International IBPSA Conference, Glasgow, Scotland, pages 944–951, July 2009. http://www.ibpsa.org/proceedings/BS2009/BS09_0944_951.pdf
Wienold, J. and Christoffersen, J. Evaluation methods and development of a new glare prediction model for daylight environments with the use of CCD cameras. Energy and Buildings, 38:743–757, July 2006. http://doi.org/10.1016/j.enbuild.2006.03.017
Van Den Wymelenberg, K. Visual Comfort, Discomfort Glare, and Occupant Fenestration Control. LEUKOS, 10:207–221, October 2014. http://doi.org/10.1080/15502724.2014.939004
Zomorodian, Z. S. and Tahsildoost, M. Assessing the effectiveness of dynamic metrics in predicting daylight availability and visual comfort in classrooms. Renewable Energy, 134:669–680, April 2019. http://doi.org/10.1016/j.renene.2018.11.072
SDAR Journal 2019
42
Stephen Wasilewski 2019.indd 12 26/11/2019 08:21

Breathing Life into Buildings Don’t settle for the ordinary – choose
a career that is exciting, makes a real
difference to people’s lives and safeguards
the future of the planet …
Become a Building Services Engineer.
Architects design the body, civils build the
skeleton but it is building services engineers
who breathe life into buildings. They are
the ones who provide the heart, lungs and
veins of every building we work, play and
live in!
Building Services Engineers …
• Have a passport to international work
• Make a social and economic difference
• Bring water to a village in Africa
• Design a data centre for Google
• Beam energy from solar space stations
• Computer-simulate environmental events
• Enhance people’s lives
www.cibseireland.org
Untitled-5 1 23/11/2019 11:53

Institiúd Teicneolaíochta Átha CliathDublin Institute of Technology
Dublin School of ArchitectureCollege of Engineering & Built EnvironmentOver the next three years the Nearly Zero Energy Buildings (NZEB) Standard will be applied to buildings built for, or rented by, public bodies; then to all new and retrofi tted buildings. At the same time technological innovation and other environmental and building performance concerns are creating other needs and opportunities. Dublin School of Architecture has a range of postgraduate and post-apprenticeship programmes that meet these challenges.
Practicing architects, technologists and engineers who wish to increase their knowledge and skills in delivering new build and retrofi tted buildings to the impending NZEB Standard can join a range of multi-disciplinary, blended online CPD programmes. They may also wish to go further to become industry leaders and specialists in one or more areas of building performance. Applications are being accepted for September 2018.
Code Programme NFQ level Duration Fee
DT9771 Postgraduate Certifi cate in Building 9 1 year, part time 2,500 Performance (Energy Efficiency in Design)
DT9772 Postgraduate Diploma in Building 9 2 years, part time 5,500
Contact: [email protected]
Site foreman and supervisors working for general builders and subcontractors who wish to engage better with the way information is increasingly delivered or created on site using digital and mobile technologies should attend CPD IT for Site Workers in DIT Bolton Street. Applications are being accepted for January and September 2018.
Code Programme NFQ level Duration Fee
ARCH6001 CPD IT for Site Workers 6 13 weeks part time 1,050
Contact: [email protected]
For further details see:
http://www.dit.ie/architecture/programmes/
Performance (Energy Efficiency in Design)
DT9773 MSc in Building Performance 9 3 years, part time 7,500 Performance (Energy Efficiency in Design)
DT9774 CPD Diploma in NZEB Design Tools 9 1 semester, part time 1,500
CPDEB01 CPD Certificate in NZEB Policy and 9 5 weeks, part time 600 Technology
DT775b CPD Diploma in NZEB Thermal Bridge 9 2 semesters, part time 1,500
School of Architecture advert 2019.indd 1 23/11/2019 11:28

Enhancing Thermal Mass Performance of Concrete
Digital engineering: a case study in an Irish consultancy practice
Raymond ReillyAECOM IRELAND LTD
Raymond Reilly 2019.indd 1 26/11/2019 08:23

AbstractThe building services engineering (BSE) industry has wrestled
with its productivity gap for many years and the time has
come to embrace innovation. Its practitioners now have the
key to unlock the future by the smart use of technology,
which has the power to transform how we design.
Embracing digital technology provides smarter, faster, better
and safer solutions. Scholarship in BSE consultancy practice is
limited, and although this inquiry is a means of advancing
knowledge, it also serves as a disciplined and systematic
procedure by shedding a new light on design effectiveness
in practice, thus improving the design process through
digital engineering.
This paper outlines how digitalisation encapsulates people,
processes and technology to improve the design process in
Irish BSE practice, thus providing the basis for promoting a
sustainable design process during and after design.
(This paper includes content submitted by the author as
part of his Professional Doctorate in the Built Environment
at the University of Salford).
Keywords
Digital Engineering, Building Information Modelling.
1. Introduction
What was once deemed the province of a craftsman, building services engineering (BSE) now demands the services of a body of highly-educated and specialist-trained professional engineers (Portman, 2014). Building services engineers are responsible for the design of the mechanical, electrical and public health (MEP) systems required for the safe, comfortable and environmentally-friendly operation of buildings (Miller, Vandome, & McBrewster, 2009). This multidisciplinary field of engineering essentially brings buildings and places to life. The increasing complexity of modern Irish buildings has significantly increased the pressure to improve the performance of the design process.
Thus far, research has identified that a large percentage of defects at construction stage arise through decisions or actions at the design stage; any unresolved design issues must be resolved at construction stage. Poor communication, lack of adequate documentation, deficient or missing input information, unbalanced resource allocation, lack of coordination between disciplines, and erratic decision-making have been identified as the main problems at design stage. This inherent productivity gap leads to inferior quality of systems’ installation, increased costs and extended time delays at construction stage (Yongping, Chunyan, Pengfei, & Weiping, 2014). Such deficiencies initiate dysfunction in terms of redesign and associated financial burden in consultancy practice. The small relative cost of the design process when compared to construction costs disguises its true importance for overall performance (Austin, Baldwin, & Newton, 1994).
BSE is a dynamic and complex design process due to its multi-disciplinary nature. It requires a high degree of technical competence to ensure that MEP systems are safely designed, legislatively compliant, and more importantly, technically coordinated with other team disciplines (Trevelyan, 2014). Success in BSE practice relies on the ultimate design deliverable being performed correctly. Moreover, BSE practices are expected to invest heavily in adopting new technology and in training their practitioners to operate that technology efficiently. Sustaining the implementation of digital technologies requires extra
SDAR Journal 2019
46
Figure 1: Design Workflow – The MacLeamy Curve (Walaseka & Barszczb, 2017).
Ability to impact cost and functional capabilities
Cost of design changes
Traditional design workflow
Preferred design workflow [IPD]
Pre-Design Schematic Design
Design Development
Construction Documentation
Procurement Construction Administration
Operation
Time
The MacLeamy Curve
Effo
rt /
Eff
ect
Raymond Reilly 2019.indd 2 26/11/2019 08:23
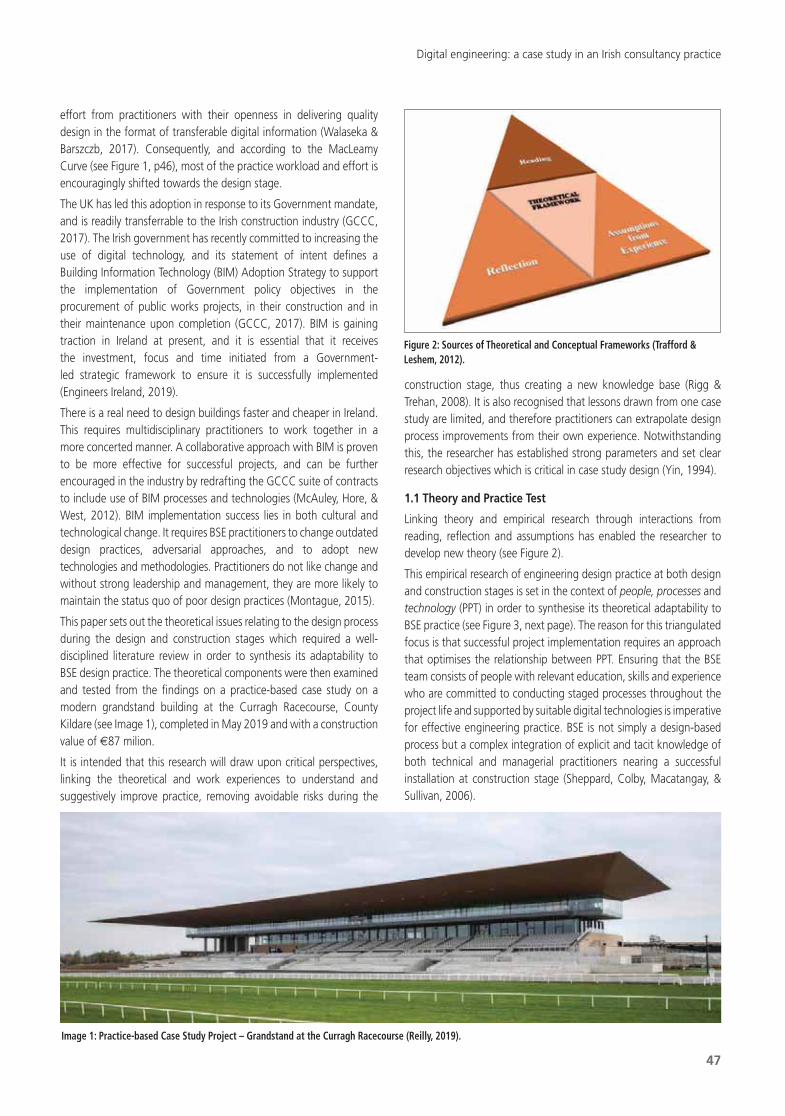
effort from practitioners with their openness in delivering quality design in the format of transferable digital information (Walaseka & Barszczb, 2017). Consequently, and according to the MacLeamy Curve (see Figure 1, p46), most of the practice workload and effort is encouragingly shifted towards the design stage.
The UK has led this adoption in response to its Government mandate, and is readily transferrable to the Irish construction industry (GCCC, 2017). The Irish government has recently committed to increasing the use of digital technology, and its statement of intent defines a Building Information Technology (BIM) Adoption Strategy to support the implementation of Government policy objectives in the procurement of public works projects, in their construction and in their maintenance upon completion (GCCC, 2017). BIM is gaining traction in Ireland at present, and it is essential that it receives the investment, focus and time initiated from a Government- led strategic framework to ensure it is successfully implemented (Engineers Ireland, 2019).
There is a real need to design buildings faster and cheaper in Ireland. This requires multidisciplinary practitioners to work together in a more concerted manner. A collaborative approach with BIM is proven to be more effective for successful projects, and can be further encouraged in the industry by redrafting the GCCC suite of contracts to include use of BIM processes and technologies (McAuley, Hore, & West, 2012). BIM implementation success lies in both cultural and technological change. It requires BSE practitioners to change outdated design practices, adversarial approaches, and to adopt new technologies and methodologies. Practitioners do not like change and without strong leadership and management, they are more likely to maintain the status quo of poor design practices (Montague, 2015).
This paper sets out the theoretical issues relating to the design process during the design and construction stages which required a well-disciplined literature review in order to synthesis its adaptability to BSE design practice. The theoretical components were then examined and tested from the findings on a practice-based case study on a modern grandstand building at the Curragh Racecourse, County Kildare (see Image 1), completed in May 2019 and with a construction value of 87 milion.
It is intended that this research will draw upon critical perspectives, linking the theoretical and work experiences to understand and suggestively improve practice, removing avoidable risks during the
construction stage, thus creating a new knowledge base (Rigg & Trehan, 2008). It is also recognised that lessons drawn from one case study are limited, and therefore practitioners can extrapolate design process improvements from their own experience. Notwithstanding this, the researcher has established strong parameters and set clear research objectives which is critical in case study design (Yin, 1994).
1.1 Theory and Practice Test
Linking theory and empirical research through interactions from reading, reflection and assumptions has enabled the researcher to develop new theory (see Figure 2).
This empirical research of engineering design practice at both design and construction stages is set in the context of people, processes and technology (PPT) in order to synthesise its theoretical adaptability to BSE practice (see Figure 3, next page). The reason for this triangulated focus is that successful project implementation requires an approach that optimises the relationship between PPT. Ensuring that the BSE team consists of people with relevant education, skills and experience who are committed to conducting staged processes throughout the project life and supported by suitable digital technologies is imperative for effective engineering practice. BSE is not simply a design-based process but a complex integration of explicit and tacit knowledge of both technical and managerial practitioners nearing a successful installation at construction stage (Sheppard, Colby, Macatangay, & Sullivan, 2006).
Digital engineering: a case study in an Irish consultancy practice
47
Image 1: Practice-based Case Study Project – Grandstand at the Curragh Racecourse (Reilly, 2019).
Figure 2: Sources of Theoretical and Conceptual Frameworks (Trafford & Leshem, 2012).
Raymond Reilly 2019.indd 3 26/11/2019 08:23

SDAR Journal 2019
48
The adoption process of digital technology is never instantaneous in practice. Instead, it is dependent on management and practitioners who are more apt to embracing new innovates. The theory of diffusion of innovation not only validates this fact, but also demonstrates that practitioners who are more willing to adopt new innovations have different characteristics when compared to those who adopt innovation later (Walaseka & Barszczb, 2017). The chasm occurs at the transition between the early adopters and the early majority. It is suggested that once 16% adoption of any innovation is reached, media strategy is changed from one based on scarcity, to one based on social proof in order to accelerate through the chasm to the tipping point. The tipping point is the point at which the mainstream begins to adopt the innovation (Maloney, 2010) (see Figure 4).
2. Digital TechnologyEngineering design practices’ key resources are related to their core competences, including integrating multiple streams of technologies. By allowing market trends and new technologies to be disregarded leads to professional obsolescence (Engineers Ireland, 2016). The BSE design process and, by extension, the construction process is somewhat aided by the use of computer models which create virtual buildings and simulate the performance of mechanical and electrical systems (Portman, 2014). Undoubtedly, BIM is transforming the construction industry by changing the way multidisciplinary project teams collaborate at every stage of the project cycle to deliver
significant efficiency and cost-saving benefits. As familiarity and maturity increase across the globe, BIM is set to influence a new generation of practitioners (British Standards Institute, 2019). Thus far, the overall and practical effectiveness of BIM utilisation in practice is difficult to quantify (Li, et al, 2014).
BSE-related technology changes faster than that in any other part of a building or place. The development of BSE software design packages is intended to improve the efficiencies of MEP systems, but new digital demands are arising from the technological change taking place in the activities of building occupants. While the BSE design process is also aided by the use of computer models which simulate the performance of thermal behaviour, energy usage, electrical distribution, artificial lighting, vertical transportation, ventilation and renewable energy resources, the best modelling programs cannot account for the unpredictable nature of occupants (Portman, 2014).
2.1 Digitalisation
Digitalisation is the adoption of digital technology by a practice, and the introduction of BIM represents the BSE industry’s moment of digitalisation. Undoubtedly, the wider use of technology, digital processes, automation and higher-skilled practitioners contribute greatly to the economic, social and environmental future (EUBIM, 2017). The use of digital technology has, until recently, largely been confined to the pre-construction stage. Indeed, the construction and operational phases are still somewhat reliant on paper outputs from the digital platforms used at the design stage. This is because, until relatively recently, the technology had not developed sufficiently to facilitate the complex supply chain that contributes to a construction project. BIM is now evolving to provide a means of extending the digital reach into the construction and operation stages (GCCC, 2017).
It is no secret that the Irish construction industry is changing. The impact of technological advancements in recent years has been nothing short of transformative. Clients are demanding higher quality, greater reliability, faster delivery and the higher safety standards. Recent advances in technology have brought new ways to optimise project delivery, increase productivity and create efficiencies throughout the design and construction stages (AECOM, 2018). By rethinking the way digital technology plays a role in the BSE practice, it is imperative to establish radical new solutions, thus transforming project delivery and unlocking the full power of the BSE consultancy offer to clients. By connecting with market-leading digital expertise, practitioners can leverage the scale to deliver innovative, differentiated solutions to clients, boost performance and ultimately grow business.
The National BIM Council (NBC) of Ireland’s recent endeavour to roadmap digitalisation of the Irish construction industry advocates more productive ways of working that improve competitiveness. This roadmap is divided into four key pillars – leadership, standards, education and training, and procurement. Remarkably, the Irish government has not yet afforded adequate leadership in diffusing BIM, and has failed to provide online supports or reviews of the suitability or provisions made for developing public construction contracts. However, the National Standards Authority of Ireland (NSAI) has developed a BIM certification program aligned with the publication of IS EN 19650: Part 2, providing an internationally-recognised standard for BIM. Moreover, third-level and professional institutes are perceived as entities for upskilling prospective and
Figure 3: Primary Scope of Literature Review.
Figure 4: Rogers’ Law of Diffusion of Innovation (Maloney, 2010).
SCARCITY SOCIAL PROOF
100
75
50
25
0
The Chasm
Innovators 2.5%
Early Majority
34%
Early Adopters 13.5%
Late Majority
34%
Laggards 16%
[%]
The ChasmThe Chasm
Raymond Reilly 2019.indd 4 26/11/2019 08:23

current practitioners, respectively (McAuley, Hore, & West, 2019).
While Ireland has recently shown a steady increase in some aspects of its BIM maturity, barriers to its implementation are inherent (Figure 5). BIM necessitates significant change to workflows, practices and procedures. It requires investment of knowledge in BIM standards and protocols, training in new software platforms, and financial investment to access these digital tools (NBS, 2019).
2.1.1 Digital Engineering
Using existing technologies, as well as developing new digital solutions through the use of artificial intelligence, facilitates BSE practitioners in designing systems that better meet clients’ needs during all stages of the project lifecycle. This research suggests that practitioners who adopt digital tools to develop an innovative new approach to BSE design will dramatically improve the efficiency and quality of the design process.
The traditional design process, where detail is added to design components throughout, sees components designed from scratch for each project, creating re-work as more precision is built into the design. Digital libraries allow the creation, storage and reuse of proven and at-the-ready design components on multiple projects from the outset, dramatically reducing the time needed to design systems. The use of digital libraries continue to create efficiencies into the construction stage (GBC, 2019). Standardised components, specifications and tutorials stored within the model help speed up construction and procurement, potentially creating efficiency improvements of up to 20% on a typical project. This leads to reduced design and construction cost, improved design and construction quality, faster design and construction, and design practice efficiencies. By repeating the use of a standardised digital toolkit, design time is reduced, and the inherent prescriptive approach helps reduce design rework (BIM Today, 2019).
2.1.2 Digitally Transforming BSE Design
Digitally transforming the BSE design process has the potential to support practitioners and help clients make better-informed decisions by using automated knowledge-sharing and generative design techniques that provide multiple design options earlier in the design process. Providing detailed 3-d plantroom information with
scheduling and cost data at scheme design stage, rather than at detailed design, means cost plans can be tested earlier and realistic financial models can be developed from the start, minimising risk and the program and cost impacts of design changes (Sacks, Eastman, Teicholz, & Lee, 2018).
Practitioners can then produce highly-detailed, construction-ready, designs that will improve technical co-ordination with the wider design team, reducing contractor design, requests for information schedules, change requests and shorten construction programme. Transforming the BSE design process permits better decision-making with more information, increases the productivity of the entire design team, improves cost certainty and reduces programme costs, thus reducing BSE contract times at construction stage (Schober, 2016).
Digital design tools have the potential to reap 20% savings in consultancy practices (Agarwal, Chandrasekaran, & Sridhar, 2016). Automatic load calculations help achieve significant time savings and create agility in responding to design changes by starting with the automation of standard rule-of-thumb calculations and leading to fully-automated dynamic simulations.
Automatic plantroom and riser-sizing tools facilitate the design of plantrooms and risers in 3-d. Creating a full set of plant and area schedules speedily allows for greater detail at earlier design stages, reducing costs and helping clients review options to choose the best solution for their building (AECOM, 2019). Standardisation of content and automated design detailing processes help produce more detailed and complete information without spending additional time on projects, improving design information and reducing issues during construction. Recent advances in digital technology have brought new ways to optimise project delivery, increase productivity and create efficiencies throughout the design and construction stages (Parsons, Mischke, & Barbosa, 2017). BSE practitioners must transform the way they use technology and data to deliver more efficient and valuable solutions to clients (Lawlor, 2017).
Adopting a digital workflow strategy, BSE teams supporting projects from inception to completion ensure that clients will benefit from digital best practice, workflow and governance throughout. Through a digital-healthy-start, practitioners can mobilise digital skills early on a project, ensuring the best available technologies are in place from the start. This strategy improves productivity in design between 2% and 10% by facilitating greater multidisciplinary coordination, reducing design-stage rework, reducing project costs due to reduced site clashes and issues, and improved stakeholder engagement (Byrne, 2018).
Implementing digital design reviews to improve coordination on large complex projects, and to facilitate collaboration between design teams and project stakeholders, is essential. Digital reviews bring together BIM from different design disciplines to facilitate clash detection and interdisciplinary coordination. The use of a combined model involving all stakeholders to conduct regular reviews helps identify issues early and increases program certainty.
The use of virtual and augmented reality technologies further enhances the design review process, immersing practitioners in full-scale simulations of the design. This facilitates early identification of issues, increases program surety, better management of risks, minimises rework and reduces issues during construction. It engages
Digital engineering: a case study in an Irish consultancy practice
49
Figure 5: Main barriers to BIM implementation (NBS, 2019).
Raymond Reilly 2019.indd 5 26/11/2019 08:23

all project stakeholders in the design review/development process, and the visualisation of the design (Behzadi, 2016). Including visualisation and immersive technology is helping the project team to visualise projects like never before, and are transforming the design process. Blurring the lines between the physical and digital world, virtual reality (VR) and augmented reality (AR) are helping practitioners visualise projects (Fossett, 2016). Whether supporting public consultation, or engaging stakeholders in the design process, immersive technology is helping clients make better-informed decisions, with confidence (Leeuwen, Hermans, Jylhä, Quanjer, & Nijman, 2018).
Immersive technology is bringing digital models to life, allowing all stakeholders from architects, engineers and contractors to owners and end-users, to intuitively interact with a design in real time, wherever they are (Heydarian, et al., 2015). Clients can now interact with their final project throughout the design process, transforming how they engage with designs. On complex projects with multiple stakeholders, clients can see intricate areas of the design and discuss alternative design solutions. It boasts a platform for more efficient design with real-time updates to the model from all stakeholders, clash avoidance and enhanced client review process, and seamless working across teams and locations. In addition, more efficient construction is instigated by heightened value engineering and constructability in design, operations and maintenance benefits with boosted input from owners, operators and end-users (Bolton, 2018).
Practitioners need to actively embrace digital technologies, thus accelerating digital transformation by expanding their existing digital solutions and nurturing new ideas (European Commission, 2016). Developing and implementing a pragmatic and scalable digital transformation plan is the key to drive an enhanced design practice, improving the technical quality of deliverables by disrupting the BSE industry with a new approach to design deliverables, industry pro-curement, construction and building aftercare. Practice challenges will include accelerating technological change, driving multi-industry disruption leading to winners and losers, new industries replacing older ones, and practitioners’ expectations around work and how/where they want to work.
2.1.3 Building Information Modelling in BSE Practice
In an effort to remedy the issue of stagnant labour productivity in the Irish construction industry, BIM was proposed in the late 1980s as a new solution for streamlining the design and delivery process of construction projects, a digital representation of a building meant to serve all project disciplines as a repository of all relevant data throughout the project’s lifecycle. Despite the huge potential for increasing productivity as well as the overall efficiency, the adoption of BIM throughout the construction industry has been observed to be slower than expected (Walaseka & Barszczb, 2017). Fortunately, the Irish BSE industry is small and agile enough to evolve quickly by adapting new technologies to existing expertise, and to learn lessons during this adaption while becoming world class in design (Montague, 2015).
Recent technological and digital developments currently offer an integral BIM 3-dimensional software for BSE design (Szel g, Szewczak, & Brzyski, 2017) which are demonstrating to be a game-changer in Irish consultancy practice. In particular, MagiCAD was developed as a
powerful design tool to save time with more user-friendly, flexible, intelligent, and parametrical user environment (MagiCAD, 2016), and was successfully implemented at the design stage on the case study project. It enabled the MEP design using an extensive product model database, featuring real product families from leading manufacturers across the globe. Each model within the database came complete with accurate dimensions and comprehensive technical data allowing for accurate calculations, advancing the working environment to create a more streamlined workflow that removed monotonous tasks, thus reducing time in the design process. It also provided collision control, and enabled easier and more efficient technical coordination with other disciplines’ intentions during the design process, most notably, architecture and structural engineering. Image 2 demonstrates the accuracy of design by applying MagiCAD. The principle benefits of using this digital engineering technology during implementation of the Grandstand included plant space allocation, scenario planning, early and accurate visualisations, automatic maintenance of consistency in design, enhanced building performance and quality, checks against design intent, accurate and consistent drawing sets, earlier collaboration of multipledesign disciplines, synchronised design and construction planning, discovering errors before construction, and lifecycle benefits regarding operating costs of the building. However, the implementation in MagiCAD in Irish BSE practice is in its infancy, and its practicality and effectiveness are difficult to quantify at this stage.
3. Research Findings and DiscussionA great deal of qualitative material comes from talking with people, whether it is through formal interviews or casual conversations (Woods, 2006). The interview method used for this inquiry offered
SDAR Journal 2019
50
Image 2: Synchronized MEP BIM model applying MagiCAD (Case Study Project).
Raymond Reilly 2019.indd 6 26/11/2019 08:23

Digital engineering: a case study in an Irish consultancy practice
the researcher access to BSE practitioner experience at design and
construction stages. The questions were primarily informed from
findings in the literature review, and presented to the participants in
the context of the case study, allowing them reasonable opportunity
to present phenomena in their own terms (MacDonald, 2012). A
sample of 15-BSE practitioners with varying degrees of experience
were strategically chosen to participate. There are many practical
recommendations regarding a sample size with the most usual
recommendation of 12-20 interviews (Onwuegbuzie & Leech, 2007).
3.1 People
Most interview participants agreed that the BSE design process is
dynamic and complex due to its multidisciplinary nature, and requires
technical competence and collaboration to ensure that MEP systems
are designed effectively ensuring a good quality building within a
reasonable cost programme. The participants also acknowledged
that the design process lasts from project inception to completion,
which infers that the design process does not specifically conclude
once the design is fully detailed at pre-construction stage, thus
contravening theorists design principles. The concept that inferior
BSE design is a consequence of poor design coordination incurring
significant programme delays and costs at construction stage
(Portman, 2014) not only affects MEP installation, but also traverses
to other discipline trades, most notably, the structural engineering
constructs. This phenomenon infers that such deficiencies lead to
fire-fighting and tension between disciplines, thus concurring with
current literature.
The postgraduate experience of each participant ranged from five
years to 15 years. All participants agreed that the Irish educational
system does not adequately prepare graduates for digital engineering
practice. Albeit technical theory underpins successful project design,
it is inferred that the lack of practical digital experience in the BSE
curriculum is a significant weakness which sees graduates as living in
a 2-d world. Most worryingly, it is believed that graduate engineers
are unaware of the real implication of adjusting detailed design and
its inherent impact on other design disciplines, most notably,
architectural and structural engineering.
All BSE participants acknowledge working in silos albeit cognisant of
critical interface requirements between other discipline designs, and
argue that this interface is not clearly advocated by management
at design stage. It is inferred that there is dependence on good
contractors at construction stage to rectify the discipline interface
shortcomings initiated during the design process, suggesting that
improvements in multidisciplinary team coordination at design stage
could potentially reduce implications during installation.
BSE practitioners are cognisant of the so-called half-life of technical
knowledge in engineering practice. While most practitioners are
normally keen to evade this outdated status, many do not share this
vested interest, highlighting that you can take the horse to water,
but you can’t make it drink. Participants also disclose that project
time demands negates sufficient time for adequate formal training to
enhanced their digital skillset. Moreover, there is a decisive aspiration
from practitioners to implement new design tool technologies albeit
time constraints continue to limit research in testing the feasibility
and accuracy of inherent digital engineering tools.
It is expected that the recent endeavour by the National BIM Council
(NBC) of Ireland to roadmap digitalisation of the Irish Architecture
Engineering and Construction (AEC) sector will pave the way for
greater productivity in digital practice by enhancing leadership,
education and training among its practitioners.
3.2 Processes
The introduction of digital specialisms such as BIM, thermal modelling (TM) and computational fluid dynamics (CFD) has in fact initiated silo working environments in BSE practice. Participants expressed concerns that current practice is veering towards each practitioner being a one-for-all BSE practitioner, which in their view is not practical in modern practice, and consequently, introduces dissonance between designers.
Design coordination problems are known for their ill-definedness and complexities which result as a lack of information (Park & Lee, 2017). The design coordination process is intended to allow each discipline to compare their respective materials that are intended for given space in a building to ensure they will not conflict physically or impair the installation and maintenance of subsequent systems. BSE participants argue that design coordination is performed primarily by BIM technologists with variable levels of effort and results. This affirmation of sorts surmises that engineering design is coordinated and driven by engineers, but the end result is delivered through the hands of others.
Digital information management systems enable the integration of people, processes and data throughout the project lifecycle, allowing the secure sharing and storage of project information, while enabling practitioners to collaborate effectively and provide visibility into the project to essentially mitigate risk. This structure ensures that the right information is available when required in the right format (Portman, 2014). All participants tend to poach as much as 60% to 70% of previous designs, cost and programme information for new projects as a means to minimise documentation production time. Consequently, it is imperative that up-to-date industry standards and specifications are managed and easily accessible by practitioners. BSE participants are confident that the adoption of ISO 19650 (Parts 1& 2) will facilitates an excellent common data environment in terms of in-house filing and project templates at both project design and delivery stages.
3.3 Technology
Engineering design is often too complex to carry out manually due to the significant number of variables. The use of digital prediction software tools can often mitigate against human error from manual calculation, and practitioners accept that such software is adopted with an air of caution in terms of accuracy, thus advocating that their design is checked by experienced practitioners who apply their tacitness to this explicit process.
Participants insinuate that CFD software does not reflect real-world, and is dependent on accurate input parameters which are often difficult to define to simulate a realistic model. This research intimates
51
Raymond Reilly 2019.indd 7 26/11/2019 08:23

that thermal modelling software provides a good guidance, but similarly, there is reliance on many variables at the outset to achieve an exact simulation. Inherent variables such as people behaviour, building operation, weather conditions and building construction materials are imperative in achieving accurate results.
This research affirms that adopting integrative technologies to MEP design projects is essential to enable stakeholders to instantly collaborate on an integrated design platform. Design practitioners that depend on 2-d drawings will be at a professional disadvantage by their inability to fully visualise the building and relevant angle views due to the limitations of drawings. Participants explain that the transition from 2-d to 3-d is a painful one. Its adoption demands greater time to coordinate the 3-d model at design stage which incurs higher costs to the design team.
Participants also reveal that although working in a collaborative environment, sharing the BIM model among other disciplines is not a straightforward activity. The BSE team requires other discipline designs to be complete, that is, architecture and structural engineering, prior to their design input. Participants readily admit another major challenge relating to BIM modelling representation; detailed design of 3-d models must be well advanced prior to presenting resultant 2-d drawings. This is a significant drawback for BSE practitioners who aim to produce work-in-progress drawings during the design process. Moreover, MagiCAD is offering BSE practitioners with an illustrative mechanical and electrical engineering design software. The participants believe that its concept is brilliant for elements of design, and advocate that its adoption demands intensive training in order to reap the rewards.
4. ConclusionThe BSE design process is fundamentally a function of the quality of the installed systems at construction stage of which BSE practitioners are in a position to influence.
The theoretical path in this research ultimately focused on under-standing the empirical system in practice by applying data collection from interviews to test the various components of the BSE design process. Theory generated from this case study makes sense of the complex dichotomy between the design and construction stages that underpins BSE practice in the context of people, processes and technology, thus elucidating efforts to improve the current design process through digital engineering. This triangulated focus ensures that the BSE team consists of people with relevant education, skills and experience who are committed to conducting staged processes throughout the project life, and more importantly, supported by suitable digital technologies to sustain a modern engineering practice.
Notwithstanding the failure of the Irish government to lead and move with the digital evolution, the recent strategic initiative by the National BIM Council (NBC) of Ireland has the potential to overcome the key barriers to digitalisation in the AEC sector. The full implementation of this strategy would provide a more productive way of working in the BSE industry by enhancing leadership, standardising the adoption of a digital platform (BIM), and providing education and training to current and prospective practitioners.
References
AECOM. (2018). Digital Transformation: Digitally Transforming MEP Engineering. London: AECOM.
AECOM. (2019). Digital Delivery; Faster Smarter Better. London: AECOM.
Agarwal, R., Chandrasekaran, S., & Sridhar, M. (2016). Imagining Construction’s Digital Future. London: McKinsey & Company.
Austin, S., Baldwin, A., & Newton, A. (1994). Construction Management and Economics -Manipulating the Flow of Design Information to Improve the Programming of Building Design, 12(5), 445-455.
Behzadi, A. (2016). Using Augmented and Virtual Reality Technology in the Construction Industry. American Journal of Engineering Research, 350-353.
BIM Today. (2019). The Digital Twin Issue; Putting Theory into Practice. Cheshire: Adjacent Digital Politics Ltd.
Bolton, C. (2018). Supporting Constructability Analysis Meetings with Immersive Virtual Reality-based Collaborative BIM 4D Simulation. Automation in Construction, 1-15.
British Standards Institute. (2019). How BIM has changed the Global Construction Industry and is set to Shape its Future. London: BSI Group.
Byrne, D. (2018). Changing Engineering Workflows from 2D to 6D. Retrieved from http://www.engineersjournal.ie/2018/03/06/changing-engineering-workflows-2d-6d/
Engineers Ireland. (2016). Your Guide to Continuing Professional Development. Engineers Ireland, 1-9.
Engineers Ireland. (2019). BIM: The Need for a Government-led Strategic Framework.
EUBIM. (2017). Handbook for the Ontroduction of Building Information Modelling by the European Public Sector. EUBIM Taskgroup.
European Commission. (2016). Accelerating the Digital Transformation of European Industry and Enterprises. European Commission.
Fossett, W. (2016). Blurring the Lines between Virtual and Reality; How VR will Permeate our World. Techvibes.
GBC. (2019). Circular Economy Guidance for Construction Clients. London: UK Green Building Council.
GCCC. (2017). Department of Public Expenditure and Reform: National Development Plan. Retrieved from Government Committe for Construction Contracts: https://www.per.gov.ie/en/government-strategy-to-increase-use-of-digital-technology-in-key-public-works-projects-launched/
Heydarian, A., Carneiro , J., Gerber , D., Becerik-Gerber , B., Hayes , T., & Wood, W. (2015). Immersive Virtual Environments versus Physical Built Environments: A Benchmarking Study for Building Design and User-Built Environment Explorations. Automation in Construction, Pages 116-126.
Lawlor. (2017). Engineering in Society. Royal Academy of Engineering.
Leeuwen, J., Hermans, K., Jylhä, A., Quanjer, A., & Nijman, H. (2018). Effectiveness of Virtual Reality in Participatory Urban Planning. Beijing: Association for Computing Machinery.
Li, J., Hou, L., Wang, X., Wang, J., Guo4, J., Zhang, S., & Jiao, Y. (2014). A Project-based Quantification of BIM benefits. International Journal of Advanced Robotic Systems.
MacDonald, C. (2012). Understanding Participatory Action Research; A Qualitative Research Methodology Option. Canadian Journal of Action Research, 13(2), 34-50.
MagiCAD. (2016). MagiCAD. Retrieved from https://www.magicad.com/en/
Maloney, C. (2010). The Secret to Accelerating Diffusion of Innovation: The 16% Rule Explained. Innovate or Die.
McAuley, B., Hore, A., & West, R. (2012). European Conference on Product and Process Modelling (p. Implementing Building Information Modelling in Public Works Projects in Ireland). Dublin: Technological University Dublin.
SDAR Journal 2019
52
Raymond Reilly 2019.indd 8 26/11/2019 08:23

McAuley, B., Hore, A., & West, R. (2019). BIM in Ireland 2019: A Study of BIM Maturity and Diffusion in BIM in Ireland 2019.
Miller, F., Vandome, A., & McBrewster, J. (2009). Building Services Engineering. VDM Publishing.
Montague. (2015). Building Information Modelling – Innovation in Construction. The Irish Building Magazine.
NBS. (2019). National BIM Report 2019 . Newcastle: National Building Specification.
Onwuegbuzie, A., & Leech, N. (2007). A Call for Qualitative Power Analysis. Quality & Quantity,, 41(1), 105-121.
Park, J., & Lee, G. (2017). Design Coordination Strategies in a 2D and BIM Mixed-project Environment: Social Dynamics and Productivity. Building Research & Information, 631-648.
Parsons, M., Mischke, J., & Barbosa, F. (2017). Improving Construction Productivity. McKinsey & Company.
Portman, J. (2014). Building Services Design Management. London: Wiley Blackwell.
Rigg, C., & Trehan, K. (2008). Critical Reflection in the Workplace: Is it just too Difficult? Journal of European Industrial Training, 32(5), 374-384.
Sacks, R., Eastman, C., Teicholz, P., & Lee, G. (2018). BIM Handbook: A Guide to Building Information Modeling for Owners, Designers, Engineers, Contractors and Facility Managers. New York: Wiley.
Schober, K. (2016). Digitisation of the Construction Industry. Munich: Roland Berger GMBH.
Sheppard, S., Colby, A., Macatangay, K., & Sullivan, W. (2006). What is Engineering Practice. International Journal of Engineering Education, 22(3), 429-438.
Szel g, M., Szewczak, A., & Brzyski, P. (2017). BIM in General Construction. Lubin: Lublin University of Technology.
Trafford, V., & Leshem, S. (2012). Stepping Stones to Achieve your Doctorate, London: Open University Press.
Trevelyan. (2014). The Making of an Expert Engineer, London. Taylor and Francis Group.
Walaseka, D., & Barszczb, A. (2017). Analysis of the Adoption Rate of Building Information Modeling, 172, 1227 – 1234.
Woods, P. (2006). Qualitative Research. Educational Research in Action.
Yin. (1994). Case Study Research; Design and Methods; CA: Sage.
Yongping, H., Chunyan, W., Pengfei, Z., & Weiping, S. (2014). An Ontology-base for Process Modelling in Multidisciplinary Collaborative Design. International Journal for Control and Automoation, 7(8), 143-165.
Digital engineering: a case study in an Irish consultancy practice
53
Raymond Reilly 2019.indd 9 26/11/2019 08:23

CIBSE Ireland Region …
… just a click awayCIBSE Ireland’s interactive website gives a comprehensive overview of the Institution’s aims, objectives, officers and committee members, along with details of its extensive CPD programme and technical evenings. It also includes regular news updates, and reports on inter-association activity, industry awards, participation in Government consultation bodies, and other promotional activity on behalf of the building services industry.
CIBSE Ireland is the leading organisation for information, guidance and advice on all building services related matters. Membership brings many benefi ts, including access to the full suite of CIBSE publications available online via the knowledge portal. For more information on how to become a member, or to progress to a higher grade of membership, log on now.
www.cibseireland.orgCIBSE Web Advert 2019.indd 1 23/11/2019 11:47

Enhancing Thermal Mass Performance of Concrete
Undergraduate engineers’ preferences for a range of professional roles
Darren [email protected]
Maarten Pinxten [email protected]
Kevin Gaughan [email protected]
Brian [email protected]
Darren Carthy 2019.indd 1 26/11/2019 08:26

AbstractThis paper reports on a personal preference test which aligns
students to a range of professional roles based on their
attitudes towards performing particular tasks. The 10-item
test was administered to 109 first-year engineering students
at TU Dublin, Ireland and 159 third-year engineering students
at KU Leuven, Belgium in September of the 2018/19
academic year.
The test had two purposes:
• to align students to three professional engineering roles
based on their preference for performing certain tasks;
• to allow students to reflect on an initially tacit model of
professional roles.
In this paper only the first purpose is considered, followed
by an evaluation of the reliability of the test.
Preliminary results indicate that the majority of students at
TU Dublin and at KU Leuven wish to work in roles which
involve the development of radically new products and
services, while a much smaller proportion of students wish
to work with product and process optimisation. The data
also indicates that, in general, students have less favourable
attitudes towards working in client-centred roles. These
findings present a unique challenge for engineering educators
and employers alike in Ireland and Belgium, as industries
in these nations shift towards services and away from
manufacture. So too do the skills requirements to work
effectively in the modern engineering sector.
Keywords
Graduate engineers, professional skills, recruitment.
SDAR Journal 2019
56
Darren Carthy 2019.indd 2 26/11/2019 08:26

1. Introduction
Ireland has been the subject of scrutiny at European level with regard to some key indicators on the European Skills Index (European Skills Index Technical report, 2018). Ireland ranks 22nd out of the 28 EU member states for occupational skill mismatch, which is defined as a nation’s ability in matching skills to the relevant job. In particular, engineering professionals and technicians were identified as a sector with a high degree of mismatch (Skills challenges in Europe, 2014).
The engineering sector in Ireland has enjoyed rapid growth over the past two decades, with employment levels in the science and engineering professions growing by 17% from 2005 to 2015, a figure which is set to continue to grow by another 13% by 2025 (Researchers & engineers: skills opportunities and challenges, 2016). With Ireland’s manufacturing sector beginning to decline and employment in professional services seeing a steady rise, the skills requirements of engineering professionals are changing (Ireland: Skill supply and demand up to 2025, 2015) and the meaning of what it is to be an engineer is changing as well.
To address the growing concern over the skills mismatch in Europe, the Professional Roles & Employability of Future Engineers (PREFER) project was initiated in 2017 with three main objectives:
• to develop a model of professional roles to help engineering students navigate the job market;
• to develop tailored tests to allow students to reflect on their preferences towards working in these roles and on their strengths and weaknesses;
• to develop curriculum elements to help facilitate students’ development of their professional skills.
As part of the PREFER project, a personal preference test was developed to help engineering students evaluate which type of role, rather than which job, they would most like to fulfil based on a self-assessment (Carthy, Bowe and Gaughan, 2018). This provided students with a compass to enable them to navigate the job market and identify roles which maximally utilise their skills and match with their personal preferences toward work.
The three roles of the PREFER model are the following:
• Product leadership, which involves developing new products and services for the company and its clients. Taking the example of the construction sector, this would include novel materials for reinforcing concrete and novel industrial processes for casting or the drilling of piles.
• Operational excellence, which focuses on monitoring and analysing production processes, optimising those processes in line with budgetary and time constraints, and coordinating scheduled maintenance of production machinery. Again taking the con-struction industry example these could be project coordinators, ensuring that a contract is delivered within budget and in a timely manner, and dealing with obstacles that may interfere with these deadlines.
• Customer Intimacy, this role centres on providing tailored solutions to clients and listening to their needs. These individuals are responsible for liaising between the firm or company and the client
to ensure these needs are met, and to provide technical support to the client when required. These individuals are in particularly high demand in engineering consulting services where a strong emphasis is placed on client satisfaction.
The objective for this paper is to present the results of a pilot of the personal preference test and to establish which role – if any – was the preferred role for undergraduate engineering students to work in.
2. MethodologyPersonal preference tests fall into the broad category of self-assessment measures. One method for operationalising a personal preference test is to look for a match between an individual’s values, and the opportunities to fulfil these values. In general, these tests are known as value judgements. The advantages of this approach is that the test is easy to fill out and it requires little cognitive effort.
According to the Value-Expectancy Model (Fishbein and Ajzen, 2010), attitudes follow directly from beliefs about the attitude object. For example, Oscar’s attitude towards learning maths is a direct result of Oscar’s beliefs about the nature of maths. These beliefs could be formed by watching maths tutorials online, as a form of direct observation. They may be formed externally through other media such as accepting information from friends, maths lecturers or professional mathematicians, or they may be self-generated beliefs created through inference.
The way these behaviours can influence attitudes is outlined in the Value-Expectancy Model, which describes attitude formation and structure. The model suggests that attitude formation is autonomous and inevitable as new beliefs are formed about an object. So, an individual will have initial attitudes that are linked to an object, attitudes that slowly change as new beliefs are generated. This can be modelled symbolically as:
A bi ei Eq.1
The equation states that one’s attitudes toward an object is the sum
overall of all attributes of the object (Fishbein, M. and Ajzen, 1975).
These attributes are composed of the strength of one’s beliefs bi about
the attribute i and the evaluation of the attribute bi relating to the object
i. That is to say, the evaluation and strength of one’s belief about an
attribute contributes to an overall attitude towards an object. So, people
will hold favourable attitudes toward an object for which they have
associated an overall positive set of attributes to. This will be similar for
negative attitudes for which the majority of the attributes associated with
that object have subjectively been deemed negative.
A second way to operationalise a personal preference test is to look for
an individual’s preferred personal style. This is a measurement of an
individual’s dispositional interest, which reflects their preference for
certain behaviours and the particular contexts in which those behaviours
occur (Rounds, 1995). The evaluation of these dispositional interests are
typically employed when dealing with individuals who are making career
decisions (Su, Rounds and Armstrong, 2009).
Dispositional interest evaluation follows in the tradition of vocational
psychology where the research focuses primarily on the development,
validation and interpretation of interest assessments in order to tackle
Undergraduate engineers’ preferences for a range of professional roles
57
Darren Carthy 2019.indd 3 26/11/2019 08:26
SDAR Journal 2019
58
issues relating to career development (Low and Rounds, 2006). Imagine
a test to determine your favourite piece of fruit, one could simply ask
“what is your favourite piece of fruit?”, but this question lacks any
contextual specificity. Say for example an orange was your favourite fruit,
what if the orange was over-ripened? To add more complexity to the
problem, what if your second favourite fruit – a banana – is also presented
to you and it is perfectly ripe … is the orange still your preference?
This form of testing has obvious value in that it does not simply examine
what your favourite fruit is, but allows you to examine the boundaries of
your preference and to develop a tacit rank-order of fruit preference. This
type of test has been used in prior research into whether or not an
individual was work or people oriented to a greater or lesser extent using
an inventory style assessment (Harrison and Lubin, 1965). The test
developed in this research can be seen as an extension of the work of
Harrison and Lubin in that individuals are further separated into being
more or less product, process or people oriented, and built on the
measurement of dispositional interests rather than value judgement.
3. MethodsA test tool was developed by the authors in collaboration with HR professionals from the Human Capital Department at BDO, a large consultancy firm, to evaluate a student’s fit to the three professional roles outlined in the PREFER project (Craps et al, 2017). This was achieved by separating the test into two parts. The first, which is the topic of discussion in this paper, was a personal preference test. The personal preference test asked participants to select the most and least preferred course of action from three possible activities.
An example drawn from the test is as follows. Together with two colleagues, you are preparing a new project. Which of the following roles would you prefer during this preparatory phase? The participant is then presented with three activities and asked to indicate their most preferred, and least preferred, course of action:
• Exploring technical reports to detect the latest developments in the field;
• Drafting the operational processes in order to reduce risk and maximise efficiency;
• Exploring the market in order to identify opportunities and setting up a marketing strategy.
This was initially a 10-item test with each response aligned to one of the three roles, developed by the PREFER development team in close collaboration with HR professionals from BDO. The test was administered on pen and paper. Participants were initially asked about their role preference and provided with a brief description of each professional role. The test was provided to 221 male and 39 female engineering first-year engineering students from TU Dublin, Ireland and third-year engineering students from KU Leuven, Belgium in the first semester of the 2018/19 academic year. Scores were assigned to each role with a theoretical maximum of 10 representing full preference for a particular role and a theoretical minimum of -10 representing full distaste for a particular role.
A six-item feedback questionnaire was added to gauge the user experience of the test. In the feedback questionnaire, the interpretability of the test in terms of the English language was
evaluated along with students’ need for feedback, the degree of interest in the presented cases and the length of the test. The test was administered in conjunction with a brief introduction to the research and was carried out with full ethics approval from the TU Dublin Research Ethics Committee (REC-17-112).
The test was subjected to face validation. A face validation procedure is a means of establishing if a test is fit for purpose by collecting expert opinions on the test items (Hardesty and Bearden, 2004). In this instance, the procedure involved structured interviews with five engineering academics who possessed industry experience from TU Dublin. A cross-section of engineers was selected, ranging from those who had worked with tangible products and services to those who work with more virtual products and services such as software applications and in consultancy. The items were read one by one and the participants were asked if they felt that each item was a realistic scenario for a graduate engineer to find themselves in. Their feedback was collated and used to fine-tune the first draft of the test.
A reliability analysis was carried out on the data collected from the pilot studies using Cronbach’s test of internal consistency (Cronbach, 1955). The purpose of a reliability analysis is to see how the items on the test relate to one another and to establish how reliable a measurement is, in this instance how reliably it measures a participant’s preference for a particular engineering role. For this analysis a “correct answer” for each item was assigned based on the participant’s initial role-preference from a choice of the three roles followed by a short description. In other words, if a student initially chose product leadership as their preferred role, that participant could only score when their item response aligned to that initial preference.
The assumption for the purposes of this analysis was that the initial role-preference and the test itself measure the same thing and that students did not attach qualitatively different meanings to this initial question. The values obtained from the Cronbach’s test will be discussed in detail in the results section.
4. Results
4.1 Reliability analysis
Each item had three values for Cronbach’s alpha coefficient, one for each role it represented. The mean values for each role were =.668 for the product leadership role, = .427 for the operational excellence role and = .545 for the customer intimacy role from a sample of n = 197 complete responses. The estimated acceptable value for a test of three roles with 10 items is .52±0.2 (Cortina, 1993) and so a lower bound of .32 was established as the minimum criteria for a reliable test in this instance.
Rather than focusing on the three values of alpha obtained from the initial analysis, the test values of alpha when a particular item was deleted were examined. For Item 5 of the test, in the case of all three values of Cronbach’s alpha obtained, the reliability of the test increased when that item was removed. The mean values for each role with For Item 5 deleted were = .686 for the product leadership role, = .460 for the operational excellence role and = .624 for the customer intimacy role.
Darren Carthy 2019.indd 4 26/11/2019 08:26
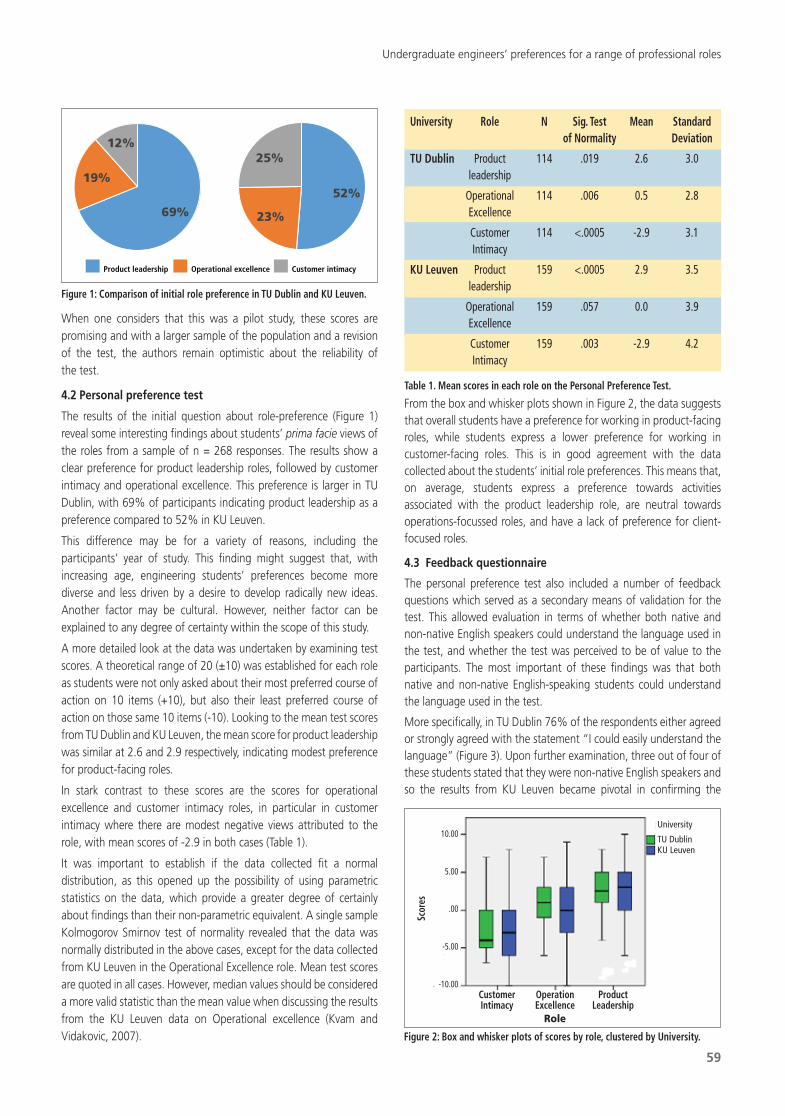
When one considers that this was a pilot study, these scores are promising and with a larger sample of the population and a revision of the test, the authors remain optimistic about the reliability of the test.
4.2 Personal preference test
The results of the initial question about role-preference (Figure 1) reveal some interesting findings about students’ prima facie views of the roles from a sample of n = 268 responses. The results show a clear preference for product leadership roles, followed by customer intimacy and operational excellence. This preference is larger in TU Dublin, with 69% of participants indicating product leadership as a preference compared to 52% in KU Leuven.
This difference may be for a variety of reasons, including the participants’ year of study. This finding might suggest that, with increasing age, engineering students’ preferences become more diverse and less driven by a desire to develop radically new ideas. Another factor may be cultural. However, neither factor can be explained to any degree of certainty within the scope of this study.
A more detailed look at the data was undertaken by examining test scores. A theoretical range of 20 (±10) was established for each role as students were not only asked about their most preferred course of action on 10 items (+10), but also their least preferred course of action on those same 10 items (-10). Looking to the mean test scores from TU Dublin and KU Leuven, the mean score for product leadership was similar at 2.6 and 2.9 respectively, indicating modest preference for product-facing roles.
In stark contrast to these scores are the scores for operational excellence and customer intimacy roles, in particular in customer intimacy where there are modest negative views attributed to the role, with mean scores of -2.9 in both cases (Table 1).
It was important to establish if the data collected fit a normal distribution, as this opened up the possibility of using parametric statistics on the data, which provide a greater degree of certainly about findings than their non-parametric equivalent. A single sample Kolmogorov Smirnov test of normality revealed that the data was normally distributed in the above cases, except for the data collected from KU Leuven in the Operational Excellence role. Mean test scores are quoted in all cases. However, median values should be considered a more valid statistic than the mean value when discussing the results from the KU Leuven data on Operational excellence (Kvam and Vidakovic, 2007).
From the box and whisker plots shown in Figure 2, the data suggests that overall students have a preference for working in product-facing roles, while students express a lower preference for working in customer-facing roles. This is in good agreement with the data collected about the students’ initial role preferences. This means that, on average, students express a preference towards activities associated with the product leadership role, are neutral towards operations-focussed roles, and have a lack of preference for client-focused roles.
4.3 Feedback questionnaire
The personal preference test also included a number of feedback questions which served as a secondary means of validation for the test. This allowed evaluation in terms of whether both native and non-native English speakers could understand the language used in the test, and whether the test was perceived to be of value to the participants. The most important of these findings was that both native and non-native English-speaking students could understand the language used in the test.
More specifically, in TU Dublin 76% of the respondents either agreed or strongly agreed with the statement “I could easily understand the language” (Figure 3). Upon further examination, three out of four of these students stated that they were non-native English speakers and so the results from KU Leuven became pivotal in confirming the
Undergraduate engineers’ preferences for a range of professional roles
59
Figure 1: Comparison of initial role preference in TU Dublin and KU Leuven.
69%
19%
12%
52%
23%
25%
Product leadership Operational excellence Customer intimacy
University Role N Sig. Test Mean Standard of Normality Deviation
TU Dublin Product 114 .019 2.6 3.0 leadership
Operational 114 .006 0.5 2.8 Excellence
Customer 114 <.0005 -2.9 3.1 Intimacy
KU Leuven Product 159 <.0005 2.9 3.5 leadership
Operational 159 .057 0.0 3.9 Excellence
Customer 159 .003 -2.9 4.2 Intimacy
Table 1. Mean scores in each role on the Personal Preference Test.
Figure 2: Box and whisker plots of scores by role, clustered by University.
Customer Intimacy
Operation Excellence
Product Leadership
Role
Scor
es
10.00
5.00
.00
-5.00
-10.00
KU Leuven
University
TU Dublin
Darren Carthy 2019.indd 5 26/11/2019 08:26

usability of the test on a wider, non-native English-speaking cohort.
The results from KU Leuven indicated that 83% of the participants could understand the language used in the test. This was a promising result as both students of native and non-native English-speaking universities seemed to be able to understand the language used.
In addition to the language aspect, participants were also asked to rate the statement “I enjoyed filling out the questionnaire” (Question 4) and “I am curious about my results” (Question 5). Regarding the latter question, 26% either disagreed or strongly disagreed with the statement.
Although the majority of students were both curious about the result and enjoyed the experience, there was a reasonable proportion of students who did not. There are certainly grounds to conduct focus group discussions with the students who took part in order to get to the bottom of these results and collect recommendation for revisions before the final draft is delivered.
Twenty seven students spoiled their test data by completing the test incorrectly. In most cases this was the result of selecting more than one most-preferred response, or more than one least-preferred response. Upon analysis 94% of students agreed that the instructions were clear in Question 7 which stated “I found the instructions clear” which can only be described a spurious result in light of the rate of spoiled test data. Accordingly, a more detailed set of instructions is to be added to the beginning of the test to mitigate spoiled data.
5. DiscussionThe authors believe that the data presents compelling evidence of engineering students’ role-preferences being biased towards product-facing roles with implications for recruiters, in particular those companies and firms who seek client-focused graduates to work in consultancy. The test will be run again in TU Dublin with first-year engineering students in the 2019/20 academic year to establish if this pattern of role-preference is consistent over time. It will be followed by a retest of the original cohort of first-year students in the 2020/21 academic year to establish their role preferences change over the course of a two-year period.
6. ConclusionsThe test will be revised in light of the results of the validation. In particular, Item 5 will be altered, which will result in an increase in the
mean value of Cronbach’s alpha and provide a more reliable test of role preference. In addition, there is a case to extend the test beyond 10 items. There is a direct correlation between test length and reliability (Lord, Novick and Birnbaum, 1968), which is in some way implicit in that it adds granularity to a data set. The major disadvantage to adding items is that it increases test length, which currently is about ten minutes.
There is also a case for conducting a focus group discussion with students who have either taken the test or who are willing to review the test in an attempt to explain some of the negative experiences that test users expressed in the feedback questionnaire.
Currently, the data suggests that engineering students at both TU Dublin and KU Leuven have a strong preference to work in product-facing roles and a lack of preference for working in client- facing roles. This has serious implications for engineering recruiters, particularly those recruiting into consultancy, where a large amount of time is spent working with clients.
It also has wider implications for the field of engineering as a whole, as engineers spend as little as 7% of their time working on design and innovation, and 60% of their time managing projects and carrying out tests and inspections (Trevelyan and Williams, 2019). There certainly seems to be a mismatch emerging between what an engineer does and what undergraduate engineers would like to do.
Acknowledgements
This work was supported by Erasmus+ programme of the European Union (grant Agreement 575778-EPP-1-2016-1-BE-EPPKA2-KA) and is part of the PREFER project. A big thanks to Binder Dijker Otte (BDO) for their support in the
development of the test and their continued support during the PREFER project.
SDAR Journal 2019
60
Figure 3. Comparison of responses to “I could easily understand the language”.
Disagree Rather disagree Rather agree Agree
TU Dublin KU Leuven
52%
24%
24%49%
15%
35%
1%
Darren Carthy 2019.indd 6 26/11/2019 08:26

Undergraduate engineers’ preferences for a range of professional roles
References
Carthy, D., Bowe, B. and Gaughan, K. (2018) ‘The development of a psychometric test aimed at aligning students to a range of professional roles’, in 6th Annual EERN Symposium, University of Portsmouth, UK. Royal Academy of Engineering. Available at: https://hefocus.raeng.org.uk/network-events/.
Cortina, J. M. (1993) ‘What Is Coefficient Alpha? An Examination of Theory and Applications’, Journal of Applied Psychology, 78(1), pp. 98–104.
Craps S., Pinxten M., Saunders G., Leandro Cruz M., Gaughan K., Langie G. (2017). Professional Roles and Employability of Future Engineers. (Paper No. 499-507). Presented at the SEFi Conference, Azores Portugal, 18 Sep 2017-21 Sep 2017. European Society for Engineering Education SEFI. ISBN: 978-989-98875-7-2.Cronbach, L. J. (1955) ‘Construct validity in Psychological tests’, Psychological Bulletin, 52(4)(4), pp. 281–301.
European Skills Index Technical report (2018) CEDEFOP, European Centre for the Development of Vocational Training.
Fishbein, M. and Ajzen, I. (1975) Belief, Attitude, Intention and Behaviour: An Introduction to Theory and Research. Addison-Wesley.
Fishbein, M. and Ajzen, I. (2010) ‘Attitudes and Their Determinants’, in Predicting and changing behaviour, pp. 96–97.
Hardesty, D. M. and Bearden, W. O. (2004) ‘The use of expert judges in scale development Implications for improving face validity of measures of unobservable constructs’, 57, pp. 98–107. doi: 10.1016/S0148-2963(01)00295-8.
Harrison, R. and Lubin, B. (1965) ‘Personal Style, Group Composition, and Learning’, The Journal of Applied Behavioral Science. SAGE Publications Inc, 1(3), pp. 286–301. doi: 10.1177/002188636500100306.
Ireland: Skill supply and demand up to 2025 (2015) CEDEFOP, European Centre for the Development of Vocational Training.
Kvam, P. H. and Vidakovic, B. (2007) ‘Introduction’, in Nonparametric Statistics with Applications to Science and Engineering. John Wiley & Sons, pp. 1–7.
Lord, F. M., Novick, M. R. and Birnbaum, A. (1968) Statistical theories of mental test scores, Statistical theories of mental test scores. Oxford, England: Addison-Wesley.
Low, D. and Rounds, J. (2006) ‘Vocational Interests’, in Thomas, J. and Segal, D. (eds) Comprehensive handbook of personality and psychopathology Volume 1: Personality and everyday functioning. Wiley.
Researchers & engineers: skills opportunities and challenges (2016) CEDEFOP, European Centre for the Development of Vocational Training.
Rounds, J. (1995) ‘Vocational Interest: Evaluating Structural Hypotheses’, in Lubinski, D. and Dawis, R. V (eds) Assessing Individual Differences in Human Behavior – New Concepts, Methods and Findings. Davies Black Publishing, pp. 177–232.
Skills challenges in Europe (2014) EU Skills Panorama. Available at: http://skillspanorama.cedefop.europa.eu/sites/default/files/EUSP_AH_SkillsChallenges_ 0.pdf.
Su, R., Rounds, J. and Armstrong, P. I. (2009) ‘Men and Things , Women and People : A Meta-Analysis of Sex Differences in Interests’, Psychological Bulletin, 135(6), pp. 859–884. doi: 10.1037/a0017364.
Trevelyan, J. and Williams, B. (2019) ‘Identifying Value in the Engineering Enterprise’, in The Engineering-Business Nexus. Springer, pp. 281–313.
Darren Carthy 2019.indd 7 28/11/2019 14:43

DIT offers PhD opportunities inEngineering and the Built Environment- wholetime and part-time; funded, self-funded or
partnership funded with companiesTo find out about current opportunities contact [email protected]
www.dit.ie/researchandenterprise/graduateresearchschool/
TU Dublin offers PhD opportunities in Engineering and the Built EnvironmentCourses are full-time and part-time; funded, self-funded or partnership funded with companies.
To find out about current opportunities contact [email protected]
www.tudublin.ie/researchandenterprise/graduateresearchschool/
TU PhD Advert 2019.indd 1 28/11/2019 14:49