Embed Size (px)
Citation preview
UC DavisUC Davis Previously Published Works
TitleISSR-Based Genetic Diversity Assessment of Genus Jasminum L. (Oleaceae) from Pakistan.
Permalinkhttps://escholarship.org/uc/item/1np5x2j2
JournalPlants (Basel, Switzerland), 10(7)
ISSN2223-7747
AuthorsAkhtar, NaeemHafiz, Ishfaq AhmadHayat, Muhammad Qasimet al.
Publication Date2021-06-22
DOI10.3390/plants10071270 Peer reviewed
eScholarship.org Powered by the California Digital LibraryUniversity of California
plants
Article
ISSR-Based Genetic Diversity Assessment of GenusJasminum L. (Oleaceae) from Pakistan
Naeem Akhtar 1,2,* , Ishfaq Ahmad Hafiz 1, Muhammad Qasim Hayat 3 , Daniel Potter 2,Nadeem Akhtar Abbasi 1, Umer Habib 1, Adil Hussain 4 , Hina Hafeez 5 , Muhammad Ajmal Bashir 1,6,*and Saad Imran Malik 7
�����������������
Citation: Akhtar, N.; Hafiz, I.A.;
Hayat, M.Q.; Potter, D.; Abbasi, N.A.;
Habib, U.; Hussain, A.; Hafeez, H.;
Bashir, M.A.; Malik, S.I. ISSR-Based
Genetic Diversity Assessment of
Genus Jasminum L. (Oleaceae) from
Pakistan. Plants 2021, 10, 1270.
https://doi.org/10.3390/
plants10071270
Academic Editor: Rosalyn
B. Angeles-Shim
Received: 30 April 2021
Accepted: 19 June 2021
Published: 22 June 2021
Publisher’s Note: MDPI stays neutral
with regard to jurisdictional claims in
published maps and institutional affil-
iations.
Copyright: © 2021 by the authors.
Licensee MDPI, Basel, Switzerland.
This article is an open access article
distributed under the terms and
conditions of the Creative Commons
Attribution (CC BY) license (https://
creativecommons.org/licenses/by/
4.0/).
1 Department of Horticulture, Pir Mehr Ali Shah Arid Agriculture University, Rawalpindi 46000, Pakistan;[email protected] (I.A.H.); [email protected] (N.A.A.); [email protected] (U.H.)
2 Department of Plant Sciences, College of Agricultural and Environmental Sciences, University of California,Davis, CA 95616, USA; [email protected]
3 Plant Systematics and Evolution Laboratory, Department of Plant Biotechnology, Atta ur Rahman School ofApplied Biosciences (ASAB), National University of Sciences and Technology (NUST),Islamabad 44000, Pakistan; [email protected]
4 Department of Biotechnology, Faculty of Life Sciences, University of Okara, Okara 56130, Pakistan;[email protected]
5 National Institute for Genomics and Advanced Biotechnology, National Agriculture Research Center,Islamabad 44000, Pakistan; [email protected]
6 Department of Agriculture and Forestry Sciences, University of Tuscia, San Camillo de Lellis, snc,01100 Viterbo, Italy
7 Department of Plant Breeding and Genetics, Pir Mehr Ali Shah Arid Agriculture University,Rawalpindi 46000, Pakistan; [email protected]
* Correspondence: [email protected] (N.A.); [email protected] (M.A.B.)
Abstract: The genus Jasminum L., of the family Oleaceae, includes many species occurring in thewild, or cultivated worldwide. A preliminary investigation based on inter-simple sequence repeats(ISSR) was performed to assess the genetic diversity among 28 accessions, representing nine speciesof Jasminum from various regions, representing a range of altitudes in Pakistan. A total of 21 ISSRprimers were used, which produced 570 amplified bands of different sizes, with a mean polymorphicband percentage of 98.26%. The maximum resolving power, polymorphism information content,and index values of the ISSR markers recorded for primers 6, 16, and 19 were 0.40, 12.32, and 24.21,respectively. Based on the data of the ISSR markers, the resulting UPGMA dendrogram with theJaccard coefficient divided the 28 accessions into two main clades. At the species level, the highestvalues for Shannon’s information index, polymorphism percentage, effective allele number, Nei’sgenetic variations, and genetic unbiased diversity were found in Jasminum sambac L. and J. humileL., while the lowest were observed in J. mesnyi Hance and J. nitidum Skan. Based on Nei’s unbiasedgenetic identity pairwise population matrix, the maximum identity (0.804) was observed betweenJ. elongatum Willd and J. multiflorum (Burm. f.) Andrews, and the lowest (0.566) between J. nitidumSkan. and J. azoricum L. Molecular variance analysis displayed a genetic variation of 79% amongthe nine populations. The study was aimed to established genetic diversity in Jasminum speciesusing ISSR markers. With the help of this technique, we were able to establish immense intra- andinterspecific diversity across the Jasminum species.
Keywords: Jasminum L.; genetic diversity; ISSR; Pakistan; polymorphism
1. Introduction
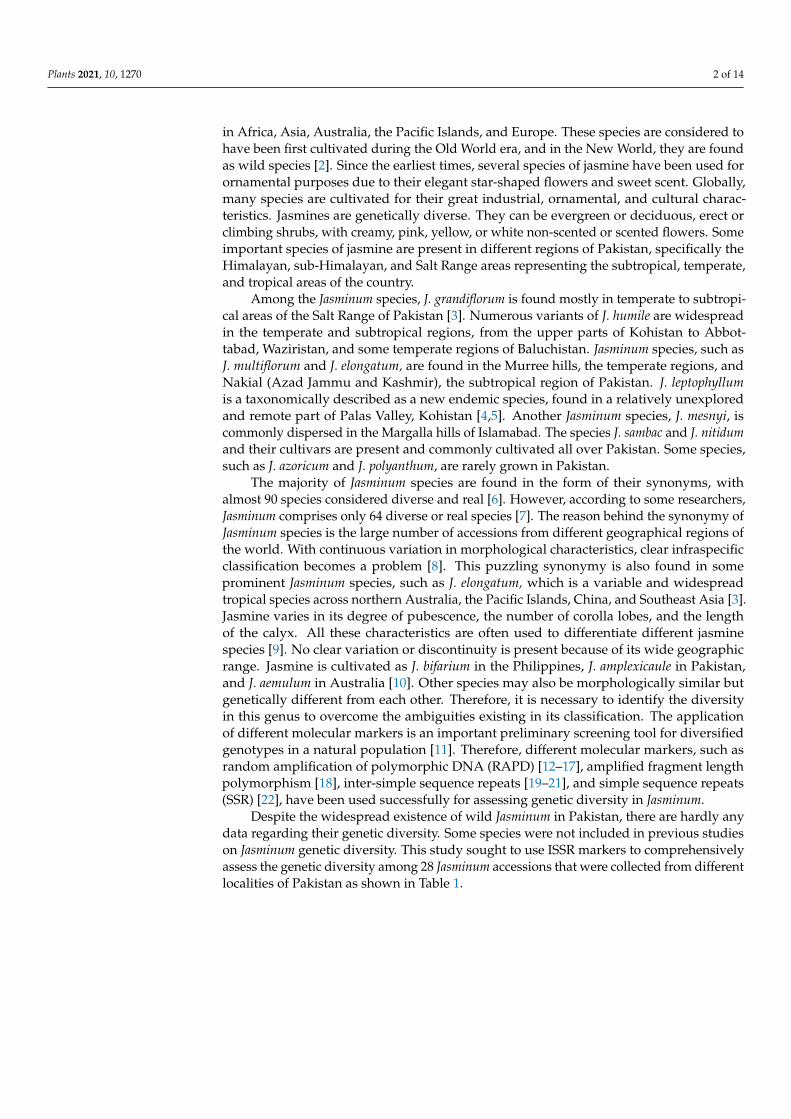
The Oleaceae family comprises 28 genera with ~900 species, wherein the genus Jas-minum L. alone comprises ~200 species [1]. Jasmine species grow in the wild in most of theworld’s tropical areas, but especially in South East Asia. Southwestern and Southeast Asiaare at the center of jasmine diversity, while a few wild species have also been documented
Plants 2021, 10, 1270. https://doi.org/10.3390/plants10071270 https://www.mdpi.com/journal/plants
Plants 2021, 10, 1270 2 of 14
in Africa, Asia, Australia, the Pacific Islands, and Europe. These species are considered tohave been first cultivated during the Old World era, and in the New World, they are foundas wild species [2]. Since the earliest times, several species of jasmine have been used forornamental purposes due to their elegant star-shaped flowers and sweet scent. Globally,many species are cultivated for their great industrial, ornamental, and cultural charac-teristics. Jasmines are genetically diverse. They can be evergreen or deciduous, erect orclimbing shrubs, with creamy, pink, yellow, or white non-scented or scented flowers. Someimportant species of jasmine are present in different regions of Pakistan, specifically theHimalayan, sub-Himalayan, and Salt Range areas representing the subtropical, temperate,and tropical areas of the country.
Among the Jasminum species, J. grandiflorum is found mostly in temperate to subtropi-cal areas of the Salt Range of Pakistan [3]. Numerous variants of J. humile are widespreadin the temperate and subtropical regions, from the upper parts of Kohistan to Abbot-tabad, Waziristan, and some temperate regions of Baluchistan. Jasminum species, such asJ. multiflorum and J. elongatum, are found in the Murree hills, the temperate regions, andNakial (Azad Jammu and Kashmir), the subtropical region of Pakistan. J. leptophyllumis a taxonomically described as a new endemic species, found in a relatively unexploredand remote part of Palas Valley, Kohistan [4,5]. Another Jasminum species, J. mesnyi, iscommonly dispersed in the Margalla hills of Islamabad. The species J. sambac and J. nitidumand their cultivars are present and commonly cultivated all over Pakistan. Some species,such as J. azoricum and J. polyanthum, are rarely grown in Pakistan.
The majority of Jasminum species are found in the form of their synonyms, withalmost 90 species considered diverse and real [6]. However, according to some researchers,Jasminum comprises only 64 diverse or real species [7]. The reason behind the synonymy ofJasminum species is the large number of accessions from different geographical regions ofthe world. With continuous variation in morphological characteristics, clear infraspecificclassification becomes a problem [8]. This puzzling synonymy is also found in someprominent Jasminum species, such as J. elongatum, which is a variable and widespreadtropical species across northern Australia, the Pacific Islands, China, and Southeast Asia [3].Jasmine varies in its degree of pubescence, the number of corolla lobes, and the lengthof the calyx. All these characteristics are often used to differentiate different jasminespecies [9]. No clear variation or discontinuity is present because of its wide geographicrange. Jasmine is cultivated as J. bifarium in the Philippines, J. amplexicaule in Pakistan,and J. aemulum in Australia [10]. Other species may also be morphologically similar butgenetically different from each other. Therefore, it is necessary to identify the diversityin this genus to overcome the ambiguities existing in its classification. The applicationof different molecular markers is an important preliminary screening tool for diversifiedgenotypes in a natural population [11]. Therefore, different molecular markers, such asrandom amplification of polymorphic DNA (RAPD) [12–17], amplified fragment lengthpolymorphism [18], inter-simple sequence repeats [19–21], and simple sequence repeats(SSR) [22], have been used successfully for assessing genetic diversity in Jasminum.
Despite the widespread existence of wild Jasminum in Pakistan, there are hardly anydata regarding their genetic diversity. Some species were not included in previous studieson Jasminum genetic diversity. This study sought to use ISSR markers to comprehensivelyassess the genetic diversity among 28 Jasminum accessions that were collected from differentlocalities of Pakistan as shown in Table 1.
Plants 2021, 10, 1270 3 of 14
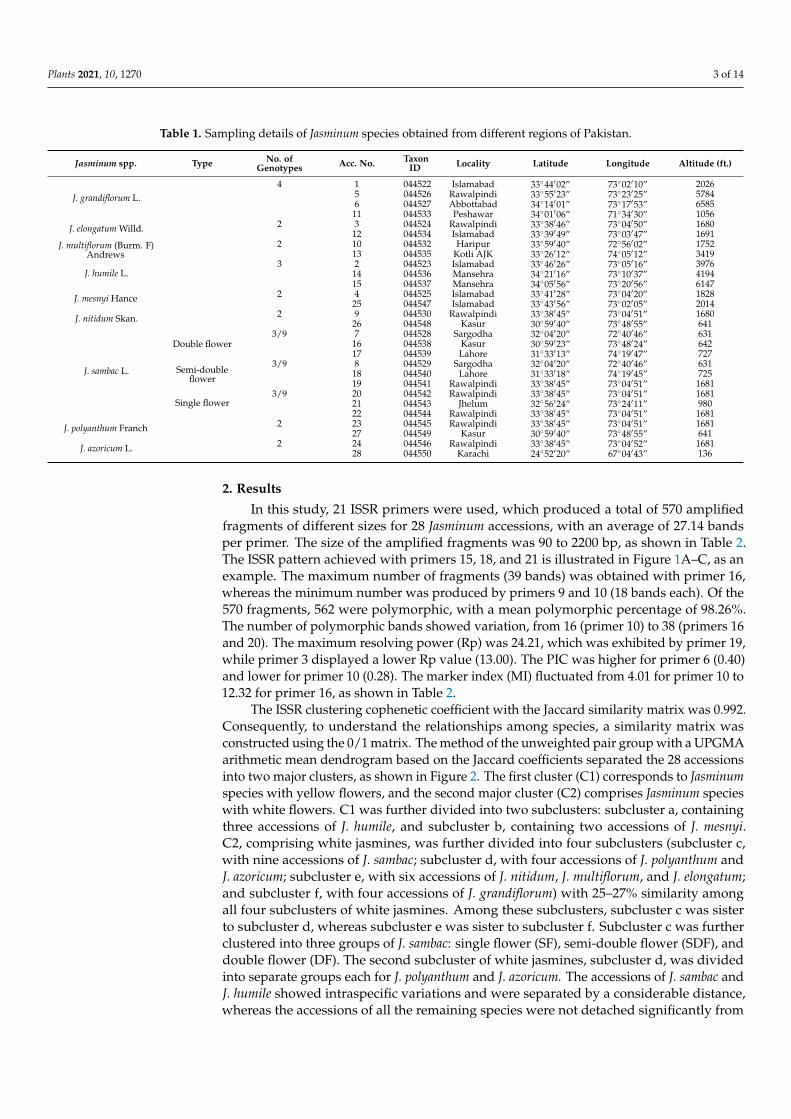
Table 1. Sampling details of Jasminum species obtained from different regions of Pakistan.
Jasminum spp. Type No. ofGenotypes Acc. No. Taxon
ID Locality Latitude Longitude Altitude (ft.)
J. grandiflorum L.4 1 044522 Islamabad 33◦44′02” 73◦02′10” 2026
5 044526 Rawalpindi 33◦55′23” 73◦23′25” 57846 044527 Abbottabad 34◦14′01” 73◦17′53” 658511 044533 Peshawar 34◦01′06” 71◦34′30” 1056
J. elongatum Willd. 2 3 044524 Rawalpindi 33◦38′46” 73◦04′50” 168012 044534 Islamabad 33◦39′49” 73◦03′47” 1691
J. multiflorum (Burm. F)Andrews
2 10 044532 Haripur 33◦59′40” 72◦56′02” 175213 044535 Kotli AJK 33◦26′12” 74◦05′12” 3419
J. humile L.3 2 044523 Islamabad 33◦46′26” 73◦05′16” 3976
14 044536 Mansehra 34◦21′16” 73◦10′37” 419415 044537 Mansehra 34◦05′56” 73◦20′56” 6147
J. mesnyi Hance 2 4 044525 Islamabad 33◦41′28” 73◦04′20” 182825 044547 Islamabad 33◦43′56” 73◦02′05” 2014
J. nitidum Skan. 2 9 044530 Rawalpindi 33◦38′45” 73◦04′51” 168026 044548 Kasur 30◦59′40” 73◦48′55” 641
J. sambac L.
Double flower3/9 7 044528 Sargodha 32◦04′20” 72◦40′46” 631
16 044538 Kasur 30◦59′23” 73◦48′24” 64217 044539 Lahore 31◦33′13” 74◦19′47” 727
Semi-doubleflower
3/9 8 044529 Sargodha 32◦04′20” 72◦40′46” 63118 044540 Lahore 31◦33′18” 74◦19′45” 72519 044541 Rawalpindi 33◦38′45” 73◦04′51” 1681
Single flower3/9 20 044542 Rawalpindi 33◦38′45” 73◦04′51” 1681
21 044543 Jhelum 32◦56′24” 73◦24′11” 98022 044544 Rawalpindi 33◦38′45” 73◦04′51” 1681
J. polyanthum Franch 2 23 044545 Rawalpindi 33◦38′45” 73◦04′51” 168127 044549 Kasur 30◦59′40” 73◦48′55” 641
J. azoricum L. 2 24 044546 Rawalpindi 33◦38′45” 73◦04′52” 168128 044550 Karachi 24◦52′20” 67◦04′43” 136
2. Results
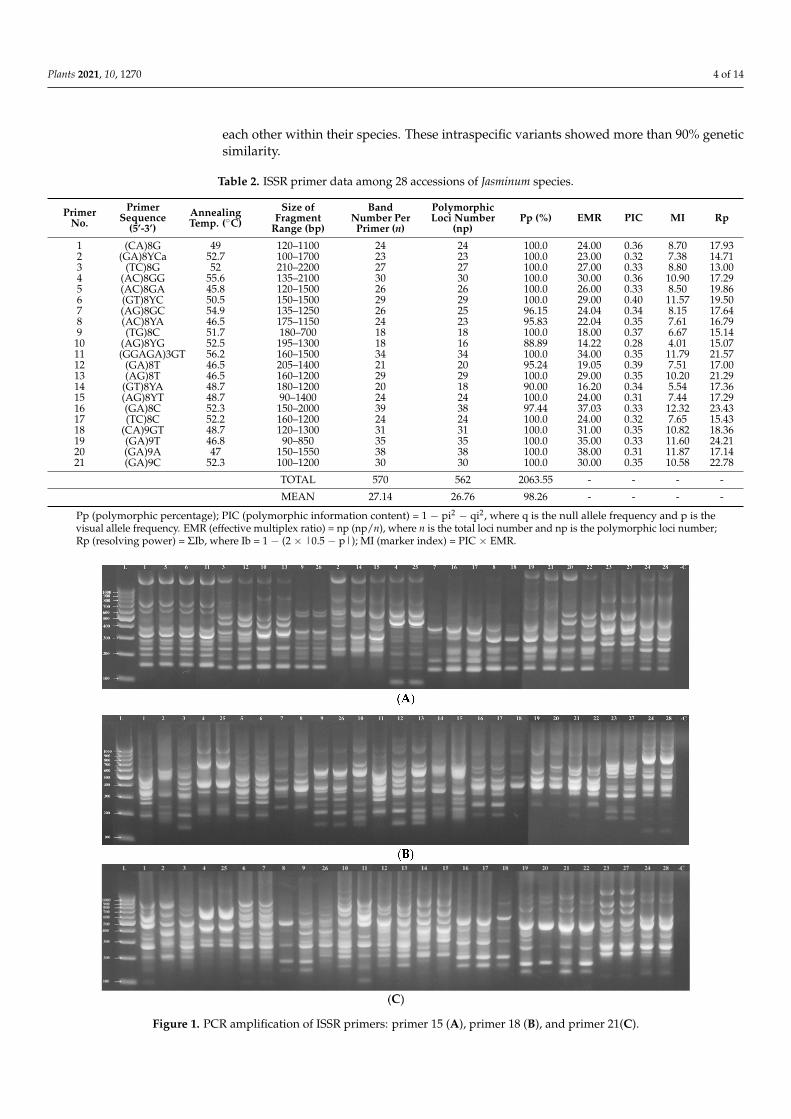
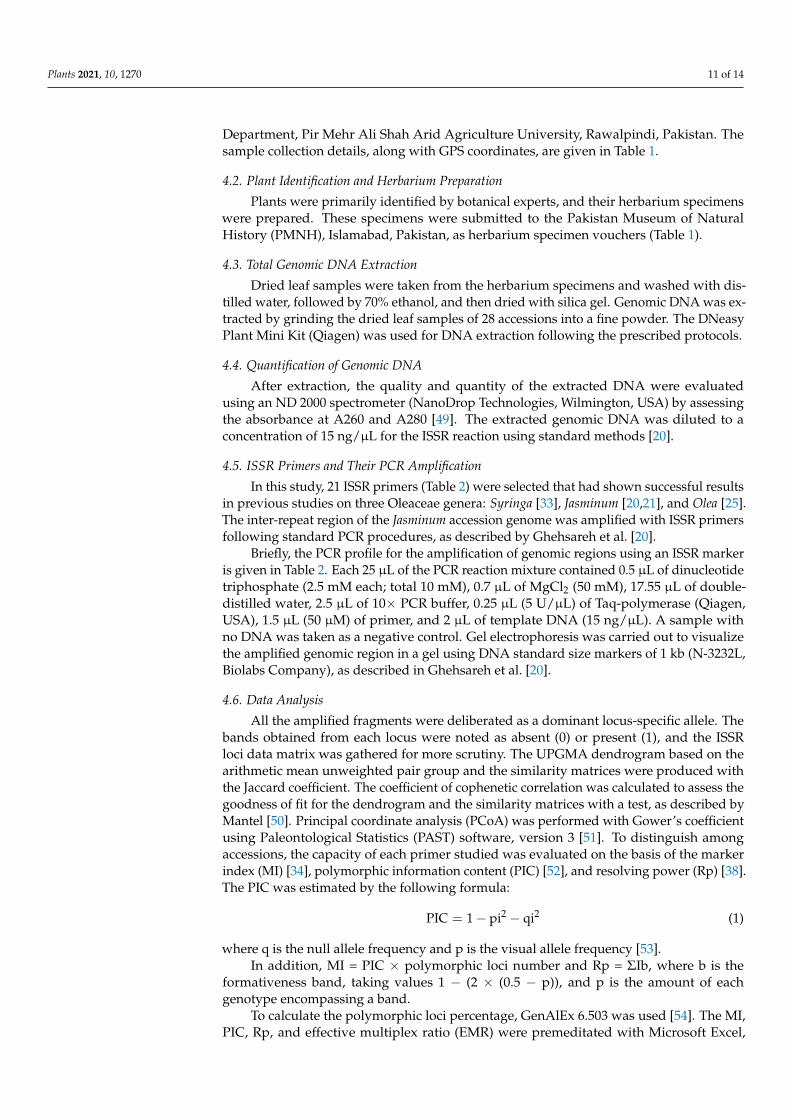
In this study, 21 ISSR primers were used, which produced a total of 570 amplifiedfragments of different sizes for 28 Jasminum accessions, with an average of 27.14 bandsper primer. The size of the amplified fragments was 90 to 2200 bp, as shown in Table 2.The ISSR pattern achieved with primers 15, 18, and 21 is illustrated in Figure 1A–C, as anexample. The maximum number of fragments (39 bands) was obtained with primer 16,whereas the minimum number was produced by primers 9 and 10 (18 bands each). Of the570 fragments, 562 were polymorphic, with a mean polymorphic percentage of 98.26%.The number of polymorphic bands showed variation, from 16 (primer 10) to 38 (primers 16and 20). The maximum resolving power (Rp) was 24.21, which was exhibited by primer 19,while primer 3 displayed a lower Rp value (13.00). The PIC was higher for primer 6 (0.40)and lower for primer 10 (0.28). The marker index (MI) fluctuated from 4.01 for primer 10 to12.32 for primer 16, as shown in Table 2.
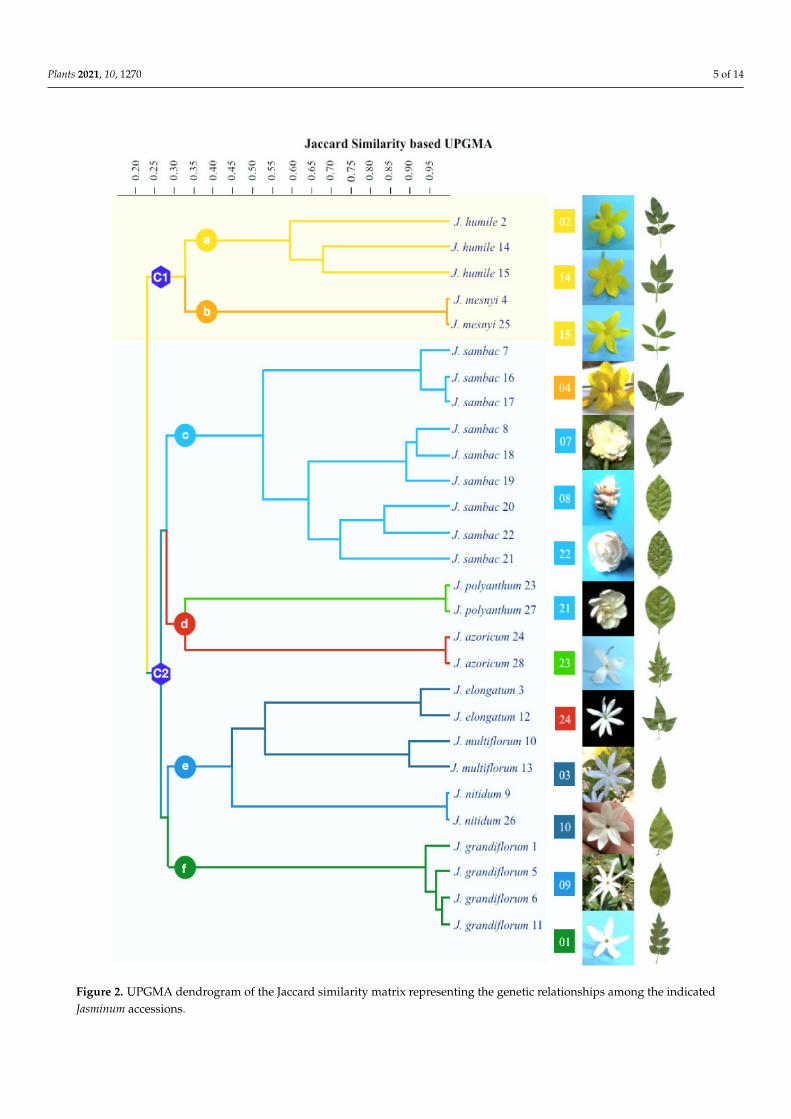
The ISSR clustering cophenetic coefficient with the Jaccard similarity matrix was 0.992.Consequently, to understand the relationships among species, a similarity matrix wasconstructed using the 0/1 matrix. The method of the unweighted pair group with a UPGMAarithmetic mean dendrogram based on the Jaccard coefficients separated the 28 accessionsinto two major clusters, as shown in Figure 2. The first cluster (C1) corresponds to Jasminumspecies with yellow flowers, and the second major cluster (C2) comprises Jasminum specieswith white flowers. C1 was further divided into two subclusters: subcluster a, containingthree accessions of J. humile, and subcluster b, containing two accessions of J. mesnyi.C2, comprising white jasmines, was further divided into four subclusters (subcluster c,with nine accessions of J. sambac; subcluster d, with four accessions of J. polyanthum andJ. azoricum; subcluster e, with six accessions of J. nitidum, J. multiflorum, and J. elongatum;and subcluster f, with four accessions of J. grandiflorum) with 25–27% similarity amongall four subclusters of white jasmines. Among these subclusters, subcluster c was sisterto subcluster d, whereas subcluster e was sister to subcluster f. Subcluster c was furtherclustered into three groups of J. sambac: single flower (SF), semi-double flower (SDF), anddouble flower (DF). The second subcluster of white jasmines, subcluster d, was dividedinto separate groups each for J. polyanthum and J. azoricum. The accessions of J. sambac andJ. humile showed intraspecific variations and were separated by a considerable distance,whereas the accessions of all the remaining species were not detached significantly from
Plants 2021, 10, 1270 4 of 14
each other within their species. These intraspecific variants showed more than 90% geneticsimilarity.
Table 2. ISSR primer data among 28 accessions of Jasminum species.
PrimerNo.
PrimerSequence
(5’-3’)AnnealingTemp. (◦C)
Size ofFragment
Range (bp)
BandNumber PerPrimer (n)
PolymorphicLoci Number
(np)Pp (%) EMR PIC MI Rp
1 (CA)8G 49 120–1100 24 24 100.0 24.00 0.36 8.70 17.932 (GA)8YCa 52.7 100–1700 23 23 100.0 23.00 0.32 7.38 14.713 (TC)8G 52 210–2200 27 27 100.0 27.00 0.33 8.80 13.004 (AC)8GG 55.6 135–2100 30 30 100.0 30.00 0.36 10.90 17.295 (AC)8GA 45.8 120–1500 26 26 100.0 26.00 0.33 8.50 19.866 (GT)8YC 50.5 150–1500 29 29 100.0 29.00 0.40 11.57 19.507 (AG)8GC 54.9 135–1250 26 25 96.15 24.04 0.34 8.15 17.648 (AC)8YA 46.5 175–1150 24 23 95.83 22.04 0.35 7.61 16.799 (TG)8C 51.7 180–700 18 18 100.0 18.00 0.37 6.67 15.14
10 (AG)8YG 52.5 195–1300 18 16 88.89 14.22 0.28 4.01 15.0711 (GGAGA)3GT 56.2 160–1500 34 34 100.0 34.00 0.35 11.79 21.5712 (GA)8T 46.5 205–1400 21 20 95.24 19.05 0.39 7.51 17.0013 (AG)8T 46.5 160–1200 29 29 100.0 29.00 0.35 10.20 21.2914 (GT)8YA 48.7 180–1200 20 18 90.00 16.20 0.34 5.54 17.3615 (AG)8YT 48.7 90–1400 24 24 100.0 24.00 0.31 7.44 17.2916 (GA)8C 52.3 150–2000 39 38 97.44 37.03 0.33 12.32 23.4317 (TC)8C 52.2 160–1200 24 24 100.0 24.00 0.32 7.65 15.4318 (CA)9GT 48.7 120–1300 31 31 100.0 31.00 0.35 10.82 18.3619 (GA)9T 46.8 90–850 35 35 100.0 35.00 0.33 11.60 24.2120 (GA)9A 47 150–1550 38 38 100.0 38.00 0.31 11.87 17.1421 (GA)9C 52.3 100–1200 30 30 100.0 30.00 0.35 10.58 22.78
TOTAL 570 562 2063.55 - - - -
MEAN 27.14 26.76 98.26 - - - -
Pp (polymorphic percentage); PIC (polymorphic information content) = 1 − pi2 − qi2, where q is the null allele frequency and p is thevisual allele frequency. EMR (effective multiplex ratio) = np (np/n), where n is the total loci number and np is the polymorphic loci number;Rp (resolving power) = ΣIb, where Ib = 1 − (2 × |0.5 − p|); MI (marker index) = PIC × EMR.
Figure 1. PCR amplification of ISSR primers: primer 15 (A), primer 18 (B), and primer 21(C).
Plants 2021, 10, 1270 5 of 14
Figure 2. UPGMA dendrogram of the Jaccard similarity matrix representing the genetic relationships among the indicatedJasminum accessions.

Plants 2021, 10, 1270 6 of 14
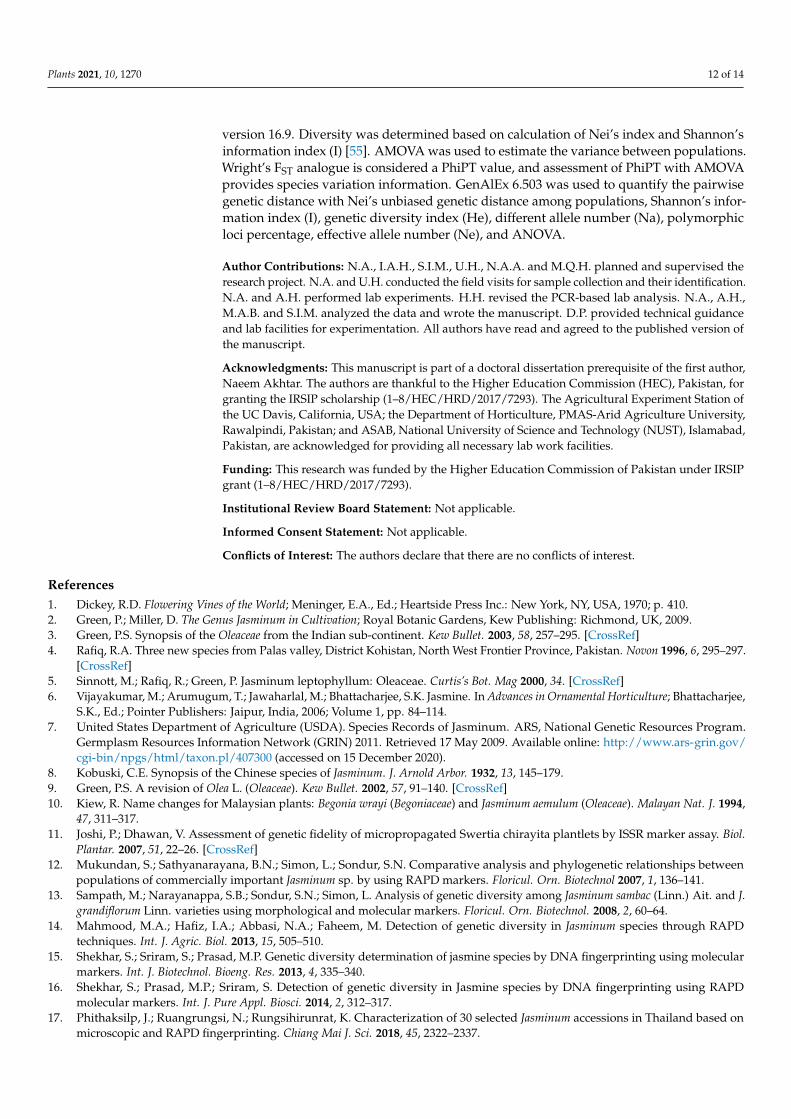
In addition, using Gower’s coefficient, PCoA was performed based on the geneticdistance matrix to better visualize the genetic diversity of the studied Jasminum species. Thethree principal axes showed 27.02%, 18.43%, and 16.26% of the genetic variance, with a totalof 61.71%. The PCoA biplot (Figure 3A) separated three subclusters, c, d, and e. Similarly,the PCoA biplot (Figure 3B) produced clearly separated major clusters, comprising yellowjasmines (subclusters a and b) and a white-flowered subcluster f. Therefore, by using threecoordinates in this way, we were able to place all accessions into five distinct groups: foursubclusters of white jasmines and one cluster of yellow jasmines (encircled).
Figure 3. ISSR-data-based PCoA biplot of the genetic distance matrix in the studied species ofJasminum: (A) (PC1 vs. PC2) and (B) (PC1 vs. PC3). The color and shapes represented the species as J.sambac (�, blue), J. polyanthum (F, green), J. azoricum (
Plants 2021, 10, x FOR PEER REVIEW 8 of 16
(B)
Figure 3. ISSR‐data‐based PCoA biplot of the genetic distance matrix in the studied species of Jasminum: (A) (PC1 vs. PC2)
and (B) (PC1 vs. PC3). The color and shapes represented the species as J. sambac (■, blue), J. polyanthum (★, green), J. azoricum ✪ red), J. grandiflorum (●, green), J. nitidum (▼, blue), J. elongatum ⬟ blue), J. multiflorum (♦ , blue), J. mesnyi (▲, orange) and J. humile (▲, yellow).
Population analysis showed diversity at the species level in only J. humile and J. sam‐
bac. The other species have a small population size, and there was no increase in the num‐
ber of species defined in this study due to negligible morphological differences among the
accessions, with the exception of a few that had considerable variation. The population
analysis was performed due to the wider diversity in the floral morphologies of J. humile
and J. sambac. The data regarding these species demonstrate the greatest intraspecific di‐
versity of the studied species based on the highest values for polymorphic percentage,
number of effective alleles, Nei’s genetic diversity, Nei’s unbiased diversity, and Shan‐
non’s information index. The lowest values for the above‐described population parame‐
ters were identified for both J. mesnyi and J. nitidum (Table 3).
Based on Nei’s unbiased genetic identity and pairwise population matrix at the spe‐
cies level, the highest identity (0.804) was observed between J. multiflorum and J. elonga‐
tum. However, a lower identity (0.575) was noticed between J. mesnyi and J. polyanthum
(Table 4).
The values of PhiPT were statistically significant (p = 0.001), indicating additional
association based on interspecies variation. The genetic variation in the nine populations
recorded was 79% (PhiPT = 0.787), as shown in Table 5.
Table 3. Polymorphic loci percentage, sample size, effective allele number, different allele number, Shannon’s information
index, and Nei’s genetic diversity of the studied Jasminum populations (SE and mean over the loci for each population).
Pop. N Na Ne I He uHe P%
J. grandiflorum 4 0.414 (0.023) 1.017 (0.005) 0.016 (0.004) 0.010 (0.003) 0.012 (0.003) 3.16%
J. elongatum 2 0.368 (0.022) 1.017 (0.005) 0.015 (0.004) 0.010 (0.003) 0.014 (0.004) 2.46%
, red), J. grandiflorum (•, green), J. nitidum (H,blue), J. elongatum (
Plants 2021, 10, x FOR PEER REVIEW 8 of 16
(B)
Figure 3. ISSR‐data‐based PCoA biplot of the genetic distance matrix in the studied species of Jasminum: (A) (PC1 vs. PC2)
and (B) (PC1 vs. PC3). The color and shapes represented the species as J. sambac (■, blue), J. polyanthum (★, green), J. azoricum ✪ red), J. grandiflorum (●, green), J. nitidum (▼, blue), J. elongatum ⬟ blue), J. multiflorum (♦ , blue), J. mesnyi (▲, orange) and J. humile (▲, yellow).
Population analysis showed diversity at the species level in only J. humile and J. sam‐
bac. The other species have a small population size, and there was no increase in the num‐
ber of species defined in this study due to negligible morphological differences among the
accessions, with the exception of a few that had considerable variation. The population
analysis was performed due to the wider diversity in the floral morphologies of J. humile
and J. sambac. The data regarding these species demonstrate the greatest intraspecific di‐
versity of the studied species based on the highest values for polymorphic percentage,
number of effective alleles, Nei’s genetic diversity, Nei’s unbiased diversity, and Shan‐
non’s information index. The lowest values for the above‐described population parame‐
ters were identified for both J. mesnyi and J. nitidum (Table 3).
Based on Nei’s unbiased genetic identity and pairwise population matrix at the spe‐
cies level, the highest identity (0.804) was observed between J. multiflorum and J. elonga‐
tum. However, a lower identity (0.575) was noticed between J. mesnyi and J. polyanthum
(Table 4).
The values of PhiPT were statistically significant (p = 0.001), indicating additional
association based on interspecies variation. The genetic variation in the nine populations
recorded was 79% (PhiPT = 0.787), as shown in Table 5.
Table 3. Polymorphic loci percentage, sample size, effective allele number, different allele number, Shannon’s information
index, and Nei’s genetic diversity of the studied Jasminum populations (SE and mean over the loci for each population).
Pop. N Na Ne I He uHe P%
J. grandiflorum 4 0.414 (0.023) 1.017 (0.005) 0.016 (0.004) 0.010 (0.003) 0.012 (0.003) 3.16%
J. elongatum 2 0.368 (0.022) 1.017 (0.005) 0.015 (0.004) 0.010 (0.003) 0.014 (0.004) 2.46%
, blue), J. multiflorum (�, blue), J. mesnyi (N, orange) and J. humile (N, yellow).
Plants 2021, 10, 1270 7 of 14
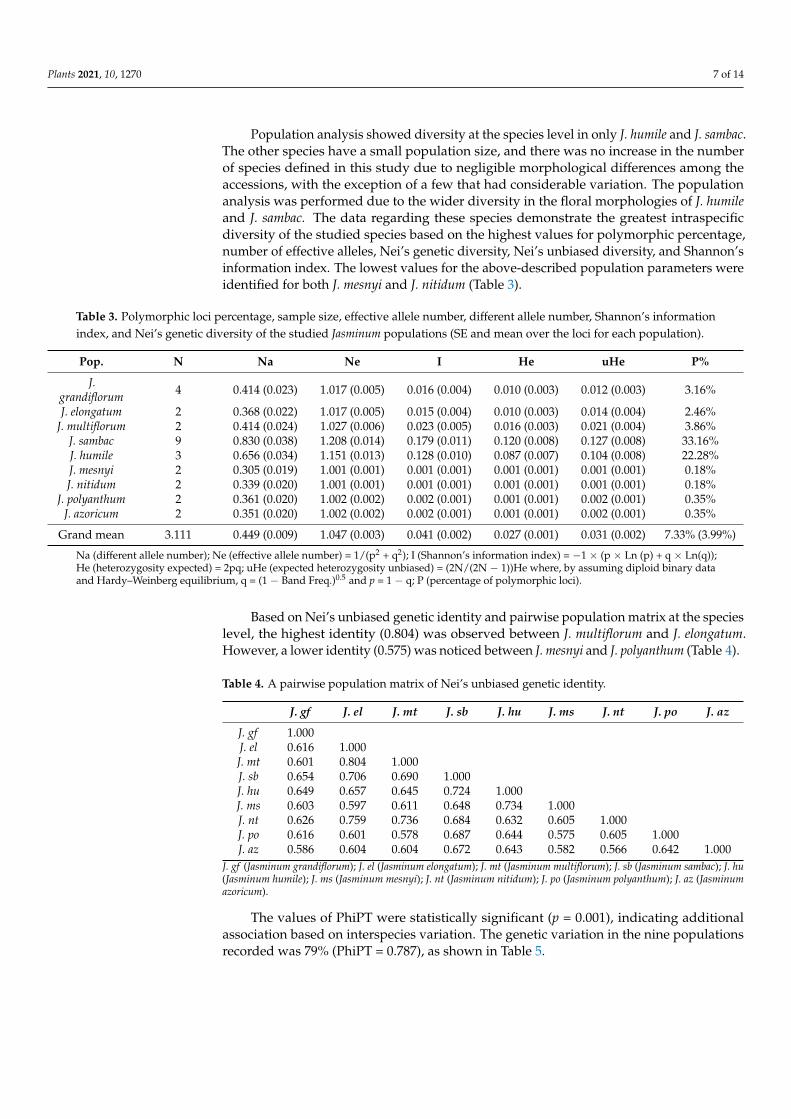
Population analysis showed diversity at the species level in only J. humile and J. sambac.The other species have a small population size, and there was no increase in the numberof species defined in this study due to negligible morphological differences among theaccessions, with the exception of a few that had considerable variation. The populationanalysis was performed due to the wider diversity in the floral morphologies of J. humileand J. sambac. The data regarding these species demonstrate the greatest intraspecificdiversity of the studied species based on the highest values for polymorphic percentage,number of effective alleles, Nei’s genetic diversity, Nei’s unbiased diversity, and Shannon’sinformation index. The lowest values for the above-described population parameters wereidentified for both J. mesnyi and J. nitidum (Table 3).
Table 3. Polymorphic loci percentage, sample size, effective allele number, different allele number, Shannon’s informationindex, and Nei’s genetic diversity of the studied Jasminum populations (SE and mean over the loci for each population).
Pop. N Na Ne I He uHe P%
J.grandiflorum 4 0.414 (0.023) 1.017 (0.005) 0.016 (0.004) 0.010 (0.003) 0.012 (0.003) 3.16%
J. elongatum 2 0.368 (0.022) 1.017 (0.005) 0.015 (0.004) 0.010 (0.003) 0.014 (0.004) 2.46%J. multiflorum 2 0.414 (0.024) 1.027 (0.006) 0.023 (0.005) 0.016 (0.003) 0.021 (0.004) 3.86%
J. sambac 9 0.830 (0.038) 1.208 (0.014) 0.179 (0.011) 0.120 (0.008) 0.127 (0.008) 33.16%J. humile 3 0.656 (0.034) 1.151 (0.013) 0.128 (0.010) 0.087 (0.007) 0.104 (0.008) 22.28%J. mesnyi 2 0.305 (0.019) 1.001 (0.001) 0.001 (0.001) 0.001 (0.001) 0.001 (0.001) 0.18%J. nitidum 2 0.339 (0.020) 1.001 (0.001) 0.001 (0.001) 0.001 (0.001) 0.001 (0.001) 0.18%
J. polyanthum 2 0.361 (0.020) 1.002 (0.002) 0.002 (0.001) 0.001 (0.001) 0.002 (0.001) 0.35%J. azoricum 2 0.351 (0.020) 1.002 (0.002) 0.002 (0.001) 0.001 (0.001) 0.002 (0.001) 0.35%
Grand mean 3.111 0.449 (0.009) 1.047 (0.003) 0.041 (0.002) 0.027 (0.001) 0.031 (0.002) 7.33% (3.99%)
Na (different allele number); Ne (effective allele number) = 1/(p2 + q2); I (Shannon’s information index) = −1 × (p × Ln (p) + q × Ln(q));He (heterozygosity expected) = 2pq; uHe (expected heterozygosity unbiased) = (2N/(2N − 1))He where, by assuming diploid binary dataand Hardy–Weinberg equilibrium, q = (1 − Band Freq.)0.5 and p = 1 − q; P (percentage of polymorphic loci).
Based on Nei’s unbiased genetic identity and pairwise population matrix at the specieslevel, the highest identity (0.804) was observed between J. multiflorum and J. elongatum.However, a lower identity (0.575) was noticed between J. mesnyi and J. polyanthum (Table 4).
Table 4. A pairwise population matrix of Nei’s unbiased genetic identity.
J. gf J. el J. mt J. sb J. hu J. ms J. nt J. po J. az
J. gf 1.000J. el 0.616 1.000J. mt 0.601 0.804 1.000J. sb 0.654 0.706 0.690 1.000J. hu 0.649 0.657 0.645 0.724 1.000J. ms 0.603 0.597 0.611 0.648 0.734 1.000J. nt 0.626 0.759 0.736 0.684 0.632 0.605 1.000J. po 0.616 0.601 0.578 0.687 0.644 0.575 0.605 1.000J. az 0.586 0.604 0.604 0.672 0.643 0.582 0.566 0.642 1.000
J. gf (Jasminum grandiflorum); J. el (Jasminum elongatum); J. mt (Jasminum multiflorum); J. sb (Jasminum sambac); J. hu(Jasminum humile); J. ms (Jasminum mesnyi); J. nt (Jasminum nitidum); J. po (Jasminum polyanthum); J. az (Jasminumazoricum).
The values of PhiPT were statistically significant (p = 0.001), indicating additionalassociation based on interspecies variation. The genetic variation in the nine populationsrecorded was 79% (PhiPT = 0.787), as shown in Table 5.

Plants 2021, 10, 1270 8 of 14
Table 5. AMOVA summary for Jasminum accessions.
Source df SS MS Est. var. %
Among pop. 8 2267.313 283.414 88.829 79%Within pop. 19 457.222 24.064 24.064 21%
Total 27 2724.536 112.894 100%PhiPT 0.787 P (rand ≥ data) 0.001
Probability, P (rand >= data), for PhiPT is on the basis of the standard permutation across the complete dataset; PhiPT = AP/(WP + AP) = AP/TOT, where WP is the estimated variance within populations and AP is theestimated variance among populations.
3. Discussion
Given that Jasminum is a large and diverse genus in the Oleaceae family, the delimita-tion of its diversity and species must be carried out carefully. In addition, the usefulness oftaxonomy-based classification into different sections needs to be determined. The widegeographic distribution of the genus produces continuous variations in its characteristics,which creates difficulties in the delimitation of genotypes in terms of their intraspecificand interspecific boundaries. Jasminum is divided into five sections, Jasminum, Unifoli-olata, Trifoliolata, Primulina, and Alternifolia, based on flower color, leaf shape, and leafarrangement. Representatives from each section were included in this study to identifytheir relationships. A diversity analysis of Jasminum was also performed on the collectedvariants using ISSR markers, which showed the intraspecific and interspecific variationsand the relationship among the sections. Many studies have validated the use of ISSRmarkers for genomic characterization in the Oleaceae family [23–26] and many other plants,such as Batrachium [27], Pistacia [28], and Aerva [29].
In this study, we found higher polymorphism levels in the investigated Jasminumaccessions, with values of 88.89–100% and a mean of 98.26%, as shown in Table 2. Similarly,Ghehsareh et al. [20] investigated 53 Jasminum accessions from Iran using 21 ISSR markersand evaluated their genetic diversity with high polymorphism (90.64%). Yohanan et al. [21]used 10 primers for genetic diversity evaluation within 40 accessions of 23 Jasminumspecies from India, with 100% polymorphism [21]. In addition, Nirmala et al. [18] as-sessed the genetic similarities among 48 accessions of 26 Jasminum species using 10 AFLPmarkers, of which four displayed 90.5% polymorphism. Qiu et al. [19] used 10 ISSRprimers and reported genetic diversity among 30 accessions of J. sambac. Li and Zhang [22]used microsatellite markers to analyze J. sambac wild germplasm recourses, where sixdisplayed polymorphisms and seven displayed fixed heterozygosity with two alleles.Phithaksilp et al. [17] validated the phylogenetic relationship between 30 genotypes ofJasminum with 10 RAPD markers with an overall polymorphism of 71.43%. These studieshave shown a high degree of polymorphism with higher levels of genetic diversity in Jas-minum by using different molecular markers. Furthermore, Raja [30] detected somaclonalvariation in J. auriculatum using RAPD. Zietkiewicz et al. [31] established ISSR analysisto study diversity among plant species. This method overcomes some of the limitationsfaced when using other DNA markers. ISSR markers can provide more reliable and re-producible results for polymorphism due to their higher primer lengths and annealingtemperatures [32]. The primers used in our study were previously used in other genera ofthe Oleaceae family, including Syringa [33] and Olea [26], for which high polymorphismpercentages (92.37% and 93.42%) were found.
The values for PIC of the markers were recorded in the range of 0.31–0.40, as shownin Table 2. The PIC depends on the detectable allele number, and its frequency distributionis equal to the gene diversity. The markers that were equally distributed in the populationhad a higher PIC, which remained up to 0.5 in the dominant markers. The EMR was14.22–38.00 among the 28 Jasminum accessions. Ghehsareh et al. [20] also found EMR valuesof 25.93–48.08 using the same primers in Jasminum accessions from Iran. The higher EMRsshow the effectiveness of the marker system for diversity-focused studies [34,35]. Thevalues for marker index (MI) (4.06–12.32) are in accordance with the outcomes of Ghehsarehet al. [20]. The MI is used to calculate the complete effectiveness of marker systems, and a
Plants 2021, 10, 1270 9 of 14
higher value is always associated with better effectiveness of the procedure [34–36]. TheRp observed ranged between 13.00 and 24.21. A primer’s ability to differentiate amonghigher genotype numbers can be represented by the Rp [37,38]. According to Prevostand Wilkinson [36], the Rp is a tool to measure a primer’s capacity to differentiate amongaccessions. Primers with higher Rp values normally show improved performance indifferentiating between genotypes.
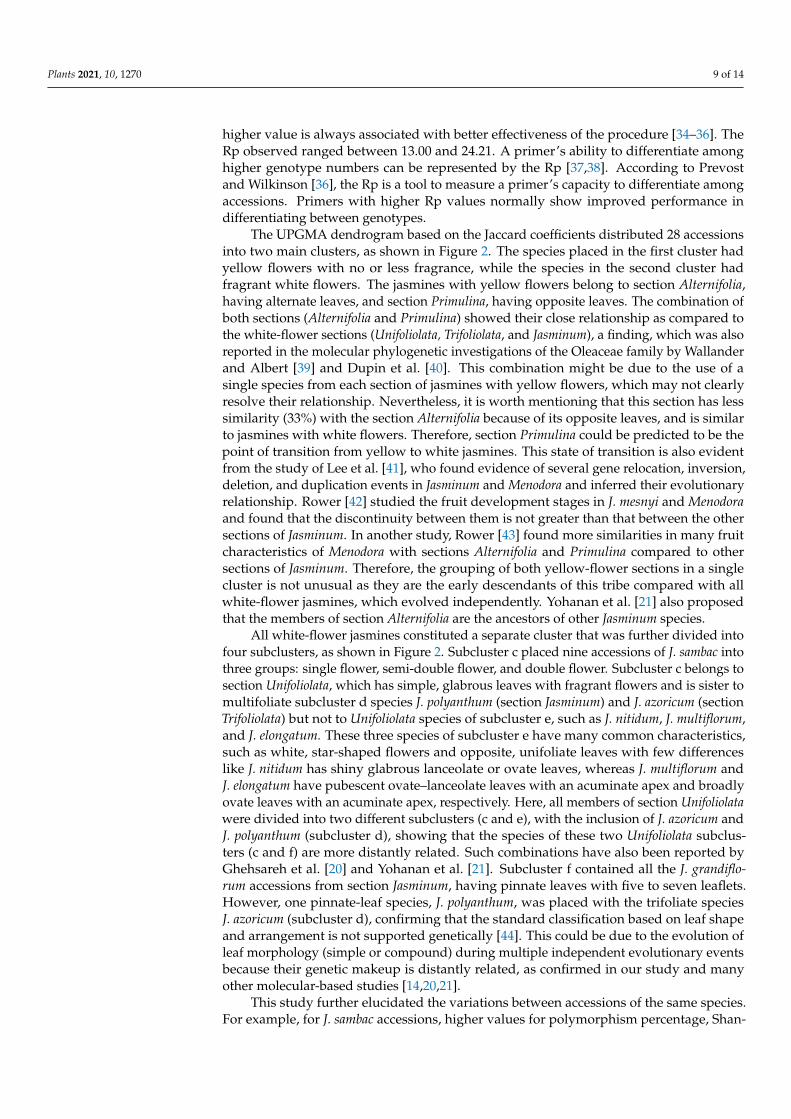
The UPGMA dendrogram based on the Jaccard coefficients distributed 28 accessionsinto two main clusters, as shown in Figure 2. The species placed in the first cluster hadyellow flowers with no or less fragrance, while the species in the second cluster hadfragrant white flowers. The jasmines with yellow flowers belong to section Alternifolia,having alternate leaves, and section Primulina, having opposite leaves. The combination ofboth sections (Alternifolia and Primulina) showed their close relationship as compared tothe white-flower sections (Unifoliolata, Trifoliolata, and Jasminum), a finding, which was alsoreported in the molecular phylogenetic investigations of the Oleaceae family by Wallanderand Albert [39] and Dupin et al. [40]. This combination might be due to the use of asingle species from each section of jasmines with yellow flowers, which may not clearlyresolve their relationship. Nevertheless, it is worth mentioning that this section has lesssimilarity (33%) with the section Alternifolia because of its opposite leaves, and is similarto jasmines with white flowers. Therefore, section Primulina could be predicted to be thepoint of transition from yellow to white jasmines. This state of transition is also evidentfrom the study of Lee et al. [41], who found evidence of several gene relocation, inversion,deletion, and duplication events in Jasminum and Menodora and inferred their evolutionaryrelationship. Rower [42] studied the fruit development stages in J. mesnyi and Menodoraand found that the discontinuity between them is not greater than that between the othersections of Jasminum. In another study, Rower [43] found more similarities in many fruitcharacteristics of Menodora with sections Alternifolia and Primulina compared to othersections of Jasminum. Therefore, the grouping of both yellow-flower sections in a singlecluster is not unusual as they are the early descendants of this tribe compared with allwhite-flower jasmines, which evolved independently. Yohanan et al. [21] also proposedthat the members of section Alternifolia are the ancestors of other Jasminum species.
All white-flower jasmines constituted a separate cluster that was further divided intofour subclusters, as shown in Figure 2. Subcluster c placed nine accessions of J. sambac intothree groups: single flower, semi-double flower, and double flower. Subcluster c belongs tosection Unifoliolata, which has simple, glabrous leaves with fragrant flowers and is sister tomultifoliate subcluster d species J. polyanthum (section Jasminum) and J. azoricum (sectionTrifoliolata) but not to Unifoliolata species of subcluster e, such as J. nitidum, J. multiflorum,and J. elongatum. These three species of subcluster e have many common characteristics,such as white, star-shaped flowers and opposite, unifoliate leaves with few differenceslike J. nitidum has shiny glabrous lanceolate or ovate leaves, whereas J. multiflorum andJ. elongatum have pubescent ovate–lanceolate leaves with an acuminate apex and broadlyovate leaves with an acuminate apex, respectively. Here, all members of section Unifoliolatawere divided into two different subclusters (c and e), with the inclusion of J. azoricum andJ. polyanthum (subcluster d), showing that the species of these two Unifoliolata subclus-ters (c and f) are more distantly related. Such combinations have also been reported byGhehsareh et al. [20] and Yohanan et al. [21]. Subcluster f contained all the J. grandiflo-rum accessions from section Jasminum, having pinnate leaves with five to seven leaflets.However, one pinnate-leaf species, J. polyanthum, was placed with the trifoliate speciesJ. azoricum (subcluster d), confirming that the standard classification based on leaf shapeand arrangement is not supported genetically [44]. This could be due to the evolution ofleaf morphology (simple or compound) during multiple independent evolutionary eventsbecause their genetic makeup is distantly related, as confirmed in our study and manyother molecular-based studies [14,20,21].
This study further elucidated the variations between accessions of the same species.For example, for J. sambac accessions, higher values for polymorphism percentage, Shan-

Plants 2021, 10, 1270 10 of 14
non’s information index, Nei’s genetic diversity, effective allele number, and unbiased Nei’sgenetic diversity were found, due to greater variation. The nine accessions of J. sambacclearly resolved into three groups: single flower, semi-double flower, and double flower.This grouping of J. sambac is in complete agreement with the findings of Ghehsareh et al.for Iranian jasmine species [20]. Similarly, J. humile showed the second-most genetic diver-sity based on greater variation among its accessions. Maximum genetic identities weredisplayed among J. elongatum and J. multiflorum due to similarities in most of their character-istics, for example, growth habit, pubescence ovate–lanceolate to broadly ovate leaves withan acuminate apex, and star-shaped flowers with narrowly lanceolate to elliptic corollalobes. The accessions of other species, namely J. grandiflorum, J. multiflorum, J. elongatum,J. nitidum, J. polyanthum, and J. azoricum, did not show the considerable intraspecific vari-ation. All these species showed higher intraspecific similarities among their accessions,which could be due to asexual propagation of cultivated species and a lower number ofnaturally found wild accessions in this study.
The PCoA based on genetic distance matrix differentiated the species and their variantswith better accuracy. These PCoA results correspond highly with the UPGMA clusteringand the first three axes explained 61.71% of the genetic variance. In previous studies, disty-lous morph-specific patterns were observed in J. fruticans [45,46] and J. odoratissimum [47].The variation in floral morphology particularly lays the foundation for divergence of thespecies [45,47,48]. In this study, the accessions of J. humile (2, 14, and 15) were far apartfrom each other and collected from regions where they grow in the wild, and such morph-specific patterns were also observed in these accessions, which could be the reason for theirgenetic variation.
The analysis of molecular variance (AMOVA) performed for all Jasminum accessionsshowed statistically significant PhiPT values (p = 0.001), supporting the interspecific varia-tion that is more likely because of the utilization of different species as populations.
Conclusively, the genetic variations within the genus Jasminum was assessed by us-ing the ISSR molecular marker system. The results provide a preliminary indication ofgenetic diversity among Jasminum accessions from Pakistan. The computed results showthe close identity between J. multiflorum and J. elongatum. The outcomes further presentan augmented distance between the accessions of J. humile, which are characterized bydistylous morph-specific pattern. Similarly, the accessions of J. sambac were transformedinto three groups according to their single-, semi-double-, and double-flowering nature.On a broader spectrum, the white and yellow jasmines were clearly separated, with theindication of character evolution from yellow to white flowering, along with multiple andindependent evolution of sections Unifoliolata and Jasminum. These multiple and indepen-dent evolutionary events show that the classification into diverse sections on the basis ofleaf morphology, leaf arrangement, and flower color is not supported genetically, whereasthese sections are paraphyletic. Therefore, our study provides preliminary informationregarding the intraspecific and interspecific diversity in Jasminum and a baseline databaseto assist biologists and taxonomists in species delimitation. The findings will help inphylogenetic-based studies of this genus, particularly in resolving existing ambiguities inits classification.
4. Materials and Methods4.1. Sampling of Plants
The experimental work was performed in Prof. Daniel Potters Laboratory, Collegeof Agriculture and Environmental Sciences, UC Davis, USA. Field surveys were con-ducted in summer, and 28 Jasminum accessions, representing nine species (J. grandiflorum(4 genotypes), J. azoricum (2 genotypes), J. multiflorum (2 genotypes), J. humile (3 genotypes),J. elongatum (2 genotypes), J. mesnyi Hance. (2 genotypes), J. nitidum (2 genotypes), J. polyan-thum (2 genotypes), and J. sambac (9 genotypes; 3 semi-double-flower, 3 double-flower,and 3 single-flower types)) (Table 1) were collected from diverse regions of Pakistan. Thewild and cultivated Jasminum accession germplasm was established in the Horticulture
Plants 2021, 10, 1270 11 of 14
Department, Pir Mehr Ali Shah Arid Agriculture University, Rawalpindi, Pakistan. Thesample collection details, along with GPS coordinates, are given in Table 1.
4.2. Plant Identification and Herbarium Preparation
Plants were primarily identified by botanical experts, and their herbarium specimenswere prepared. These specimens were submitted to the Pakistan Museum of NaturalHistory (PMNH), Islamabad, Pakistan, as herbarium specimen vouchers (Table 1).
4.3. Total Genomic DNA Extraction
Dried leaf samples were taken from the herbarium specimens and washed with dis-tilled water, followed by 70% ethanol, and then dried with silica gel. Genomic DNA was ex-tracted by grinding the dried leaf samples of 28 accessions into a fine powder. The DNeasyPlant Mini Kit (Qiagen) was used for DNA extraction following the prescribed protocols.
4.4. Quantification of Genomic DNA
After extraction, the quality and quantity of the extracted DNA were evaluatedusing an ND 2000 spectrometer (NanoDrop Technologies, Wilmington, USA) by assessingthe absorbance at A260 and A280 [49]. The extracted genomic DNA was diluted to aconcentration of 15 ng/µL for the ISSR reaction using standard methods [20].
4.5. ISSR Primers and Their PCR Amplification
In this study, 21 ISSR primers (Table 2) were selected that had shown successful resultsin previous studies on three Oleaceae genera: Syringa [33], Jasminum [20,21], and Olea [25].The inter-repeat region of the Jasminum accession genome was amplified with ISSR primersfollowing standard PCR procedures, as described by Ghehsareh et al. [20].
Briefly, the PCR profile for the amplification of genomic regions using an ISSR markeris given in Table 2. Each 25 µL of the PCR reaction mixture contained 0.5 µL of dinucleotidetriphosphate (2.5 mM each; total 10 mM), 0.7 µL of MgCl2 (50 mM), 17.55 µL of double-distilled water, 2.5 µL of 10× PCR buffer, 0.25 µL (5 U/µL) of Taq-polymerase (Qiagen,USA), 1.5 µL (50 µM) of primer, and 2 µL of template DNA (15 ng/µL). A sample withno DNA was taken as a negative control. Gel electrophoresis was carried out to visualizethe amplified genomic region in a gel using DNA standard size markers of 1 kb (N-3232L,Biolabs Company), as described in Ghehsareh et al. [20].
4.6. Data Analysis
All the amplified fragments were deliberated as a dominant locus-specific allele. Thebands obtained from each locus were noted as absent (0) or present (1), and the ISSRloci data matrix was gathered for more scrutiny. The UPGMA dendrogram based on thearithmetic mean unweighted pair group and the similarity matrices were produced withthe Jaccard coefficient. The coefficient of cophenetic correlation was calculated to assess thegoodness of fit for the dendrogram and the similarity matrices with a test, as described byMantel [50]. Principal coordinate analysis (PCoA) was performed with Gower’s coefficientusing Paleontological Statistics (PAST) software, version 3 [51]. To distinguish amongaccessions, the capacity of each primer studied was evaluated on the basis of the markerindex (MI) [34], polymorphic information content (PIC) [52], and resolving power (Rp) [38].The PIC was estimated by the following formula:
PIC = 1− pi2 − qi2 (1)
where q is the null allele frequency and p is the visual allele frequency [53].In addition, MI = PIC × polymorphic loci number and Rp = ΣIb, where b is the
formativeness band, taking values 1 − (2 × (0.5 − p)), and p is the amount of eachgenotype encompassing a band.
To calculate the polymorphic loci percentage, GenAlEx 6.503 was used [54]. The MI,PIC, Rp, and effective multiplex ratio (EMR) were premeditated with Microsoft Excel,
Plants 2021, 10, 1270 12 of 14
version 16.9. Diversity was determined based on calculation of Nei’s index and Shannon’sinformation index (I) [55]. AMOVA was used to estimate the variance between populations.Wright’s FST analogue is considered a PhiPT value, and assessment of PhiPT with AMOVAprovides species variation information. GenAlEx 6.503 was used to quantify the pairwisegenetic distance with Nei’s unbiased genetic distance among populations, Shannon’s infor-mation index (I), genetic diversity index (He), different allele number (Na), polymorphicloci percentage, effective allele number (Ne), and ANOVA.
Author Contributions: N.A., I.A.H., S.I.M., U.H., N.A.A. and M.Q.H. planned and supervised theresearch project. N.A. and U.H. conducted the field visits for sample collection and their identification.N.A. and A.H. performed lab experiments. H.H. revised the PCR-based lab analysis. N.A., A.H.,M.A.B. and S.I.M. analyzed the data and wrote the manuscript. D.P. provided technical guidanceand lab facilities for experimentation. All authors have read and agreed to the published version ofthe manuscript.
Acknowledgments: This manuscript is part of a doctoral dissertation prerequisite of the first author,Naeem Akhtar. The authors are thankful to the Higher Education Commission (HEC), Pakistan, forgranting the IRSIP scholarship (1–8/HEC/HRD/2017/7293). The Agricultural Experiment Station ofthe UC Davis, California, USA; the Department of Horticulture, PMAS-Arid Agriculture University,Rawalpindi, Pakistan; and ASAB, National University of Science and Technology (NUST), Islamabad,Pakistan, are acknowledged for providing all necessary lab work facilities.
Funding: This research was funded by the Higher Education Commission of Pakistan under IRSIPgrant (1–8/HEC/HRD/2017/7293).
Institutional Review Board Statement: Not applicable.
Informed Consent Statement: Not applicable.
Conflicts of Interest: The authors declare that there are no conflicts of interest.
References1. Dickey, R.D. Flowering Vines of the World; Meninger, E.A., Ed.; Heartside Press Inc.: New York, NY, USA, 1970; p. 410.2. Green, P.; Miller, D. The Genus Jasminum in Cultivation; Royal Botanic Gardens, Kew Publishing: Richmond, UK, 2009.3. Green, P.S. Synopsis of the Oleaceae from the Indian sub-continent. Kew Bullet. 2003, 58, 257–295. [CrossRef]4. Rafiq, R.A. Three new species from Palas valley, District Kohistan, North West Frontier Province, Pakistan. Novon 1996, 6, 295–297.
[CrossRef]5. Sinnott, M.; Rafiq, R.; Green, P. Jasminum leptophyllum: Oleaceae. Curtis’s Bot. Mag 2000, 34. [CrossRef]6. Vijayakumar, M.; Arumugum, T.; Jawaharlal, M.; Bhattacharjee, S.K. Jasmine. In Advances in Ornamental Horticulture; Bhattacharjee,
S.K., Ed.; Pointer Publishers: Jaipur, India, 2006; Volume 1, pp. 84–114.7. United States Department of Agriculture (USDA). Species Records of Jasminum. ARS, National Genetic Resources Program.
Germplasm Resources Information Network (GRIN) 2011. Retrieved 17 May 2009. Available online: http://www.ars-grin.gov/cgi-bin/npgs/html/taxon.pl/407300 (accessed on 15 December 2020).
8. Kobuski, C.E. Synopsis of the Chinese species of Jasminum. J. Arnold Arbor. 1932, 13, 145–179.9. Green, P.S. A revision of Olea L. (Oleaceae). Kew Bullet. 2002, 57, 91–140. [CrossRef]10. Kiew, R. Name changes for Malaysian plants: Begonia wrayi (Begoniaceae) and Jasminum aemulum (Oleaceae). Malayan Nat. J. 1994,
47, 311–317.11. Joshi, P.; Dhawan, V. Assessment of genetic fidelity of micropropagated Swertia chirayita plantlets by ISSR marker assay. Biol.
Plantar. 2007, 51, 22–26. [CrossRef]12. Mukundan, S.; Sathyanarayana, B.N.; Simon, L.; Sondur, S.N. Comparative analysis and phylogenetic relationships between
populations of commercially important Jasminum sp. by using RAPD markers. Floricul. Orn. Biotechnol 2007, 1, 136–141.13. Sampath, M.; Narayanappa, S.B.; Sondur, S.N.; Simon, L. Analysis of genetic diversity among Jasminum sambac (Linn.) Ait. and J.
grandiflorum Linn. varieties using morphological and molecular markers. Floricul. Orn. Biotechnol. 2008, 2, 60–64.14. Mahmood, M.A.; Hafiz, I.A.; Abbasi, N.A.; Faheem, M. Detection of genetic diversity in Jasminum species through RAPD
techniques. Int. J. Agric. Biol. 2013, 15, 505–510.15. Shekhar, S.; Sriram, S.; Prasad, M.P. Genetic diversity determination of jasmine species by DNA fingerprinting using molecular
markers. Int. J. Biotechnol. Bioeng. Res. 2013, 4, 335–340.16. Shekhar, S.; Prasad, M.P.; Sriram, S. Detection of genetic diversity in Jasmine species by DNA fingerprinting using RAPD
molecular markers. Int. J. Pure Appl. Biosci. 2014, 2, 312–317.17. Phithaksilp, J.; Ruangrungsi, N.; Rungsihirunrat, K. Characterization of 30 selected Jasminum accessions in Thailand based on
microscopic and RAPD fingerprinting. Chiang Mai J. Sci. 2018, 45, 2322–2337.

Plants 2021, 10, 1270 13 of 14
18. Nirmala, K.S.; Champa, B.V.; Gowda, A.P. Genetic diversity assessment of jasmines (Jasminum sps) using amplified fragmentlength polymorphism. J. Appl. Horticul. 2016, 18, 25–29. [CrossRef]
19. Qiu, C.Y.; Gao, G.Q.; Chen, B.L.; Zhou, R.Y.; Zhang, J.Q. ISSR analysis on genetic diversity of Jasminum sambac. Hubei Agric. Sci2008, 47, 744–747.
20. Ghehsareh, M.G.; Salehi, H.; Khosh-Khui, M.; Niazi, A. Application of ISSR markers to analyze molecular relationships in Iranianjasmine (Jasminum spp.) accessions. Mol. Biotech. 2015, 57, 65–74. [CrossRef] [PubMed]
21. Yohanan, R.; Jeyarani, N.J.; Devipriya, V.; Rather, S.A.; Kasana, S.; Thakur, J.; Dwivedi, M.D.; Pandey, A.K. Evaluating geneticdiversity within genus Jasminum L. (Oleaceae) using inter simple sequence repeats (ISSR) marker. Proc. Nat. Acad. Sci. India Sec. BBiol. Sci 2019, 90, 531–540. [CrossRef]
22. Li, Y.; Zhang, W. Isolation and characterization of microsatellite markers for Jasminum sambac (Oleaceae) using Illumina shotgunsequencing. Appl. Plant Sci. 2015, 3, 1500063. [CrossRef]
23. Gemas, V.J.V.; Almadanim, M.C.; Tenreiro, R.; Martins, A.; Fevereiro, P. Genetic diversity in the Olive tree (Olea europaea L. subsp.europaea) cultivated in Portugal revealed by RAPD and ISSR markers. Genet. Res. Crop. Evol. 2004, 51, 501–511. [CrossRef]
24. Noormohammadi, Z. Inter-population genetic diversity in Olea cuspidata subsp. cuspidata revealed by SSR and ISSR markers.Act. Biol. Szeged 2012, 56, 155–163.
25. Ali, S.B.; Mohamed, M.B.; Guasmi, F.; Triki, T.; Kammoun, N.G.; Kamel, N. Genetic variability of Tunisian olive cultivars by ISSRand SSR markers. J. New Sci. 2015, 24, 1098–1107.
26. Abood, A.A.; Al-Ansari, A.M.; Migdadi, H.M.; Okla, M.K.; Assaeed, A.M.; Hegazy, A.K.; Alshamerii, A.M.; Khan, M.A. Molecularand phytochemical analysis of wild type and olive cultivars grown under Saudi Arabian environment. 3 Biotech 2017, 7, 289.[CrossRef]
27. Butkuviene, J.; Sinkeviciene, Z.; Naugžemys, D.; Žvingila, D.; Skridaila, A.; Bobrov, A.A. Genetic diversity of aquatic Ranunculus(Batrachium, Ranunculaceae) in one river basin caused by hybridization. Plants 2020, 9, 1455. [CrossRef]
28. Labdelli, A.; De La Herrán, R.; Arafeh, R.; Resentini, F.; Trainotti, L.; Halis, Y.; Merah, O. Genetic Variation in DamagedPopulations of Pistacia atlantica Desf. Plants 2020, 9, 1541. [CrossRef]
29. El-Tayeh, N.A.; Galal, H.K.; Soliman, M.I.; Zaki, H. Association of Morphological, Ecological, and Genetic Diversity of Aervajavanica Populations Growing in the Eastern Desert of Egypt. Agronomy 2020, 10, 402. [CrossRef]
30. Joy, P.; Raja, D.P. Genetic analysis of somoclonal variation among Jasminum auriculatum (Vohl.) and it’s callus. Int. J. Biol. Techn.2010, 1, 94–98.
31. Zietkiewicz, E.; Rafalski, A.; Labuda, D. Genome finger printing by simple sequence repeat (SSR)-anchored polymerase chainreaction amplification. Genomics 1994, 20, 176–183. [CrossRef] [PubMed]
32. Reddy, M.P.; Sarla, N.; Siddiq, E.A. Inter simple sequence repeat (ISSR) polymorphism and its application in plant breeding.Euphytica 2002, 128, 9–17. [CrossRef]
33. Rzepka-Plevnes, D.; Smolik, M.; Tanska, K. Genetic similarity of chosen Syringa species determined by the ISSR-PCR technique.Dendrobiology 2006, 56, 61–67.
34. Powell, W.; Morgante, M.; Andre, C.; Hanafey, M.; Vogel, J.; Tingey, S.; Rafalski, A. The comparison of RFLP, RAPD, AFLP andSSR (microsatellite) markers for germplasm analysis. Mol. Breed. 1996, 2, 225–238. [CrossRef]
35. Goulão, L.; Monte-Corvo, L.; Oliveira, C.M. Phenetic characterization of plum cultivars by high multiplex ratio markers:Amplified fragment length polymorphisms and inter-simple sequence repeats. J. Am. Soc. Hortic. Sci. 2001, 126, 72–77. [CrossRef]
36. Prevost, A.; Wilkinson, M.J. A new system of comparing PCR primers applied to ISSR fingerprinting of potato cultivars. Theoret.Appl. Genet. 1999, 98, 107–112. [CrossRef]
37. Pe’rez de la Torre, M.; Garcı’a, M.; Heinz, R.; Escando’n, A. Analysis of genetic variability by ISSR markers in Calibra choacaesia.Electron. J. Biotechnol. 2012, 15, 1–12. [CrossRef]
38. Gilbert, J.E.; Lewis, R.V.; Wilkinson, M.J.; Caligari, P.D.S. Developing an appropriate strategy to assess genetic variability in plantgermplasm collections. Theoret. Appl. Genet. 1999, 98, 1125–1131. [CrossRef]
39. Wallander, E.; Alber, V.A. Phylogeny and classification of Oleaceae based on rps16 and trnL-F sequence data. Amer. J. Bot. 2000, 87,1827–1841. [CrossRef]
40. Dupin, J.; Raimondeau, P.; Hong-Wa, C.; Manzi, S.; Gaudeul, M.; Besnard, G. Resolving the Phylogeny of the Olive Family(Oleaceae): Confronting Information from Organellar and Nuclear Genomes. Genes 2020, 11, 1508. [CrossRef]
41. Lee, H.L.; Jansen, R.K.; Chumley, T.W.; Kim, K.J. Gene relocations within chloroplast genomes of Jasminum and Menodora (Oleaceae)are due to multiple, overlapping inversions. Mol. Biol. Evol. 2007, 24, 1161–1180. [CrossRef]
42. Rohwer, J.G. The fruits of Jasminum mesnyi (Oleaceae), and the distinction between Jasminum and Menodora. Ann. Mo. Bot.Gard. 1997, 84, 848–856. [CrossRef]
43. Rohwer, J.G. Fruit and seed structures in Menodora (Oleaceae): A comparison with Jasminum. Bot. Acta 1995, 108, 163–168.[CrossRef]
44. Jeyarani, J.N.; Yohannan, R.; Vijayavalli, D.; Dwivedi, M.D.; Pandey, A.K. Phylogenetic analysis and evolution of morphologicalcharacters in the genus Jasminum L. (Oleaceae) in India. J. Genet. 2018, 97, 1225–1239. [CrossRef]
45. Guitián, J.; Guitián, P.; Medrano, M. Floral biology of the distylous Mediterranean shrub Jasminum fruticans (Oleaceae). Nord. J. Bot.1998, 18, 195–201. [CrossRef]

Plants 2021, 10, 1270 14 of 14
46. Thompson, J.D.; Dommée, B. Sequential variation in the components of reproductive success in the distylous Jasminum fruticans(Oleaceae). Oecologia 1993, 94, 480–487. [CrossRef]
47. Olesen, J.M.; Dupont, Y.L.; Ehlers, B.K.; Valido, A.; Hansen, D.M. Heterostyly in the Canarian endemic Jasminum odoratissimum(Oleaceae). Nord. J. Bot. 2003, 23, 537–539. [CrossRef]
48. Thompson, J.D.; Dommee, B. Morph-specific patterns of variation in stigma height in natural populations of distylous Jasminumfruticans. New Phytol. 2000, 148, 303–314. [CrossRef]
49. Urreizti, R.; Garcia-Giralt, N.; Riancho, J.A.; González-Macias, J.; Civit, S.; Güerri, R.; Yoskovitz, G.; Sarrion, P.; Mellivobsky, L.;Díez-Pérez, A.; et al. CO L1A1, haplotypes and hip fracture. J. Bone Min. Res. 2012, 27, 950–953. [CrossRef]
50. Mantel, N. The detection of disease clustering and a generalized regression approach. Canc. Res. 1967, 27, 209–220.51. Hammer, Ø.; Harper, D.A.; Ryan, P.D. PAST: Paleontological statistics software package for education and data analysis. Palaeontol.
Electron. 2001, 4, 9.52. Weising, K.; Nybom, H.; Pfenninger, M.; Wolff, K.; Kahl, G. DNA Fingerprinting in Plants: Principles, Methods, and Applications;
CRC Press: Boca Raton, FL, USA, 2005; p. 472.53. Chadha, S.; Gopalakrishna, T. Comparative assessment of REMAP and ISSR marker assays for genetic polymorphism studies in
Magnaporthe grisea. Curr. Sci. 2007, 93, 688–692.54. Peakall, R.O.D.; Smouse, P.E. GENALEX 6: Genetic analysis in Excel. Population genetic software for teaching and research. Mol.
Ecol. Notes 2006, 6, 288–295. [CrossRef]55. Nei, M. Estimation of average heterozygosity and genetic distance from a small number of individuals. Genetics 1978, 89, 583–590.
[CrossRef]