Embed Size (px)
Citation preview
ISSN 2277 8675 DMIETR International Journal on Financial Management (ejournal) Page 1
DMIETR
www.dmietr.edu.in ISSN- 2277 8675
ISSN 2277 8683 DMIETR International Journal on Marketing Management
International Journal on
Financial Management
June 2014
Volume- 1
.;
1
Department of Business Management (MBA)
Datta Meghe Institute of Engineering,
Technology & Research, Salod (Hirapur), Wardha

ISSN 2277 8675 DMIETR International Journal on Financial Management (ejournal) Page 2
ISSN 2277 8675
DMIETR International Journal on Financial Management (ejournal)
Volume 1
Issue- June 2014
DMIETR, Wardha
ISSN 2277 8675 DMIETR International Journal on Financial Management (ejournal) Page 3
©DMIETR
No part of this publication may reproduced store in a retrieval system or transmitted in any form
or by any means, electronic, mechanical, photocopying, recording or otherwise, without the prior
permission of the publisher, Press, DMIETR. The publisher does not assume any responsibility
for any injury and / or damage to person or property as matter of product liability , negligence or
otherwise or from any use or operation of any use or operation of any method , instruction or
ideas contained in material here in.
ISSN 2277 8675 DMIETR International Journal on Financial Management (ejournal) Page 4
Chief Editor
Dr. Shailesh Kediya, HOD-MBA D.M.I.E.T.R
Managing Editors
Prof. Atul Kharad Prof. Rupesh Dahake
Faculty, Faculty,
D.M.I.E.T.R. Wardha D.M.I.E.T.R Wardha
EDITORIAL ADVISORY BOARD EDITORIAL BOARD
Dr. Sachin Untawale
Dr. Kiran Nerkar
Principal Chairman,
D.M.I.E.T.R. Business Management Board,
RTM Nagpur university, Nagpur
Dr. Bharat Meghe
Dean, Faculty of Commerce, Dr. Ajit Shringarpure
RTM Nagpur University, Nagpur Director, Real Institute of Management &
Research, Nagpur
Dr. Vinayak Deshpande Associate Editor
Professor & Director,
Department of Business Management, Dr. K. V. Somnadh
RTM Nagpur university, Nagpur Asst. Professor
G.S. College of Commerce, Wardha
Dr. Sujit Metre Associate Editor
Director, DMIMS, Nagpur
Dr Krishnarao L Ukey,
Legal Advisor to SMEs & Professional
Colleges.
Ex- Director/Principal MBA college
Raisoni Group, Nagpur
Dr. Ajay Pethe
Member
Dr. Rajiv Jadhao
Head of Commerce Dept
Associate Professor
Lok Mahavidyalaya, Wardha
Prof. B. M. Mujumdar
Former Director,
DAMS, G.S.College of Commerce, Wardha
ISSN 2277 8675 DMIETR International Journal on Financial Management (ejournal) Page 5
Sr.No. Title of The Paper Page No.
1
ELIGIBILITY AND EFFECTIVENESS OF MOBILE MONEY
- SUPALLAB CHAKRABORTY , KRITI GANGWAR , SRISHTI
SINHA , SREEJA
6
2
SAHARA THE PROTECTOR OR MARAUDER OF INVESTORS:
(AN EPHEMERAL LOOK INTO THE HIGH PROFILE SEBI-SAHARA
CASE)
- DR KRISHNARAO L UKEY
19
3
ANALYSIS OF PROFITABILITY RATIOS OF FMCG COMPANIES
OPERATING IN INDIA
- DR. HIMANSHUTIWARI& FAKHRUDDINSUNELWALA
32
4
FUNDAMENTAL ANALYSIS OF SELECTED TELECOM COMPANIES IN
INDIA WITH SPECIAL REFERENCE TO Z SCORE MODEL TEST
- PROF. KRUNAL PAREKH, PROF. VINOD WAIKER, MR. SYED
NOORUDDIN ,MR. CHIRAG JOSHI
41
5 A STUDY ON SIGNIFICANCE OF INVENTORY CONTROL
-DR. T.G. MIRGE 50
6 “SMALL-SCALE INDUSTRY”
-PROF. SANJAY B.SHINDE, 54
7
APPLICATION OF THE BINOMIAL AND POISSON PROBABILITY
DISTRIBUTION
-MRS.SUNETRA S. ADSAD1, MS.JANHAVI R. SONTAKKE 2,
MRS.MONA V. DEKATE3
58
8
THE ROLE OF CORPORATE SOCIAL RESPONSIBILITY IN SUCCESSFUL
BUSINESS
-DR. BHARAT MEGHE
66
9
BANCASSURANCE-A VALUABLE TOOL FOR DEVELOPING
INSURANCE IN EMERGING MARKETS WITH SPECIAL REFERENCE TO
HDFC BANK.
Prof. Akash Agrawal 1,
Dr. Shakeel Sattar 2,
Dr. Shailesh Kediya3,
Prof. Krunal Parekh 4
76
INDEX
ISSN 2277 8675 DMIETR International Journal on Financial Management (ejournal) Page 6
ELIGIBILITY AND EFFECTIVENESS OF MOBILE
MONEY
SUPALLAB CHAKRABORTY1, KRITI GANGWAR2, SRISHTI SINHA3, SREEJA4
SYMBIOSIS LAW SCHOOL, PUNE
SYMBIOSIS INTERNATIONAL UNIVERSITY
ABSTRACT
“Any sufficiently advanced technology is indistinguishable from magic.”-Arthur Clarke
In this era of modernisation we feel suffocated due to time crunch be it at jobs, hangouts, meetings, dates,
brunches or for that matter transactions. The modern youth is impatient who cannot always afford to be in
a queue. They want themselves to be taken as the first priority and hence so many technological
developments for instance the change from STD booths to cell phones, retail showrooms and outlets to
online shopping, manual banking to phone banking, and liquid cash or cards to mobile money .
We are researching exclusively on mobile money and how the people especially in a country like India are
adapting themselves to this new technology. We have also looked into the impact that such technology has
on the present population and its ability to eliminate the present trend of carrying cash and cards. Last but
not the least, people’s awareness about the rules and regulations issued by the RBI in regards to mobile
money that banks, service providers and users needs to comply with. For the purpose of our research we
have considered various sources for information like primary research which includes survey and
secondary sources like existing literature. We want to find whether this technology can be incorporated in
the present scenario in a method competent enough that it could be nonetheless passed off as magic to a
regular consumer.
KEYWORDS
Mobile money, Reserve Bank of India, Mobile payments, Mobile wallets
INTRODUCTION
“Send money, pay bills, recharge from your mobile5” or “grow your money offer with Airtel6” are
something that one would find common in Airtel or Vodafone advertisements these days. So what is this
mobile money? How effective and easy is it? Is there any regulation in relation to such transaction? What
is the reason behind such regulation? Whether this facility is conforming with all the laws of the country
that ensure security to the customer’s funds? These are the question that should generally come to any
reasonable person’s mind when one is thinking of mobile money.
With the advent of technology banking has taken an all new shape altogether. Now this generation has
taken a step ahead and is dealing with money that is not in any bank or other financial institution but is
always with you in your hands i.e. in your mobile phone. Network service providers have come up with
this new concept that enables a person to recharge their phone balance account with a substantial sum of
1 [email protected] [email protected] [email protected] [email protected] 5www.airtel.in 6Supra 1
ISSN 2277 8675 DMIETR International Journal on Financial Management (ejournal) Page 7
money, pay their bills, and even do shopping. In simple words, mobile money is an account on your mobile
phone. You can now deposit money (called ‘loading cash’) on to your mobile money account and use this
balance to pay for various products & services through a simple menu on your phone. Thereby making it
all the more easy for their customer to make their daily transaction a more easy and simple process.
Mobile payment also referred to as mobile money, mobile money transfer, and mobile wallet generally
refers to payment services operated underfinancial regulation and performed from or via a mobile device.
Instead of paying with cash, cheque, or credit cards, a consumer can use a mobile phone to pay for a wide
range of services and digital or hard goods. Although the concept of using non-coin-based currency
systems has a long history it is only recently that the technology to support such systems has become
widely available.7 Such services are targeted toward the youth population and are very restricted towards
other category of population.
But this whole thing does not end here. When a company or any such service provider is engaging itself in
such transactional activities they are actually performing a pseudo banking activity by taking deposit,
giving short term loans and providing charter services to the customer. And there is several regulations
with regards to such activity imposed by the central bank itself. The underlying principle for such
restriction is nothing but to provide security to the customers availing this facility. The question that arises
is the company providing such facility is adhering to such reasonable restriction or there are loopholes.
RESEARCH OBJECTIVE
Our objective is:
To study the awareness of mobile money among the banking population in India
To study the way people perceive mobile money as a solution
To study the impact of mobile money on the mobile using population
To study the awareness of the population surveyed regarding RBI rules and regulation
RESEARCH METHODOLOGY
The researchers have chosen both non doctrinal and analytical method for their research. The researcher
has used existing literary on the subject such as standard text books and articles written by renowned
authors and guidelines issued and reports by respective authorities have been duly referred to in this
research and for doctrinal research they conducted a survey of 50 people via questionnaire only who were
aware of this topic.
RESEARCH QUESTIONS
The questions we came up with are as follows:
How much of the banking population is aware and uses mobile money?
How do the users and potential users and users look at this facility as compared to carrying card or
cash?
How safe and reliable do they find this facility?
7Hollow Matthew(2012); Pre-1900 utopian visions of the ‘cashless society’
ISSN 2277 8675 DMIETR International Journal on Financial Management (ejournal) Page 8
What will be the impact of mobile money on the mobile using population? How much of the
population under survey is aware of the bare minimum restriction imposed by the RBI(the guiding
authority of mobile banking)?
SCOPE
The paper specifically deals with Mobile Money as a booming new style of banking facility in today’s
world with special reference to the banking industry and the Guidelines issued by RBI. This paper deals
with a survey of a portion of the mobile and banking population randomly picked to study how they
perceive this new technology.
LIMITATION
The limitations we face during the research are:
Time and financial constraint was a major limitation in this survey. The researchers were able to
collect opinion from only from a very small sample out of the whole population.
The topic being a new issue in the market very few literatures were available in this regard.
The knowledge of the topic is available to a certain sector of the entire population mainly the city
population who are technologically aware; youth and the middle aged; middle class, upper middle
class and the rich class.
LITERATURE REVEIW
In the book Banking Laws in IndiabyR.N.Choudhary8mobile money is defined as nothing but banking
through mobiles. This concept has eradicated the need of carrying cash, credit card or debit card for
marketing purpose. Also it is very efficient as various bills relating to electricity, gas, water etc can be paid
using this mobile money facility. Reserve Bank of India has given green signal to the concept of mobile
money and this has been accepted by several other banks including ICICI, HDFC, Punjab National Bank,
SBI, and Bank of Baroda etc. The author talks about the need of approval by the boards of respective
banks before providing this service to the customers. The RBI defines ‘mobile money transactions’ as
banking transactions which include credit/debit to bank account and accessing account for non-monetary
transactions like balance inquiry etc from mobiles.
In a Master Circular issued by RBI on 1st July 20139 provided Operative Guidelines for banks for Mobile
Transactions in India. This guideline apart from providing a very simple introduction to mobile money
provides regulation in regards to three issues i.e. introduction to the regulatory and supervisory issue,
technology and security standard issue and the most important of all customer protection issues. In the first
issue addressed in the RBI guidelines it primarily discusses what all banks can involve themselves in
mobile money transactions at the same time what all other standards they need to match up to like Know
Your Customer (KYC), Anti Money Laundering (AML) and Combating the Finance Terrorism. According
to such guidelines the banks shall file Suspected Transaction Report (STR) to Finance Intelligence Dept. of
India (FID- IND). This guidelines also dictates in regards to technology standards that the banks must
conform to like using of M-pin and Intruder Detection System (IDS).Customer protection once again has
been given utmost importance like the banks have been dictated to detail the terms and condition in person
and set up a grievance cell to meet the consumer complaints.The basic guidelines of RBI can be
summarised as:
8Chapter 12, Banking Laws by R.N. CHAUDHARY; Central Law Publication 9www.rbi.org
ISSN 2277 8675 DMIETR International Journal on Financial Management (ejournal) Page 9
The mode of payment should be Indian rupee.
Transactions related to sale and purchase can be done only in India.
If mobile money service is allowed by any bank, it is bound to give the facilities of mobile money
to the customers when asked for.
Banks should create a special cell to solve the problems of customers regarding mobile money.
The mobile money service include two tier agreement: between bank and service provider, and
customer and bank
In Draft Guidelines for issuance and operation of Prepaid Payment Instruments in India issued by RBI
on January 30, 200910 mobile wallet or mobile money has been categorised as a typical type of payment
instrument called Semi Closed Payment Instrument. Semi closed system of payment instrument has been
defined as payment instrument which are redeemable at a group of clearly identified merchant location/
establishments which contract specifically with the issuer to accept the payment instrument. These
instruments do not permit cash withdrawal or redemption by the holder. It is conclusive of the fact that
according to these guidelines person to person transfer is not allowed in such transaction.
In a research paper of Global System for Mobile Communication Association on mobile money for the
unbanked published on January 30, 201411by group of mobile operators have brought to light how
mobile money or mobile wallet can be used as a social tool for providing financial services to poor
sections of the society where proper banking facility still remains a distant dream, mobile money for the
unbanked is an initiative taken to reach the scale. They do that by identifying and sharing benchmark data,
operational best practices and other commercially viable approaches.
According to the surveys conducted by them:-
2.7 million people worldwide have no access to financial services
1 billion of these have a mobile phone
Developing nations have the greatest proportion of these people
Trust of &dependence on MNO’S is already very high in these markets making them a viable
option for launching such a service.Theyhave explained various steps according to which a mobile
service can be introduced in the market which involves a customer journey.
In a RBI report by H.R. Khan, the deputy governor of Reserve Bank of India on customising mobile
money in India on August 25, 201112it was stated that RBI won’t allow mobile operators to provide
banking facility by bypassing the authority imposed by the central bank. That’s why the central bank has
guided mobile operators to keep a banking correspondent which will comply with the rules, regulation and
guidelines of RBI. Apart from Nokia other players in the market are My Mobile Payments and Loop
Mobile. Nokia Money which has closed down recently has been acquired by a mobile financial firm called
FINO. According to the research conducted less than 1% of bank customers actually use mobile money.
Till June 2012 there has been 3.34 million mobile money transaction worth Rs 3067 million. The year on
growth in volume and transactions has been 143% and 211% respectively. He said that in order to make the
10www.rbi.org
11www.gsma.com; MMU 2013 State of the Industry Report on Mobile Financial Services for the Unbanked by
Claire Penicaud
12www.bis.org; Customising Mobile Banking in India – issues and challenges by ShriH.R.Khan
ISSN 2277 8675 DMIETR International Journal on Financial Management (ejournal) Page 10
system grow a collaborative effort is needed from MNO, banks and National Payments Corporation of
India. The Institute of Development and Research in Banking Training has launched Mobile Banking
Security Lab to work out a reliable safe and secure solution for banking operations.
In the Privacy Policy of Airtel with regards to Airtel Money13 states that Airtel uses USSD or
Unstructured Supplementary Services Data for such transfers. According to RBI mobile operators cannot
bypass banking thus they needed to have a banking correspondent. Airtel uses Axis Bank as its banking
correspondence. Airtel in its privacy policy makes its customers aware and gives statutory warning
regarding its policies like:
Informing them that withdrawal of cash and refunds from Airtel money wallets are not allowed.
Any outstanding credit in Airtel money wallet must be utilised only to make payments to
bona-fide transactions. At the same time the funds are not transferable.
The service is available only to residents of India above age of 18 years.
The money in the account should be utilised within 185 days and in case of any non- compliance
to this policy the same will be forfeited.
It states that the facility is subject to the maintenance of active mobile phone connections with
BhartiAirtel Ltd., the customer is solely responsible for all liability arising from the unavailability
of series due to a mobile handset not supporting Airtel channel.
They ensure that none of the transactions are happening in foreign currency
FINDINGS AND DISCUSSIONS
Availability and Use of Mobile Money among the Indian Population
In order to study the approach of some new technology related product in a population requires the
fulfilment of a framework of seven parameters commonly termed as 7A(s) namely Availability,
Accessibility, Acceptability, Affordability, Awareness, Assurance and Appropriateness. In this case
Availability and accessible implies to the available technical knowhow, the technology itself and banking
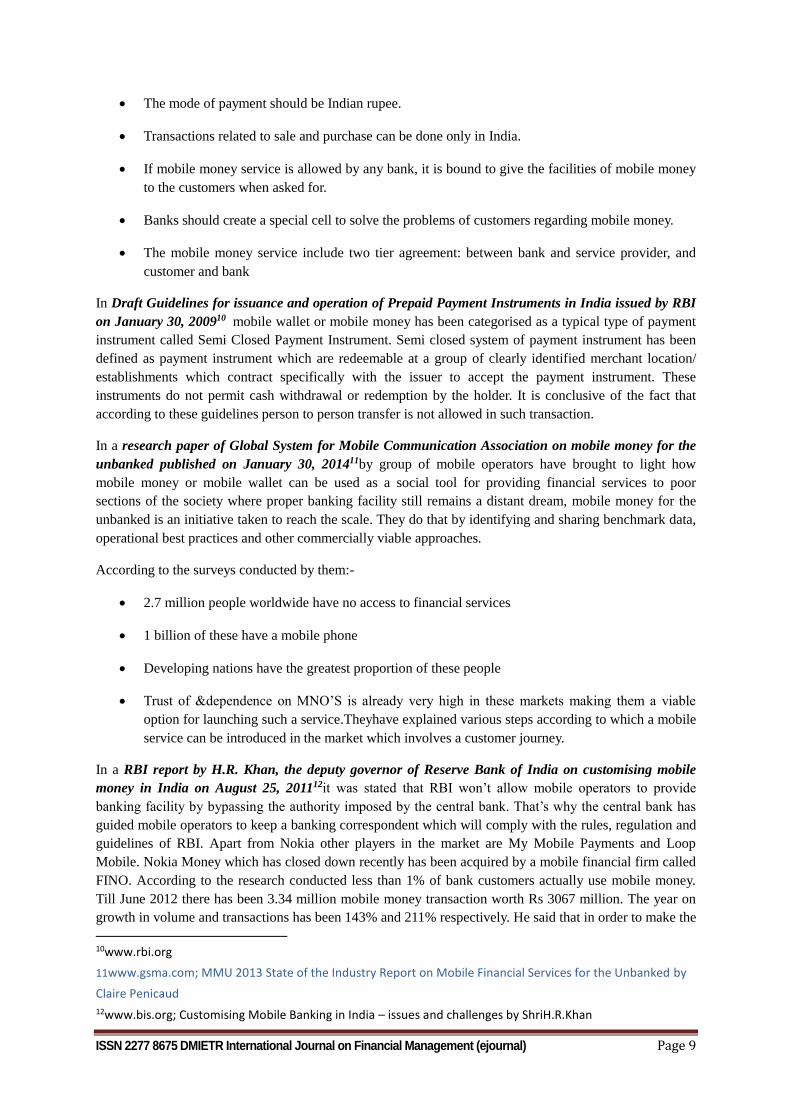
facility to the population. For mobile money the technology required is mobile phone and a network. From
the survey report by Mr. H.R. Khan on behalf of RBI we come to know that mobile technology has
received widespread acceptance among the people of India not only in the urban areas but also in the rural
areas. Out of 936 million of mobile using population 313 million subscribers are from rural areas.
13www.airtel.in; Terms of Use
Total Mobile Using Population of India
Rural Population
Urban Population
ISSN 2277 8675 DMIETR International Journal on Financial Management (ejournal) Page 11
Figure 1
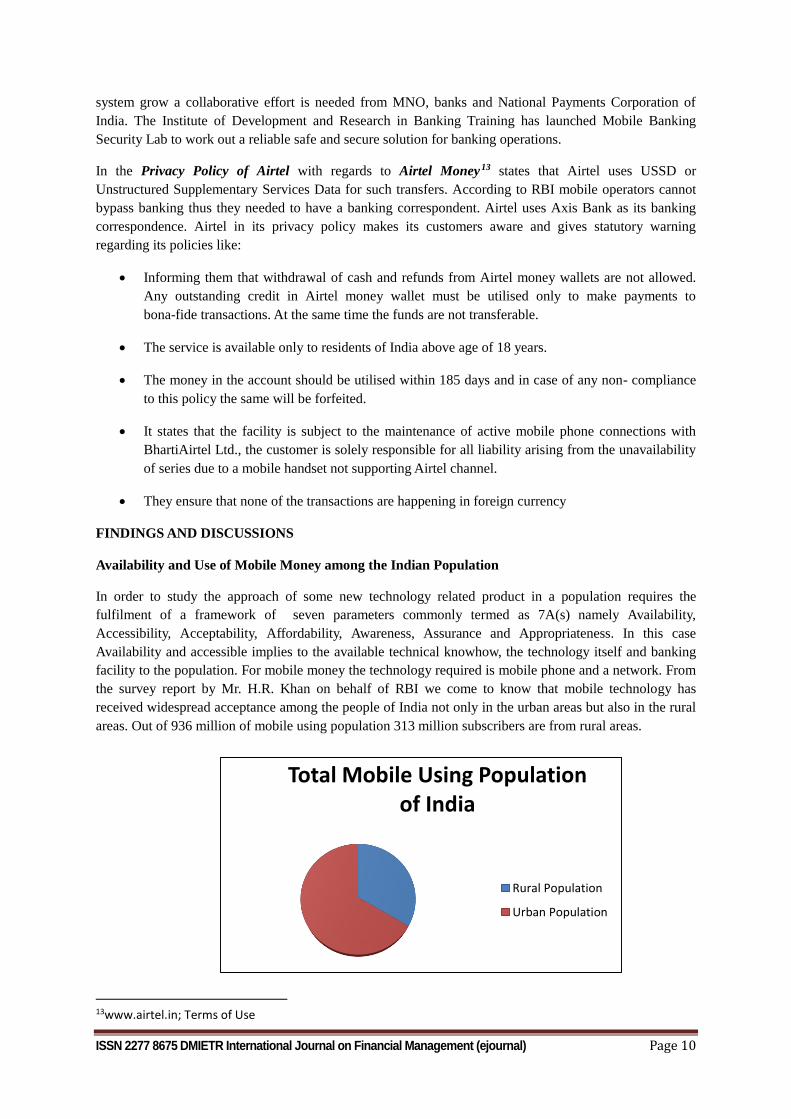
However in a country like India where most of the population which lives in rural areas lacks basic
facilities like formal banking; such huge number of mobile users is no parameter to judge the reach of
mobile banking to the entire population. Out of 0.6 million villages there are only 0.14 million villages
which actually have a population who are properly banked
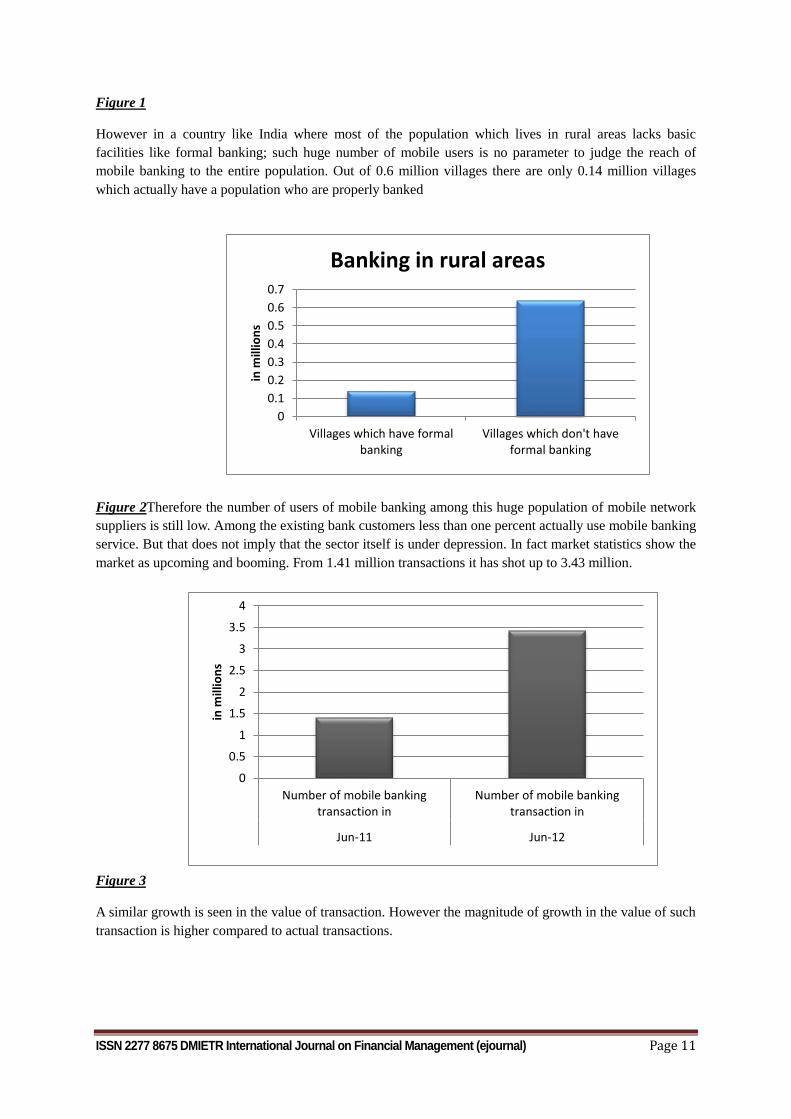
Figure 2Therefore the number of users of mobile banking among this huge population of mobile network
suppliers is still low. Among the existing bank customers less than one percent actually use mobile banking
service. But that does not imply that the sector itself is under depression. In fact market statistics show the
market as upcoming and booming. From 1.41 million transactions it has shot up to 3.43 million.
Figure 3
A similar growth is seen in the value of transaction. However the magnitude of growth in the value of such
transaction is higher compared to actual transactions.
0
0.1
0.2
0.3
0.4
0.5
0.6
0.7
Villages which have formalbanking
Villages which don't haveformal banking
in m
illio
ns
Banking in rural areas
0
0.5
1
1.5
2
2.5
3
3.5
4
Number of mobile bankingtransaction in
Number of mobile bankingtransaction in
Jun-11 Jun-12
in m
illio
ns
ISSN 2277 8675 DMIETR International Journal on Financial Management (ejournal) Page 12
Figure 4
Summarily there has been 143% growth in terms of value and 211% growth in terms of value. This is
conclusive of the fact that although the market of this service is not widespread it has a huge scope in the
future market. This issue of the survey proves the fact that the available, accessible, affordable however the
major problem lies in regards of acceptability, awareness, assurance and appropriateness (i.e. combined
effect of all the features). We will be focusing on these particular grey areas in the subsequent portion of
our research.
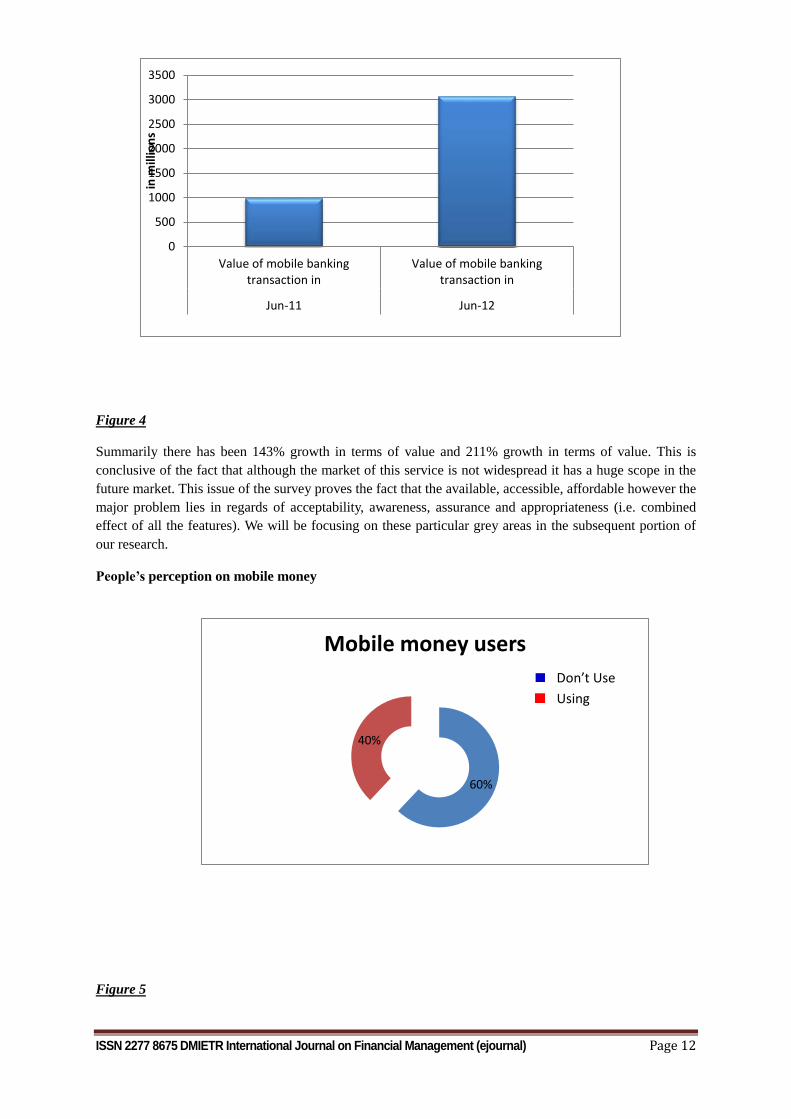
People’s perception on mobile money
Figure 5
0
500
1000
1500
2000
2500
3000
3500
Value of mobile bankingtransaction in
Value of mobile bankingtransaction in
Jun-11 Jun-12
in m
illio
ns
60%
40%
Mobile money users
Don’t Use
Using
ISSN 2277 8675 DMIETR International Journal on Financial Management (ejournal) Page 13
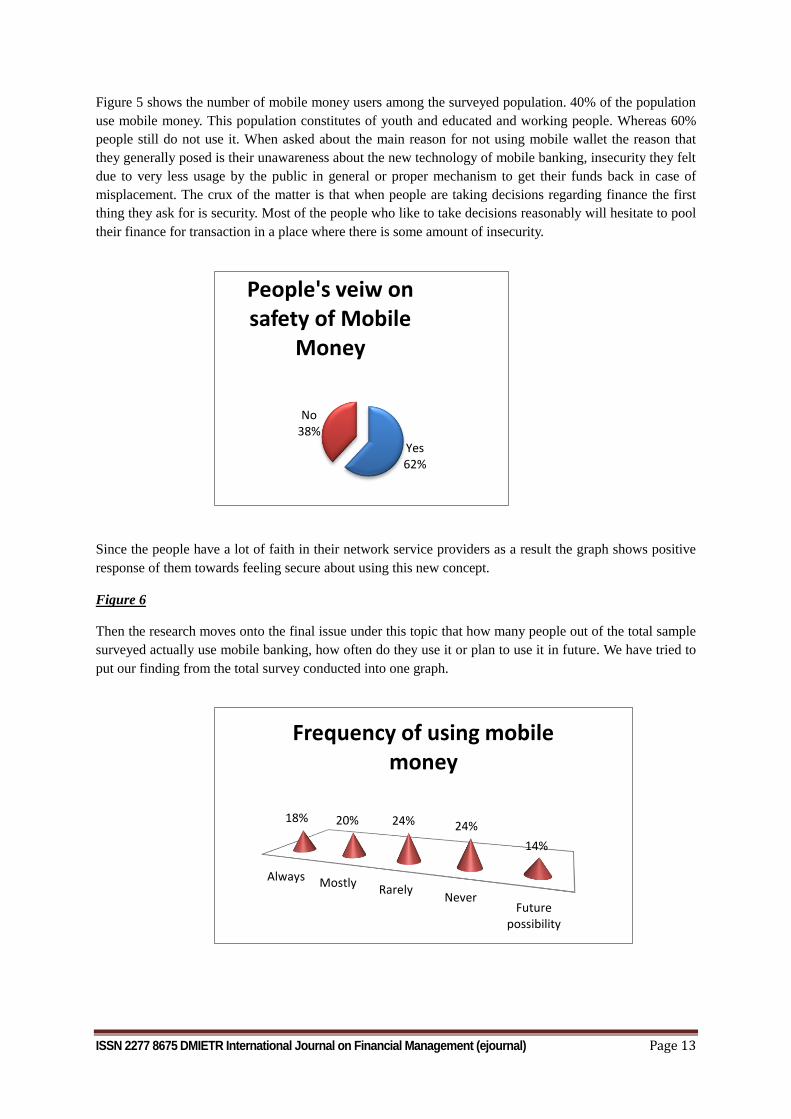
Figure 5 shows the number of mobile money users among the surveyed population. 40% of the population
use mobile money. This population constitutes of youth and educated and working people. Whereas 60%
people still do not use it. When asked about the main reason for not using mobile wallet the reason that
they generally posed is their unawareness about the new technology of mobile banking, insecurity they felt
due to very less usage by the public in general or proper mechanism to get their funds back in case of
misplacement. The crux of the matter is that when people are taking decisions regarding finance the first
thing they ask for is security. Most of the people who like to take decisions reasonably will hesitate to pool
their finance for transaction in a place where there is some amount of insecurity.
Since the people have a lot of faith in their network service providers as a result the graph shows positive
response of them towards feeling secure about using this new concept.
Figure 6
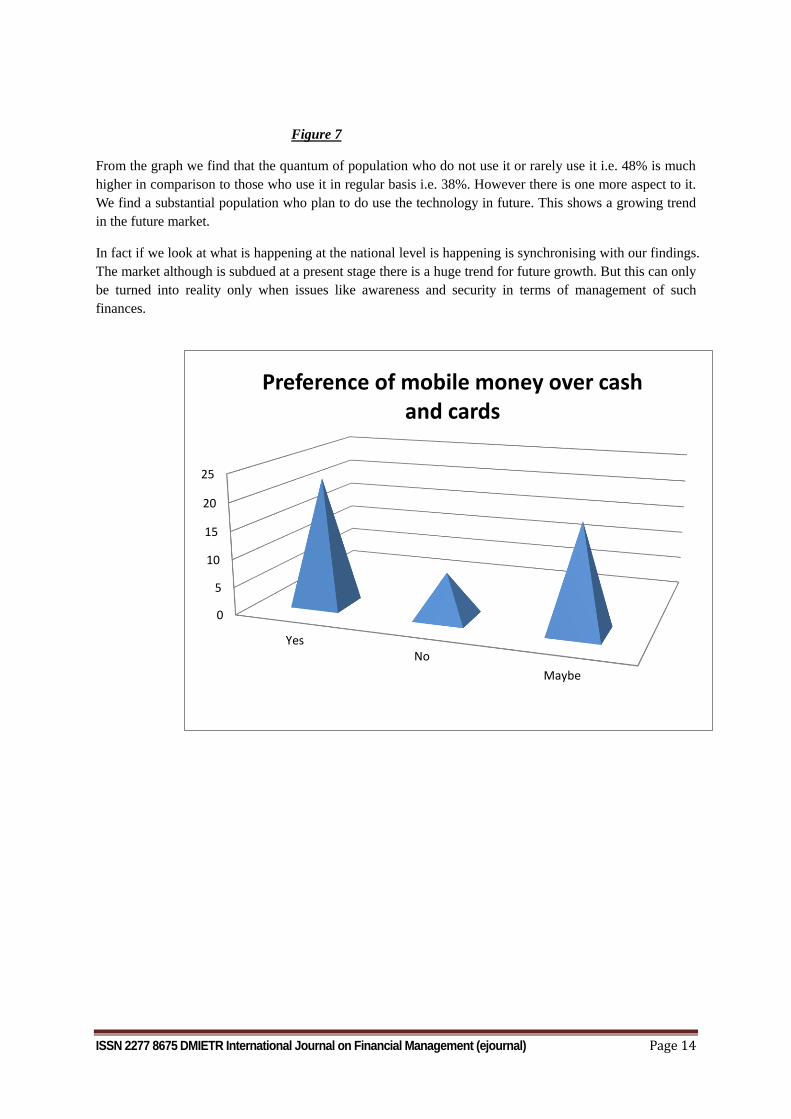
Then the research moves onto the final issue under this topic that how many people out of the total sample
surveyed actually use mobile banking, how often do they use it or plan to use it in future. We have tried to
put our finding from the total survey conducted into one graph.
Yes62%
No38%
People's veiw on safety of Mobile
Money
Always MostlyRarely
NeverFuture
possibility
18% 20% 24% 24%
14%
Frequency of using mobile money
ISSN 2277 8675 DMIETR International Journal on Financial Management (ejournal) Page 14
Figure 7
From the graph we find that the quantum of population who do not use it or rarely use it i.e. 48% is much
higher in comparison to those who use it in regular basis i.e. 38%. However there is one more aspect to it.
We find a substantial population who plan to do use the technology in future. This shows a growing trend
in the future market.
In fact if we look at what is happening at the national level is happening is synchronising with our findings.
The market although is subdued at a present stage there is a huge trend for future growth. But this can only
be turned into reality only when issues like awareness and security in terms of management of such
finances.
0
5
10
15
20
25
YesNo
Maybe
Preference of mobile money over cash and cards
ISSN 2277 8675 DMIETR International Journal on Financial Management (ejournal) Page 15
Impact of Mobile Money – A Public Opinion
With the constant advancement of technology we are slowly moving from paper money to smart card or
plastic money and finally it is time when money is becoming digital. This is a huge leap in this small step
by the new generation. Mobile money has given a new angle altogether to the way people perceive mobile
money. It has made transactions easier and simpler. It is basically a boon for the young and fast moving
generation. They don’t have to spend long hours in queue to pay their bills or go shopping physically. It is
as Airtel rightfully quotes “the world at your fingertips”.But the world does not end here there is always a
matter of security. The future generation is very reasonable and will bring such a huge change when they
feel secure in doing so. Therefore we asked the survey population that whether they feel that such
transactions are safer than cash or cards. The results were surprising as most of the people felt that it is a
safer alternative than cash or card (around 46%) and is or will be of great use in case of emergencies butt
then most of them had mixed feelings and around 16% people denied.
Figure 8
Figure 9
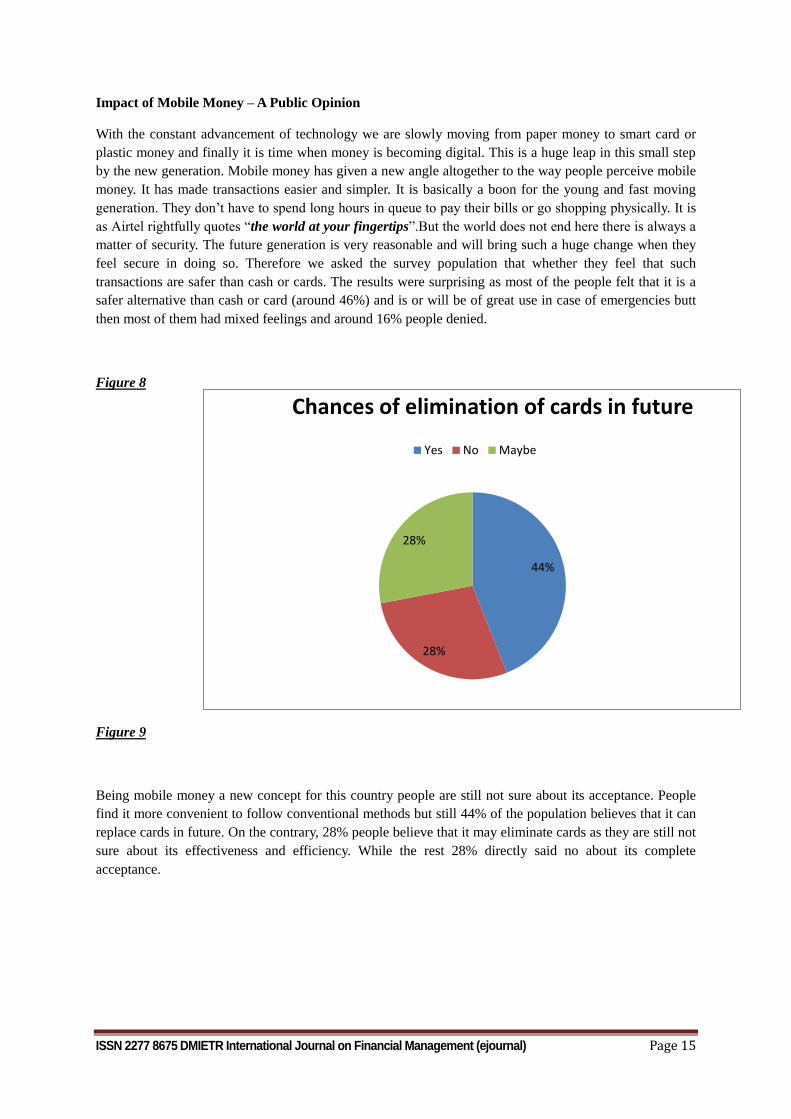
Being mobile money a new concept for this country people are still not sure about its acceptance. People
find it more convenient to follow conventional methods but still 44% of the population believes that it can
replace cards in future. On the contrary, 28% people believe that it may eliminate cards as they are still not
sure about its effectiveness and efficiency. While the rest 28% directly said no about its complete
acceptance.
44%
28%
28%
Chances of elimination of cards in future
Yes No Maybe
ISSN 2277 8675 DMIETR International Journal on Financial Management (ejournal) Page 16
RBI GUIDELINES & AWARENESS OF RULES
According to a RBI’s report authored by Shri H.R. Khan; mobile companies offering such services are
actually performing banking function and thus they cannot be allowed to surpass the regulation imposed by
RBI. Therefore RBI directed all network services provider providing mobile wallet or any similar facility
to keep a banking correspondent and the RBI will have proper guidelines for the latter. The basic
guidelines issued by RBI to the mobile network operator are simple and easy to follow whereas the ones
issued to the corresponding banks are very stringent.
Summary of Guidelines to Mobile Network Service Provider
The mode of payment should be Indian rupee
Transactions related to sale and purchase can be done only in India
If mobile banking service is allowed by any bank, it is bound to give the facilities of mobile
banking to the customers
Banks should create a special cell to solve the problems of customers regarding mobile banking
The mobile banking service include two tier agreement: between bank and service provider, and
customer and bank
RBI imposed a cap limit of Rs. 50,000 which was later on removed on Dec 2011
Summary of Guidelines to Banks Functioning as Correspondents:
Under 3.2 of Eligibility clause of RBI guidelines for issuance and operation of Prepaid Payment
Instruments in India only those banks which have permission to perform mobile banking functions will
only be able to act as banking correspondent. Therefore they will have to conform with the following.
Banks shall only cater to Indian citizen and allow dealing in only Indian Currency.
The guidelines issued by the Reserve Bank on ‘Risks and Controls in Computers and
Telecommunications’ vide circular DBS.CO.ITC.BC. 10/ 31.09.001/ 97-98 dated 4th February
1998 will apply mutatis mutandis to Mobile Banking.
The guidelines issued by Reserve Bank on “Know Your Customer (KYC)”, “Anti Money
Laundering (AML)” and “Combating the Financing of Terrorism (CFT)” from time to time would
be applicable to mobile based banking services also.
Banks shall file Suspicious Transaction Report (STR) to Financial Intelligence Unit – India
(FIU-IND) for mobile banking transactions as in the case of normal banking transactions.
Banks shall put in place a system of document based registration with mandatory physical
presence of their customers, before commencing mobile banking service. Reserve Bank would
consider relaxation in specific cases while approving the proposals of banks.
On registration of the customer, the full details of the Terms and Conditions of the service offered
by the bank shall be communicated to the customer.
To meet the objective of a nation-wide mobile transaction framework, facilitating inter-bank
settlement, a robust clearing and settlement infrastructure operating on a 24x7 basis would be
necessary.
ISSN 2277 8675 DMIETR International Journal on Financial Management (ejournal) Page 17
It must be recognised, the technology deployed is fundamental to safety and soundness of any
payment system. Therefore, banks are required to follow the Security Standards appropriate to the
complexity of services offered, subject to following the minimum standards set out in this
document. Like where m-PIN is used, end to end encryption of the m-PIN shall be ensured.
All prepaid payment instrument issued in the country shall have a minimum validity period of six
months from the date of activation/issuance to the holder. In the case of non-reloadable prepaid
payment instruments, the transfer of outstanding amount at the expiry of the payment instrument
to a new similar payment instrument of the same issuer, purchased by the holder may be
permitted.
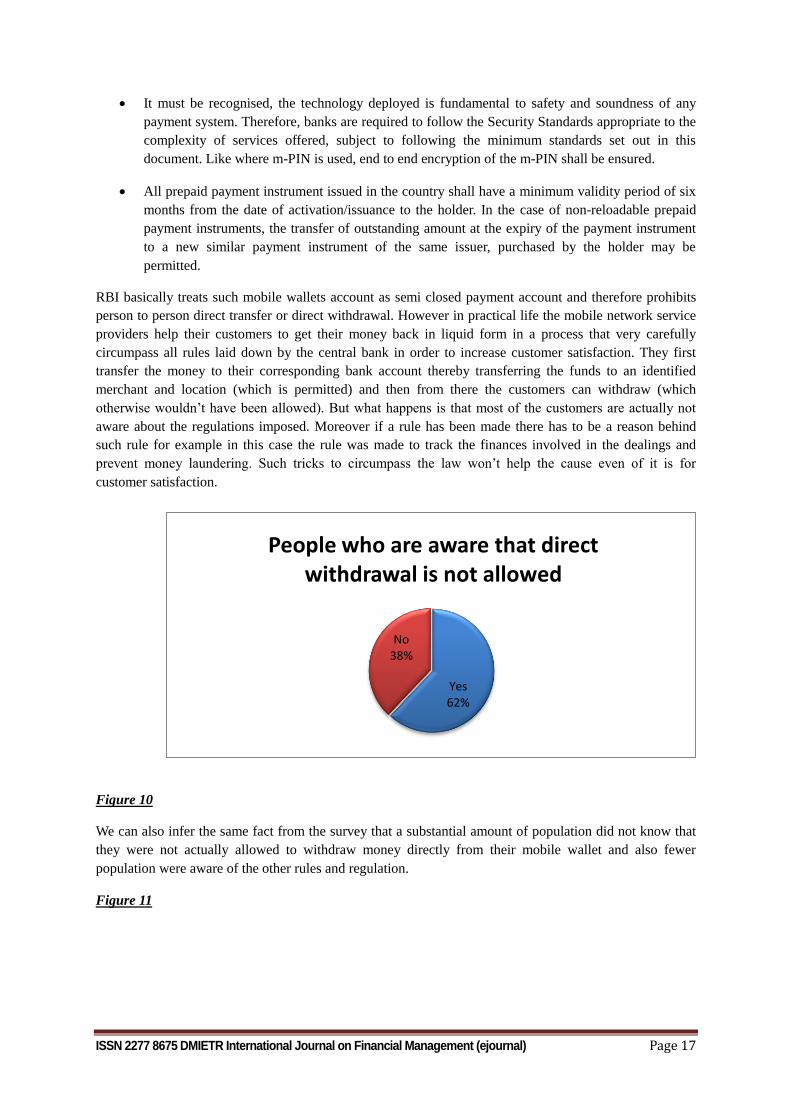
RBI basically treats such mobile wallets account as semi closed payment account and therefore prohibits
person to person direct transfer or direct withdrawal. However in practical life the mobile network service
providers help their customers to get their money back in liquid form in a process that very carefully
circumpass all rules laid down by the central bank in order to increase customer satisfaction. They first
transfer the money to their corresponding bank account thereby transferring the funds to an identified
merchant and location (which is permitted) and then from there the customers can withdraw (which
otherwise wouldn’t have been allowed). But what happens is that most of the customers are actually not
aware about the regulations imposed. Moreover if a rule has been made there has to be a reason behind
such rule for example in this case the rule was made to track the finances involved in the dealings and
prevent money laundering. Such tricks to circumpass the law won’t help the cause even of it is for
customer satisfaction.
Figure 10
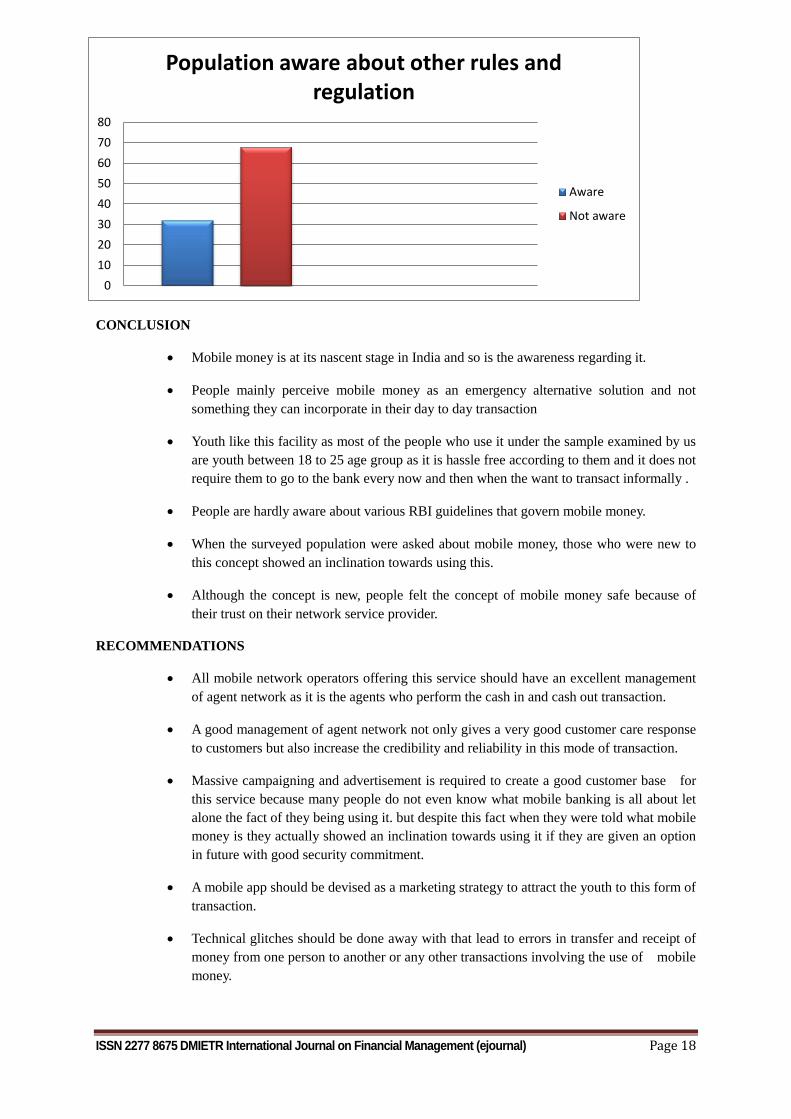
We can also infer the same fact from the survey that a substantial amount of population did not know that
they were not actually allowed to withdraw money directly from their mobile wallet and also fewer
population were aware of the other rules and regulation.
Figure 11
Yes62%
No38%
People who are aware that direct withdrawal is not allowed
ISSN 2277 8675 DMIETR International Journal on Financial Management (ejournal) Page 18
CONCLUSION
Mobile money is at its nascent stage in India and so is the awareness regarding it.
People mainly perceive mobile money as an emergency alternative solution and not
something they can incorporate in their day to day transaction
Youth like this facility as most of the people who use it under the sample examined by us
are youth between 18 to 25 age group as it is hassle free according to them and it does not
require them to go to the bank every now and then when the want to transact informally .
People are hardly aware about various RBI guidelines that govern mobile money.
When the surveyed population were asked about mobile money, those who were new to
this concept showed an inclination towards using this.
Although the concept is new, people felt the concept of mobile money safe because of
their trust on their network service provider.
RECOMMENDATIONS
All mobile network operators offering this service should have an excellent management
of agent network as it is the agents who perform the cash in and cash out transaction.
A good management of agent network not only gives a very good customer care response
to customers but also increase the credibility and reliability in this mode of transaction.
Massive campaigning and advertisement is required to create a good customer base for
this service because many people do not even know what mobile banking is all about let
alone the fact of they being using it. but despite this fact when they were told what mobile
money is they actually showed an inclination towards using it if they are given an option
in future with good security commitment.
A mobile app should be devised as a marketing strategy to attract the youth to this form of
transaction.
Technical glitches should be done away with that lead to errors in transfer and receipt of
money from one person to another or any other transactions involving the use of mobile
money.
0
10
20
30
40
50
60
70
80
Population aware about other rules and regulation
Aware
Not aware
ISSN 2277 8675 DMIETR International Journal on Financial Management (ejournal) Page 19
Quick redemption of money in case of errors in transaction and a proper tracking service
should be devised to know how the transacted money is being taken care of.
FUTURE SCOPE
The survey can be conducted over a larger sample in other cities.
There are not many players in the market presently but being a growing market the statistics will
eventually change. A survey at that time might produce different results
The people would be more aware about the service and the rules regarding it.
Since there will be a bigger population who will be using it in future with the spread of awareness
the dangers involved in respect to laundering and frauds will also increase. Therefore RBI might
transform their guideline to proper rules. A research paper can be prepared on the effectiveness of
these rules itself.
BIBLIOGRAPHY
Hollow Matthew(2012); Pre-1900 utopian visions of the ‘cashless society’
Chapter 12, Banking Laws by R.N. CHAUDHARY; Central Law Publication
www.rbi.org
www.gsma.com; MMU 2013 State of the Industry Report on Mobile Financial Services for
the Unbanked by Claire Penicaud
www.bis.org; Customising Mobile Banking in India – issues and challenges by
ShriH.R.Khan
www.airtel.in; Terms of Use
ISSN 2277 8675 DMIETR International Journal on Financial Management (ejournal) Page 20
SAHARA THE PROTECTOR OR MARAUDER OF
INVESTORS:
(AN EPHEMERAL LOOK INTO THE HIGH PROFILE
SEBI-SAHARA CASE)
Dr Krishnarao L Ukey
Ex-Director-RAISONI Group of Institutions, Nagpur,
Consultant to SMEs., & Professional Colleges at Nagpur.
ABSTRACT:
Sahara was started by Subrata Roy in 1978 from Gorakhpur with Rs. 2000/- an old Lambretta
Scooter, an old table and Chair. For Subrata Roy it is really a “rags to riches” story, who
enjoys a lavish lifestyle owning fleet of high end luxury cars, private Jets; expansive mansion
spread over hundreds of acres with a huge golf course and air strip. After Subrata Roy the
flamboyant Chief of Sahara Empire failed to appear in person before the Supreme Court a
Non Bail-able Warrant was issued. The saga culminated in his surrender before Lucknow
Police on 27/02/2014. One investor “RoshanLal” about fifty two months ago complained to
SEBI; which blew the lid off the entire episode of irregularities committed by 2 companies
namely Sahara India Real Estate Corp Ltd, and Sahara Housing Investment Corp Ltd, in
raising over Rs24000/-crore from more than 3 crore investors sometimes in 2009. While
scanning Draft Red Herring Prospectus filed with SEBI on 30th September 2009, by Sahara
Prime City in connection with an IPO, the market regulator suspected certain irregularities
about issue of Optionally Fully Convertible Debenture by said 2 companies and
genuineness of their investors. Though it is mandatory upon a company to take permission of
SEBI to issue securities to 50 or more persons, no such permission was obtained. To prove
their point Sahara once sent 150 trucks containing 31,669 cartons, to Mumbai at SEBI’s
headquarters causing a huge traffic jam. The case has assumed national importance due to the
involvement of enormous funds and has all the trappings of a big corporate fraud. The case
may prove to be the worst nightmare for Subrata Roy and the investors.
Key Words:- Corporate Sector, Draft Red Herring Prospectus, Initial Public Offer,
Optionally Fully Convertible Debentures, Sahara Group, SEBI, Subrata Roy.
1. BACKGROUND AND HISTORY OF SAHARA GROUP:
Sahara India Pariwar today is a big name to reckon with, in the Indian Corporate
world. It is one of the leading corporate empire and the third largest employer in India
after Indian Railways and Indian Army. Sahara India started in 1978 from Gorakhpur
with seed capital of Rs. 2000, an old Lambretta Scooter, an old table and Chair by
Subrata Roy who was assisted by a clerk and a runner boy. For Subrata Roy it is really
a “rags to riches” story borrowed straight from novels or fiction movie. Presently,
Sahara Group is diversified into broad range of activities. Brief details of some
ISSN 2277 8675 DMIETR International Journal on Financial Management (ejournal) Page 21
major activities are given below:
Financial Services-Sahara India Life Insurance Company Limited, Sahara Asset
Management Company Private Limited (Mutual fund):andSahara Housing Finance
Corporation Limited.
Manufacturing -Araria Jute Project and R&D Centre for providing financial
rehabilitation to the people of Araria. Group also owns a Sugar Factory & Distillery.
Electronic Media- TV channels, Sahara SAMAY-National news Channel,
SAMAY-Urdu channel, Regional news channels- UP and Uttarakhand; Bihar and
Zharkhand; MP and Chattisgarh& Rajasthan.
Print Media- Hindi Daily Rashtriya Sahara 43 Editions, with 7 Printing Centers.
Urdu Daily RoznamaRashtriya Sahara 15 Editions, with 9 printing Centers, Aalmi
Sahara: 72 pages International Urdu Weekly.
Motion Picturesand Entertainment- Film Production House Golden Line
Studios Private Limited, situated at SEEPZ - SEZ, Andheri Mumbai; other
divisions like Visual Effects Studio, pre & post production facilities, VFX,
Animation and Stereoscopic Services for films, television and commercials in the
international and domestic markets. Developing the Largest Chain of Multiplexes
230x3 screens throughout the country. Channel SAHARA ONE, 24 hours digitally
encrypted Entertainment Channel, FILMY 24 hours Hindi Movie Channel,
FIRANGI: 24 hours movie channel showing world cinema dubbed in Hindi.
Film City- Developing world-class film city on around 100 acres of land with an
investment of Rs180 crore, having an Academy.
Dairy and Poultry - Holding 5,353 hectares of land in Macedonia (Europe).
Managing a total herd-size of 317,714 animals, producing approximately 70 lakh
litres of milk per day, it has plans for high quality dairy & poultry products, to be
also exported to the Balkans, Middle-East and North-Africa.
Food Factory- More than 35 food factories churning out 20,000-25,000 meals
each, on a combined area of over 7 lakh sft with a collective capacity of 8.5 lakh
meals a day.
Sahara Global Master-Craft Ltd, to preserve rich heritage of crafts worldwide.
Sahara Q Shop- The brand of Sahara India's Mega Quality Consumer Merchandise
FMCG Retail Venture, offering a huge range of adulteration-free, 100% quality
consumer merchandise in various categories. On April 16th, 2013, Q Shop created
Guinness World Records for the most stores launched simultaneously.
Q Centers- A most innovative concept of a neighborhood meeting place for families
and friends, with 1090 centers catering to needs like Entertainment, Food,
Hospitality, Learning & Shopping – through the maximum number of cinema halls,
ISSN 2277 8675 DMIETR International Journal on Financial Management (ejournal) Page 22
learning centers and restaurants.
Q Learn-1,700 plus dedicated learning centers across 280 cities aimed to connect
the best Professors with learners via hi-tech interactive technology through direct
telecast.
Dine-in Theatre, Restaurant & Bar- The largest number of restaurants (over 1,000)
owned by a single brand in the country – across 280 cities.
Luxury Real estate & Lifestyle Services, Cruise - Sahara Water Homes, Qing City
Exclusive gated townships in multiple formats in Aamby Valley and 23 other cities
Information Technology- Sahara Next -the Technology Arm an ISO 9001:2008
certified company which drives and manages Corporate IT & Telecom Initiatives.
Infrastructure & Housing: The world's largest chain of integrated townships Sahara
City Homesranging 80-300 acres each, Sahara GracePremium residential complexes
typically designed on 10-30 acres each. Sahara Star, the flagship hotel of Sahara,
strategically located near Mumbai's domestic airport blending peerless hospitality
with ultra-modern technology. The group owns many expansive, beautiful buildings
and structures, which are really architectural marvels. Aamby Valley City Nestled
amidst the picturesque environs of the great Sahyadri Mountains is Independent
India’s First Planned Hill City - spread over 10,600 acres. It has 18-Hole floodlit
day & night championship Golf Course meandering over 256 acres of emerald turf
with a fully equipped PGA Golf Academy imparting advanced professional training.
The city is a cradle to world-class International School Aamby [ISA], offering global
curricula. Group also owns malls Sahara Mall & Sahara Ganj.
International properties- i] Grosvenor House London acquired in 2010, is an
iconic Central London hotel, ii] Plaza Hotel New York acquired in 2012, has a
unique blend of old world elegance and modern day grandeur. iii] Dream Hotel-New
York acquired in 2012, its innovative ambience styling adds an alluring layer of
magic to the New York hotel scene. Sahara entered Bangladesh’s housing &
infrastructure sector; signs MOU with Bangladesh Governmenton May 25th, 2012.
Healthcare: Sahara Hospital, Lucknow- A state-of-the-art, multi-specialty, with more
than 50 super specialties and latest generation equipments, is spread over approx. 27
acres with approx. 1 million sqft of built up area.
Power Project: Sahara India Power Corporation limited, (SIPCL). Its upcoming 1320
MW (2X660) power plant at Titilagarh is to be built on 950 acres in Balangir, Odisha
with an investment of more than 8000 crore, based on supercritical technology.
CSR- Through Sahara Welfare Foundation, includes low cost Housing, Pulse polio,
Tree plantation, Literacy drive, Marriages of under-privileged, Safe drinking water
in slum areas, Rehabilitation of physically challenged/ survivors of the earthquake,
Guest House at Kedarnathfor pilgrims, Construction & Renovation of Cremation
ISSN 2277 8675 DMIETR International Journal on Financial Management (ejournal) Page 23
Grounds, relief services during natural disasters, mobile Healthcare, NCC scholarship/
Scholarships for poor meritorious students, “Janswasthya” for health of deprived,
Sakshar Bharat” for slum-dwellers, Financial Assistance to victims of Naxal Attack,
& families of Mumbai Martyrs (26/11),Blood Donation & Hepatitis B Immunization
Camps/ Workshops, Research & Publication on issues related to social development
etc.,
Cultural Activities: Every year on 26th January and 15th August“Bharat Parva” is
celebrated. In 2002 the group undertook Sahara UtsavYatra covering 24000 kms and
400 destinations.
Sports: Officially sponsored Indian Cricket Team from 2001 till 2013. “Subrata Roy
Sahara Cricket Stadium” constructed at Pune. Also sponsors Calcutta Football League
& Senior Indian Hockey Team since 2003. Official partner to Indian Contingent for
Athens Olympics 2004 also contributed its resources for Delhi Commonwealth
Games, 2010. Adopted 95 promising individuals from 6 Olympic disciplines: -
Wrestling, Boxing, Shooting, Archery, Track & Field and Tennis for 2012 London
Olympics to help India get more medals. On December 18th, 2012: announced its
association with Badminton (SainaNehwal) and in November 2012, launched Polo
Team-‘Sahara Warriors’. Is co-owner of “Formula-one” racing car sport, with liquor
baron Vijay Mallya. The enviable portfolio also includes the adoption of volleyball.
Some Sahara India Pariwar Quick Facts:-
Admired as world’s largest Corporate Family, philosophy- “Collective
Materialism”. HQ Sahara Shaher, Gomti Nagar, Lucknow, Managed
mostlybySubrata Roy and his Sons, Group’s Net Worth- Rs68,174Crore. Land
Bank-36,631 acres, Work Force- Over 11 Lakh Salaried and Field workers, but
no trade union which is a great feat given the scenario prevailing in Indian
Business and Industry. Offices and Establishments- 4799, Group Assets-
Market Value Rs152,518crore, Potential Earning-Rs317,853 crore. Group Tagline
“We Chase Quality, Quantity Chases Us”.
Strengths of the group- Core Commitments i.e. Emotion, Discipline, Duty, No
Discrimination, Quality, Give Respect, Self-Respect, Truth,Collective
Materialism, Religion- Bhartiyata,Absolute Honesty, and Patriotism- Profit
sharing- In the last 36 years, not a single rupee has been declared as dividend.
Salary- 50% hike in Gross Salary for employees finds a mention in the
LimcaBook of Records. Its employees are receiving higher remuneration
compared to their counterparts in Central Government, (PF, Gratuity, Pension and
other benefits). 121653 Kartayayogis (Sahara employees) assembled in uniform
in Lucknow on 6th May 2013, to sing national anthem on “Bharat
BhavanaDiwas” a “Guinness Book of world record”.Training and
Development- A unique feature at Sahara- Subrata Roy engages classes of
generally 10 hour sessions for teaching life's philosophy, and he must have
ISSN 2277 8675 DMIETR International Journal on Financial Management (ejournal) Page 24
addressed thousands of such classes.
Subrata Roy as an individual is revered in the group as a gem of a person, a
great motivator and an outstanding leader par excellence. He is a magnificent
orator, icon, visionary, philosopher, guide, friend for his group. Cutting across the
barriers of caste, creed, religion and politics, he has friends and well wishers from
every field- Political Parties, Bollywood, Sports, Industry, and Spiritual alike. He
has nurtured association with who’s who in all walks of life having good
rapport with several Prime Ministers, Presidents, Dalai Lama, late Mother
Teressa, Hollywood actors, Bill Clinton, the Ex- president of USA to name a
few.
2. THE SAHARA - SEBI CASE; IN THE NUT-SHELL:
The high profile saga which on 28/02/2014 witnessed the surrender of flamboyant Sahara
Group empire supremoSubrata Roy who calls himself as the “Managing Worker” will go
down the annals of Indian Corporate history but would also prove a nightmare for the rest of
his life. It was an innocuous looking complaint filed by one of the investor “RoshanLal”
(through National Housing Bank), nearly fifty two months ago that sent SEBI the stock
market watchdog on the trail of “illegal practices” followed by Sahara Group in raising
over Rs24000/- crore from more than 3 croes investors countrywide. In order to prove its
point; once Sahara sent 150 trucks containing 31669 cartons full of 3 more than crore
applications forms with 2 crore redemption vouchers to SEBI that caused a huge traffic jam
on the outskirts of Mumbai near the SEBI’s head office. Subrata Roy claims that Sahara
Group is the third largest employer in India, after the Indian Railways & Indian Army. He
enjoys a lavish lifestyle owning high end luxury cars, private Jets, expansive houses spread
over hundreds of acres in Sahara city with a huge golf course and air strip. The episode
popularly known as the high profile SEBI-SAHARA Case has all the trappings of becoming
the number-one corporate fraud.
The case has made some jargons like OFCDs, DHRP, RHP, and certain investors like
Kalawati, Hardwar, and RoshanLal famous overnoght. To bring out an IPO, Sahara Prime
City a real estate venture of the group filed a Draft Red Herring Prospectus (DRHP) with
SEBI on 30th September 2009. While scanning the DRHP, SEBI suspected certain large scale
fund raising by 2 Sahara Companies namely Sahara India Real Estate Corp Ltd, (SIRECL)
and Sahara Housing Investment Corp Ltd, (SHICL). SEBI also received two complaints, one
on 25th December 2009, and the second on 4th January 2010 about illegal issue of
Optionally Fully Convertible Debenture (OFCDs) by these 2 Companies to the public
throughout the country. After receiving the complaints SEBI asked for the clarifications
from Sahara Group initially through their investment bankers “Enam Securities” and later
directly. The investigations revealed that the OFCDs were issued after filing DRHP with the
Registrar of Companies (ROC.) While it is incumbent upon a company to take permission of
SEBI to issue any securities to 50 or more persons, no such permission was taken.
ISSN 2277 8675 DMIETR International Journal on Financial Management (ejournal) Page 25
Eventually SEBI passed an interim order against these two companies on 24th November
2010, asking them to refund the money collected from the investors. A final order was passed
by the regulator on 23rd June 2011. Sahara Group challenged these orders before the
Securities Appellate Tribunal (SAT), but the Tribunal upheld the SEBI orders on 18th October
2011, and asked the two companies to refund Rs 25,781 crore to over 3 crore investors. The
group moved the Supreme Court which also passed the historic order on 31st August 2012,
asking the two companies to deposit Rs 24,000 crore with SEBI for refund to investors. The
group was also asked to furnish details of investors with SEBI which was mandated to refund
the money after verifying their genuineness. As Sahara did not comply, SEBI again moved
SC. The apex court passed another order on 5th December, 2012, and asked the group to
deposit the money in 3 installments with immediate payment of Rs5120 crore. While the
group paid the first installment, it failed to meet the deadline for other 2 installment and
claimed to have already paid Rs 20,000 crore directly to the investors. SEBI did not get
convinced so it passed another order on 13th February 2013, to attach bank accounts and other
properties of the group and later issued summons for the personal appearance of Subrata Roy
and other three Directors before it. Subrata Roy with other Directors appeared before SEBI,
on 10th April, 2013, after which he famously told media that he was not even offered tea by
SEBI officials. In the same month SEBI finally closed the file of Sahara Prime City, who had
planned an IPO. In the meantime Sahara started issuing full page/multi page advertisements
in the newspapers claiming to have cleared bulk of the liabilities of the bondholders. It also
claimed to have raised Rs225,000crore funds since inception. The group charged that SEBI
was making baseless allegation against it, and accused it for not accepting 60 truckloads of
documents, while SEBI countered the allegations by saying that the documents sent were
“hopelessly mixed-up”.
SEBI furthermore issued public notices in newspapers cautioning investors and general
public against dealing with SAHARAs. The regulator also asked various financial institutions
and banks to freeze all accounts of the group, besides writing to District Collectors/other
authorities for attachment of land, real estate and Sahara’s other properties. It sent similar
letters to Tax Departments and other agencies like enforcement Directorate also. When SEBI,
started an exercise to refund money to genuine investors from Rs5120/- crore deposited by
SAHARAs it stumbled upon instances of multiple accounts, false addresses giving suspicion
to the bogus cases of investors.
3. THE LEGAL ASPECTS OF THE SAHARA - SEBI CASE:
The latest incident is arising out of the contempt petition filed by SEBI for non compliance
by SAHARA, of the Supreme Court’s order passed on 31st August 2012.
3.1 SEBI’s POINT OF VIEW:
Issue of Jurisdiction: OFCDs by the company was a public issue since the
securities had been offered to more than 50 persons. The issue was therefore
required to be listed on a stock exchange. The Additional Solicitor General
(ASG), on behalf Ministry of Company Affairs (MCA), supported SEBI’s
ISSN 2277 8675 DMIETR International Journal on Financial Management (ejournal) Page 26
argument and said that SEBI had the jurisdiction in the matter. In appeal SAT on
18th October, 2011, while dismissing the appeal by the two firms of Sahara,
concluded that the OFCDs were “securities” and it was a public issue requiring
mandatory listing and SEBI has the jurisdiction over all kinds of securities,
whether listed or not.
Complaints: Nearly 2000-3000 investors have filed complaints with SEBI.
Manipulation of value of Assets: According to the details of assets submitted by
SAHARA the major assets i.e. land is undeveloped and it has been overvalued
exorbitantly thus showing the value of assets many times higher than the
liabilities.
Genuineness of Investors: For ascertaining the genuineness of investor’s
documents, SEBI sent out redemption notices inviting claims to more than 21,000
bondholders but received less than 300 claims; more than 7,000 notices returned
undelivered and no response from over 13,000 notices. Thus nearly 99% of the
bondholders were untraceable and the situation has not improved much since then.
Delay tactics/inability to refund: SAHARA unable to repay the money is
adopting delay tactics and playing the emotional card.
Diversion of Funds: SEBI did not get satisfactory explanation to the payments
made by Sahara Credit Cooperative Society (Rs 13,366 crore), Sahara India
Commercial Corp Ltd (Rs 4,384 crore), Sahara Q Shop (Rs 2,258 crore), Ketak
City Homes (Rs 19 crore) and Kirit City Homes (Rs 44 crore) on behalf of Sahara
India Real Estate Corp Ltd. Similarly, Sahara could not explain payments of Rs
2,479 crore by SICCL and Rs 2,412 crore by Sahara Q Shop on behalf of Sahara
Housing Investment Corp Ltd.
Discovery of irregularities: In a DRHP filed by Sahara Prime City Limited with
SEBI, it was disclosed that two companies had issued OFCDs, in contravention of
the provisions of the Companies Act, the SEBI Act, SEBI’s Disclosure and
Investor Protection Guidelines, 2000 and the SEBI Issue of Capital and Disclosure
Requirements Regulations, 2009. To protect investors and to prevent the company
from collecting further funds, the regulator passed an ex-parte order on November
24, 2010 restraining the companies from further offerings of OFCDs, any other
securities to public.
3.2 SAHARA’s POINT OF VIEW:
Not a single investor has filed a complaint with SEBI.
Case is damaging the reputation of SAHARA. It is a question of livelihood of 14
lakh employees of group.
ISSN 2277 8675 DMIETR International Journal on Financial Management (ejournal) Page 27
As both the companies are unlisted SEBI has no jurisdiction over them. For
issuing OFCD, Sahara complied with all the applicable provisions of the
Companies Act 1956.
Hon’ble Justice K.S.Radhakrishanan, and J.S.Khehar did not give
opportunity to SAHARA to present their side based on facts, avoided all points
from true legal perspective, and meted out stringent punishment with retrospective
effect, by saying investors are fictitious.
Mohan Parasaran then Addl SG (later became SG of India), and Dr. Ashok
Nigam ASG said to an query raised by Ministry of Corporate Affairs (MCA), that
SAHARA was right & SEBI was wrong.
As per Section 55A(c), of the Companies Act 1956, it is not necessary for
un-listed company to get registered with SEBI even when the number of investors
is more than 50. It is necessary to get registered with Registrar of Companies,
(ROC) only and SAHARA followed that provision.
SAHARA also claims that SC ignored other sections like- Sec 60 B(9) and Sec
81(1-A) of The Companies Act, 1956, Sec 28 1B of Securities Contract
Regulation (SCR) Act,1956, and Unlisted Companies Rules 2003; etc.,
3.3 INTERPRETATION & SUPREME COURT’s HISTORIC ORDER:
3.4 INTERPRETATION- The Questions of Law:
FaliNariman, Senior counsel for Sahara, submitted that the powers of SEBI U/Sec
55A, are limited to the listed companies and public companies which intend to get
listed on any recognized stock exchange, and, in any other case, the power of
administration of Sections 56, 62, 63 and 73 is vested only with the Central
Government (ROC). He also contended that there was no statutory requirement for
SIRECL to list OFCDs on any recognized stock exchange under the provisions of
2003 Rules.
ArvindDattar, Senior counsel appearing on behalf of SEBI, pointed out that once
the number reaches fifty, proviso to Section 67(3) applies and it is a public issue,
attracting Section 73(1) and an application for listing becomes mandatory and,
thereafter the jurisdiction vests with SEBI u/s 55A. Under Section 11(1) of the
SEBI Act, SEBI is duty bound to protect the interest of investors in securities either
listed or which are required by law to be listed.
HarinRawal, Additional Solicitor General appearing on behalf of Union of India
supported the stand taken by SEBI.
JJ K. S. Radhakrishanan, and J. S. Khehar- Interpretation and applicability of
Sec55A 7 other sections of Companies Act, Sec11A of SEBI Act. Section 55A
specifically refers to Sections 55 to 58 and Sections 59 to 81 with an emphasis to
ISSN 2277 8675 DMIETR International Journal on Financial Management (ejournal) Page 28
Sections 68A, 77A and 80A within brackets. Contention raised by Sahara that
without regulations being framed under Section 642(4) of the companies Act, SEBI
cannot exercise powers of administration, is totally unfounded and is rejected.
SC referred the corporate frauds in the past by Harshad Mehta, a Broker, to the
tune of Rs.4000 crores between 1991-92; Ketan Parekh Securities Scam- 2001 in
which investors had lost heavily; UTI scam 2001, where heavy funds were
collected from small investors and used to fund large business houses and
investment made in junk bonds; Satyam Computers -2008, where over a number of
years, accounts were manipulated and money was raised through shares.
The JJs observed, Public companies and private companies, functioning under the
Companies Act 2006 in England, and the Companies Act 1956 in India, have
considerable social and economic importance, but Public companies are more strictly
regulated than Private companies, as Private companies are not authorized to offer any
securities to the public
SEBI Act is special dealing with specific subject, which has to be read in harmony
with the Companies Act 1956. In fact, 2002 Amendment to the SEBI Act further
re-emphasize that some of the provisions of the Act will continue to operate without
prejudice to the provisions of the Companies Act, qua few provisions. Both the Acts
will have to work in tandem, in the interest of investors, especially when public
money is raised by the issue of securities from the people at large.
OFCDs issued by Sahara were public issue of debentures, hence securities. As the
offer was made to fifty or more persons, it was mandatory to follow the legal
requirements of listing. Once the number forty nine is crossed, the proviso to Section
67(3) kicks in and it is an issue to the public, which attracts Section 73(1) and an
application for listing becomes mandatory which fall under the administration of
SEBI under Section 55A(1)(b) of the Companies Act.
SEBI has a duty under Section 11A of the SEBI Act to protect the interests of
investors in securities either listed or which are required to be listed under the law or
intended to be listed. SEBI, in the facts and circumstances of the case, has rightly
claimed jurisdiction over the OFCDs issued by Sahara. The Group have no right to
collect Rs.27,000 crores from 3 crore investors, without complying with any
regulatory provisions contained in the Companies Act, SEBI Act, Rules and
Regulations.
The orders passed by SEBI (WTM) dated 23.6.2011 and SAT dated 18.10.2011 are
accordingly upheld. The order passed by this Court in C.A. No.9813 of 2011 filed by
SIREC and in C.A. No.9833 of 2011 filed by SHICL, praying for extending the time
for refund of the amount of Rs.17,400 crore, as ordered by SAT, stands vacated.
A perusal of section 11 A, leaves no room for any doubt, that the authority of SEBI
extends to issue of prospectuses, offer documents, including advertisements, for the
ISSN 2277 8675 DMIETR International Journal on Financial Management (ejournal) Page 29
issue of securities etc. For the exercise of such power SEBI has been vested with the
authority to make regulations
3.5 THE SUPREME COURT’s HISTORIC ORDER: The decision was
delivered by Hon’ble JJs K.S.Radhakrishanan, and J.S.Khehar on 31st
August 2012.
Sahara (SIRECL & SHICL) would refund the amounts collected through RHPs dated
13.3.2008 and 16.10.2009 along with interest @ 15% per annum to within a period of
three months from today, be deposited in a Nationalized Bank bearing maximum rate
of interest.
Sahara to furnish the details with supporting documents to establish whether they had
refunded any amount to the persons; within a period of 10 days from the
pronouncement of this order and it is for the SEBI (WTM) to examine the correctness
of the details furnished.
If the documents produced by Saharas are not found genuine or acceptable, then the
SEBI (WTM) would proceed as if the Sahara had not refunded any amount to the real
and genuine subscribers.
Saharas are directed to furnish all documents, to SEBI so as to enable it to ascertain
the genuineness of the subscribers as well as the amounts deposited, within a period
of 10 days from this order.
SEBI (WTM) shall have the liberty to engage Investigating Officers, experts in
Finance and Accounts and other supporting staff to carry out directions, examine the
documents produced by Sahara to ascertain their genuineness; and the expenses for
the same will be borne by Sahara.
In the event of finding that the genuineness of the subscribers is doubtful, an
opportunity shall be afforded to Sahara to prove the same as being legitimate. The
decision of SEBI (WTM) will be final and binding on Sahara and the subscribers.
SEBI (WTM) if, after the verification of the details furnished, is unable to find out the
whereabouts of all or any of the subscribers, then the amount so collected will be
appropriated to the Government of India.
We also appoint Mr. Justice B.N. Agrawal, a retired Judge of this Court to oversee
whether directions issued by this Court are properly and effectively complied with by
the SEBI (WTM) from the date of this order.
If Sahara fails to comply with these directions and do not refund money, SEBI can
take recourse to all legal remedies, including attachment and sale of properties,
freezing of bank accounts etc. for realizations of the amounts.
SEBI(WTM) will submit a status report, duly approved by Mr. Justice B.N. Agrawal,
expeditiously.
ISSN 2277 8675 DMIETR International Journal on Financial Management (ejournal) Page 30
Appeals are accordingly dismissed subject to the above directions. However, there
will be no order as to costs. We record our deep appreciation for the valuable
assistance rendered by learned senior counsel appearing on either side for resolving
the very intricate and interesting questions of law which arose for our consideration in
these appeals.
4. SUMMARY AND CONCLUSIONS:
4.1 The Supreme Court (SC) summoned Subrata Roy, but he did not appear on the pretext of
critical illness of his 92 year old mother, which angered the Apex Court and a NBW (Non
Bail-able Warrant) was issued. After a high voltage drama the NBW could not be executed by
Lucknow (UP) police on 26/02/2014. Subrata Roy himself surrendered on 27/02/2014; was
lodged in a forest department guest house with VIP facilities. He was brought to Delhi by
road and produced before SC on 04/03/2014. The SC was very unhappy as Subrata Roy did
not comply with SEBI’s order for one-and-a half year. The Hon SC Judges asked him about
the plan for repayment of Rs20000/- crore, with 15% interest, and said “you sell, mortgage
your assets, take loans, that are your headache”. Subrata Roy begged pardon, swore by 37
year long impeccable group’s record, and said he will sell all his personal property if
necessary, to return the investor’s money but SC was not satisfied with the reply and
remanded him and 2 other Directors, to Judicial custody till 11/03/2014. Subrata Roy was
lodged in TIHAR JAIL and treated like an ordinary inmate. The case will also be
remembered as one Manoj Sharma, 36, former lawyer from Gwalior splashed back ink on
Subrata Roy’s face inside the court room. SEBI discovered that many investors are
untraceable, have bogus identity/addresses which could add another dimension to the case i.e.
fraud. Subrata Roy is a destiny’s child, what a paradox the jet setting boss of Sahara,
hobnobbing with sports cars and glamour world, had to spent time in Jail. To get Subrata Roy
out of the jail early; on 07/03/2014, Sahara’s advocate submitted a proposal before SC- “That
within 3 days of lifting the restrictions on bank accounts, Sahara will deposit Rs 2500 crore
and pay balance Rs 14,900 crore in installments up to July, 2015”. SEBI opposed to the
proposal saying Sahara has to pay Rs 34,000 crore. This angered the Apex court, which
termed the proposal insulting and refused to give any early relief. The case came up for
hearing on 13/03/2014, but was adjourned till 25/03/2014.
4.2 The history of Sahara given in Para 1; shows Group’s financial strengths and various
diversified activities. The case has many emotional dimensions. Every time SEBI passed the
order to refund money Sahara Group would issue 2-3 full page clarification in almost all the
Regional and National newspapers published in major cities, playing the card of Patriotism
and convincing the public that investors’ money was safe. For instance on 1st December, 2012,
Sahara issued the clarifications in 879 editions of 227 newspapers nationwide. Sahara also
published a White Paper. In the explanation Sahara would often mention about the huge
LANDBANK as a security. According to some experts most of the land is undeveloped but
has been overvalued exorbitantly thus showing the value of assets several times more than
the liabilities. The explanation would also project Subrata Roy as the great patriot, Sahara
Group as the third largest employer in India adding a poignant twist to the case. Besides
legality of OFCDs, the other major issues are the genuineness of investors, diversion of funds
ISSN 2277 8675 DMIETR International Journal on Financial Management (ejournal) Page 31
and financial capacity to refund the money. It appears that Sahara is sitting on a
TIME-BOMB that could explode any moment if the Group does not refund the money of
investors and the case may cause irretrievable damage to the Group and the Indian Corporate
sector.
References:-
1] Article “SEBI-SAHARA CASE” by PTI Feb 28/02/2014. (The Hitavada 01/03/2014)
2] Corporate PPT Presentation by SAHARA Group.
3] Economic Times; Hitavada, Indian Express. The Hindu.
4] Financial Express 9/3/2014. ENS Economic Bureau , New Delhi, Updated: Mar 01 2014,
5] India Today, Commerce. Industrial Times, Business World, E-Business ICFAI Journal
Nov 2011.
6] Supreme Court’s Judgment dt 13th August,2012.
7] The Times of India (news articles of various dates, from 3rd to 11th March, 2014)
8] White Paper-SEBI-SAHARA Issue- published by SAHARA Group.
Web sites:-
www.sahara.in; www.saharyanforum.com; www.saharamotionpictures.com;
www.saharaqshop.com; www.saharastar.com; www.aambyvalley.com;
www.saharalife.comwww.saharahousingfina.com; http://en.wikipedia.org;
http://www.sebi.gov.in/sebiweb/
http://www.lawnotes.in/Sahara_India_Real_Estate_Corporation_Limited_and_Ors._vs_Secur
ities_and_Exchange_Board_of_India_and_Anr.#ixzz2vTBJKp7K
ISSN 2277 8675 DMIETR International Journal on Financial Management (ejournal) Page 32
ANALYSIS OF PROFITABILITY RATIOS OF FMCG
COMPANIES OPERATING IN INDIA
Dr. HimanshuTiwari
Assistant Professor
DattaMeghe Institute of Management Studies, Atrey Layout, Nagpur
Prof.FakhruddinSunelwala
Assistant Professor
DattaMeghe Institute of Management Studies, Atrey Layout, Nagpur
Abstract
Finance is required by the business people for its day to day operations. It is
considered as heart for every business firm. Every firm is worried with its profitability.
Profitability ratio is one of the most frequently used tools of financial ratio analysisto
measure the company’sbottom line and its return to its investors. It measures are important to
company promoters andowners as well. If a small business hasexternal investors who have
invested their own money into the company, the promoters certainly have to gain profits to
maintain the interest of those investors. To evaluate the firm’s abilityto create
incomeProfitability ratios are used. Analysis of profit is of crucial concern toinvestors
because they get revenue in the form of dividends.Profits are also very important to creditors
because profit is one sourceof funds for liability.
Key Words: Profitability, Profitability ratios
Introduction
Indian FMCG Sector
Products which have a swift turnover and relatively low cost are known as Fast
Moving Consumer Goods (FMCG). FMCG items are those which generally get replaced
inside a year. Examples of FMCG commonly include a wide range of constantly purchased
consumer products such asoral care, soap, cosmetics, toiletries , shaving products, detergents,
glassware, bulbs, batteries, paper products, and plastic goods. FMCG may also include
pharmaceuticals, consumer electronics, packaged food products etc.
Some of the Global companies in the FMCG industry are Nestlé, ITC, Hindustan
Unilever Limited, Procter & Gamble, Coca-Cola, Carlsberg, Pepsi, Gillette etc. The middle
class Indian population as well as the rural sector presents a huge potential for this sector. The
FMCG sector in India is at present, the fourth largest sector with a total market size of around
ISSN 2277 8675 DMIETR International Journal on Financial Management (ejournal) Page 33
USD 13 billion as of 2012. This sector is likely to grow to a USD 33 billion industry by 2015
and to USD 100 billion by the year 2025. This sector is characterized by strong MNC
existence and a well established distribution network. Easy availability of raw materials as
well as cheap labour in India makes it an ideal destination for this sector.
Profile of Selected Companies
Hindustan Unilever Limited
Hindustan Unilever Ltd was incorporated as Lever Brothers India Ltd in 1922. Two
Unilever subsidiaries, Hindustan Vanaspati Manufacturing Company and United Traders,
were merged with Lever Brothers India in 1956 and the merged entity was rechristened
‘Hindustan Lever Ltd’. In June 2007, the company’s name was changed to ‘Hindustan
Unilever Ltd’ to reflect its global identity. Parent, Unilever holds 51.43 per cent equity in the
company. HUL made a host of acquisitions, mostly global, by parent company Unilever.
Prominent among them were: Tata Oil Mills Company was merged with HUL in 1993.
Brooke Bond Lipton India was merged with the company in 1996 after these international tea
brands were earlier acquired by its parent company. The merger, also, brought Kothari
General Foods, Kissan and Dollops Ice cream business into HUL’s fray. International Best
Foods was acquired in 2001 subsequent to the international acquisition of Best Foods, USA
by Unilever. In 2003, HUL acquired the cooked shrimp and pasteurized crabmeat business of
the Amalgam Group of Companies.
Nestle India Ltd
It set up its first factory at Moga, Punjab in 1961. However, the company's history
goes back to 1912, when it began importing and selling products in India under the name of
`The Nestle Anglo Swiss Condensed Milk Company (Export) Limited'.Its milk products &
nutrition’s portfolio encompasses a wide range of products right from milk and skimmed
milk to value added products like condensed milk, curd, ghee, yogurt and raita. These
products are sold under various popular brands -- Nestle Everyday, Nestle Milkmaid, Nestle
Milk, Nestle Fresh n Natural etc. Owner of the most famous Cerelac brand, Nestle India
enjoys the leadership position in infant milk foods business with a market share of 68.4 per
cent 2006--07.Under its beverages segment, Nestle India mainly sells instant coffee. Its
coffee is sold under three brands -- Nestle Classic, Nescafe Sunrise and Nescafe 3 in 1.
Besides, it sells a malted chocolate drink, Nestle Milo. Nestle's Maggi 2--Minute Noodles has
become an almost synonymous name for instant noodles in India.
ISSN 2277 8675 DMIETR International Journal on Financial Management (ejournal) Page 34
Dabur India Ltd
Established in 1884 by Dr.S.K.Burman, Dabur India has business interests in health care,
personal care and food products. The company derives 85 per cent of its revenues from herbal
business. Dabur has eight manufacturing locations in the country and a strong distribution
network comprising of 2.5 million retail outlets. Dabur operates through three segments in
India: consumer care division (comprising FMCG products), consumer health division
(comprising traditional ayurvedic products) and food division. The consumer care division
caters to seven distinct segments - hair care, oral care, health supplements, digestives, home
care and skin & baby care. The company's offering in the skin care category includes
Gulabari rose water and in baby care portfolio Dabur's flagship products are Gripe water,
Janamghunti and Lal tail. Dabur entered the home care segment in 2005--06 through Balsara
acquisition.
Dabur Foods division offers products under three brands – Activ, Real&Hommade.
Dabur offers over 260 medicines and has a strong distribution coverage including 1,00,000
chemists, 12,000 vaidyas and 12,000 ayurvedic pharmacies.
Ratio Analysis
By financial ratios we mean taking a financial figure and looking at it relative to
another financial figure. These ratios simplify the process of determining the health of a listed
company and make reported financial information more meaningful and useful for investors.
In this research paper I have focused on profitability ratio. Understanding these ratio will go a
long way to providing you with an idea of how a company is performing in relation to key
measures of business success. Financial ratios are tools to help with the interpretation of
results and to allow for comparison to previous years, other companies and the industry sector.
Fundamental analysis and financial ratio analysis must form the basis of all investment
decisions, because without knowing the true financial position of a company you are purely
speculating.
Profitability Ratio
Profitability ratios measure a company’s performance and provide an indication of its ability
to generate profits. As profits are used to fund business development and pay dividends to
shareholders, a company’s profitability and how efficient it is at generating profits is an
important consideration for shareholders.
The general profitability ratios are as follows:
Gross Profit (GP) Ratio
ISSN 2277 8675 DMIETR International Journal on Financial Management (ejournal) Page 35
Net Profit (NP)Ratio
Operating Profit (OP) Ratio.
Operating Expenses (OE) Ratio.
Operating Ratio
Literature Review
Dr. S.K. khartiktitto Varghese, (2011) they found the profitability more or less
depends upon the better utilization of resources and to manpower. It is worthwhile to increase
production capacity and use advance technology to cut down cost of production and wage
cost in order to increase profitability, not only against the investment, but also for investor’s
return points of view.
Eljelly (2004) elucidate, that efficient liquidity management involves planning and
controlling current assets and current liabilities in such a manner that eliminates the risk of
inability to meet due short-term obligations and avoids excessive investment in these assets.
The study found that the cash conversion cycle was of more importance as a measure of
liquidity than the current ratio that affects profitability.
Vijayakumar and Venkatachalan (2003) In their study indicated a moderate trend in
the financial position and the utilization of working capital, variations in working capital size
should be avoided attempts should also be made to use funds more effectively, by keeping an
optimum level of working capital. Because, keeping more current assets cause a reduction in
profitability. Hence, efforts should be made to ensure a positive trend in the estimation and
maintenance of the working capital.
Marc Deloof (2003) stated that the companies have large amount of cash invested in
working capital. It can therefore be expected that the way in which working capital is
managed will havea significant impact on the profitability of companies.
Saravanan (2001) made a study on working capital management in ten selected
non-banking financial companies. For this study the employed several statistical tools on
different ratio is to examine the effective management of working capital.
Shine and Soemen (1998) found that there is a strong negative relation between the
cash conversion cycle and corporate profitability for a large sample of listed American
companies for the 1975-1994 periods.
Asha (1987) of reserve bank of India had worked out the required norms and
techniques for evaluating the performance of public sectors banks. She has reinvaded the
different techniques adopted by different agencies and criteria for evaluating the banking
ISSN 2277 8675 DMIETR International Journal on Financial Management (ejournal) Page 36
performance. The empirical findings of her study shows a positive trend in terms of opening
new branches deposits mobilization and advances over a period.
Asha Sharma and R.B. Sharma2011, These attempts identify and study the movement
of key financial parameters and their relationship with profitability of textile industry. It is an
attempt to and the study whether the key identified parameters move in a synchronous way
going up and coming down with basic profitability parameters. All three comparably
profit-making companies have been taken as the sample for the study for the period of
2006to2010.
Aubrylyimo, Dr.Reubenj.LmwamakimbullahkikoF.S.Hamza, (2010) they found costs
resulting from poles being rejected, reworked or down-graded were the highest at the study
mill. The cost of quality were so high and as a result they negatively affect the financial
performance of the mill.-cost of quality and its effect on company‟s profitability, the amount
accrued from costs of quality was too high to reject the null hypothesis which claimed that
costs of quality impacts negatively the profitability of the company. (P.value-0.4582).
Objective
The objective of the study is to evaluate the profitability of the selected FMCG companies.
Hypothesis
The amount of profitability Trend value of PBT as % of total income is the same.
The amount of profitability Trend value of PAT as % of total income is the same.
The amount of profitability Trend value of PAT as % of net worth is the same.
The amount of profitability Trend value of cash profit as % of net worth is the same.
Research Methodology
The study is based on the secondary data and has been collected from the financial statements
(2008 - 2012) through prowess of selected FMCG companies. The FMCG companies are
selected on random basis. The selected companies are Hindustan Unilever Limited, Dabur
India Limited and Nestle India Limited.The secondary data is also collected using journals,
websites etc.
The data have been analysed using ANOVA. The abbreviations used are SS=sum of squares,
D.F=degree of freedom, MSS=mean sum of squares, F cal=calculated value of F. and Ft
=critical value of F ratio at 5% level, are calculated and mentioned in the table to draw
outcome.
Data Analysis
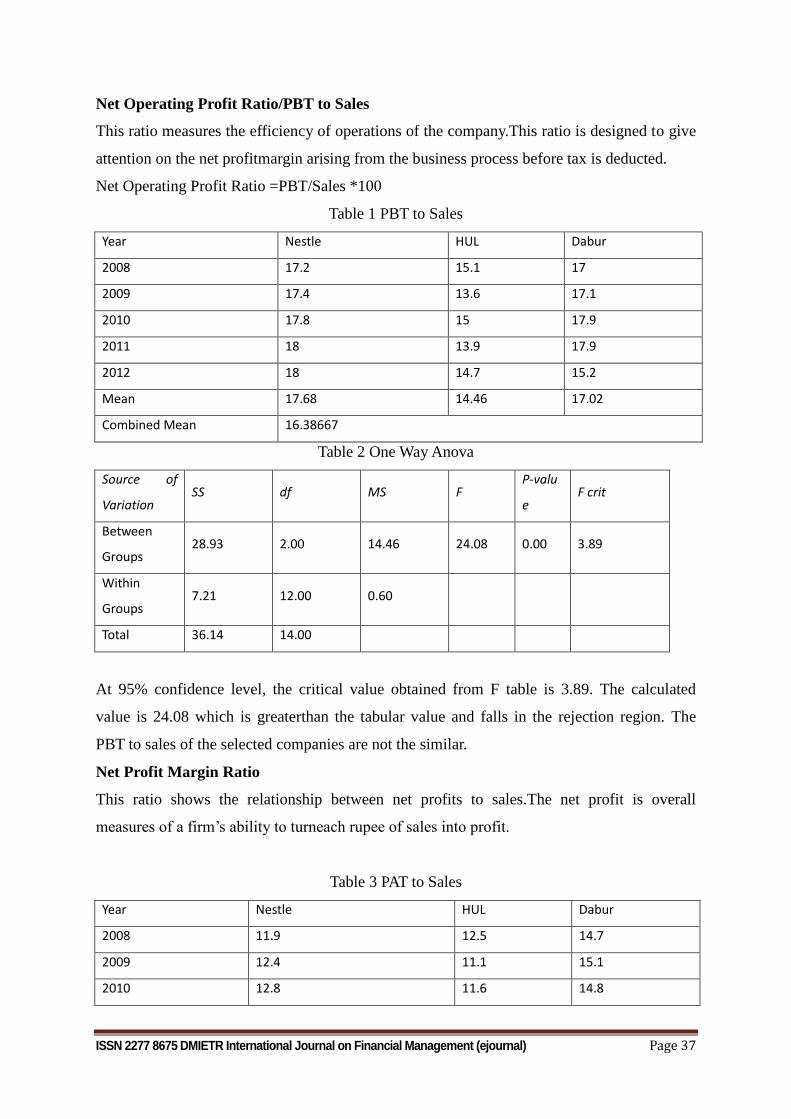
ISSN 2277 8675 DMIETR International Journal on Financial Management (ejournal) Page 37
Net Operating Profit Ratio/PBT to Sales
This ratio measures the efficiency of operations of the company.This ratio is designed to give
attention on the net profitmargin arising from the business process before tax is deducted.
Net Operating Profit Ratio =PBT/Sales *100
Table 1 PBT to Sales
Year Nestle HUL Dabur
2008 17.2 15.1 17
2009 17.4 13.6 17.1
2010 17.8 15 17.9
2011 18 13.9 17.9
2012 18 14.7 15.2
Mean 17.68 14.46 17.02
Combined Mean 16.38667
Table 2 One Way Anova
Source of
Variation SS df MS F
P-valu
e F crit
Between
Groups 28.93 2.00 14.46 24.08 0.00 3.89
Within
Groups 7.21 12.00 0.60
Total 36.14 14.00
At 95% confidence level, the critical value obtained from F table is 3.89. The calculated
value is 24.08 which is greaterthan the tabular value and falls in the rejection region. The
PBT to sales of the selected companies are not the similar.
Net Profit Margin Ratio
This ratio shows the relationship between net profits to sales.The net profit is overall
measures of a firm’s ability to turneach rupee of sales into profit.
Table 3 PAT to Sales
Year Nestle HUL Dabur
2008 11.9 12.5 14.7
2009 12.4 11.1 15.1
2010 12.8 11.6 14.8
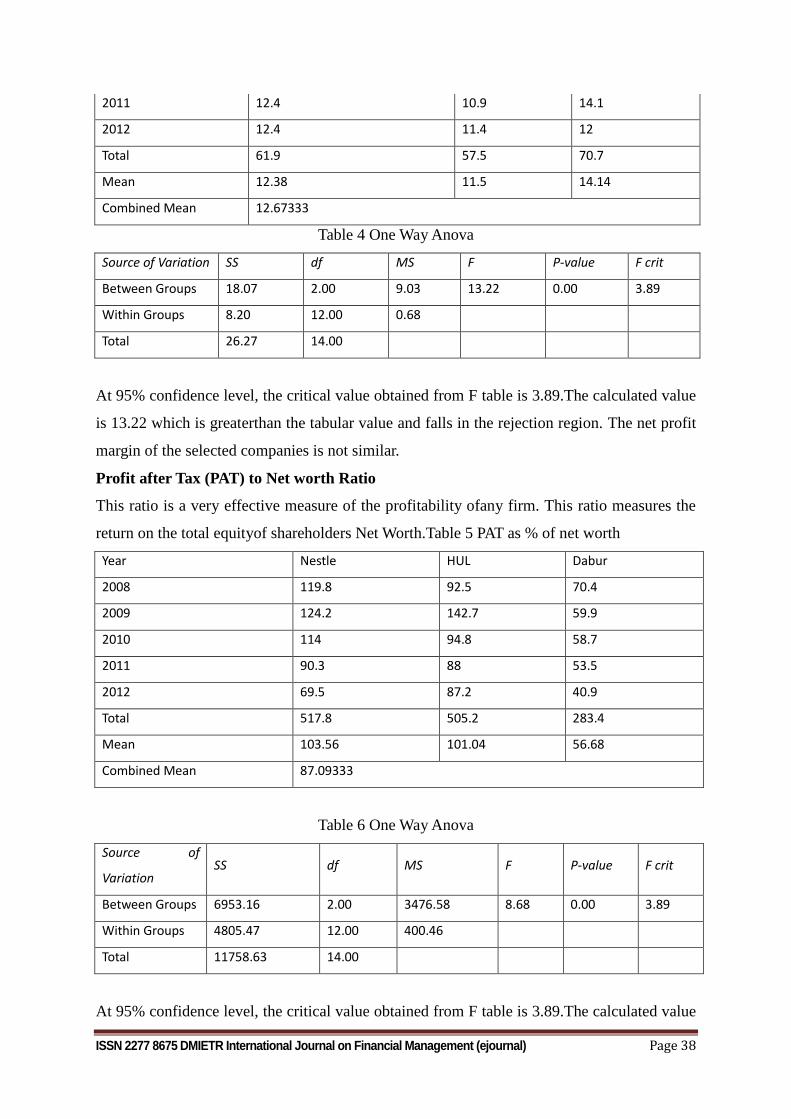
ISSN 2277 8675 DMIETR International Journal on Financial Management (ejournal) Page 38
2011 12.4 10.9 14.1
2012 12.4 11.4 12
Total 61.9 57.5 70.7
Mean 12.38 11.5 14.14
Combined Mean 12.67333
Table 4 One Way Anova
Source of Variation SS df MS F P-value F crit
Between Groups 18.07 2.00 9.03 13.22 0.00 3.89
Within Groups 8.20 12.00 0.68
Total 26.27 14.00
At 95% confidence level, the critical value obtained from F table is 3.89.The calculated value
is 13.22 which is greaterthan the tabular value and falls in the rejection region. The net profit
margin of the selected companies is not similar.
Profit after Tax (PAT) to Net worth Ratio
This ratio is a very effective measure of the profitability ofany firm. This ratio measures the
return on the total equityof shareholders Net Worth.Table 5 PAT as % of net worth
Year Nestle HUL Dabur
2008 119.8 92.5 70.4
2009 124.2 142.7 59.9
2010 114 94.8 58.7
2011 90.3 88 53.5
2012 69.5 87.2 40.9
Total 517.8 505.2 283.4
Mean 103.56 101.04 56.68
Combined Mean 87.09333
Table 6 One Way Anova
Source of
Variation SS df MS F P-value F crit
Between Groups 6953.16 2.00 3476.58 8.68 0.00 3.89
Within Groups 4805.47 12.00 400.46
Total 11758.63 14.00
At 95% confidence level, the critical value obtained from F table is 3.89.The calculated value
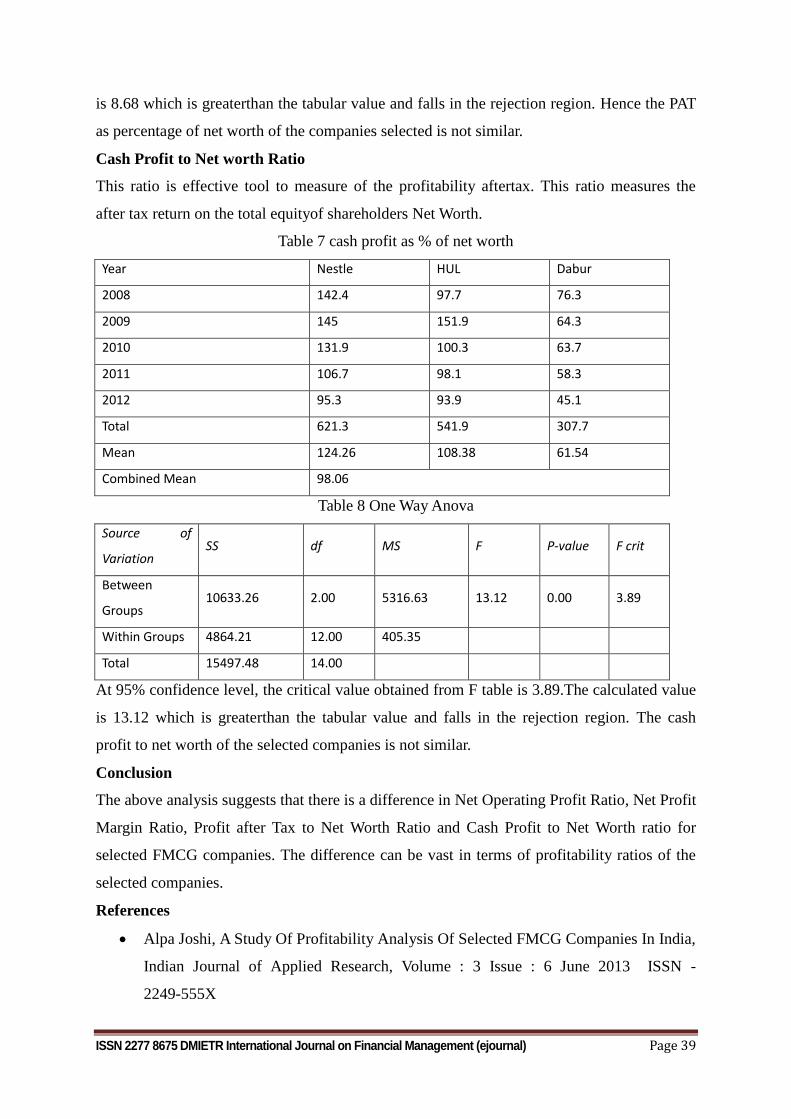
ISSN 2277 8675 DMIETR International Journal on Financial Management (ejournal) Page 39
is 8.68 which is greaterthan the tabular value and falls in the rejection region. Hence the PAT
as percentage of net worth of the companies selected is not similar.
Cash Profit to Net worth Ratio
This ratio is effective tool to measure of the profitability aftertax. This ratio measures the
after tax return on the total equityof shareholders Net Worth.
Table 7 cash profit as % of net worth
Year Nestle HUL Dabur
2008 142.4 97.7 76.3
2009 145 151.9 64.3
2010 131.9 100.3 63.7
2011 106.7 98.1 58.3
2012 95.3 93.9 45.1
Total 621.3 541.9 307.7
Mean 124.26 108.38 61.54
Combined Mean 98.06
Table 8 One Way Anova
Source of
Variation SS df MS F P-value F crit
Between
Groups 10633.26 2.00 5316.63 13.12 0.00 3.89
Within Groups 4864.21 12.00 405.35
Total 15497.48 14.00
At 95% confidence level, the critical value obtained from F table is 3.89.The calculated value
is 13.12 which is greaterthan the tabular value and falls in the rejection region. The cash
profit to net worth of the selected companies is not similar.
Conclusion
The above analysis suggests that there is a difference in Net Operating Profit Ratio, Net Profit
Margin Ratio, Profit after Tax to Net Worth Ratio and Cash Profit to Net Worth ratio for
selected FMCG companies. The difference can be vast in terms of profitability ratios of the
selected companies.
References
Alpa Joshi, A Study Of Profitability Analysis Of Selected FMCG Companies In India,
Indian Journal of Applied Research, Volume : 3 Issue : 6 June 2013 ISSN -
2249-555X
ISSN 2277 8675 DMIETR International Journal on Financial Management (ejournal) Page 40
Asha, “Evaluation of Performance of Commercial Banks Norms and Techniques”
Bank Economist Met, 1987 pp.147-169.
Asha Sharma and R.B. Sharma “Study on A Comparison Financial Performance in
Textile Industry”, International Journal on Business Management Economics and
Information Technology, Vol-3, No.1, January-June2011 pp.175-180.
Aubrylyimo, Dr.Reubenij.LMwamakimbullahkiko F.S. Hamza, “Conformity
Enhancement of Treated Wood Poles to Customer‟s Specifications for Improved
Performance and Profitability of a Treatment Plant”, I-Annual Journal of IMS
Ghaziabad Vol.7, No.2, July –December,2010,pp.19-28.
Dr. S.K. khartikTitto Varghese, Profitability Analysis of Public Sector Undertaking: A
Case Study of Hindustan Newsprint Limited (HNL), The Management Accountant,
November 2011. Vol.46. No.11, pp.1067-1073.
EljellyGrablowsky (2004), Working Capital Management, Journal of Small Business
Management, July. pp. 59-65.
Marc Deloof, „Does Working Capital Management Affect Profitability of the Firms
‟,vikalpa,April (2003), pp.537-585.
Saravanan, „„Working Capital Management in Non-Banking Financing Companies‟‟,
Business Analysis, 2001, pp.93-101.
Shine and Soemen, „Efficiency of Working Capital and Corporate Profitability‟
Finance India,Vol.8, No.2, (1998), pp.37-45
T. Venkatesan& Dr. S. K. Nagarajan, An Empirical Study Of Profitability Analysis Of
Selected Steel Companies In India, International Journal of Marketing, Financial
Services & Management ResearchVol.1 Issue 10, October 2012, ISSN 2277 3622
ISSN 2277 8675 DMIETR International Journal on Financial Management (ejournal) Page 41
FUNDAMENTAL ANALYSIS OF SELECTED
TELECOM COMPANIES IN INDIA WITH SPECIAL
REFERENCE TO Z SCORE MODEL TEST
Prof. KRUNAL PAREKH Prof. VINOD WAIKER
Asst. professor, Datta Meghe Institute of Management Studies, Nagpur
Mr. SYED NOORUDDIN MBA Student,
Datta Meghe Institute of Management Studies, Nagpur. MR. CHIRAG JOSHI
BM- Sharekhan, Nagpur.
ABSTRACT
The financial health of any company is usually a reflection of the health of the industry;
therefore, with the help of industry analysis, business owners can make appropriate strategy
which likely to help the business grow and perform consistently. Availability of financial
information can determine a company’s fiscal health which actually requires a systematic
analysis of company’s financials. In this research paper researcher try to capture the predictive
viability of a firm’s financial condition by using a combination of five financial ratios of Z
score model which ultimately depicts a score. This score (Z score) can be used as an effective
tool to analyze the financial health and credit worthiness of a company.
Telecom sector plays a crucial role in the Indian economy and has undergone various major
reforms and restructuring for better financial viability of the company and providing better
services to customers. This empirical analysis focused/concentrates on finding out the financial
health of select Telecom giants like BSNL, BhartiAirteland R-Com.
Keywords: Fiscal Health, Predictive Viability, Z score
1. INTRODUCTION
In today’s era IT plays a very important role in putting India on the global map. The telecom
network in India is the fifth largest network in the world and slated to an estimated contribution
of nearly 1% to India’s GDP. Indian Telecommunication industry ranked sixth among all the
telecommunication sectors in the world and fastest growing industries in the country. The
growing standard of living in India and the focused development of infrastructure by providing
various schemes by central and state government and connectivity are some of the mains
important reasons for the significant growth of the telecom industry in India.
In Today context, the telecom market in India enjoys a growth rate of more than 45 % which is
expected the highest in the whole world.Presently, there are 200 million plus telephone lines in
India which make India the third largest phone network in the world after China and the US.
2. RECENT TRENDS IN THE INDIA TELECOM MARKET
Telecom industry in the country have greatly benefited to the Indian economy. With IT
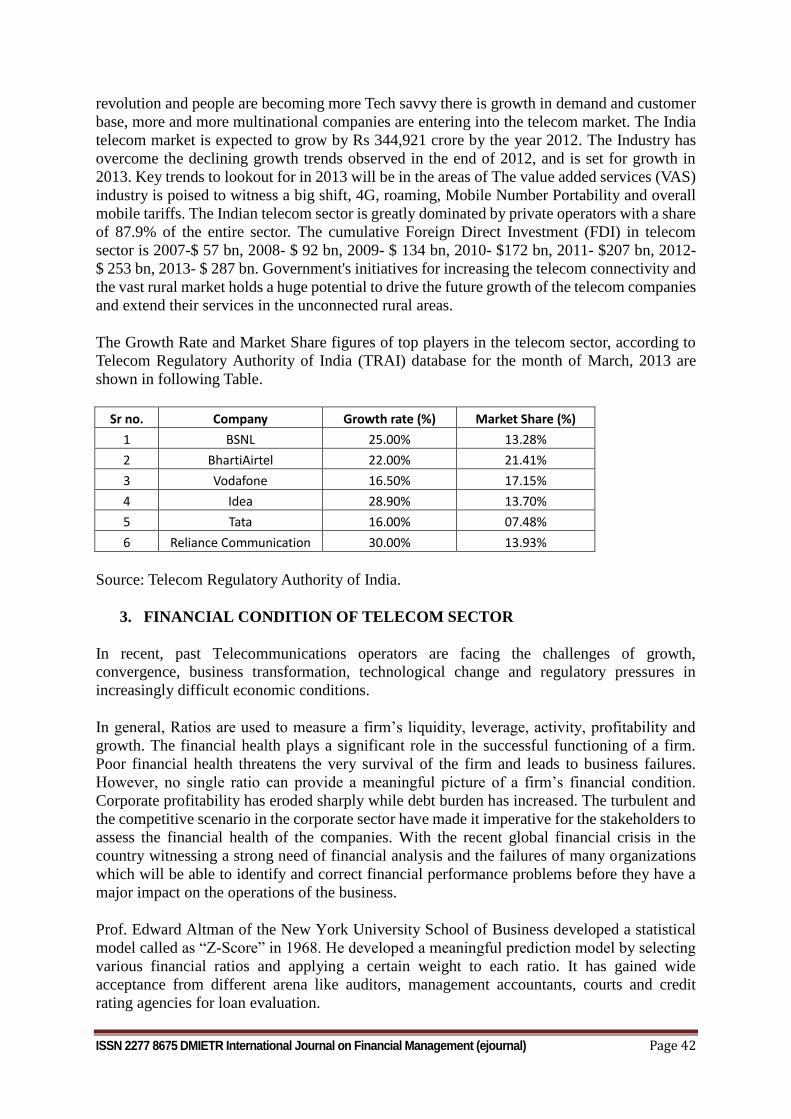
ISSN 2277 8675 DMIETR International Journal on Financial Management (ejournal) Page 42
revolution and people are becoming more Tech savvy there is growth in demand and customer
base, more and more multinational companies are entering into the telecom market. The India
telecom market is expected to grow by Rs 344,921 crore by the year 2012. The Industry has
overcome the declining growth trends observed in the end of 2012, and is set for growth in
2013. Key trends to lookout for in 2013 will be in the areas of The value added services (VAS)
industry is poised to witness a big shift, 4G, roaming, Mobile Number Portability and overall
mobile tariffs. The Indian telecom sector is greatly dominated by private operators with a share
of 87.9% of the entire sector. The cumulative Foreign Direct Investment (FDI) in telecom
sector is 2007-$ 57 bn, 2008- $ 92 bn, 2009- $ 134 bn, 2010- $172 bn, 2011- $207 bn, 2012-
$ 253 bn, 2013- $ 287 bn. Government's initiatives for increasing the telecom connectivity and
the vast rural market holds a huge potential to drive the future growth of the telecom companies
and extend their services in the unconnected rural areas.
The Growth Rate and Market Share figures of top players in the telecom sector, according to
Telecom Regulatory Authority of India (TRAI) database for the month of March, 2013 are
shown in following Table.
Sr no. Company Growth rate (%) Market Share (%)
1 BSNL 25.00% 13.28%
2 BhartiAirtel 22.00% 21.41%
3 Vodafone 16.50% 17.15%
4 Idea 28.90% 13.70%
5 Tata 16.00% 07.48%
6 Reliance Communication 30.00% 13.93%
Source: Telecom Regulatory Authority of India.
3. FINANCIAL CONDITION OF TELECOM SECTOR
In recent, past Telecommunications operators are facing the challenges of growth,
convergence, business transformation, technological change and regulatory pressures in
increasingly difficult economic conditions.
In general, Ratios are used to measure a firm’s liquidity, leverage, activity, profitability and
growth. The financial health plays a significant role in the successful functioning of a firm.
Poor financial health threatens the very survival of the firm and leads to business failures.
However, no single ratio can provide a meaningful picture of a firm’s financial condition.
Corporate profitability has eroded sharply while debt burden has increased. The turbulent and
the competitive scenario in the corporate sector have made it imperative for the stakeholders to
assess the financial health of the companies. With the recent global financial crisis in the
country witnessing a strong need of financial analysis and the failures of many organizations
which will be able to identify and correct financial performance problems before they have a
major impact on the operations of the business.
Prof. Edward Altman of the New York University School of Business developed a statistical
model called as “Z-Score” in 1968. He developed a meaningful prediction model by selecting
various financial ratios and applying a certain weight to each ratio. It has gained wide
acceptance from different arena like auditors, management accountants, courts and credit
rating agencies for loan evaluation.
ISSN 2277 8675 DMIETR International Journal on Financial Management (ejournal) Page 43
In 2005, Krishna Chaitanya has made efforts to measure financial fitness of IDBI by Z- Score
analysis. In 2009, AnupChowdhary and SubornaBarua investigated the financial attributes of Z
category shares’ companies by using Z-score model and found that 90% of those companies
are suffering from financial problems. In 2010, M.Rajesh has used Z scores technique to check
the financial distress in ‘The Chittoor Co-operative sugar Limited’. This article focus on a
model, which incorporates multiple variables like financial ratios that ultimately, predicts a
score which can be used to analyze the financial health of a company.
In recent years, due to intense competition from private network operators in Indian the
company's revenue and market share plunged into heavy losses. As per statistics, the total
mobile phone subscription in the country has been rising day- by-day. The total number of
mobile phone users in the country will likely to rise to 1.25 billion by 2015.
4. STATEMENT OF THE PROBLEM
The telecom service has gained significant attention during the last decade. Communication
has to keep pace with the advancements in other sectors of country’s economy for proper and
systematic growth during which many private sector companies like Reliance, BhartiAirtel,
Aircel, Idea Cellular, Vodafone, Tata Teleservices have come into picture besides public sector
companies like BSNL and MTNL.
The competition and price war in the part of public sector and private sector units and there is
no corresponding growth in the revenue of the entrepreneurs in this sector except customer
addition. Also between private sector counterparts compel them in planning for providing
services efficiently at cheaper price to intermediaries and end-user. This day’s industry making
it too competitive to survive Moreover the fast approaching privatization may usher-in giant
MNCs. Hence the present study is done with the objective of diagnosing the financial health of
the selected telecom companies in India.
5. OBJECTIVES
The objectives of the study are as follows:
1. To examine the overall financial performance of BSNL, BhartiAirtel and R-Com.
2. To study the financial health by calculating various ratios and by applying “Z-Score” model.
3. To compare financial health of each selected company with other companies.
4. METHODOLOGY
Telecom companies are established into two sectors viz., public and private. The study is
geographically restricted to India, which covers all the states. Three Telecom companies have
been selected according to their Growth rate and Market share i.e., BSNL, BhartiAirtel and
R-Com and this study covers the period of 6 years from 2007-08 to 2012-13.
5. DATA COLLECTION
ISSN 2277 8675 DMIETR International Journal on Financial Management (ejournal) Page 44
This study is mainly based on secondary data. The required information about these three
companies which include one public company and two private companies based on their
growth rate and market share and the data is obtained from the published annual reports of
corresponding companies as well as from CMIE- Prowess.
6. TOOLS FOR ANALYSIS
The financial health of sample units has been judged through Altman score (Z score Model).
To study the financial health, Z-score Model has been selected which incorporates five
weighted financial ratios for its formulation.
Z-SCORE ANALYSIS
The Z scores formula used to evaluate the financial health of a company is as follows:
Z = 1.2 A + 1.4 B + 3.3 C + 0.6 D + 0.99 E
Where Z is the overall index
A= Working Capital / Total Assets* 100
B= Retained Earnings / Total Assets*100
C= EBIT / Total Assets*100
D= Market value of equity / Book value *100
E= Sales / Total Assets.
The resulting Z-score puts a company in one of the three categories:-
1. Companies with a Z-Score value less than 1.8 indicates a high probability for “bankruptcy”
in the coming couple of years.
2. Companies with a Z-Score value between 1.8 to 3 are considered within “gray area”. i.e.,
financial viability of the companies is considered to be healthy.
3. Companies with a Z-Score value above 3.0 are considered “very healthy”.
‘A’ COMPONENT
The ratio of working capital to Total Assets is the ‘A’ component of Z-Score. This is a
reasonable predictor of deepening trouble for a company. A company which experiences
repeated operating losses may suffer a reduction in working capital relative to its total assets.
‘B’ COMPONENT
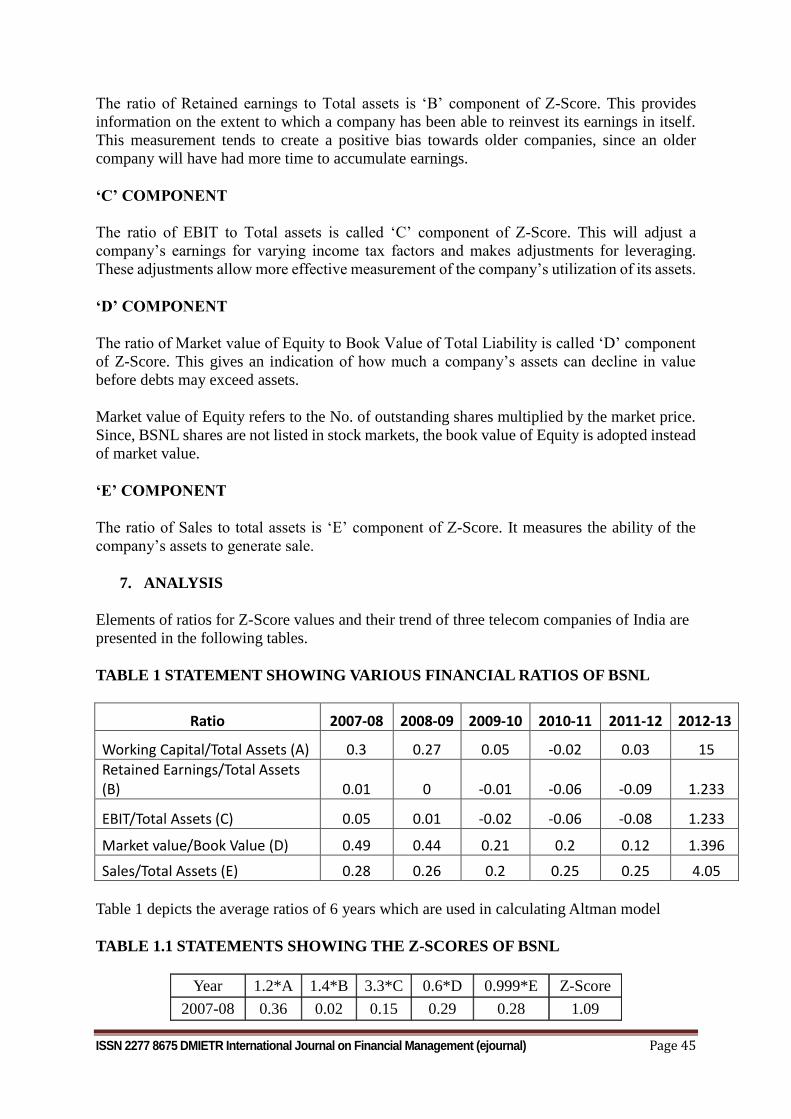
ISSN 2277 8675 DMIETR International Journal on Financial Management (ejournal) Page 45
The ratio of Retained earnings to Total assets is ‘B’ component of Z-Score. This provides
information on the extent to which a company has been able to reinvest its earnings in itself.
This measurement tends to create a positive bias towards older companies, since an older
company will have had more time to accumulate earnings.
‘C’ COMPONENT
The ratio of EBIT to Total assets is called ‘C’ component of Z-Score. This will adjust a
company’s earnings for varying income tax factors and makes adjustments for leveraging.
These adjustments allow more effective measurement of the company’s utilization of its assets.
‘D’ COMPONENT
The ratio of Market value of Equity to Book Value of Total Liability is called ‘D’ component
of Z-Score. This gives an indication of how much a company’s assets can decline in value
before debts may exceed assets.
Market value of Equity refers to the No. of outstanding shares multiplied by the market price.
Since, BSNL shares are not listed in stock markets, the book value of Equity is adopted instead
of market value.
‘E’ COMPONENT
The ratio of Sales to total assets is ‘E’ component of Z-Score. It measures the ability of the
company’s assets to generate sale.
7. ANALYSIS
Elements of ratios for Z-Score values and their trend of three telecom companies of India are
presented in the following tables.
TABLE 1 STATEMENT SHOWING VARIOUS FINANCIAL RATIOS OF BSNL
Ratio 2007-08 2008-09 2009-10 2010-11 2011-12 2012-13
Working Capital/Total Assets (A) 0.3 0.27 0.05 -0.02 0.03 15
Retained Earnings/Total Assets (B) 0.01 0 -0.01 -0.06 -0.09 1.233
EBIT/Total Assets (C) 0.05 0.01 -0.02 -0.06 -0.08 1.233
Market value/Book Value (D) 0.49 0.44 0.21 0.2 0.12 1.396
Sales/Total Assets (E) 0.28 0.26 0.2 0.25 0.25 4.05
Table 1 depicts the average ratios of 6 years which are used in calculating Altman model
TABLE 1.1 STATEMENTS SHOWING THE Z-SCORES OF BSNL
Year 1.2*A 1.4*B 3.3*C 0.6*D 0.999*E Z-Score
2007-08 0.36 0.02 0.15 0.29 0.28 1.09
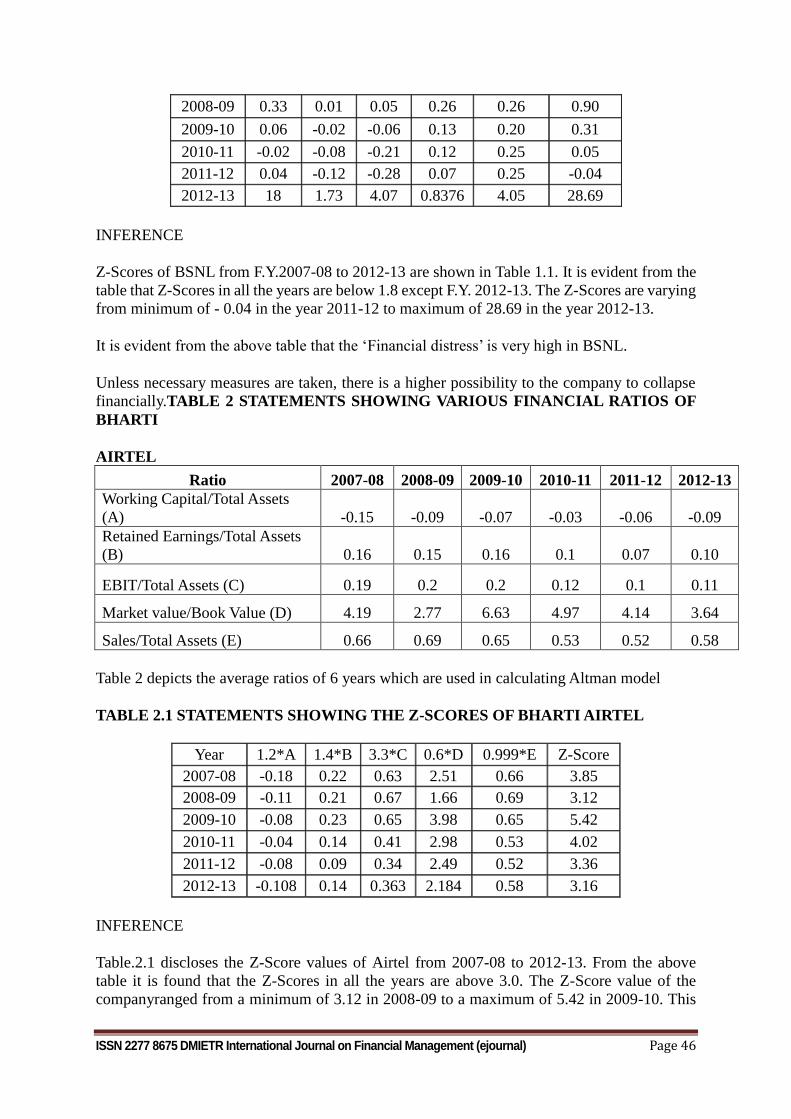
ISSN 2277 8675 DMIETR International Journal on Financial Management (ejournal) Page 46
2008-09 0.33 0.01 0.05 0.26 0.26 0.90
2009-10 0.06 -0.02 -0.06 0.13 0.20 0.31
2010-11 -0.02 -0.08 -0.21 0.12 0.25 0.05
2011-12 0.04 -0.12 -0.28 0.07 0.25 -0.04
2012-13 18 1.73 4.07 0.8376 4.05 28.69
INFERENCE
Z-Scores of BSNL from F.Y.2007-08 to 2012-13 are shown in Table 1.1. It is evident from the
table that Z-Scores in all the years are below 1.8 except F.Y. 2012-13. The Z-Scores are varying
from minimum of - 0.04 in the year 2011-12 to maximum of 28.69 in the year 2012-13.
It is evident from the above table that the ‘Financial distress’ is very high in BSNL.
Unless necessary measures are taken, there is a higher possibility to the company to collapse
financially.TABLE 2 STATEMENTS SHOWING VARIOUS FINANCIAL RATIOS OF
BHARTI
AIRTEL
Ratio 2007-08 2008-09 2009-10 2010-11 2011-12 2012-13
Working Capital/Total Assets
(A) -0.15 -0.09 -0.07 -0.03 -0.06 -0.09
Retained Earnings/Total Assets
(B) 0.16 0.15 0.16 0.1 0.07 0.10
EBIT/Total Assets (C) 0.19 0.2 0.2 0.12 0.1 0.11
Market value/Book Value (D) 4.19 2.77 6.63 4.97 4.14 3.64
Sales/Total Assets (E) 0.66 0.69 0.65 0.53 0.52 0.58
Table 2 depicts the average ratios of 6 years which are used in calculating Altman model
TABLE 2.1 STATEMENTS SHOWING THE Z-SCORES OF BHARTI AIRTEL
Year 1.2*A 1.4*B 3.3*C 0.6*D 0.999*E Z-Score
2007-08 -0.18 0.22 0.63 2.51 0.66 3.85
2008-09 -0.11 0.21 0.67 1.66 0.69 3.12
2009-10 -0.08 0.23 0.65 3.98 0.65 5.42
2010-11 -0.04 0.14 0.41 2.98 0.53 4.02
2011-12 -0.08 0.09 0.34 2.49 0.52 3.36
2012-13 -0.108 0.14 0.363 2.184 0.58 3.16
INFERENCE
Table.2.1 discloses the Z-Score values of Airtel from 2007-08 to 2012-13. From the above
table it is found that the Z-Scores in all the years are above 3.0. The Z-Score value of the
companyranged from a minimum of 3.12 in 2008-09 to a maximum of 5.42 in 2009-10. This
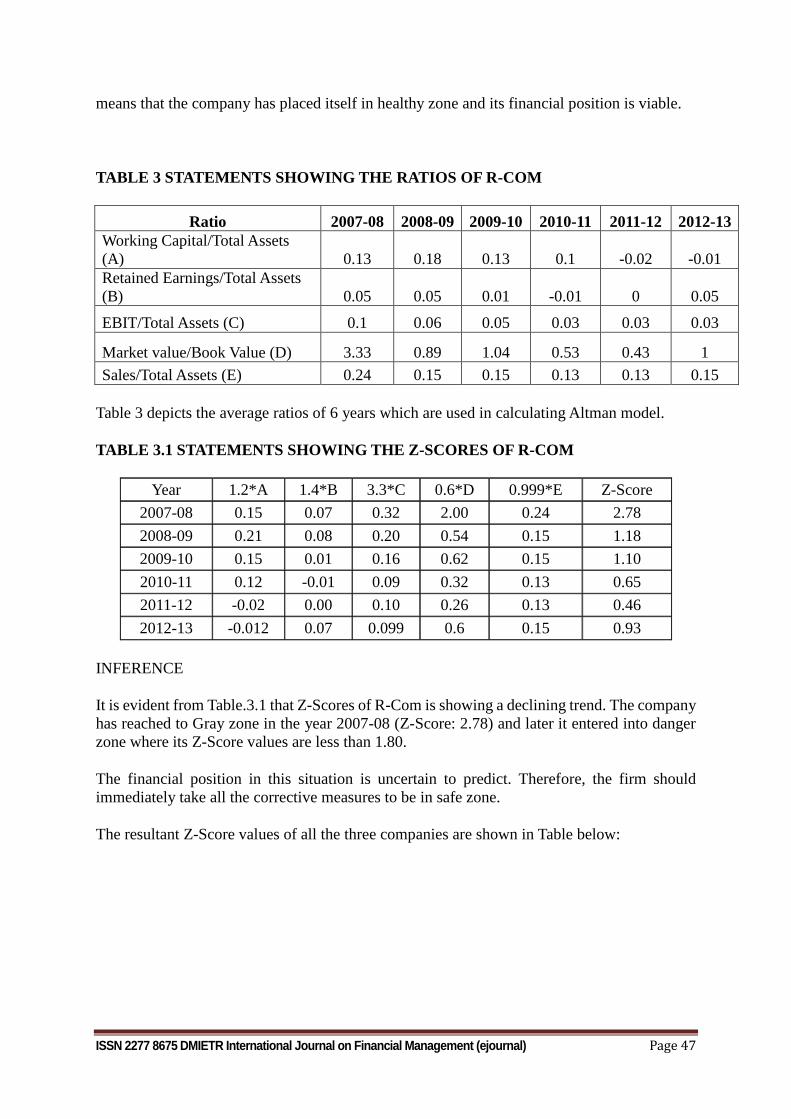
ISSN 2277 8675 DMIETR International Journal on Financial Management (ejournal) Page 47
means that the company has placed itself in healthy zone and its financial position is viable.
TABLE 3 STATEMENTS SHOWING THE RATIOS OF R-COM
Ratio 2007-08 2008-09 2009-10 2010-11 2011-12 2012-13
Working Capital/Total Assets
(A) 0.13 0.18 0.13 0.1 -0.02 -0.01
Retained Earnings/Total Assets
(B) 0.05 0.05 0.01 -0.01 0 0.05
EBIT/Total Assets (C) 0.1 0.06 0.05 0.03 0.03 0.03
Market value/Book Value (D) 3.33 0.89 1.04 0.53 0.43 1
Sales/Total Assets (E) 0.24 0.15 0.15 0.13 0.13 0.15
Table 3 depicts the average ratios of 6 years which are used in calculating Altman model.
TABLE 3.1 STATEMENTS SHOWING THE Z-SCORES OF R-COM
Year 1.2*A 1.4*B 3.3*C 0.6*D 0.999*E Z-Score
2007-08 0.15 0.07 0.32 2.00 0.24 2.78
2008-09 0.21 0.08 0.20 0.54 0.15 1.18
2009-10 0.15 0.01 0.16 0.62 0.15 1.10
2010-11 0.12 -0.01 0.09 0.32 0.13 0.65
2011-12 -0.02 0.00 0.10 0.26 0.13 0.46
2012-13 -0.012 0.07 0.099 0.6 0.15 0.93
INFERENCE
It is evident from Table.3.1 that Z-Scores of R-Com is showing a declining trend. The company
has reached to Gray zone in the year 2007-08 (Z-Score: 2.78) and later it entered into danger
zone where its Z-Score values are less than 1.80.
The financial position in this situation is uncertain to predict. Therefore, the firm should
immediately take all the corrective measures to be in safe zone.
The resultant Z-Score values of all the three companies are shown in Table below:
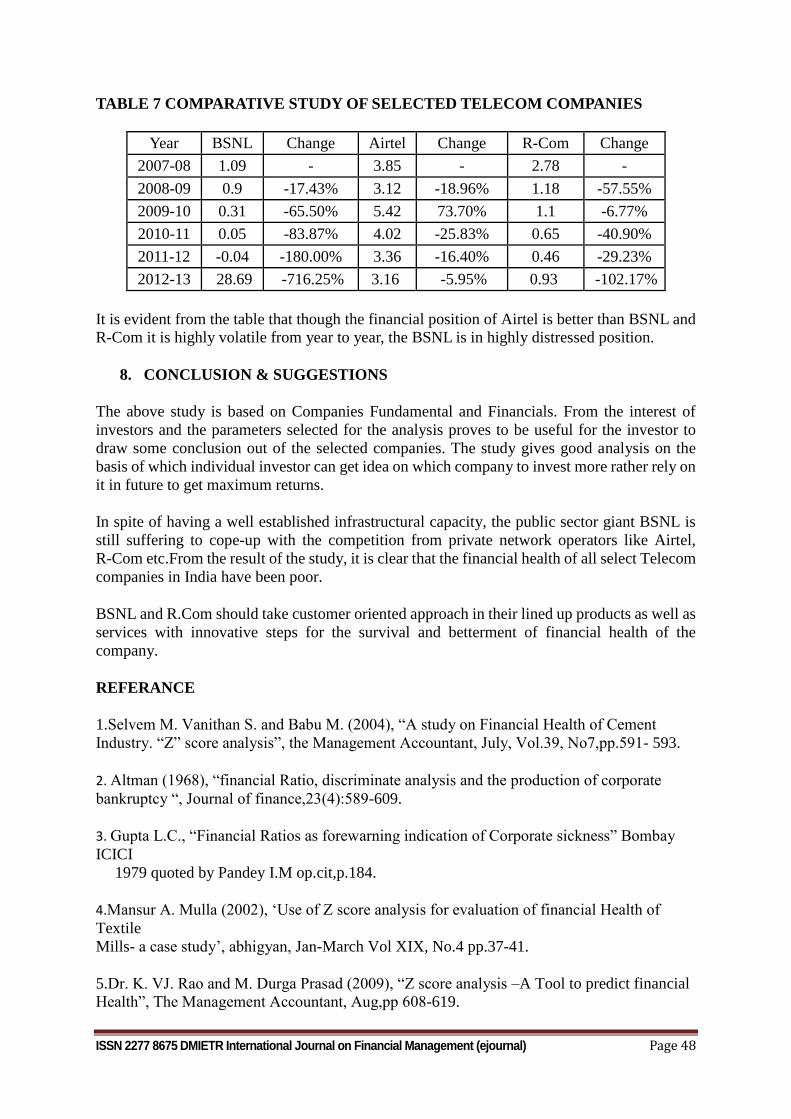
ISSN 2277 8675 DMIETR International Journal on Financial Management (ejournal) Page 48
TABLE 7 COMPARATIVE STUDY OF SELECTED TELECOM COMPANIES
Year BSNL Change Airtel Change R-Com Change
2007-08 1.09 - 3.85 - 2.78 -
2008-09 0.9 -17.43% 3.12 -18.96% 1.18 -57.55%
2009-10 0.31 -65.50% 5.42 73.70% 1.1 -6.77%
2010-11 0.05 -83.87% 4.02 -25.83% 0.65 -40.90%
2011-12 -0.04 -180.00% 3.36 -16.40% 0.46 -29.23%
2012-13 28.69 -716.25% 3.16 -5.95% 0.93 -102.17%
It is evident from the table that though the financial position of Airtel is better than BSNL and
R-Com it is highly volatile from year to year, the BSNL is in highly distressed position.
8. CONCLUSION & SUGGESTIONS
The above study is based on Companies Fundamental and Financials. From the interest of
investors and the parameters selected for the analysis proves to be useful for the investor to
draw some conclusion out of the selected companies. The study gives good analysis on the
basis of which individual investor can get idea on which company to invest more rather rely on
it in future to get maximum returns.
In spite of having a well established infrastructural capacity, the public sector giant BSNL is
still suffering to cope-up with the competition from private network operators like Airtel,
R-Com etc.From the result of the study, it is clear that the financial health of all select Telecom
companies in India have been poor.
BSNL and R.Com should take customer oriented approach in their lined up products as well as
services with innovative steps for the survival and betterment of financial health of the
company.
REFERANCE
1.Selvem M. Vanithan S. and Babu M. (2004), “A study on Financial Health of Cement
Industry. “Z” score analysis”, the Management Accountant, July, Vol.39, No7,pp.591- 593.
2. Altman (1968), “financial Ratio, discriminate analysis and the production of corporate
bankruptcy “, Journal of finance,23(4):589-609.
3. Gupta L.C., “Financial Ratios as forewarning indication of Corporate sickness” Bombay
ICICI
1979 quoted by Pandey I.M op.cit,p.184.
4.Mansur A. Mulla (2002), ‘Use of Z score analysis for evaluation of financial Health of
Textile
Mills- a case study’, abhigyan, Jan-March Vol XIX, No.4 pp.37-41.
5.Dr. K. VJ. Rao and M. Durga Prasad (2009), “Z score analysis –A Tool to predict financial
Health”, The Management Accountant, Aug,pp 608-619.
ISSN 2277 8675 DMIETR International Journal on Financial Management (ejournal) Page 49
6. AnupChowdhary and SubomaBarua, “financial Attributes of Z category Shares”
7. CMIE- PROWESS
8. K.R Shrma (2008), Business Research.
9. Krishna Chaitanya (2009), “Measurement of Financial Fitness of IDBI, “Z scor analysis.
10.I.MPondey (2000),op.cit. p.184
11.M. Rajesh (2010) “financial Distress in the ChittoorCo-operative sugar Limited”.
12.http://www.trai.gov.in/
13 http://www.bsnl.co.in/
14. http://www.airtel.in/
15. http://www.rcom.co.in/Rcom/personal/home/index.html
ISSN 2277 8675 DMIETR International Journal on Financial Management (ejournal) Page 50
A STUDY ON SIGNIFICANCE OF INVENTORY CONTROL
Dr. T.G. Mirge
(Asst. Professor)
Smt. L.R.T. College of Commerce, Akola
ABSTRACT:
Control of the inventories, with the primary objective of determining/controlling stock levels within the
physical distribution system, functions to balance the need for product availability against the need for
minimizing stock holding and handling costs. It is clear that planning without control is ultimately unpromising
and ravage of time and resources. Thus planning is not sufficient, it must be accompanied by control. Authority
is the process of evaluating determined performance with the actual performance with the intend of taking
corrective measures to accomplish set standards. The management of some critical success factors in the
business operation. One of these significant accomplishment factors is the inventory control as importance to all
sectors of the economy. It occupies the use and control of inventory. This is influenced by the ability of
management to cautiously and efficiently decide on when to increase or maintain stock level based on stock
usage in order to achieve the targeted output. On the other hand, considering manufacturing companies,
inventory is seen as raw material, work-in-progress and finished goods. Inventory management decisions are an
integral aspect of organizations. Decision in relation to management of inventory could be seen as one of the
many strategic decisions of a company because it affect the operational efficiency and to a large extent
determine the future prospects of the company. Inventories are the stock of products a company holds to further
its production and sales (Pandy, 2003) they appear in the form of raw materials, work in progress, finished
products and supplies maintained by firms to smoothly conduct their business. Inventory constitutes much of
the working capital held by company. Thus, a company must maintain a suitable level of inventory because its
excess or shortage could be detrimental to the company. The study explores the significance of inventory
control in achieving the company profit objective.
KEYWORDS: inventory, company, control etc;
INTRODUCTION:
Inventory Control System is the process of managing inventory in order to meet customer demand at the lowest
possible cost and with a minimum of investment, Byoungho (2004). A successfully implemented inventory
control program takes into account such things as purchasing goods commensurate with demand, seasonal
variation, changing usage patterns, and monitoring for pilferage, Ellram (1996). A preliminary step in the
process of inventory control is to determine the approximate costs of carrying inventory. According to
Langabeer and Stoughton (2001), these costs include such expenses as storage costs, inventory risks, and the
loss-of-opportunity costs associated with tying up capital inventory management refers mainly to when a firm
strives to attain and uphold an optimal inventory of goods while also taking note of all orders, shipping and
handling, and other associated costs. Inventory management is mainly about identifying the amount and the
position of the goods that a firm has in their inventory. Inventory management is imperative as it helps to defend
the intended course of production against the chance of running out of important materials or goods. Inventory
management also includes making essential connections between the replenishment lead time of goods, asset
management, and the carrying costs of inventory, future inventory price forecasting, physical inventory, and
available space for inventory, demand forecasting and much more.
RESEARCH METHODOLOGY:
ISSN 2277 8675 DMIETR International Journal on Financial Management (ejournal) Page 51
For the purpose of this paper secondary research was undertaken. This paper tries to outline the current state of
knowledge about importance and benefits of inventory control in a company. A diminutive number of related
journal articles were reviewed for the relevant secondary data collection through various sources such as
websites, economic survey, books and journals.
BENEFITS OR SIGNIFICANCE OF INVENTORY CONTROL:
The key benefits of inventory control are primarily about specifying the shape and percentage of stocked goods
and leading to optimal inventory levels. It also helps companies improve cash flows. Some of the following are
the benefits or importance of inventory control.
1. Protects from fluctuations in demand: Many a times, the demand forecast of a product is not accurate.
There is always a small difference between the demand forecast and actual demand. However, sometimes, there
is a big difference between the demand forecast and actual-demand. So, there are always chances of fluctuations
in the demand of a material. These fluctuations can be adjusted if there are sufficient items in the stock of
inventory. Therefore, proper inventory control protects the company from fluctuations in demand.
2. Better services to customers: If the company maintains a proper inventory of raw-materials, then it can
complete its production in time. So, it can deliver the finished goods to the customers in time.Similarly, if the
company has a proper inventory of finished goods, then it can satisfy the additional demand of the customers. So,
inventory control helps the company to deliver goods at the right time as demanded by the customers. After
making timely delivery, the company can concentrate on giving other services to the customers.
3. Continuity of production operations: Proper inventory control helps to maintain continuity of production
operations. This is because it maintains a smooth flow of raw materials. So, there are no shortages of
raw-materials required for production process.
4. Reduces the risk of loss: Proper inventory control helps to reduce the risk of loss due to obsolescence
(outdated) or deterioration of items. This is because it checks all the items regularly. Furthermore, it sells all the
slow-moving items, in time, at the market prices. It only maintains the right stock at all times. So, the chances of
any item getting outdated are reduced.
5. Minimizes the administrative workload
Proper inventory control helps to minimize the administrative work load of purchasing, inspection, warehousing,
etc. This will reduce the manpower requirement and will minimize the labour cost too.
6. Protects fluctuation in output:Inventory control tries to reduce the gap between planned production and
actual production. There are cases where the production schedule cannot be followed because of:
1. Sudden breakdown of machines,
2. Problems in supply of materials,
3. Sudden labour strikes,
4. Loss due to failure of power supply, etc.
In such cases, the difference between planned production and actual production can be bridged by inventories
held in stock.
7. Effective use of working capital: Proper inventory control helps to make effective use of working capital.
Inventory control helps in maintaining the right amount of stocks of materials, components, etc. Over stocking
is avoided. Therefore, the working capital will not be blocked in excess inventory.
ISSN 2277 8675 DMIETR International Journal on Financial Management (ejournal) Page 52
8. Check on loss of materials: Inventory control helps to maintain a check on the loss of materials due to
carelessness or pilferage (stealing).If there is no proper inventory control, then there are more chances of
carelessness and pilferage by the employees, especially in the store-keeping department.
9. Facilitates cost accounting activities: Inventory control facilitates cost accounting activities. This is
because, inventory control provides a means of allocating materials cost of products, departments or other
operating accounts.
10. Avoids duplication in ordering:Inventory control avoids duplication in ordering of stock. This is done by
maintaining a separate purchase department. This department will do all the purchasing for the full organization.
No other department is allowed to do purchasing. So there will not be any duplication in ordering of stock.
11. Warehouse Organization: If you know which products are your top sellers and what combinations of
products your customers often order together, you can optimize your warehouse setup by putting those products
close together and in easily accessible places. This speeds up the picking, packing and shipping processes.
12. Employee Efficiency: You can empower your employees to help you manage inventory. Training
employees to use barcode scanners, inventory management software and other tools helps them make better use
of their time, and it helps your business make better use of its resources, both human and technological.
CONCLUSION:
The objective of inventory control is to continuously hold optimal inventory levels. The extent of inventory
control concerns the fine lines between replenishment lead time, carrying costs of inventory, assetmanagement,
inventory forecasting, inventory valuation, inventory visibility, future inventory price forecasting, physical
inventory, available physical space for inventory, quality management, replenishment, returns and defective
goods, and demand forecasting. After the study, one can say that, efficiency of inventory control would be
improve in all the aspects, hence the company must strengthen its position by looking into the inventory
which should be fast moving so that warehouse cost can be reduced. The finished goods have to be dispatched
in practicable time as soon as manufacturing is completed. Most favorable order quantity should be
maintained, hence cost can be minimized and lastly proper inventory control techniques are employed by the
inventory control. Balancing these competing requirements leads to optimal inventory levels, which is an
on-going process as the business needs shift and react to the wider environment.Inventory control involves
systems and processes that identify inventory requirements, set targets, provide replenishment techniques,
report actual and projected inventory status, and handle all functions related to the tracking and management
of material. This would include the monitoring of material moved into and out of stockroom locations and the
reconciling of the inventory balances.
REFERENCES
Collin Drury (1995), Management and Cost Accounting 3rd Edition, ELBS
Dopuch Nicholas (1989), Cost Accounting 3rd edition, Harcourt Brace, Inc. New York
Horngren and Harrison (1992), Cost Accounting and managerial Emphasis 5th Edition, Prentince Hall
international Editions.
Kakulu Julius (2001), Financial Decision 2nd Edition, The business publishing Group, Kampala
Kenneth Lyson and MichealGillingham (2004), Financial Management and control, Akapla;
professional company.
KilbyHannington (2001), Fundamentals of Corporate finance 2nd Edition Wed Maiden berg Press,
Sartiage.
Atrill, P. (2006). Financial management for decision makers, (4th Ed), Prentice Hall.
Baron, O., Berman, O., and Perry, D. (2010). Shelf Space Management When Demand Depends on the
Inventory Level Production and Operations Management. pp. 1–13, 2010 Production and Operations
Management Society
ISSN 2277 8675 DMIETR International Journal on Financial Management (ejournal) Page 53
Basuroy, S., Mantrala, M., and Walters, G. (2001). The impact of category management on retailer
prices and performance: theory and evidence. Journal of Marketing, 65 (4),16-33.
Borin, N., Farris, P. W., and Freeland, J.R. (1994). A model for determining product category
assortment and shelf space allocation, Decision Sciences, 25 (3),359-84.
Bowen, M., Morara, M., and Mureithi S. (2009). Management of business challenges among small and
micro enterprises in Nairobi-Kenya. KCA Journal of Business Management 2(1),
Cachon, G. P., and Olivares, M. (2010). Drivers of finished-goods inventory in the US automobile
industry. Journal of Management Science, 56 (1), 202-216.
Deloof, M. (2003). Does Working Capital Management Affect Profitability of Belgian Firms?. Journal
of Business Finance and Accounting,30 (314), 573 –587.
Dimitrios, P. (2008). The effect of inventory management on firm performance. International Journal of
Productivity and Performance Management. 57 (5)
ISSN 2277 8675 DMIETR International Journal on Financial Management (ejournal) Page 54
“SMALL-SCALE INDUSTRY”
Prof. Sanjay B.Shinde,
Arts, Commerce & Science College, Sonai,
Tal- Newasa,Dist: Ahmednagar, (MS),
Corresponding author: Prof. Sanjay B.Shinde
Abstract:-
Business is a typical economic activity .The Economic activity must be regular and continuous. Production of
goods, or mea rely purchase of goods to resell at a profit. The economic activity always involves an element
of risk of loss. A business adventure is expected to meet treats and uncertainties. The earning of income
objective of any business and any business is create a customer can get due service and satisfaction in the
market place, where exchange of goods and services takes place against price in a monetary economy. In fine,
business aims at profit through services, and ever-changing human wants.
The business system of a country is divided into A)Big business represented by
`Large Scale Industries, B)Medium-size business or medium-scale Industries. C) Small-business or small
scale Industries. This classification of industries may based on capital invested in it. The modern business
aims at profit through services and satisfaction of customers, employees and society in general.
Commerce it is an organized system for the exchange of goods between the
members of the industrial world. It constitutes a acnnecfines link between the primary producers and
ultimate consumers. It tries, to deliver the right goods, to the right persons, at the right place, at the right time
and right price.
Commerce deals with the goods produced and supplied by industry. Commerce
like all other human activities is not static, but dynamic.
*Key worlds:-Economic activity, Industries, selling, services, goods. Small-Scale industry, Business.
Definitions: -
I) Business-Production of goods, or mea rely purchase of goods to resell at a profit
Ii) Commerce-Commerce it is an organized system for the exchange of goods between the members of the
industrial world
iii) Small Business-The maximum limit is up to Rs.5 corers for small and medium Enterprises.
*Objective of the study:-
The present paper has been prepared keeping in mind the following objectives.
ISSN 2277 8675 DMIETR International Journal on Financial Management (ejournal) Page 55
1) To understand the concepet of Small-Scale industry or Business.
2) To understand the Role or Significance of Small Business.
3) To understand the Process of Setting up a Small-Scale Industry Guidelines
4) To understand the Objectives of small Business
*Research methodology:-
All are a the data present study should have collected from s secondary source of data collection, like
e-commerce related book’s, webs journals, and other published or unpublished data.
Small Business or Small-Scale industry-
Most of the definition of Small Business or Small-Scale industry is based upon few criteria, on the
amount of investment in fixed assets or on the number of persons employed or on both.
The limits in terms of investment and employment are naturally dependent on
the stage of economic development of a country. So that a small business unit in a developed country may be
regarded as a medium or even large business unit in a developing or backward country.
In 1955, a small-scale industry was defined in India as a business unit employing less than 50 persons if using
power and less than 100 persons if not using power and having capital not more than 5 lacks.
In 1960 the employment limit was completely given up and only Investment limit was prescribed for
small-scale unit.
The investment limit was raised from time to time in 1960, 1966, 1975 and 1980. Since
July 1980, the upper limit on investment in small-scale industries has been raised from Rs.20 lacks, to Rs.35
lacks, and in ancillary units from Rs.25 lacks to Rs.45 lacks.
The maximum limit is up to Rs.5 corers for small and medium Enterprises.
Objectives of small Business:-
The basic objectives of the small-scale sector of our economy are:
(1) To create immediate and permanent employment on a large-scale at a relatively small cost; (2) To meet the
growing demand for consumer goods as simple producers goods;
(3) To facilitate the mobilization of resources of capital and skill which might otherwise remain under-utilized;
(4) To bring about an integration of the development of small-scale industries with the rural economy on the
ISSN 2277 8675 DMIETR International Journal on Financial Management (ejournal) Page 56
one hand and with the big business on the other;
(5) To ensure a more equitable distribution of the national income and wealth; and
(6) To avoid some of the problems created by urbanization and growth of big cities and towns.
Role or Significance of Small Business:-
1) Creation of Employment Opportunities
2) Socio-Economic Justice
3) Dispersion of Industries
4) Better use of National Resources
5) Accelerated Capital Formation
6) Ancillary Function
7) Export Promotion
Process of Setting Up A Small-Scale Industry Guidelines:-
1) Selection of Industry:-
Small Industries Service Institutes:- They guide entrepreneurs in the selection of industries areas,
suitable raw materials and machinery.
2) Factory Accommodation:-
Directors of Industries: They provide built up factory space in industrial estates or developed factory
sites, power, water, etc.
3) Industrial Estates:
There are more than 600 industrial estates in India which provide constructed accommodation in
developed areas. Main facilities include common facility services, workshops, allotment of sheds on
hire purchase, concessional charges on water and power, exemption from octroi duty on building
materials, etc.
4) Registration:
Although it is not mandatory, it is certainly helpful to obtain the SSI Registration Number from the
Director of Industries.
5) Machinery:
Small Industries Service Institutes: They advise about the kind of machinery and equipment needed for
the manufacture of different products.
6) Raw Materials:
Development Commissioner, small-scale Industries Organization, New Delhi: He Procures raw material
for the small industry and distributes them among State Governments.
ISSN 2277 8675 DMIETR International Journal on Financial Management (ejournal) Page 57
7) Finance:
State Financial Corporations: They provide long-term credit for the purchase of fixed assets.
8) Technical Know-How:
Small Industries Service Institutes: They prepare improved designs and drawings for products. They
assist in making tools, dies, jigs and fixtures.
9) Standardization:
Small Industries Service Institutes: They provide technical guidance in the production of goods
according to prescribed standards.
10) Internal Marketing:
Small Industries Service Institutes: They conduct distribution aid surveys for the benefit of small
industrialists. They enlist the units for participation in the Central Government Stores Purchase
Programme.
11) Export:
Small Industries Service Institutes: They enlist the small units for participation under the Export Aid to
Small Industry Scheme of the State Trading Corporation of India. They render technical counseling
service for a satisfactory execution of export markets.
12) Inventions:
It promotes workable inventions of practical uto;out through financial assistance and other incentives.
13) Training:
It trains practicing managers and technologists. They conduct management courses for senior
managerial personnel.
Conclusion:
India is agro based developing country. The economic growth of India heavily relies on industry along with
agriculture. The development of small scale industry is very important from the view of economic growth of
the country. The development and proliferation of small scale industry is very useful for employment growth
product growth individual income and national income etc.The growth of small scale industry in rural area is
very important.
References:
1. Modern Business Organisation and Management by S A Sherlekar,V S Sherlekar ,Himalaya
Publishing House’Mumbai.
2. Zen of Social Media Marketingby ShamaKabani and Chris Brog
3. Marketing Research,Crisp,R D.
ISSN 2277 8675 DMIETR International Journal on Financial Management (ejournal) Page 58
APPLICATION OF THE BINOMIAL AND POISSON
PROBABILITY DISTRIBUTION
Mrs.Sunetra S. Adsad1
Ms.Janhavi R. Sontakke 2
Mrs.Mona V. Dekate3
Lecturer
(DMIETR,Wardha)
Abstract:-
The binomial and Poisson distribution was introduced by the Swiss mathematician Jacob
Bernoulli’s in 1713 and Simone Denis Poisson in 1837 . It has since been subject of numerous publications
and practical applications. The purpose of this paper is to raise awareness of numerous application
opportunities and to provide more complete case coverage of the Binomial and Poisson distribution.First an
introduction of distributions and their uses.Next basic definition of Binomial distribution and Poisson
distribution. And their application respectively related to real life are presented. Finally difference between
them is discussed.
Keywords: Statistics, Probability distribution, random variable, Binomial and Poisson distribution.
Probability Distribution
A probability distribution is a statistical model that shows the possible outcomes of a particular event or course
of action as well as the statistical likelihood of each event. For example, a company might have a probability
distribution for the change in sales given a particular marketing campaign. The values on the "tails" or the left
and right end of the distribution are much less likely to occur than those in the middle of the
curve..(www.smallbusiness.chron.com)
Scenario Analysis
Probability distributions can be used to create scenario analyses. A scenario analysis uses probability
distributions to create several, theoretically distinct possibilities for the outcome of a particular course of action
or future event. For example, a business might create three scenarios: worst-case, likely and best-case. The
worst-case scenario would contain some value from the lower end of the probability distribution; the likely
scenario would contain a value towards the middle of the distribution; and the best-case scenario would contain
a value in the upper end of the scenario..(www.smallbusiness.chron.com)
Sales Forecasting
One practical use for probability distributions and scenario analysis in business is to predict future levels of
sales. It is essentially impossible to predict the precise value of a future sales level; however, businesses still
need to be able to plan for future events. Using a scenario analysis based on a probability distribution can help a
company frame its possible future values in terms of a likely sales level and a worst-case and best-case scenario.
By doing so, the company can base its business plans on the likely scenario but still be aware of the alternative
possibilities..(www.smallbusiness.chron.com)
ISSN 2277 8675 DMIETR International Journal on Financial Management (ejournal) Page 59
Risk Evaluation
In addition to predicting future sales levels, probability distribution can be a useful tool for evaluating risk.
Consider, for example, a company considering entering a new business line. If the company needs to generate
$500,000 in revenue in order to break even and their probability distribution tells them that there is a 10 percent
chance that revenues will be less than $500,000, the company knows roughly what level of risk it is facing if it
decides to pursue that new business line.
Probability has a popular meaning that is not the same as the mathematical meaning. As a small-business owner,
you may act on hunches, guesses and instincts. After such actions, you might even say you thought a certain
outcome was "probable." However, the mathematics of probability has rules that you can use in a much more
disciplined way than guesswork to predict possible outcomes for your business
plans.(www.smallbusiness.chron.com)
Classical Approach
The classical approach to using probability depends on several future events that are equally likely to happen. In
rolling a die, for example, the odds are equally likely for rolling a 1, 2, 3, 4, 5 or 6. If you roll the die once, you
have a 1 in 6 chance of getting the number you want. The formula is the number of favorable outcomes divided
by the total number of possible outcomes. Note that if you roll the die twice, the odds are 2 in 12 that you will get
the number you want (this is the same value as 1/6). This is because the possible outcomes double if you throw
the die twice..(www.smallbusiness.chron.com)
Using the Classical Approach in Business
You can use the classical approach to probability when making business decisions where you don't know the
likelihood of several possible outcomes. You assume they are all equally likely, then look at how many attempts
you will be able to make. However, in your business, if 6 possible outcomes are equally likely, but they are not
affected by how many times you try, you can cut your odds in half with repeated effort. For example, if you
make 2 tries, your effort will have a 2 in 6 chance. Notice that 2/6 = 1/3. You have moved from a 1 in 6 chance
of success to a 1 in 3 chance..(www.smallbusiness.chron.com)
Relative Frequency Approach
The relative frequency approach uses the past to make predictions about the future. You look at how many times
an event has happened and then look at how many opportunities exist for the event to occur. The formula is the
number of times an event occurred divided by the total number of opportunities for the event to
occur..(www.smallbusiness.chron.com)
Using Relative Frequency Approach in Business
You can use relative frequency to improve your business decisions. For example if your research shows there
are 75 failures for every 100 business startups attempted, you would say that 75 out of 100 startups fail. This
reduces to 3/4. That would mean 3 out of 4 startups fail. If you don't do something to change your odds, you can
expect that failure probability. This mathematical reality can give you a sense of urgency in your efforts to be
the 1 out of 4 that succeeds. In fact, you could study the successes to see how they changed the odds in their
favor..(www.smallbusiness.chron.com)
Important Distributions. . . Certain probability distributions occur with such regular- ity in real-life applications that they have been given
their own names. Here, we survey and study basic properties of some of them.
ISSN 2277 8675 DMIETR International Journal on Financial Management (ejournal) Page 60
We will discuss the following distributions:
• Binomial
• Poisson
• Uniform
• Normal
• Exponential
The first two are discreteand the last three continuous.(www.utdallas.edu/~scnic
/OPERA-6301/document/Important of distribution)
Binomial Distribution:
experiment for which there are only two possible outcomes are called Bernoulli experiment
orsometimesBernolli trials. In tossing of a coin, the outcomes can be either Head or tail. The items produced by
a machine can be either defective or non defective. These experiments, each with only two outcomes, are
Bernoulli trials. aIt is traditional in probability and statistical work to arbitrarily label one of the outcomes
success and other failure. In Experiment tossing of coin we might call a head a success and a tail a failure.
If athe probability of success in a certain Bernoulli’s experiment is p and the probability of failure in it is q
then the probability of exactly X successes in n independent trials is given by
P(exactly X successes)=𝑛𝐶𝑥𝑃𝑥𝑞𝑥
Possible Applications for the Binomial Distribution
A manufacturing plant labels items as either defective or acceptable
A firm bidding for contracts will either get a contract or not
A marketing research firm receives survey responses of “yes I will buy” or “no I will not”
New job applicants either accept the offer or reject it
(Common uses of binomial distributions in business include quality control, public opinion surveys, medical
research, and insurance problems. It can be applied to complex processes such as sampling items in factory
production lines or to estimate percentage failure rates of products and components.)
Why It Is Important
The binomial distribution is widely used to test statistical probabilities and significance, and is a good way of
visually detecting unexpected values. It is a useful tool in determining permutations, combinations, and
probabilities, where the outcomes can be broken down into two probabilities (p and q), where p and q are
complementary (i.e., p + q = 1).
For example, tossing a coin has only two possible outcomes, heads or tails. Each of these outcomes has a
theoretical probability of 0.5. Using the binomial expansion, showing all possible outcomes and combinations,
the probability is represented as follows:
(p + q)2 = p2 + 2pq +q2, or more simply, pp + 2pq + qq
If p is heads and q is tails, the theory shows there is only one way to get two heads (pp), two ways to get a head
and a tail (2pq), and one way to get two tails (qq). (www.qfinance.com)
ISSN 2277 8675 DMIETR International Journal on Financial Management (ejournal) Page 61
How It Works in Practice
If I toss a coin 100 times and there are 60 instances of heads and 40 of tails:
n = 100 (the number of opportunities where heads could occur)
k = 60 (the number of heads that did occur)
p = 0.5 (the statistical probability that heads would occur each time)
q = 0.5 (the complementary probability that tails would occur)
using a binomial equation. In all this cases, k represents the number of times a specific outcome is observed, p is
the probability of heads, and q is the complementary probability of tails.
If n = 100, exact binomial probabilities can be calculated using repeated applications of the standard binomial
formula, as below. This works out the probability of exactly k heads:
P(k) = [n! ÷ k!(n – k!)] pkqn – k
This is considered to be the most accurate calculation of binomial probabilities, since it involves precise
calculation. However, it is best used where n is less than 1,000, or where you are using a computer program to
perform more complex calculations on larger.(www.qfinance.com)
Tricks of the Trade
To satisfy the requirements of binomial distribution, the event being studied must display certain
characteristics:
o the number of trials or occurrences are fixed
o there are only two possible outcomes (heads/tails or win/lose, for example)
o all occurrences are independent of each other (tossing a head does not make it more or less likely
you will get the same result next time)
o all outcomes have the same probability of success
Binomial distribution is best applied in cases where the population size is at least 10 times the sample
size, and not to simple random samples.
To find probabilities from a binomial distribution, you can perform a manual calculation, but there are
online calculators available, or you can use a binomial table or computer spreadsheet.
The binomial distribution is sometimes called a Bernoulli experiment or trial.
The binomial probability refers to the probability that a binomial experiment results in exactly x
successes. In the example above, we see that the binomial probability of getting exactly one head in two
coin flips is 0.5.
A cumulative binomial probability refers to the probability that the binomial random variable falls within
a specified range (for example, is greater than or equal to a stated lower limit and less than or equal to a
stated upper limit).
POISSON DISTRIBUTION In probability theory and statistics, the Poisson distribution is a discrete probability distribution that expresses
the probability of a number of events occurring in a fixed period of time if these events occur with a known
average rate and independently of the time since the last event. The Poisson distribution can also be used for
the number of events in other specified intervals such as distance, area or volume.
ISSN 2277 8675 DMIETR International Journal on Financial Management (ejournal) Page 62
If the expected number of occurrences in this interval is λ, then the probability that there are exactly k
occurrences (k being a non-negative integer, k = 0, 1, 2, ...) is equal to
The Poisson distribution arises in connection with Poisson processes. It applies to various phenomena of
discrete nature (that is, those that may happen 0, 1, 2, 3, ... times during a given period of time or in a given
area) whenever the probability of the phenomenon happening is constant in time or space.
Examples of Poisson Random Variables with Respect to Time
The number of cars that cross the Brooklyn Bridge between 9:00 am and 10:00 am on a Monday
morning.
The number of customers that use a McDonald’s drive-thru in a day.
The number of bankruptcies that are filed in a month.
The number of homicides that occur in a year.
Examples of Poisson Random Variables with Respect to Space
The number of defects in a 50-yard roll of fabric.
The number of schools of fish in 100 square miles.
The number of leaks in a specified stretch of a pipeline.
The number of bacteria in a specified culture
Possible Applications for thePoisson Distribution
You use the Poisson distribution when you are interested in the number of times an event occurs in a given
area of opportunity.
An area of opportunityis a continuous unit or interval of time, volume, or such area in which more than one
occurrence of an event can occur.
The number of scratches in a car’s paint
The number of mosquito bites on a person
The number of computer crashes in a day
Tricks of the Trade
Apply the Poisson Distribution when:
You wish to count the number of times an event occurs in a given area of opportunity
The probability that an event occurs in one area of opportunity is the same for all areas of opportunity
The number of events that occur in one area of opportunity is independent of the number of events that
occur in the other areas of opportunity
The probability that two or more events occur in an area of opportunity approaches zero as the area of
opportunity becomes smaller
The average number of events per unit is (lambda)Consequently, the Poisson random variable can be
ISSN 2277 8675 DMIETR International Journal on Financial Management (ejournal) Page 63
"stretched" over longer or shorter time intervals. Since μ is the expected (average) number of events per one
unit of time or space, μt
Applications of the Poisson probability will be such a number per t units. One has to make sure that process
N(t) is stationary within time interval (0,t).
REAL LIFE EXAMPLES IN MEDICAL STATISTICS
Time oriented poisson variables
1. Here’s an example where the Poisson distribution was used in a maternity hospital to work out how many
births would be expected during the night.
The hospital had 3000 deliveries each year, so if these happened randomly around the clock 1000 deliveries
would be expected between the hours of midnight and 8.00 a.m. This is the time when many staff are off duty
and it is important to ensure that there will be enough people to cope with the workload on any particular
night.
The average number of deliveries per night is 1000/365, which is 2.74. From this average rate the probability
of delivering 0,1,2, etc babies each night can be calculated using the Poisson distribution. Some probabilities
are:
P(0) 2.740 e-2.74 / 0! = 0.065
P(1) 2.741 e-2.74 / 1! = 0.177
P(2) 2.742 e-2.74 / 2! = 0.242
P(3) 2.743 e-2.74 / 3! = 0.221
(i) On how many days in the year would 5 or more deliveries be expected? (Ans. 52)
(ii) Over the course of one year, what is the greatest number of deliveries expected in any night? (Ans. 8)
(iii) Why might the pattern of deliveries not follow a Poisson distribution?
(Ans.If deliveries were not random throughout the 24 hours; e.g. if a lot of women had elective caesareans
done during the day).
Note: In this real life example, deliveries in fact followed the Poisson distribution very closely, and the
hospital was able to predict the workload accurately. (www.m-a.org.uk)
Whether one observes patients arriving at an emergency room, cars driving up to a gas station,
decaying radioactive atoms, bank customers coming to their bank, or shoppers being served at a cash
register, the streams of such events typically follow the Poisson process. The underlying assumption is that
the events are statistically independent and the rate, μ, of these events (the expected number of the events
per time unit) is constant.
ISSN 2277 8675 DMIETR International Journal on Financial Management (ejournal) Page 64
The list of applications of the Poisson distribution is very long. To name just a few more:
-hour period . The
number of Airbus 330 aircraft engine shutdowns per 100,000 flight hours. The number of asthma patient
arrivals in a given hour at a walk-in clinic
accidents over a given production time, The number of birth, deaths, marriages, divorces, suicides, and
homicides over a given period of time
The number of visitors to a Web site per minute
The number of calls to consumer hot line in a 5-minute period
number of telephone calls per minute in a small business. The number of arrivals at a turnpike
tollbooth par minute between 3 A.M. and 4 A.M. in January on the Kansas
SPACE ORIENTED POISSON VARIABLES
V-1 buzz bombs, targeting London during WWII
During the World War II, Germans fired thousands of so called English Channel toward London. About 800
bombs managed to rest either did not make it over the water or were destroyed by RAF. A particular case,
presented by Triola (2007, p. 253), focuses on South London. This region was subdivided into 57 each of 0.25
km2. The entire region was hit by By analogy to the number of patients arriving at an emergency room per
one minute, the random variable for the V-1 bomb each area is of the same size, the average number of hits
par one are 537/576 = 0.9288. Figure 3 (Appendix
The probabilities of n V1 bombs falling on a region bombs are calculated in the following way:
P(X=n) =Poisson(n, 0.9288, False)
E(AreaCount | n) =576*Poisson(Feller (1961, p. 145) show compared to the expected numbers provided by
shows the numbers along with a goodness difference between the actual and expected numbers, the chi value
of 1.1903 while the 5% probable critical value of the statistic is quite large, 9.4877. outcomes indicate an
extraordinary fit of the empirical data into the Poisson distribution
difference between Binomial and Poisson?
As a whole both are examples of ‘Discrete Probability Distributions’. Adding to that, ‘Binomial’ is the common
distribution used more often, however ‘Poisson’ is derived as a limiting case of a ‘Binomial’.
According to all these study, we can arrive at a conclusion saying that regardless of the ‘Dependency’ we can
apply ‘Binomial’ for encounter the problems as it is a good approximation even for independent occurrences. In
contrast, the ‘Poisson’ is used at questions/problems with replacement.
If a problem is solved with both the ways, which is for ‘dependent’ question, one must find
the same answer at each instance.
A binomial random variable counts the number of successes in a fixed number of Bernoulli trials, whereas a
Poisson random variable counts the number of successes over a given interval of time or
space.(www.inking.com)
ISSN 2277 8675 DMIETR International Journal on Financial Management (ejournal) Page 65
CONCLUSIONS:Binomial and Poisson processes, may provide opportunities for increasing students'
attentiveness and interests in Statistics .One important lesson learned by the author of this paper is that
presentation of statistical cases.
REFERENCES:
Jerzy Lethowski (Western New England University) Applications of the poisson distribution
www.utdallas.edu/~scnic /OPERA-6301/document/Important of distribution)
Googal-.(www.smallbusiness.chron.com)
Googal-(www.qfinance.com)
Googal-.(www.inking.com)
Googal-(www.qfinance.com)
V- 1 Flying Bomb (2011) Fieseler Fi 103 (Vergeltungswaffe). Retrieved from:
http://www.youtube.com/watch?NR=1&v=QY308O42Ur4&feature=endscreen
Weiers, R. M. (2008) Introductionto Business Statistics. Mason, OH: South-Western, CengageLearning.
Wikipedia-Poisson (2012) Poisson Distribution.
Retrieved from: http://en.wikipedia.org/wiki/Poisson_distribution
Wikipedia-Binomial (2012) Binomial Distribution.
Retrieved from: http://en.wikipedia.org/wiki/Binomial_distribution
Wolfram MathWord(2012) Poisson Distribution.
Retrieved from: http://mathworld.wolfram.com/PoissonProcess.html
ISSN 2277 8675 DMIETR International Journal on Financial Management (ejournal) Page 66
The Role of Corporate Social Responsibility in Successful Business
Dr. Bharat Meghe
Dean – Faculty of Commerce,
RTM Nagpur University
Kamala Nehru Mahavidyalaya, Nagpur
Abstract:
The business environment has undergone vast changes in the recent years in terms of both the nature of
competition and the wave of globalization that has been sweeping across markets. Companies are expanding
their boundaries from the country of their origin to the evolving markets in the developing countries which
have been sometimes referred to as emerging markets. The current trend of globalization has brought a
realization among the firms that in order to compete effectively in a competitive environment; they need
clearly defined business practices with a sound focus on the public interest in the markets.
All firms over the world are beginning to grasp the importance of intangible assets, be it brand name or
employee morale. They realize the vital importance of ethical practices in the business by following the
corporate social responsibilities. This paper focuses on how social responsibilities are becoming a key
ingredient in the business success.
Keywords: CSR, GNI
Introduction
In the last twenty years, there has been a sea change in the nature of the triangular relationship between
companies, the state and the society. No longer can firms continue to act as independent entities regardless of
the interest of the general public. The evolution of the relationship between companies and society has been
one of slow transformation from a philanthropic coexistence to one where the mutual interest of all the
stakeholders is gaining paramount importance. Companies are beginning to realize the fact that in order to
gain strategic initiative and to ensure continued existence, business practices may have to be molded from the
normal practice of solely focusing on profits to factor in public goodwill and responsible business etiquettes.
An examination of some of the factors which have led to the development of the concept of corporate social
responsibility (CSR) would be ideal starting ground for the conceptual development of suitable corporate
business practices for emerging markets.
The business environment has undergone vast changes in the recent years in terms of both the nature of
competition and the wave of globalization that has been sweeping across markets. Companies are expanding
their boundaries from the country of their origin to the evolving markets in the developing countries which
have been sometimes referred to as emerging markets. The current trend of globalization has brought a
realization among the firms that in order to compete effectively in a competitive environment; they need
clearly defined business practices with a sound focus on the public interest in the markets. The increase in
competition among the multinational companies to gain first mover advantage in various developing countries
by establishing goodwill relationships with both the state and the civil society is ample testimony to this
transformation. Secondly, in most of the emerging markets, the state still holds the key to business success
because of the existence of trade and business regulations restricting the freedom of multinational companies
to incorporate their previously successful business doctrines which have been tried and tested in the developed
nations. The state with its duty of protecting the interests of the general public would naturally be inclined to
give preference to companies which take care of the interests of all the stakeholders. Thirdly, emerging
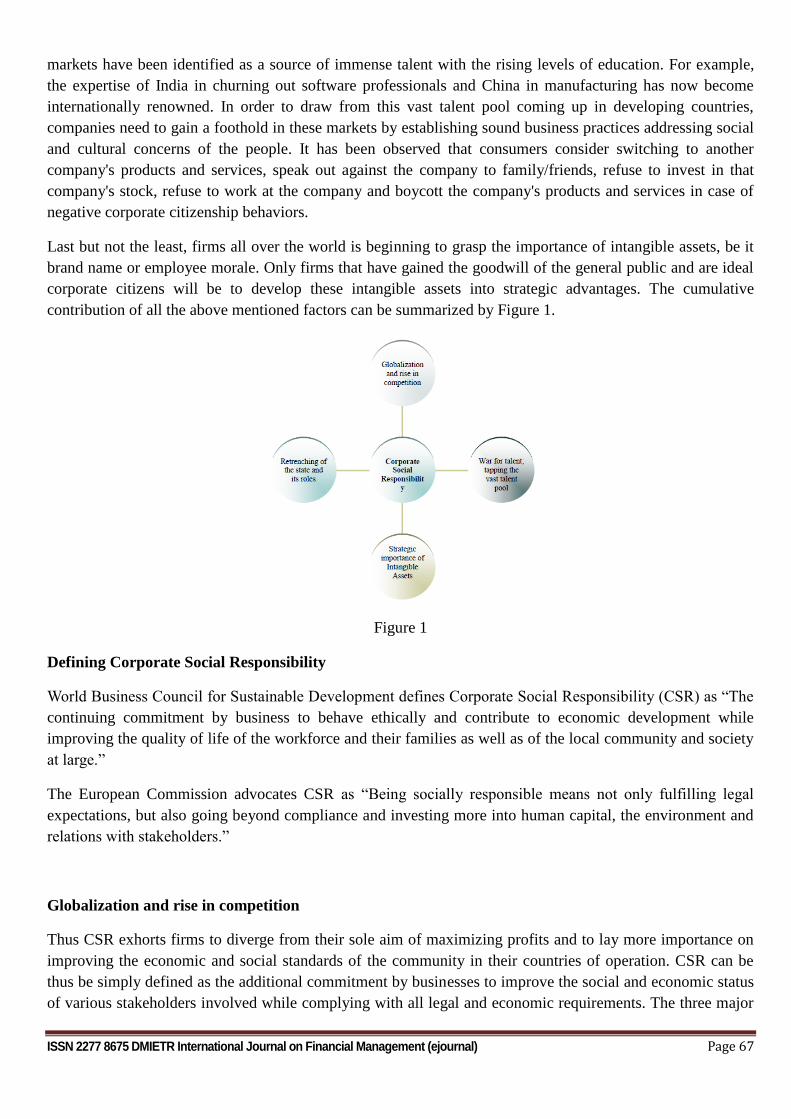
ISSN 2277 8675 DMIETR International Journal on Financial Management (ejournal) Page 67
markets have been identified as a source of immense talent with the rising levels of education. For example,
the expertise of India in churning out software professionals and China in manufacturing has now become
internationally renowned. In order to draw from this vast talent pool coming up in developing countries,
companies need to gain a foothold in these markets by establishing sound business practices addressing social
and cultural concerns of the people. It has been observed that consumers consider switching to another
company's products and services, speak out against the company to family/friends, refuse to invest in that
company's stock, refuse to work at the company and boycott the company's products and services in case of
negative corporate citizenship behaviors.
Last but not the least, firms all over the world is beginning to grasp the importance of intangible assets, be it
brand name or employee morale. Only firms that have gained the goodwill of the general public and are ideal
corporate citizens will be to develop these intangible assets into strategic advantages. The cumulative
contribution of all the above mentioned factors can be summarized by Figure 1.
Figure 1
Defining Corporate Social Responsibility
World Business Council for Sustainable Development defines Corporate Social Responsibility (CSR) as “The
continuing commitment by business to behave ethically and contribute to economic development while
improving the quality of life of the workforce and their families as well as of the local community and society
at large.”
The European Commission advocates CSR as “Being socially responsible means not only fulfilling legal
expectations, but also going beyond compliance and investing more into human capital, the environment and
relations with stakeholders.”
Globalization and rise in competition
Thus CSR exhorts firms to diverge from their sole aim of maximizing profits and to lay more importance on
improving the economic and social standards of the community in their countries of operation. CSR can be
thus be simply defined as the additional commitment by businesses to improve the social and economic status
of various stakeholders involved while complying with all legal and economic requirements. The three major
ISSN 2277 8675 DMIETR International Journal on Financial Management (ejournal) Page 68
elements of CSR are product use which focuses on contribution of industrial products which help in well
being and quality of life of the society, business practice which focuses on good corporate governance and
gives high impetus for the environmental well being and equity which tries for distribution of profits equitably
across different societies especially the host community.
Emerging markets
The term ‘emerging market’ was originally coined by IFC to describe a fairly narrow list of middle-to-higher
income economies among the developing countries, with stock markets in which foreigners could buy
securities. The term’s meaning has since been expanded to include more or less all developing countries.
World Bank says that developing countries are those with a Gross National Income (GNI) per capita of $9,265
or less. The World Bank also classifies economies as low-income (GNI $755 or less), middle-income (GNI
$756–9,265) and high-income (GNI $9,266 or more). Low-income and middle-income economies are
sometimes referred to as developing countries.
The evolution of CSR in these developing economies shows widely varying results. Chambers, Chapple,
Moon and Sullivan evaluate the extent of CSR penetration in seven Asian countries (India, Indonesia,
Malaysia, the Philippines, Singapore, South Korea and Thailand). Many researchers have hypothesized that
CSR in emerging economies is still in a very nascent stage and suitable mechanisms do not exist to ensure that
companies practice CSR with anything other than a charitable outlook. Kemp states “There are numerous
obstacles to achieving corporate responsibility, particularly in many developing countries where the
institutions, standards and appeals system, which give life to CSR in North America and Europe, are relatively
weak.” Chambers, Chapple, Moon and Sullivan measure the extent of CSR penetration in the seven Asian
companies and show that the mean value for the seven countries(even including industrially advanced Japan)
is just 41% compared to say a score of 98% for a developed nation like the United Kingdom.
However, there are exceptions to the mean scores. India for example had an average CSR penetration of 72%
compared to Indonesia’s 24%.
The concept of CSR as visualized in the emerging markets and the developed countries have very different
understanding.
Methods of CSR reporting
Moon distinguishes three types of CSR reporting ‘community involvement’, ‘socially responsible production
processes’ and ‘socially responsible employee relations’. During the initial stages of development of CSR in
emerging economies, the community involvement is more along the lines of a philanthropic involvement with
company involvement limited to developing minimal or rather the absolutely necessary amount of communal
goodwill necessary to operate in the business environment. As compared with the developed countries like US,
CSR in developing countries is seen as part of corporate philanthropy where corporations augment the social
development to support the initiatives of the government. However in the US it is seen as a strategic tool
which helps the organizations to have a legitimate existence in the society. CSR is considered inbuilt in the
business existence of the traditional firms in the emerging markets like India. However, trends in this regard
are heartening with companies trying to establish strategic alliances with the state and the civil society thus
establishing the presence of CSR as an institution in these markets.
The remaining parameters are internal to the firm involving the molding of their business activities while
incorporating CSR practices. As companies start to embrace CSR practices to a greater extent, it leads to
changes in production processes so that all environmental and societal norms are also satisfied even thought
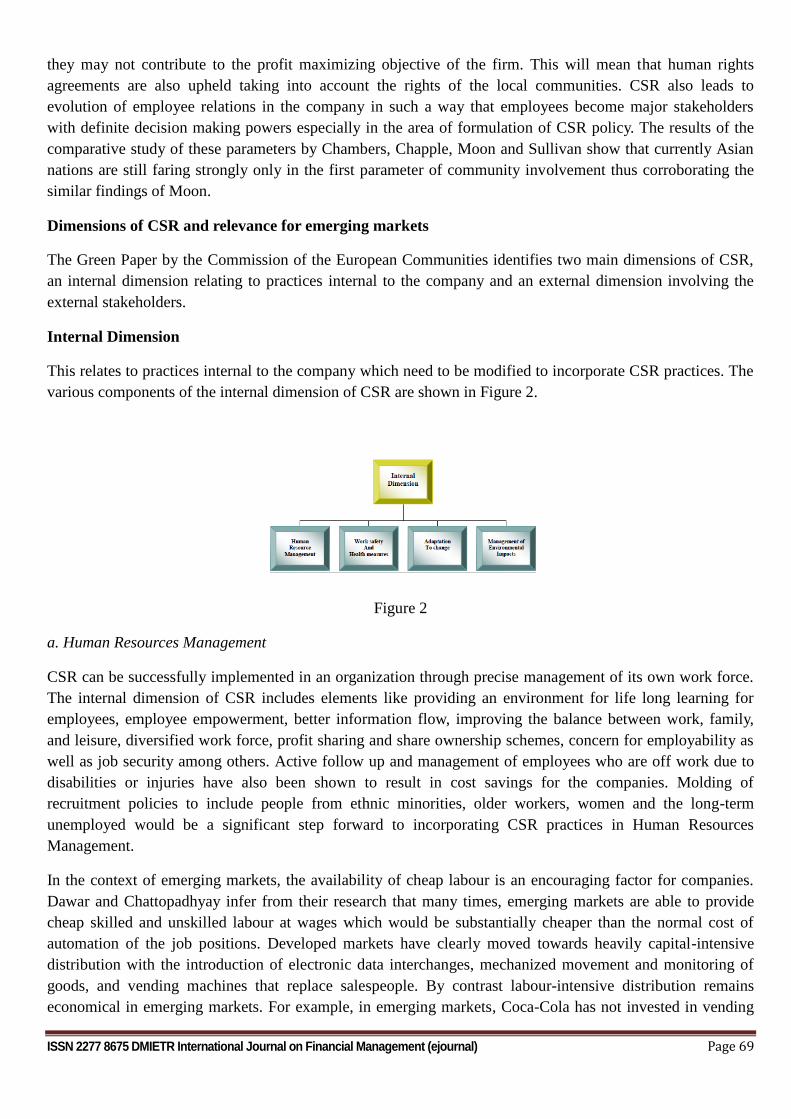
ISSN 2277 8675 DMIETR International Journal on Financial Management (ejournal) Page 69
they may not contribute to the profit maximizing objective of the firm. This will mean that human rights
agreements are also upheld taking into account the rights of the local communities. CSR also leads to
evolution of employee relations in the company in such a way that employees become major stakeholders
with definite decision making powers especially in the area of formulation of CSR policy. The results of the
comparative study of these parameters by Chambers, Chapple, Moon and Sullivan show that currently Asian
nations are still faring strongly only in the first parameter of community involvement thus corroborating the
similar findings of Moon.
Dimensions of CSR and relevance for emerging markets
The Green Paper by the Commission of the European Communities identifies two main dimensions of CSR,
an internal dimension relating to practices internal to the company and an external dimension involving the
external stakeholders.
Internal Dimension
This relates to practices internal to the company which need to be modified to incorporate CSR practices. The
various components of the internal dimension of CSR are shown in Figure 2.
Figure 2
a. Human Resources Management
CSR can be successfully implemented in an organization through precise management of its own work force.
The internal dimension of CSR includes elements like providing an environment for life long learning for
employees, employee empowerment, better information flow, improving the balance between work, family,
and leisure, diversified work force, profit sharing and share ownership schemes, concern for employability as
well as job security among others. Active follow up and management of employees who are off work due to
disabilities or injuries have also been shown to result in cost savings for the companies. Molding of
recruitment policies to include people from ethnic minorities, older workers, women and the long-term
unemployed would be a significant step forward to incorporating CSR practices in Human Resources
Management.
In the context of emerging markets, the availability of cheap labour is an encouraging factor for companies.
Dawar and Chattopadhyay infer from their research that many times, emerging markets are able to provide
cheap skilled and unskilled labour at wages which would be substantially cheaper than the normal cost of
automation of the job positions. Developed markets have clearly moved towards heavily capital-intensive
distribution with the introduction of electronic data interchanges, mechanized movement and monitoring of
goods, and vending machines that replace salespeople. By contrast labour-intensive distribution remains
economical in emerging markets. For example, in emerging markets, Coca-Cola has not invested in vending
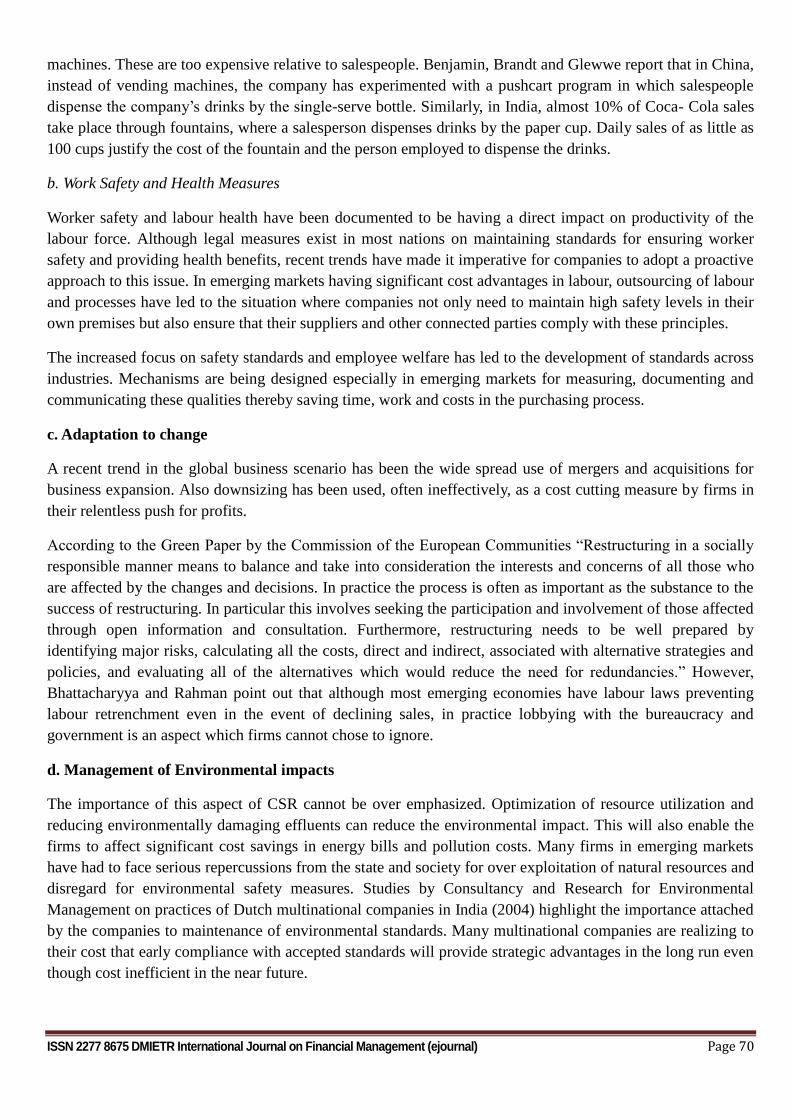
ISSN 2277 8675 DMIETR International Journal on Financial Management (ejournal) Page 70
machines. These are too expensive relative to salespeople. Benjamin, Brandt and Glewwe report that in China,
instead of vending machines, the company has experimented with a pushcart program in which salespeople
dispense the company’s drinks by the single-serve bottle. Similarly, in India, almost 10% of Coca- Cola sales
take place through fountains, where a salesperson dispenses drinks by the paper cup. Daily sales of as little as
100 cups justify the cost of the fountain and the person employed to dispense the drinks.
b. Work Safety and Health Measures
Worker safety and labour health have been documented to be having a direct impact on productivity of the
labour force. Although legal measures exist in most nations on maintaining standards for ensuring worker
safety and providing health benefits, recent trends have made it imperative for companies to adopt a proactive
approach to this issue. In emerging markets having significant cost advantages in labour, outsourcing of labour
and processes have led to the situation where companies not only need to maintain high safety levels in their
own premises but also ensure that their suppliers and other connected parties comply with these principles.
The increased focus on safety standards and employee welfare has led to the development of standards across
industries. Mechanisms are being designed especially in emerging markets for measuring, documenting and
communicating these qualities thereby saving time, work and costs in the purchasing process.
c. Adaptation to change
A recent trend in the global business scenario has been the wide spread use of mergers and acquisitions for
business expansion. Also downsizing has been used, often ineffectively, as a cost cutting measure by firms in
their relentless push for profits.
According to the Green Paper by the Commission of the European Communities “Restructuring in a socially
responsible manner means to balance and take into consideration the interests and concerns of all those who
are affected by the changes and decisions. In practice the process is often as important as the substance to the
success of restructuring. In particular this involves seeking the participation and involvement of those affected
through open information and consultation. Furthermore, restructuring needs to be well prepared by
identifying major risks, calculating all the costs, direct and indirect, associated with alternative strategies and
policies, and evaluating all of the alternatives which would reduce the need for redundancies.” However,
Bhattacharyya and Rahman point out that although most emerging economies have labour laws preventing
labour retrenchment even in the event of declining sales, in practice lobbying with the bureaucracy and
government is an aspect which firms cannot chose to ignore.
d. Management of Environmental impacts
The importance of this aspect of CSR cannot be over emphasized. Optimization of resource utilization and
reducing environmentally damaging effluents can reduce the environmental impact. This will also enable the
firms to affect significant cost savings in energy bills and pollution costs. Many firms in emerging markets
have had to face serious repercussions from the state and society for over exploitation of natural resources and
disregard for environmental safety measures. Studies by Consultancy and Research for Environmental
Management on practices of Dutch multinational companies in India (2004) highlight the importance attached
by the companies to maintenance of environmental standards. Many multinational companies are realizing to
their cost that early compliance with accepted standards will provide strategic advantages in the long run even
though cost inefficient in the near future.
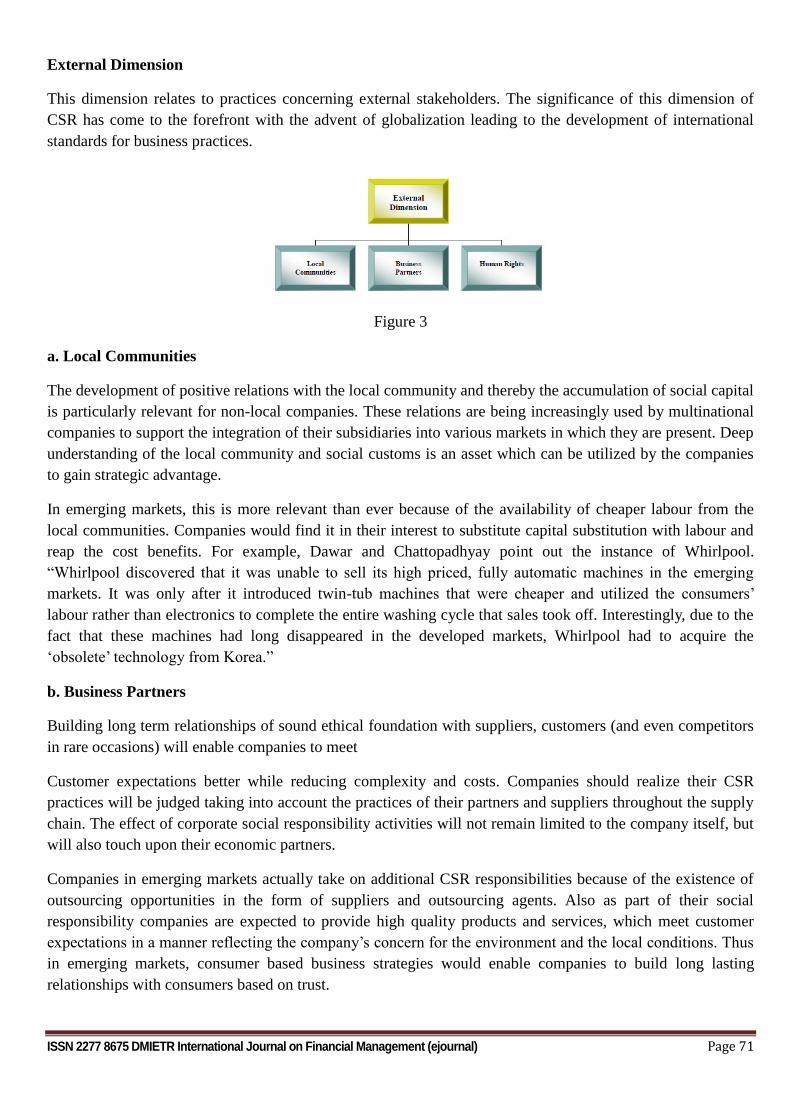
ISSN 2277 8675 DMIETR International Journal on Financial Management (ejournal) Page 71
External Dimension
This dimension relates to practices concerning external stakeholders. The significance of this dimension of
CSR has come to the forefront with the advent of globalization leading to the development of international
standards for business practices.
Figure 3
a. Local Communities
The development of positive relations with the local community and thereby the accumulation of social capital
is particularly relevant for non-local companies. These relations are being increasingly used by multinational
companies to support the integration of their subsidiaries into various markets in which they are present. Deep
understanding of the local community and social customs is an asset which can be utilized by the companies
to gain strategic advantage.
In emerging markets, this is more relevant than ever because of the availability of cheaper labour from the
local communities. Companies would find it in their interest to substitute capital substitution with labour and
reap the cost benefits. For example, Dawar and Chattopadhyay point out the instance of Whirlpool.
“Whirlpool discovered that it was unable to sell its high priced, fully automatic machines in the emerging
markets. It was only after it introduced twin-tub machines that were cheaper and utilized the consumers’
labour rather than electronics to complete the entire washing cycle that sales took off. Interestingly, due to the
fact that these machines had long disappeared in the developed markets, Whirlpool had to acquire the
‘obsolete’ technology from Korea.”
b. Business Partners
Building long term relationships of sound ethical foundation with suppliers, customers (and even competitors
in rare occasions) will enable companies to meet
Customer expectations better while reducing complexity and costs. Companies should realize their CSR
practices will be judged taking into account the practices of their partners and suppliers throughout the supply
chain. The effect of corporate social responsibility activities will not remain limited to the company itself, but
will also touch upon their economic partners.
Companies in emerging markets actually take on additional CSR responsibilities because of the existence of
outsourcing opportunities in the form of suppliers and outsourcing agents. Also as part of their social
responsibility companies are expected to provide high quality products and services, which meet customer
expectations in a manner reflecting the company’s concern for the environment and the local conditions. Thus
in emerging markets, consumer based business strategies would enable companies to build long lasting
relationships with consumers based on trust.
ISSN 2277 8675 DMIETR International Journal on Financial Management (ejournal) Page 72
c. Human Rights
According to Robbins, “Companies operating in countries where human rights are regularly violated may
experience a climate of civil instability and corruption that makes for uneasy relations with government
officials, employees, local communities and shareholders.” Amnesty International states:” Companies have a
direct responsibility to ensure the protection of human rights in their own operations. They also have a
responsibility to use their influence to mitigate the violation of human rights by governments, the forces of
law and order or opposition groups in the countries in which they operate.” The Caux Round Table Principles
state that companies have a responsibility to respect human rights and democratic institutions; and promote
them wherever practical.
In the context of emerging markets, operations of companies should not impinge on the land rights of the local
community. In particular, the company needs to make sure that people are not forcibly removed from their
homes and their livelihoods are not endangered. There is the growing need to develop proper consultative
processes with local groups protesting against projects or operations in which they are involved. Firms also
need to build confidence in the local community that people (including union members) participating in
peaceful protests against company operations are not intimidated, arrested or in any other way threatened.
Also, companies can take steps to ensure forced labour is not used in their own, or their suppliers’ operations.
According to Robbins (2000), there are reports of Gulags or prison labour camps in China producing products
that are then sold locally or exported. An example of foreign companies benefiting from the ruling regime’s
abuse of its people is the building of the gas pipeline in Burma. Numerous reports tell of the use of forced
labour on a grand scale. Companies need to ensure that human rights principles are withheld in all their
operations and related activities in emerging markets.
Redesigning marketing paradigms for emerging markets
The last decade has seen a mad rush amongst multinational companies to gain first mover advantages in
emerging markets by establishing operations and subsidiaries. However most of the firms have found out to
their cost that local competition was not as easy to overcome as they had thought with matters made being
worse by cutthroat competition amongst the multinationals themselves. Most multinationals are beginning to
realize that loss making operations cannot be continued year after year under the pretext of investment for
future expectation of profits. It is high time that the local subsidiaries start to deliver profits of their rather than
continuing to act as sinks of the firm’s global resources.
According to Dawar and Chattopadhyay “Local operations now realize that the three to five percent of
consumers in emerging markets who have global preferences and purchasing power no longer suffice as the
only target market. Instead, they must delve deeper into the local consumer base in order to deliver on the
promise of tapping into billion-consumer markets”. Batra argues that the usual business strategy of using
products that have been historically successful in developed nations will not work in emerging markets.
Prahlad and Lieberthal point out that companies must make the transition in their business strategy of
‘thinking globally’ to ‘thinking locally’ as each of the merging markets represents an intriguing challenge for
marketing with its vast diversities existing across nations and even within nations in culture and socio
economic conditions. It is in marketing across such diverse cultures and varying conditions that the concept of
corporate social responsibility becomes critical to success. In this paper, we will focus on two main paradigms
of marketing in which CSR plays an important part.
ISSN 2277 8675 DMIETR International Journal on Financial Management (ejournal) Page 73
a. Customer Segmentation and Consumer behavior
There is an urgent need for modifying currently existing customer segmentation techniques. While
segmentation based on finer product features may have been successful in the industrially advanced nations,
such fine distinctions may not strike a cord with consumers in the emerging markets. This is amply
demonstrated in the case of consumer products like toilet soaps where market segmentation techniques in the
developed nations are based on value provided by products, like fragrance, anti-aging etc. However the mass
market in emerging economies with lesser sophisticated consumers may not be compliant to such fine
segmentation. Segmentation techniques will need more careful analysis of consumer behavior with significant
input from demographic data. For example, Dawar and Chattopadhyay point out that “Here, consumers dislike
products that evolve too rapidly, making their recent purchases obsolete. Instead, the need is for basic,
functional, long lasting products. The Volkswagen Beetle remained the largest selling car in Brazil long after it
had been phased out of the affluent markets and despite competitive assaults by other manufacturers with
newer models. The largest selling car in China is still the Volkswagen Santana, a model that was phased out of
developed markets 15 years ago.” Thus clearly, in depth analysis of consumer behavior is necessary in
emerging markets although the level of customer sophistication may be less. Here CSR has an important role
to play especially in building up trust in the minds of the consumers. In an emerging market where consumers
are looking for functional products which last longer and accelerated obsolescence is not a problem like in
developed markets, the consumer perception about the company brand assumes significance. A company
which builds the image of producing quality products that last longer though they may not be on the cutting
edge of technology will actually be able to gain strategic advantage in emerging economies.
b. Distribution
Emerging markets, especially those in Asia have posed significant distribution challenges to multinational
companies. Often companies have had to abandon distribution systems tried and tested in developed nations
and start developing a customized distribution mechanism specific to the country of operation. Dawar and
Chattopadhyay estimate that that there are 9 million small independently owned grocery shops in China that
have limited working capital and, typically, occupy fewer than 300 square feet. Multi layered distribution
systems have to be used although this increases the distance between the manufacturers and consumers. Yet in
order to achieve volume levels necessary to overcome the thin margins prevalent in emerging markets, this is
sometimes absolutely necessary.
CSR is instrumental in relationship building with retailers. Building relationships in a fragmented retail
environment requires an understanding of retailers’ interests. Successful manufacturers creatively develop
new revenue activities for the retailer. Batra illustrates the example of United Phosphorous Limited (UPL), an
Indian crop protection company, which realized its lost opportunity due to the fact that that in its rural markets
small farmers were not applying pesticide at all, or applying it inappropriately due to the lack of application
equipment. Most farmers were unable to afford the huge capital cost of the equipment. UPL turned this into
their advantage by designing a programme to arrange bank loans for the purchase of application equipment
and educated the farmers on additional revenue possibilities from renting the equipment resulting in an added
revenue stream for rural retailers and additional sales of pesticides.
Violation of CSR principles- Case of Coca Cola in India:
The high degree of public protests against the Coca Cola plant in Plachimada, Kerala, India got international
attention and also led to government intervention for closure of the plant. The plant at Plachimada was alleged
to have exploited the ground water resources leading to drying up of wells and other natural water resources in
ISSN 2277 8675 DMIETR International Journal on Financial Management (ejournal) Page 74
the area. The entire region which was a thriving agricultural land had to rely on water supplied by tankers.
Coca Cola was drawing 1.5 million liters/day from the common groundwater resource. However due to
inherent water scarcity the company is able to extract only 800,000 liters from the bore wells. The company
drew water from the nearby villages to compensate for the lack of availability causing parched lands of more
than 2000 people residing within 1.2 miles of the factory.
The Coca Cola Company had to deal with protests from the local community and supporting environmental
conservation groups. Protesters picketed the factory gates for a long period of time causing large scale media
attention. Adding to the water exploitation, Coca Cola was accused of supplying poisonous waste as fertilizer
to the local farmers. Tests done by an independent agency on the behalf of BBC showed that the sludge
contained high levels of Lead and Cadmium (Srivastava, 2004). The sludge which was disposed off in open
ground ran along with rain water to the natural water resources. The contamination caused by the sludge has
allegedly caused allergic symptoms and perpetual headache to the local population. Tests also show that the
water available in the wells is contaminated and unsuitable for consumption. The Kerala incidents were not
isolated ones and the company had to face similar accusations from various parts of the country. For example
in Varanasi, the local community protested against Coca Cola for exploiting water resources and spilling
waste into the sacred Ganges. Added to these were the findings from the Centre for Science and Environment
that twelve large soft-drink brands manufactured by Coca-Cola and its rival Pepsi, sold in and around Delhi,
contained a cocktail of pesticide residues, including chemicals which can cause cancer, damage the nervous
and reproductive systems and reduce bone mineral density.
Coca Cola is one of the most recognized brands across the globe and is associated with a certain style of life.
Coca Cola is also associated as a representative of globalization and essentially western culture. It ranks
among one of the top foreign investors in India. However the protests from the local community have led to
world wide reaction and has even led to open campaigns for boycott of products of Coca Cola. The
government of Kerala also ordered the stopping of operations of the plant at Plachimada to safeguard the
interests of the local community.
Coca Cola’s behavior in its expanding Indian market has led to world wide apprehension with the
international media and agencies showing support to the protests against the multinational. There were
campaigns for international boycott of Coca Cola’s products. In India the protests were also directed against
MNCs in general as there were demands for irresponsible MNCs to leave the country.
Coca Cola responded to these by litigations in the court and applying pressures through its power centers in
US. Public Relations agencies were hired to neutralize the situation. The company also issued releases which
mentions about its socially responsible behavior and good corporate citizenship.
The case clearly shows that emerging markets can respond and protest against irresponsible behaviors of
MNCs. However the bad publicity and loss of brand value has repercussions not only in the local markets but
also in the global market scenario. The case of Coca Cola also shows that emerging markets might have loose
laws which do not protect the interests of the local population or laws that are not implemented properly.
However it is in the best interest of the corporations to take care of the welfare of the local community. The
adverse publicity caused by the protests and media coverage brings out high degree of negative public
response for the product safety of the company.
ISSN 2277 8675 DMIETR International Journal on Financial Management (ejournal) Page 75
Conclusion
Emerging markets like India have drawn the attention of large MNCs for the potential of market growth.
These markets are untapped and give entirely new domain for operations. However many MNCs also take the
markets for granted and exploit the laxity in the norms of operations to their advantage. The lack of concern
for the local community, the consumers and the environment by these corporations has created large scale
public debate and action. It is important in this context to understand that the sustainable business growth is
associated with care for the community and markets the corporations operate in. The negative publicity caused
by the actions of MNCs has led to suspicion about their operations in the general public in these markets. The
case of Coca Cola also proves without doubt that irresponsible corporate behavior can have repercussion
throughout their global markets.
References
1. Batra, R. (1999). “Marketing Issues and Challenges in Transitional Economies,” in Marketing Issues in
Transitional Economies, Rajeev Batra, ed, Kluwer Academic Publishers, Boston: MA, 3-35.
2. Benjamin, D., Brandt, L., Glewwe, P., & Guo, L. (2000). Markets, Human Capital, and Inequality:
Evidence from Rural China, No. 298 , Davidson institute Working Paper Series
3. Bhattacharyya, S.K., & Rahman, Z. (2003). Why large local conglomerates may not work in emerging
markets, European Business Review, Vol 15, No 2 , pp. 105-115.
4. Chambers, E., Chapple, W., Moon ,J. & Sullivan, M. (n.d). CSR in Asia: A seven country study of CSR
website reporting
5. Corporate Social Responsibility in India, Policy and practices of Dutch companies, CREM-report nr.
03.650,Amsterdam, The Netherlands
6. Dawar, N. & Chattopadhyay, A. (2000).Rethinking Marketing Programs for Emerging Markets ,Davidson
institute Working Paper Series
7. Definition of Emerging Economies, Global Economic Prospects and the Developing Countries, World
Bank, (2002)
8. EU Green Paper (2001), Promoting a European Framework for Corporate Social Responsibility, Brussels,
Commission of the European Communities
9. Global Economic Prospects and the Developing Countries, World Bank, 2002.) No. 09-2003 ICCSR
Research Paper Series - ISSN 1479-5124
10. Edenkamp, P (2002). Insights into how consumers are thinking, how they are acting and why, Brandweek,
Vol. 43, Issue 36, pp 16 -20Jayaraman, N. (2002).Coca Cola parches agricultural land in India,
11. Gray, R. (2001). Social and Environmental Responsibility, Sustainability and Accountability, Can the
Corporate Sector Deliver? , Glasgow
12. Krishnan, S. (2001). Corporate social responsibility: How and why in India
13. Kemp, M. (2001) Corporate Social Responsibility in Indonesia: Quixotic Dream or Confident
Expectation? ,Technology, Business & Society, Programme Paper No. 6,
14. Mohan, A. (2001). ‘Corporate Citizenship: Perspectives from India’ , Journal of Corporate Citizenship,
Spring, pp 107-117.
15. Moon, J. (2002). ‘Corporate Social Responsibility: An Overview’ in International Directory of Corporate
Philanthropy, London, Europa Publications
16. Prahalad, C. K. & Kenneth, L. (1998), “The End of Corporate Imperialism,” Harvard Business Review,
July-Aug, pp. 68-79.
17. Raynard ,P., & Forstater, M. (2002), Corporate Social Responsibility: Implications for Small and Medium
Enterprises in Developing Countries, United Nations Industrial Development Organization
18. Warhust, A. (2001). “Corporate Citizenship and Corporate Social Investment: Drivers of Tri-Sector
Partnerships”, Journal of Corporate Citizenship, Spring, pp 57-73.
19. Robbins, N. (2000).Position Paper on Emerging Markets and Human Rights, Henderson Global Investors.
ISSN 2277 8675 DMIETR International Journal on Financial Management (ejournal) Page 76
BANCASSURANCE-A VALUABLE TOOL FOR DEVELOPING
INSURANCE IN EMERGING MARKETS WITH SPECIAL
REFERENCE TO HDFC BANK.
Prof. Akash Agrawal 1, Dr. Shakeel Sattar 2, Dr. Shailesh Kediya3, Prof. Krunal Parekh 4
Assistant Professor 1, 2, 3
1, 4 Datta Meghe Institute of Management Studies Management Studies, Nagpur, (M.S.) India. 2 H. B .T Arts & Commerce College, Nagpur 3, Datta Meghe Institute of Engineering, Technology & Research, Wardha, (M.S.) India.
ABSTRACT
‘BANCASSURANCE’ as term itself clears the meaning. It’s a combination of the term ‘Bank’ and ‘Insurance’.
It means that insurance companies have started selling their products through banks. It’s a new concept to
Indian financial market but it is very widely used in western and developed countries. Bancassurance is the
most popular in Europe as the simplest way of distribution of insurance products through the banks. It is
basically selling insurance products and services by leveraging the vast customer base of a bank and fulfilling
the banking and insurance needs of the customers at the same time. It takes the various forms depending upon
the demography, economic and legislative climate of the country, while demographic climate will determine
the kinds of insurance products, economic climate will determine the trends in terms of turnover, market
shares etc. However Banc assurance is relatively a new term for Indian financial markets.
KEY WORDS: Bank, Insurance, customer base, demography, legislative climate.
INTRODUCTION
World over the idea of separation of roles between banks and other financial activities has become
redundant. Even in the United States which was known for strict separation of banking and non- banking
activities during the Glass-Steagall Act regime broke the dividing wall. The post Gramm-Leach-Bliley
(GLB) Act, 1999 scenario, it is stated to have indicated increased preference for banks conterminously
dealing with other non-banking financial products, including the insurance products. In Asian countries
(e.g., Taiwan, Singapore, Japan, etc.) to the trend has been set towards financial supermarket. The financial
liberalization and financial innovations have drawn the worlds of banking and insurance closer together, de
segmenting the financial industry and spurring competition (Knight, 2005). Therefore, banks dealing in
insurance products have increasingly become accepted norm rather than exception.
Bancassurance is the convergence of Banking and Insurance It was developed in Europe .In Asia Singapore,
Taiwan and Hong Kong are ahead in Bancassurance , with India and China taking tentative steps towards it.
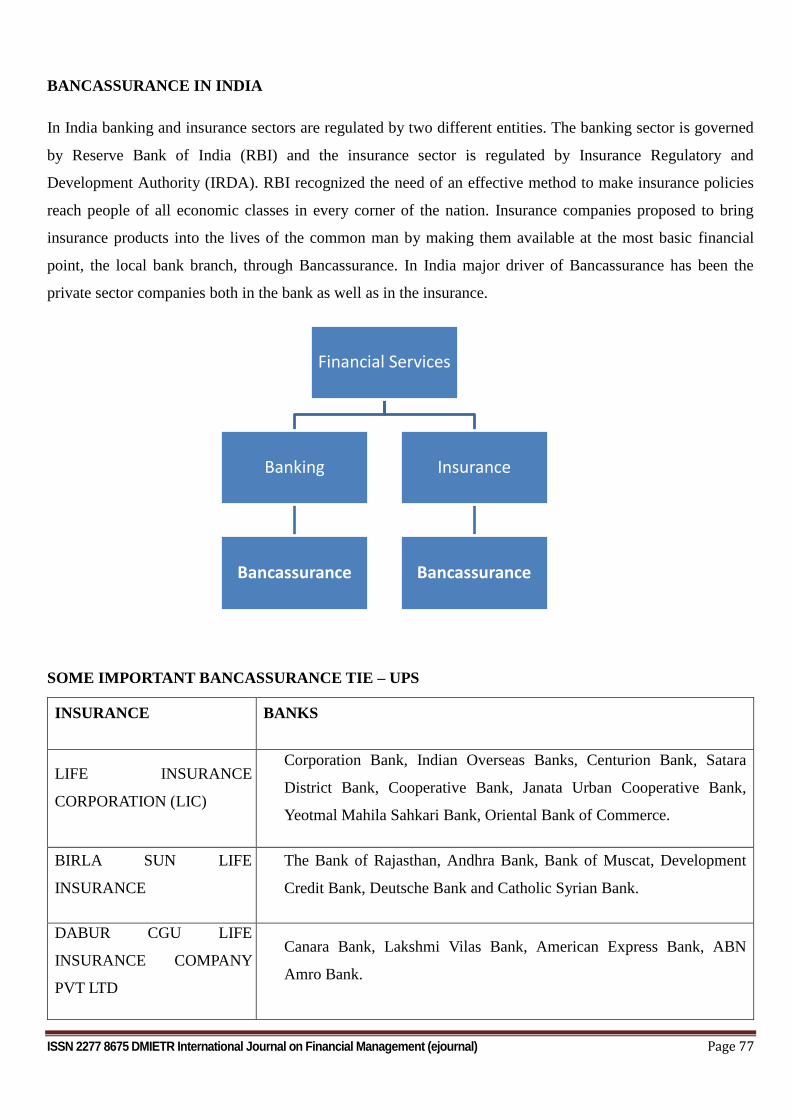
ISSN 2277 8675 DMIETR International Journal on Financial Management (ejournal) Page 77
BANCASSURANCE IN INDIA
In India banking and insurance sectors are regulated by two different entities. The banking sector is governed
by Reserve Bank of India (RBI) and the insurance sector is regulated by Insurance Regulatory and
Development Authority (IRDA). RBI recognized the need of an effective method to make insurance policies
reach people of all economic classes in every corner of the nation. Insurance companies proposed to bring
insurance products into the lives of the common man by making them available at the most basic financial
point, the local bank branch, through Bancassurance. In India major driver of Bancassurance has been the
private sector companies both in the bank as well as in the insurance.
SOME IMPORTANT BANCASSURANCE TIE – UPS
INSURANCE BANKS
LIFE INSURANCE
CORPORATION (LIC)
Corporation Bank, Indian Overseas Banks, Centurion Bank, Satara
District Bank, Cooperative Bank, Janata Urban Cooperative Bank,
Yeotmal Mahila Sahkari Bank, Oriental Bank of Commerce.
BIRLA SUN LIFE
INSURANCE
The Bank of Rajasthan, Andhra Bank, Bank of Muscat, Development
Credit Bank, Deutsche Bank and Catholic Syrian Bank.
DABUR CGU LIFE
INSURANCE COMPANY
PVT LTD
Canara Bank, Lakshmi Vilas Bank, American Express Bank, ABN
Amro Bank.
Financial Services
Banking
Bancassurance
Insurance
Bancassurance
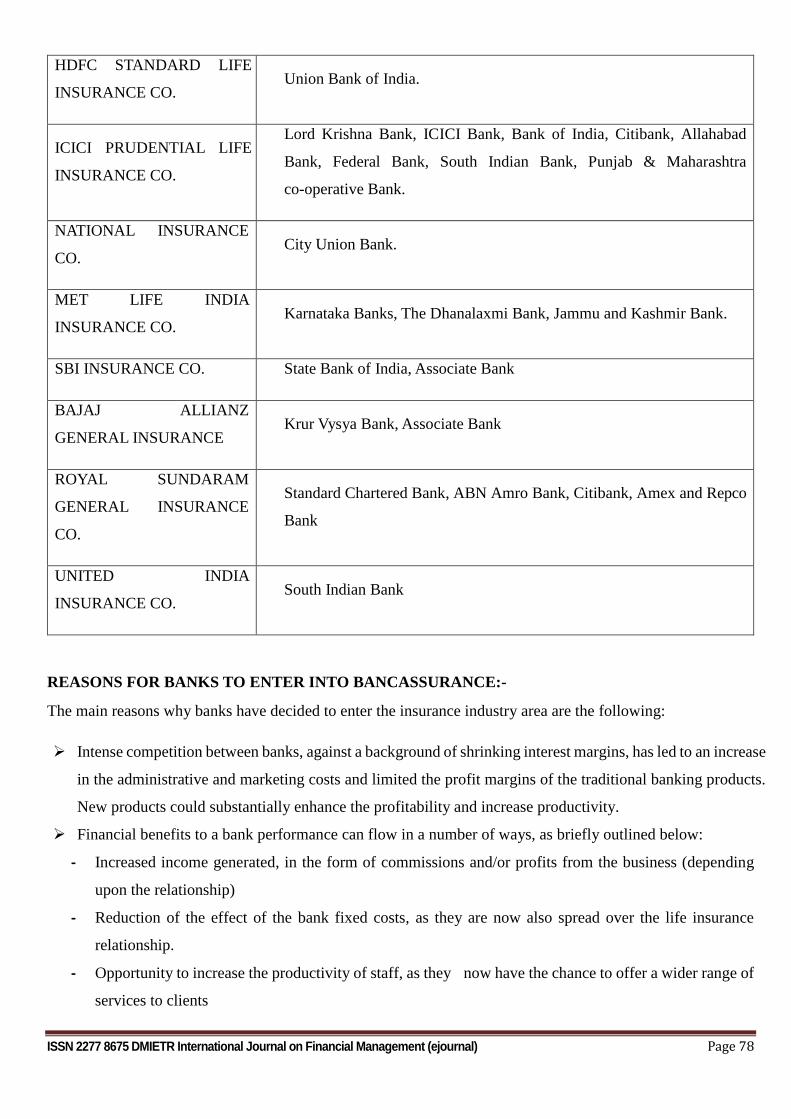
ISSN 2277 8675 DMIETR International Journal on Financial Management (ejournal) Page 78
HDFC STANDARD LIFE
INSURANCE CO. Union Bank of India.
ICICI PRUDENTIAL LIFE
INSURANCE CO.
Lord Krishna Bank, ICICI Bank, Bank of India, Citibank, Allahabad
Bank, Federal Bank, South Indian Bank, Punjab & Maharashtra
co-operative Bank.
NATIONAL INSURANCE
CO. City Union Bank.
MET LIFE INDIA
INSURANCE CO. Karnataka Banks, The Dhanalaxmi Bank, Jammu and Kashmir Bank.
SBI INSURANCE CO. State Bank of India, Associate Bank
BAJAJ ALLIANZ
GENERAL INSURANCE Krur Vysya Bank, Associate Bank
ROYAL SUNDARAM
GENERAL INSURANCE
CO.
Standard Chartered Bank, ABN Amro Bank, Citibank, Amex and Repco
Bank
UNITED INDIA
INSURANCE CO. South Indian Bank
REASONS FOR BANKS TO ENTER INTO BANCASSURANCE:-
The main reasons why banks have decided to enter the insurance industry area are the following:
Intense competition between banks, against a background of shrinking interest margins, has led to an increase
in the administrative and marketing costs and limited the profit margins of the traditional banking products.
New products could substantially enhance the profitability and increase productivity.
Financial benefits to a bank performance can flow in a number of ways, as briefly outlined below:
- Increased income generated, in the form of commissions and/or profits from the business (depending
upon the relationship)
- Reduction of the effect of the bank fixed costs, as they are now also spread over the life insurance
relationship.
- Opportunity to increase the productivity of staff, as they now have the chance to offer a wider range of
services to clients
ISSN 2277 8675 DMIETR International Journal on Financial Management (ejournal) Page 79
Customer preferences regarding investments are changing. For medium-term and long-term investments
there is a trend away from deposits and toward insurance products and mutual funds where the return is
usually higher than the return on traditional deposit accounts. This shift in investment preferences has led to
a reduction in the share of personal savings held as deposits, traditionally the core element of profitability
for a bank which manages clients money. Banks have sought to offset some of the losses by entering life
insurance business. Life insurance is also frequently supported by favorable tax treatment to encourage
private provision for protection or retirement planning. This preferential treatment makes insurance
products more attractive to customers and banks see an opportunity for profitable sales of such products.
Client relationship management has become a key strategy. To build and maintain client relationships,
banks and insurers are forming partnerships to provide their clients with a wide range of bank and
insurance products from one source.
The realization that joint bank and insurance products can be better for the customer as they provide more
complete solutions than traditional standalone banking or insurance products.
Banks are experiencing the increased mobility of their customers, who to a great extent tend to have
accounts with more than one bank. Therefore there is a strong need for customer loyalty to an organization
to be enhanced.
ABOUT HDFC BANK:
HDFC bank was incorporated in August 1994 in the name of 'HDFC Bank Limited', with its registered office in
Mumbai, India. The Housing Development Finance Corporation Limited (HDFC) was amongst the first to
receive an 'in principle' approval from the Reserve Bank of India (RBI) to set up a bank in the private sector, as
part of the RBI's liberalization of the Indian Banking Industry in 1994.It commenced operations as a Scheduled
Commercial Bank on 16th January 1995. The bank has grown consistently and is now amongst the leading
players in the industry. In a milestone transaction in the Indian banking industry, Times Bank Limited (another
new private sector bank promoted by Bennett, Coleman & Co./Times Group) was merged with HDFC Bank
Ltd., effective February 26, 2000. The acquisition added significant value to HDFC Bank in terms of increased
branch network, expanded geographic reach, enhanced customer base, skilled manpower and the opportunity to
cross-sell and leverage alternative delivery channels. The Bank at present has an enviable network of over 746
branches spread over 329 cities across India. All branches are linked on an online real-time basis. Customers in
over 120 locations are also serviced through Telephone Banking. The Bank's expansion plans take into account
the need to have a presence in all major industrial and commercial centers where its corporate customers are
located as well as the need to build a strong retail customer base for both deposits and loan products. The Bank
also has a network of about over1647-networked ATMs across these cities. Moreover, all domestic and
ISSN 2277 8675 DMIETR International Journal on Financial Management (ejournal) Page 80
international Visa/MasterCard, Visa Electron/Maestro, Plus/Cirrus and American Express Credit/Charge
cardholders can access HDFC Bank’s ATM network.
LITERATURE REVIEW
It is important to outline the impact that bancassurance has had on differing regions around the world, as well as
looking at the major regulations that impact the further growth of bancassurance. Below, is provided with a brief
synopsis of bancassurance markets in certain key areas.
The majority of past studies have focused mainly on the risk and profitability effects resulting from the union of
a banking and non-banking firm. One of the earliest studies in this area was performed by Boyd and Graham
(1986). They conducted a risk-of-failure analysis and looked at two periods around a new Federal Reserve
policy (1974s go-slow policy). they found that bank holding companies (BHCs) involvement in non-banking
activities is significantly positively correlated with the risk of failure over the period 1971-1977, while the
period 1978-1983 showed no significance, thus indicating that the new policy had a considerable impact on
bank holding company (BHC) expansion into non-banking activities. Boyd and Graham (1988) followed their
1986 study with a paper that used a simulation approach, whereby they simulated possible mergers between
banking and non-banking companies which were then compared to existing BHCs in order to determine
whether the risk of bankruptcy will increase of decrease should expansion be allowed in to the non-banking
industry, and also to determine the concurrent effect on company profitability. Their main finding was that the
risk of bankruptcy only declined should the BHC expand into the life insurance practice. Brewers (1989) study
finds similar risk reduction benefits existing however cannot specify whether they originate as a result of
diversification, regulation or efficiency gains. Boyd, Graham and Hewitt (1993) build on Boyd et al. (1988) by
conducting a simulation study. They once again conclude that mergers of BHCs with insurance companies may
reduce risk, whereas those with securities or real-estate firms will not. Saunders and Walter (1994) and Lown,
Osler, Strahan and Sufi (2000) use a similar method to Boyd and Graham (1988) and obtain similar results with
more current data. Estrella (2001) examines diversification benefits for banks by using proforma mergers. In
contrast to previous studies that incorporate accounting data, Estrella uses market data and a measure of the
likelihood of failure that is derived through the application of option pricing theory to the valuation of the firm.
the findings indicate that banking and insurance companies are likely to experience gains on both sides in the
majority of the cases.
RESEARCH METHODOLOGY
This is basically descriptive research design. This research has been done with the help of primary and
secondary method of data collection. The structure questionnaire has been prepared to analyze the success rate
of the Bancasuurance to the customers. The sample size of customers is 100 and stratified random sampling
has been used in this regard. The area of sample collection is Nagpur.
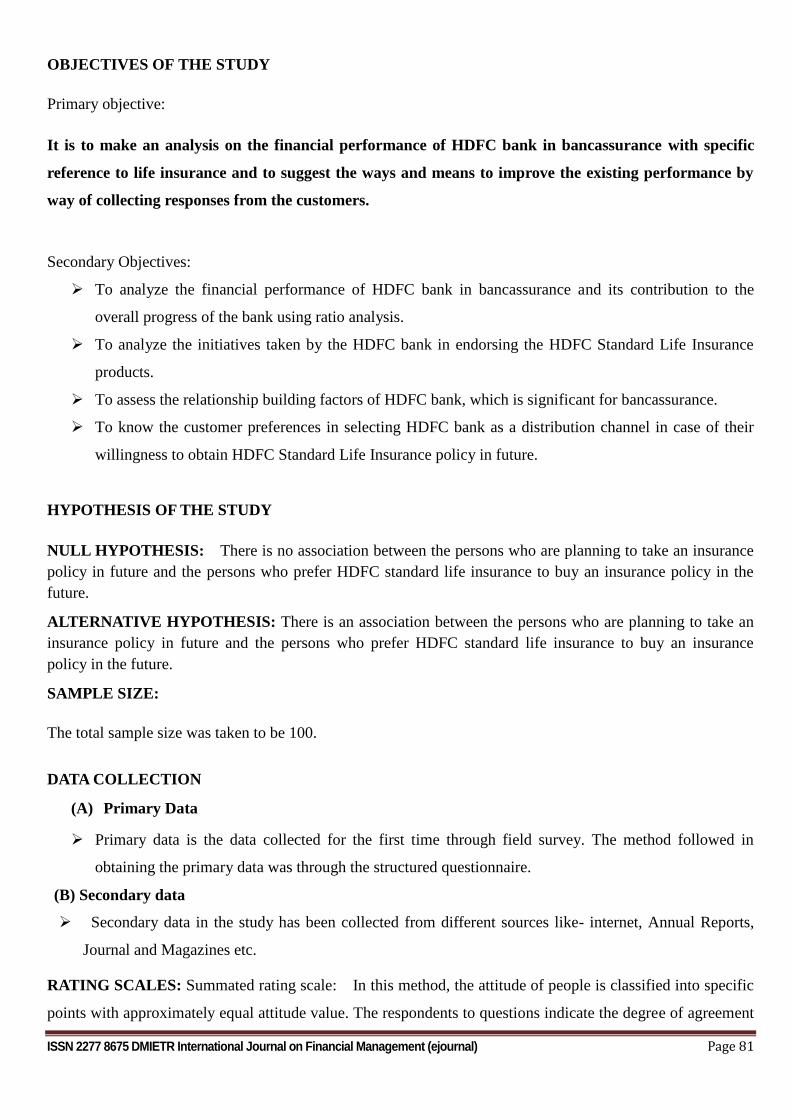
ISSN 2277 8675 DMIETR International Journal on Financial Management (ejournal) Page 81
OBJECTIVES OF THE STUDY
Primary objective:
It is to make an analysis on the financial performance of HDFC bank in bancassurance with specific
reference to life insurance and to suggest the ways and means to improve the existing performance by
way of collecting responses from the customers.
Secondary Objectives:
To analyze the financial performance of HDFC bank in bancassurance and its contribution to the
overall progress of the bank using ratio analysis.
To analyze the initiatives taken by the HDFC bank in endorsing the HDFC Standard Life Insurance
products.
To assess the relationship building factors of HDFC bank, which is significant for bancassurance.
To know the customer preferences in selecting HDFC bank as a distribution channel in case of their
willingness to obtain HDFC Standard Life Insurance policy in future.
HYPOTHESIS OF THE STUDY
NULL HYPOTHESIS: There is no association between the persons who are planning to take an insurance
policy in future and the persons who prefer HDFC standard life insurance to buy an insurance policy in the
future.
ALTERNATIVE HYPOTHESIS: There is an association between the persons who are planning to take an
insurance policy in future and the persons who prefer HDFC standard life insurance to buy an insurance
policy in the future.
SAMPLE SIZE:
The total sample size was taken to be 100.
DATA COLLECTION
(A) Primary Data
Primary data is the data collected for the first time through field survey. The method followed in
obtaining the primary data was through the structured questionnaire.
(B) Secondary data
Secondary data in the study has been collected from different sources like- internet, Annual Reports,
Journal and Magazines etc.
RATING SCALES: Summated rating scale: In this method, the attitude of people is classified into specific
points with approximately equal attitude value. The respondents to questions indicate the degree of agreement
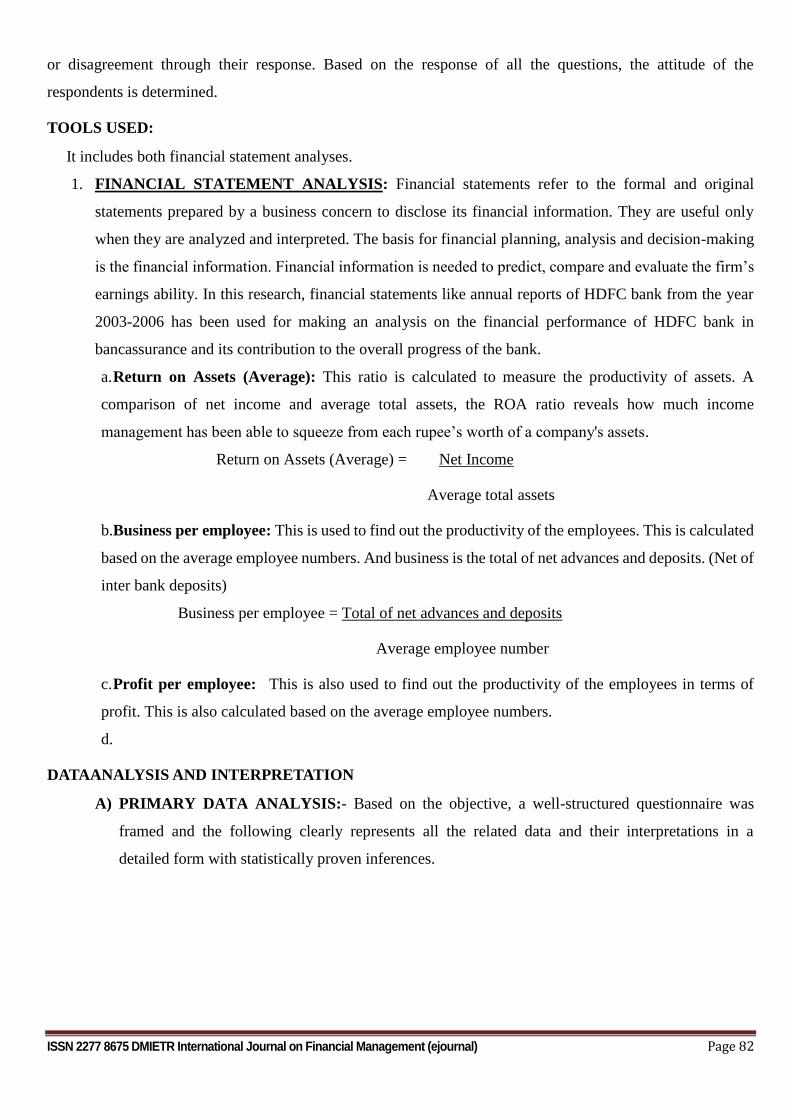
ISSN 2277 8675 DMIETR International Journal on Financial Management (ejournal) Page 82
or disagreement through their response. Based on the response of all the questions, the attitude of the
respondents is determined.
TOOLS USED:
It includes both financial statement analyses.
1. FINANCIAL STATEMENT ANALYSIS: Financial statements refer to the formal and original
statements prepared by a business concern to disclose its financial information. They are useful only
when they are analyzed and interpreted. The basis for financial planning, analysis and decision-making
is the financial information. Financial information is needed to predict, compare and evaluate the firm’s
earnings ability. In this research, financial statements like annual reports of HDFC bank from the year
2003-2006 has been used for making an analysis on the financial performance of HDFC bank in
bancassurance and its contribution to the overall progress of the bank.
a. Return on Assets (Average): This ratio is calculated to measure the productivity of assets. A
comparison of net income and average total assets, the ROA ratio reveals how much income
management has been able to squeeze from each rupee’s worth of a company's assets.
Return on Assets (Average) = Net Income
Average total assets
b.Business per employee: This is used to find out the productivity of the employees. This is calculated
based on the average employee numbers. And business is the total of net advances and deposits. (Net of
inter bank deposits)
Business per employee = Total of net advances and deposits
Average employee number
c. Profit per employee: This is also used to find out the productivity of the employees in terms of
profit. This is also calculated based on the average employee numbers.
d.
DATAANALYSIS AND INTERPRETATION
A) PRIMARY DATA ANALYSIS:- Based on the objective, a well-structured questionnaire was
framed and the following clearly represents all the related data and their interpretations in a
detailed form with statistically proven inferences.
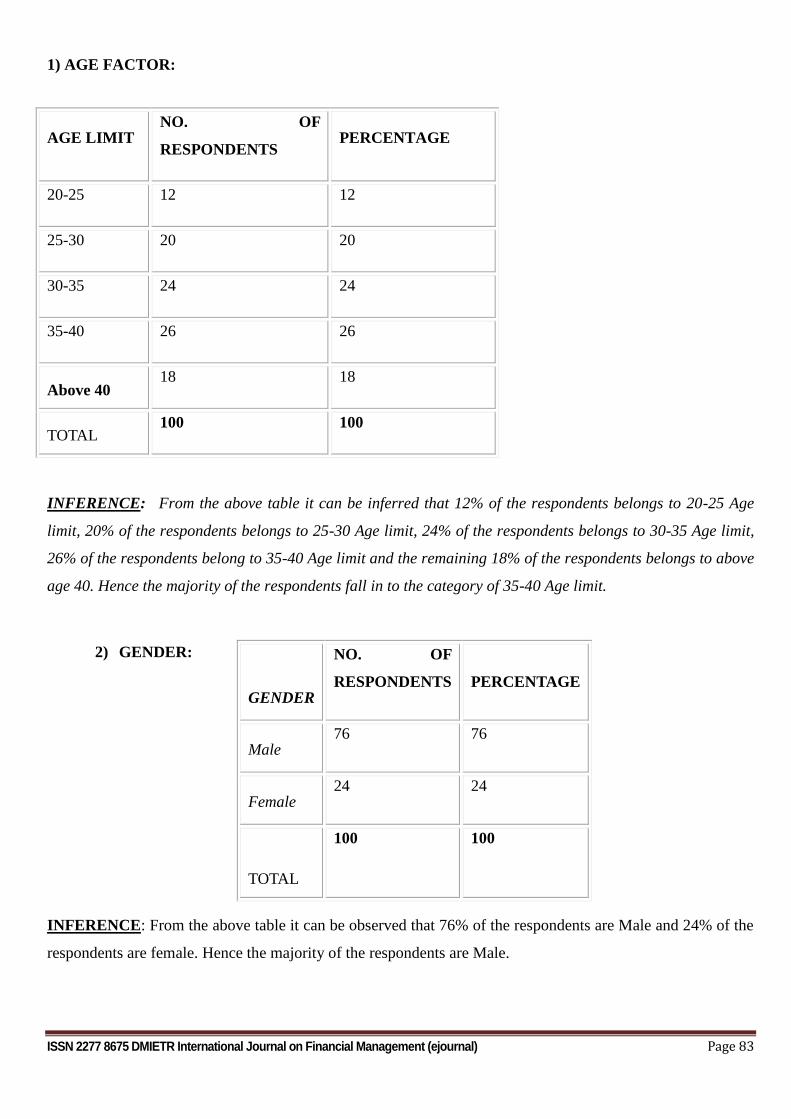
ISSN 2277 8675 DMIETR International Journal on Financial Management (ejournal) Page 83
1) AGE FACTOR:
INFERENCE: From the above table it can be inferred that 12% of the respondents belongs to 20-25 Age
limit, 20% of the respondents belongs to 25-30 Age limit, 24% of the respondents belongs to 30-35 Age limit,
26% of the respondents belong to 35-40 Age limit and the remaining 18% of the respondents belongs to above
age 40. Hence the majority of the respondents fall in to the category of 35-40 Age limit.
2) GENDER:
INFERENCE: From the above table it can be observed that 76% of the respondents are Male and 24% of the
respondents are female. Hence the majority of the respondents are Male.
AGE LIMIT NO. OF
RESPONDENTS PERCENTAGE
20-25 12 12
25-30 20 20
30-35 24 24
35-40 26 26
Above 40 18 18
TOTAL 100 100
GENDER
NO. OF
RESPONDENTS
PERCENTAGE
Male 76 76
Female 24 24
TOTAL
100 100
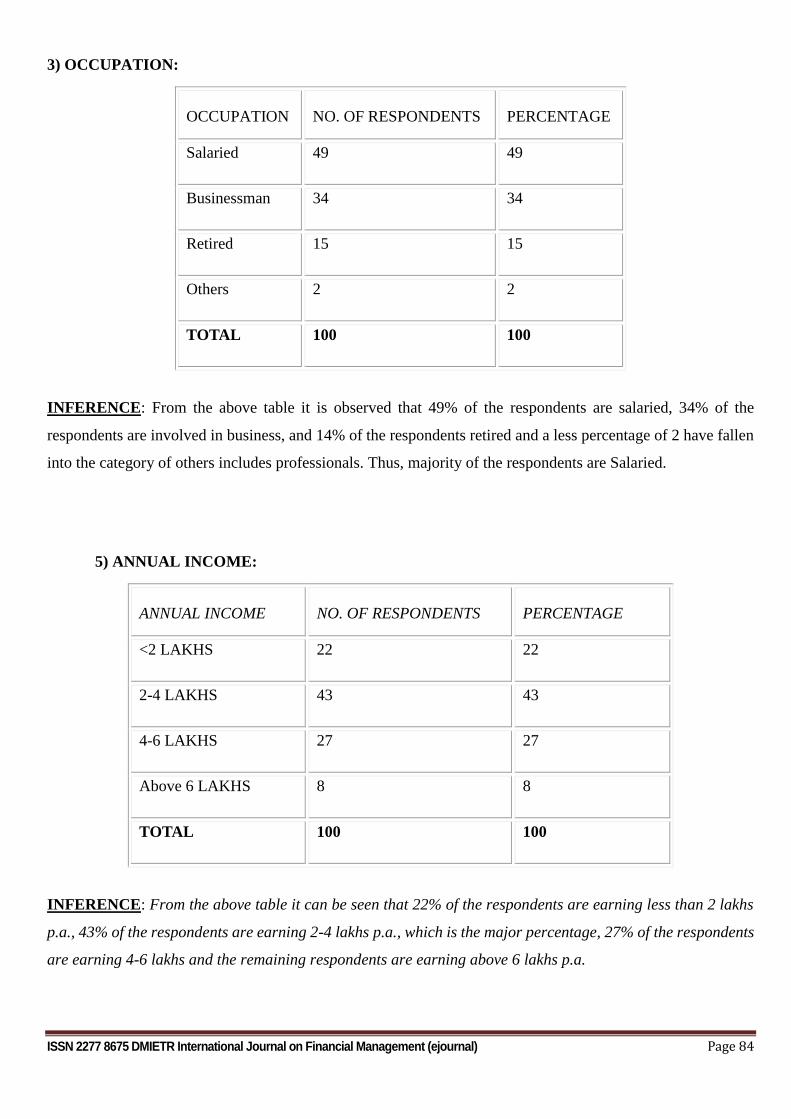
ISSN 2277 8675 DMIETR International Journal on Financial Management (ejournal) Page 84
3) OCCUPATION:
OCCUPATION NO. OF RESPONDENTS PERCENTAGE
Salaried 49 49
Businessman 34 34
Retired 15 15
Others 2 2
TOTAL 100 100
INFERENCE: From the above table it is observed that 49% of the respondents are salaried, 34% of the
respondents are involved in business, and 14% of the respondents retired and a less percentage of 2 have fallen
into the category of others includes professionals. Thus, majority of the respondents are Salaried.
5) ANNUAL INCOME:
ANNUAL INCOME NO. OF RESPONDENTS PERCENTAGE
<2 LAKHS 22 22
2-4 LAKHS 43 43
4-6 LAKHS 27 27
Above 6 LAKHS 8 8
TOTAL 100 100
INFERENCE: From the above table it can be seen that 22% of the respondents are earning less than 2 lakhs
p.a., 43% of the respondents are earning 2-4 lakhs p.a., which is the major percentage, 27% of the respondents
are earning 4-6 lakhs and the remaining respondents are earning above 6 lakhs p.a.
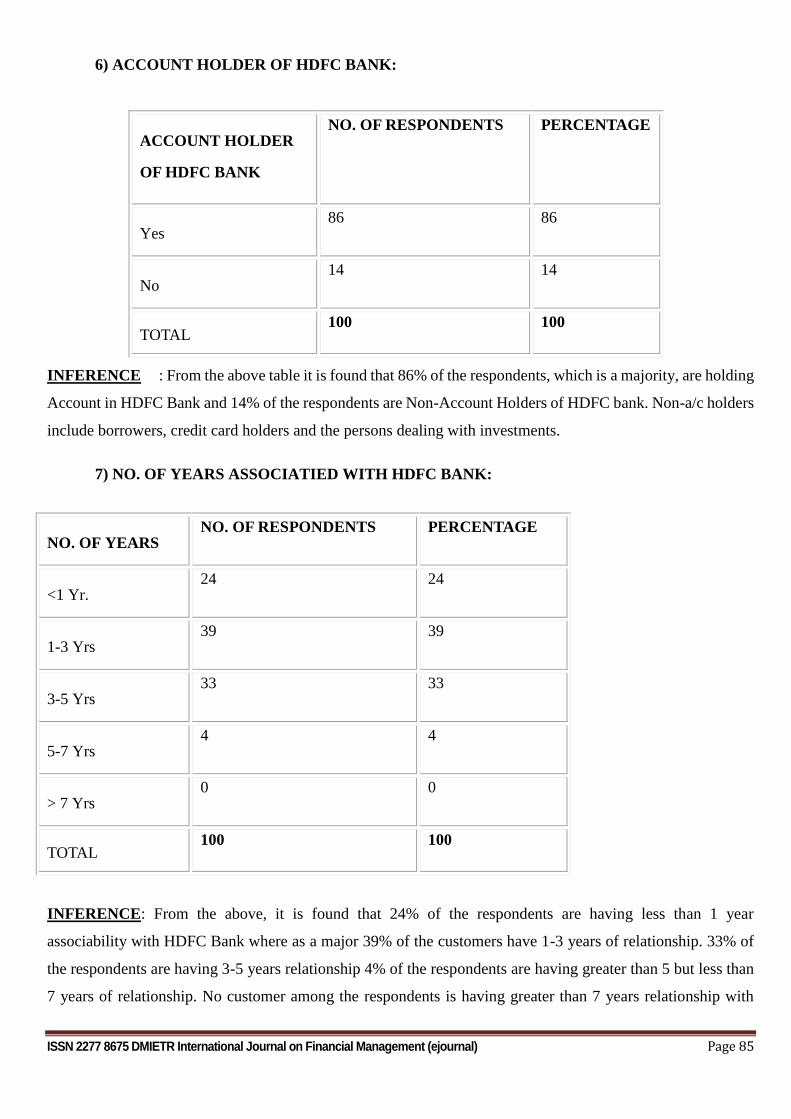
ISSN 2277 8675 DMIETR International Journal on Financial Management (ejournal) Page 85
6) ACCOUNT HOLDER OF HDFC BANK:
INFERENCE : From the above table it is found that 86% of the respondents, which is a majority, are holding
Account in HDFC Bank and 14% of the respondents are Non-Account Holders of HDFC bank. Non-a/c holders
include borrowers, credit card holders and the persons dealing with investments.
7) NO. OF YEARS ASSOCIATIED WITH HDFC BANK:
INFERENCE: From the above, it is found that 24% of the respondents are having less than 1 year
associability with HDFC Bank where as a major 39% of the customers have 1-3 years of relationship. 33% of
the respondents are having 3-5 years relationship 4% of the respondents are having greater than 5 but less than
7 years of relationship. No customer among the respondents is having greater than 7 years relationship with
ACCOUNT HOLDER
OF HDFC BANK
NO. OF RESPONDENTS PERCENTAGE
Yes 86 86
No 14 14
TOTAL 100 100
NO. OF YEARS NO. OF RESPONDENTS PERCENTAGE
<1 Yr. 24 24
1-3 Yrs 39 39
3-5 Yrs 33 33
5-7 Yrs 4 4
> 7 Yrs 0 0
TOTAL 100 100
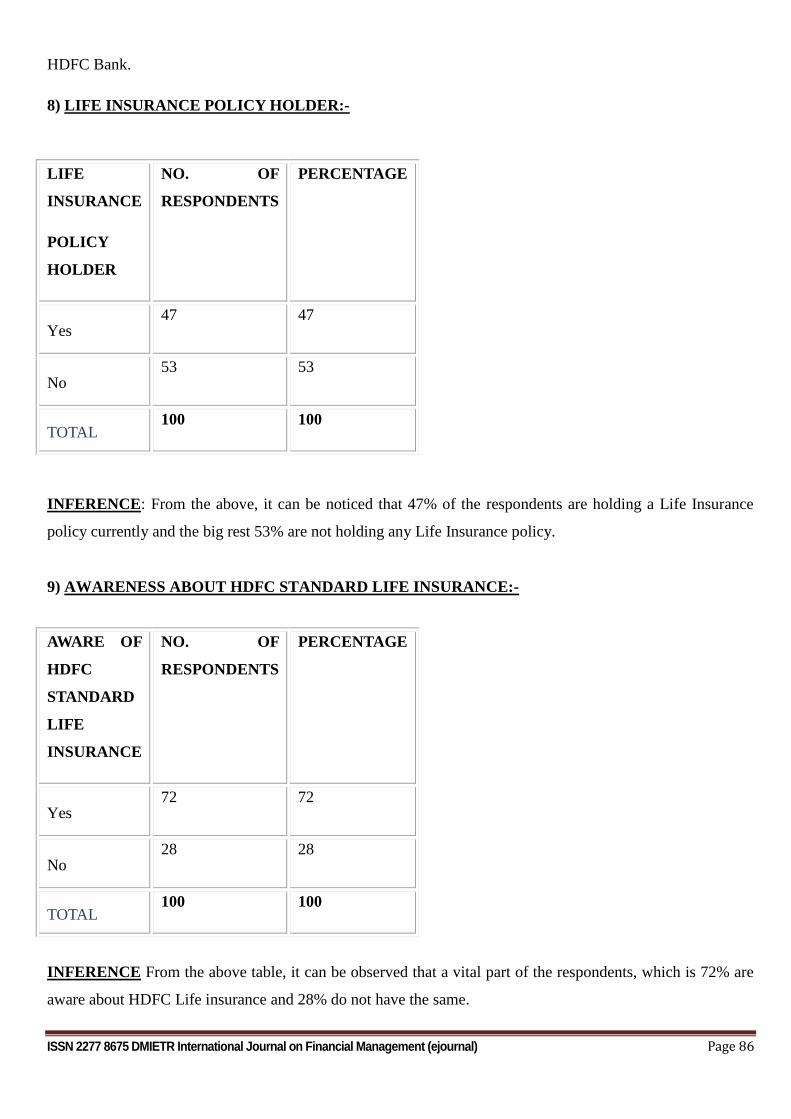
ISSN 2277 8675 DMIETR International Journal on Financial Management (ejournal) Page 86
HDFC Bank.
8) LIFE INSURANCE POLICY HOLDER:-
INFERENCE: From the above, it can be noticed that 47% of the respondents are holding a Life Insurance
policy currently and the big rest 53% are not holding any Life Insurance policy.
9) AWARENESS ABOUT HDFC STANDARD LIFE INSURANCE:-
INFERENCE From the above table, it can be observed that a vital part of the respondents, which is 72% are
aware about HDFC Life insurance and 28% do not have the same.
LIFE
INSURANCE
POLICY
HOLDER
NO. OF
RESPONDENTS
PERCENTAGE
Yes 47 47
No 53 53
TOTAL 100 100
AWARE OF
HDFC
STANDARD
LIFE
INSURANCE
NO. OF
RESPONDENTS
PERCENTAGE
Yes 72 72
No 28 28
TOTAL 100 100
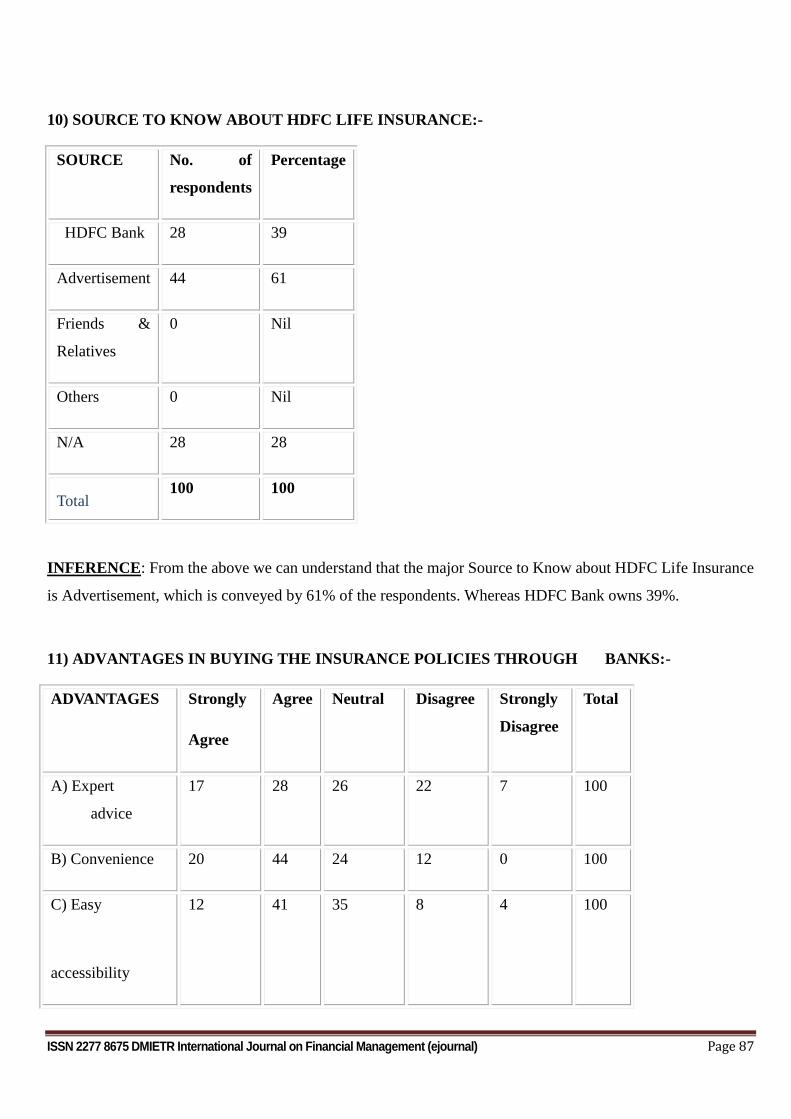
ISSN 2277 8675 DMIETR International Journal on Financial Management (ejournal) Page 87
10) SOURCE TO KNOW ABOUT HDFC LIFE INSURANCE:-
INFERENCE: From the above we can understand that the major Source to Know about HDFC Life Insurance
is Advertisement, which is conveyed by 61% of the respondents. Whereas HDFC Bank owns 39%.
11) ADVANTAGES IN BUYING THE INSURANCE POLICIES THROUGH BANKS:-
ADVANTAGES Strongly
Agree
Agree Neutral Disagree Strongly
Disagree
Total
A) Expert
advice
17 28 26 22 7 100
B) Convenience 20 44 24 12 0 100
C) Easy
accessibility
12 41 35 8 4 100
SOURCE No. of
respondents
Percentage
HDFC Bank 28 39
Advertisement 44 61
Friends &
Relatives
0 Nil
Others 0 Nil
N/A 28 28
Total 100 100
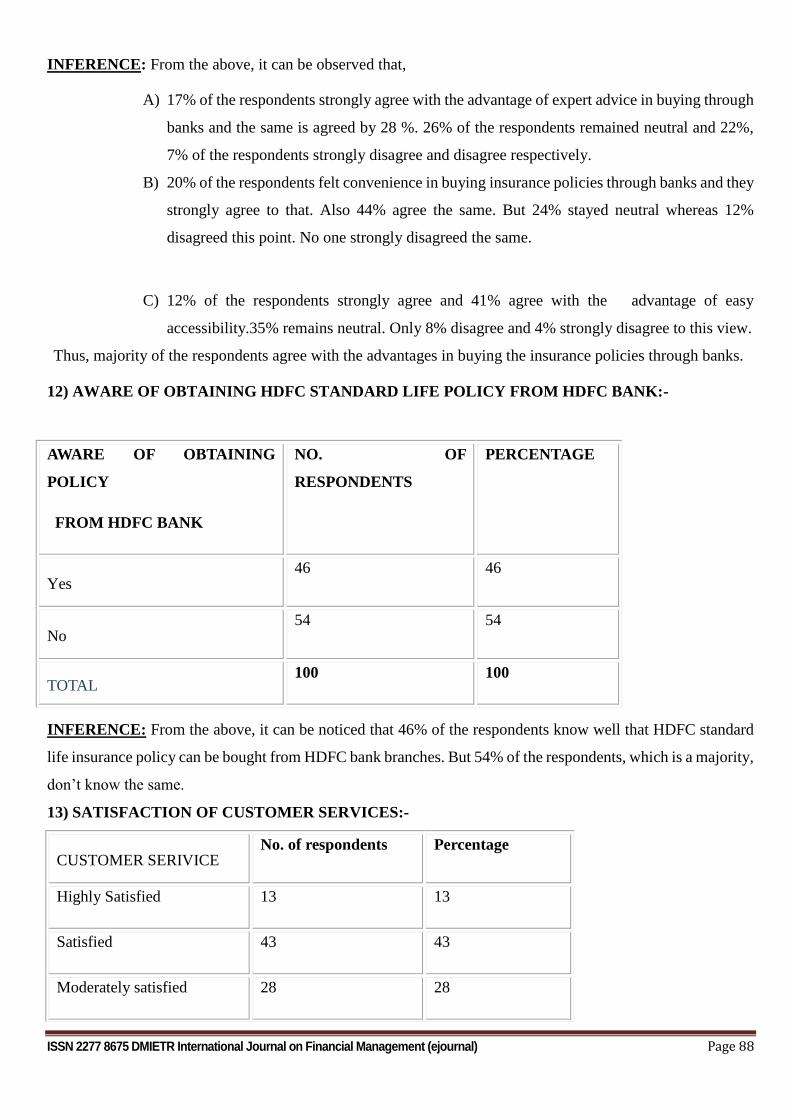
ISSN 2277 8675 DMIETR International Journal on Financial Management (ejournal) Page 88
INFERENCE: From the above, it can be observed that,
A) 17% of the respondents strongly agree with the advantage of expert advice in buying through
banks and the same is agreed by 28 %. 26% of the respondents remained neutral and 22%,
7% of the respondents strongly disagree and disagree respectively.
B) 20% of the respondents felt convenience in buying insurance policies through banks and they
strongly agree to that. Also 44% agree the same. But 24% stayed neutral whereas 12%
disagreed this point. No one strongly disagreed the same.
C) 12% of the respondents strongly agree and 41% agree with the advantage of easy
accessibility.35% remains neutral. Only 8% disagree and 4% strongly disagree to this view.
Thus, majority of the respondents agree with the advantages in buying the insurance policies through banks.
12) AWARE OF OBTAINING HDFC STANDARD LIFE POLICY FROM HDFC BANK:-
INFERENCE: From the above, it can be noticed that 46% of the respondents know well that HDFC standard
life insurance policy can be bought from HDFC bank branches. But 54% of the respondents, which is a majority,
don’t know the same.
13) SATISFACTION OF CUSTOMER SERVICES:-
CUSTOMER SERIVICE No. of respondents Percentage
Highly Satisfied 13 13
Satisfied 43 43
Moderately satisfied 28 28
AWARE OF OBTAINING
POLICY
FROM HDFC BANK
NO. OF
RESPONDENTS
PERCENTAGE
Yes 46 46
No 54 54
TOTAL 100 100
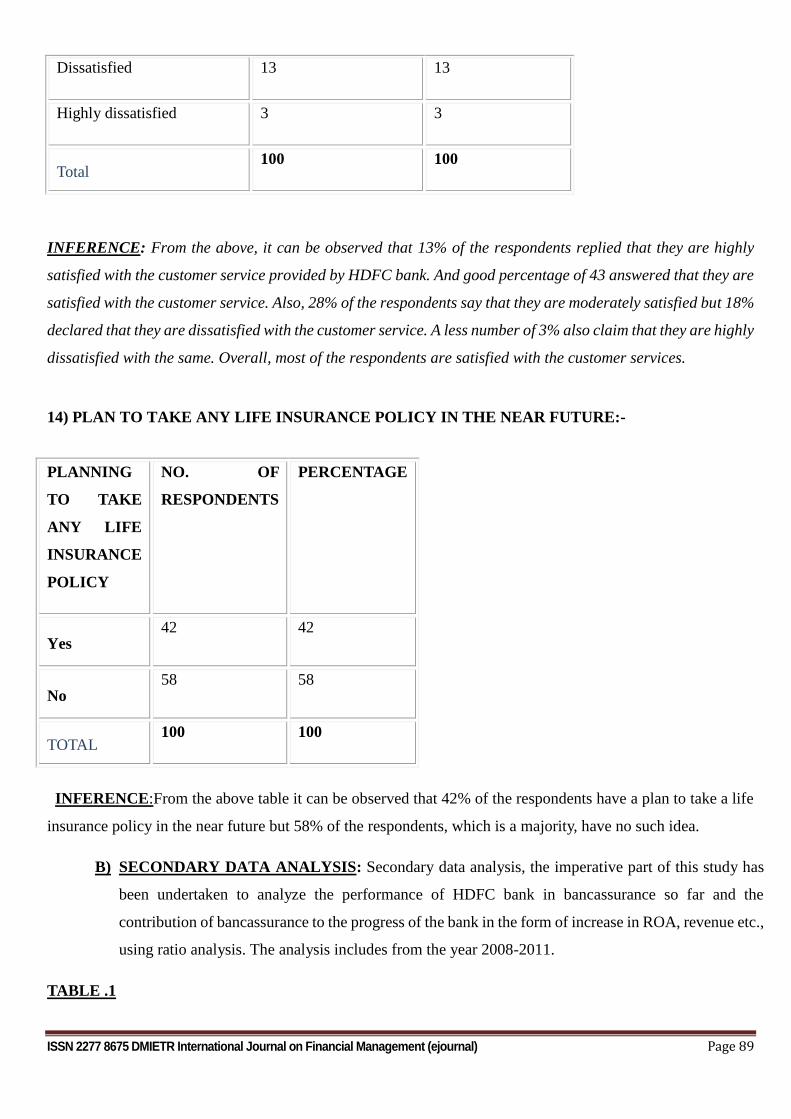
ISSN 2277 8675 DMIETR International Journal on Financial Management (ejournal) Page 89
Dissatisfied 13 13
Highly dissatisfied 3 3
Total 100 100
INFERENCE: From the above, it can be observed that 13% of the respondents replied that they are highly
satisfied with the customer service provided by HDFC bank. And good percentage of 43 answered that they are
satisfied with the customer service. Also, 28% of the respondents say that they are moderately satisfied but 18%
declared that they are dissatisfied with the customer service. A less number of 3% also claim that they are highly
dissatisfied with the same. Overall, most of the respondents are satisfied with the customer services.
14) PLAN TO TAKE ANY LIFE INSURANCE POLICY IN THE NEAR FUTURE:-
INFERENCE:From the above table it can be observed that 42% of the respondents have a plan to take a life
insurance policy in the near future but 58% of the respondents, which is a majority, have no such idea.
B) SECONDARY DATA ANALYSIS: Secondary data analysis, the imperative part of this study has
been undertaken to analyze the performance of HDFC bank in bancassurance so far and the
contribution of bancassurance to the progress of the bank in the form of increase in ROA, revenue etc.,
using ratio analysis. The analysis includes from the year 2008-2011.
TABLE .1
PLANNING
TO TAKE
ANY LIFE
INSURANCE
POLICY
NO. OF
RESPONDENTS
PERCENTAGE
Yes 42 42
No 58 58
TOTAL 100 100
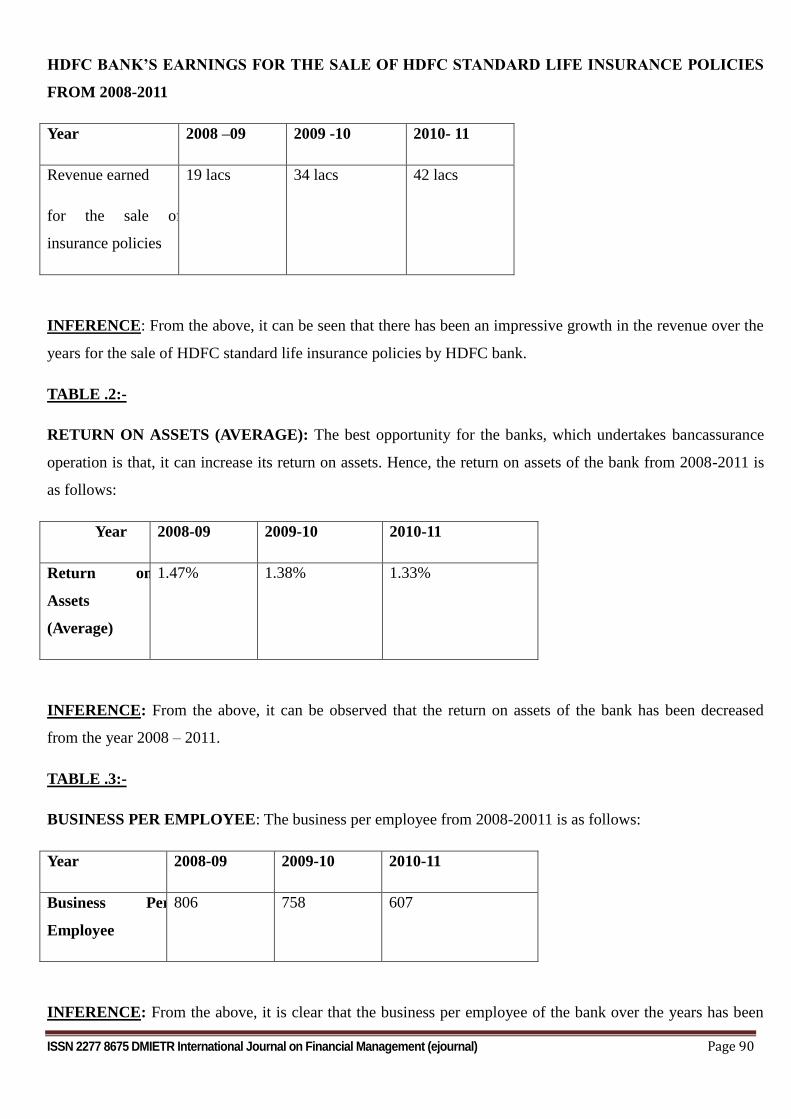
ISSN 2277 8675 DMIETR International Journal on Financial Management (ejournal) Page 90
HDFC BANK’S EARNINGS FOR THE SALE OF HDFC STANDARD LIFE INSURANCE POLICIES
FROM 2008-2011
Year 2008 –09 2009 -10 2010- 11
Revenue earned
for the sale of
insurance policies
19 lacs 34 lacs 42 lacs
INFERENCE: From the above, it can be seen that there has been an impressive growth in the revenue over the
years for the sale of HDFC standard life insurance policies by HDFC bank.
TABLE .2:-
RETURN ON ASSETS (AVERAGE): The best opportunity for the banks, which undertakes bancassurance
operation is that, it can increase its return on assets. Hence, the return on assets of the bank from 2008-2011 is
as follows:
Year 2008-09 2009-10 2010-11
Return on
Assets
(Average)
1.47% 1.38%
1.33%
INFERENCE: From the above, it can be observed that the return on assets of the bank has been decreased
from the year 2008 – 2011.
TABLE .3:-
BUSINESS PER EMPLOYEE: The business per employee from 2008-20011 is as follows:
Year 2008-09 2009-10 2010-11
Business Per
Employee
806 758 607
INFERENCE: From the above, it is clear that the business per employee of the bank over the years has been
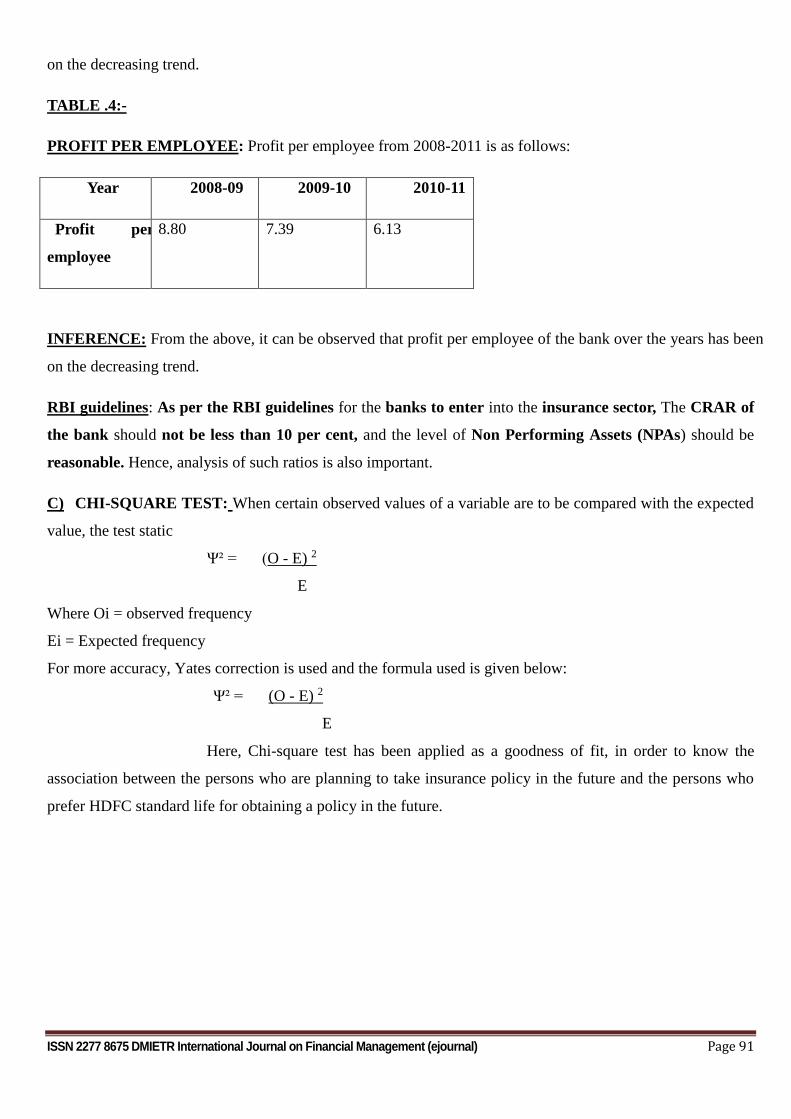
ISSN 2277 8675 DMIETR International Journal on Financial Management (ejournal) Page 91
on the decreasing trend.
TABLE .4:-
PROFIT PER EMPLOYEE: Profit per employee from 2008-2011 is as follows:
Year 2008-09 2009-10 2010-11
Profit per
employee
8.80 7.39 6.13
INFERENCE: From the above, it can be observed that profit per employee of the bank over the years has been
on the decreasing trend.
RBI guidelines: As per the RBI guidelines for the banks to enter into the insurance sector, The CRAR of
the bank should not be less than 10 per cent, and the level of Non Performing Assets (NPAs) should be
reasonable. Hence, analysis of such ratios is also important.
C) CHI-SQUARE TEST: When certain observed values of a variable are to be compared with the expected
value, the test static
Ψ² = (O - E) 2
E
Where Oi = observed frequency
Ei = Expected frequency
For more accuracy, Yates correction is used and the formula used is given below:
Ψ² = (O - E) 2
E
Here, Chi-square test has been applied as a goodness of fit, in order to know the
association between the persons who are planning to take insurance policy in the future and the persons who
prefer HDFC standard life for obtaining a policy in the future.
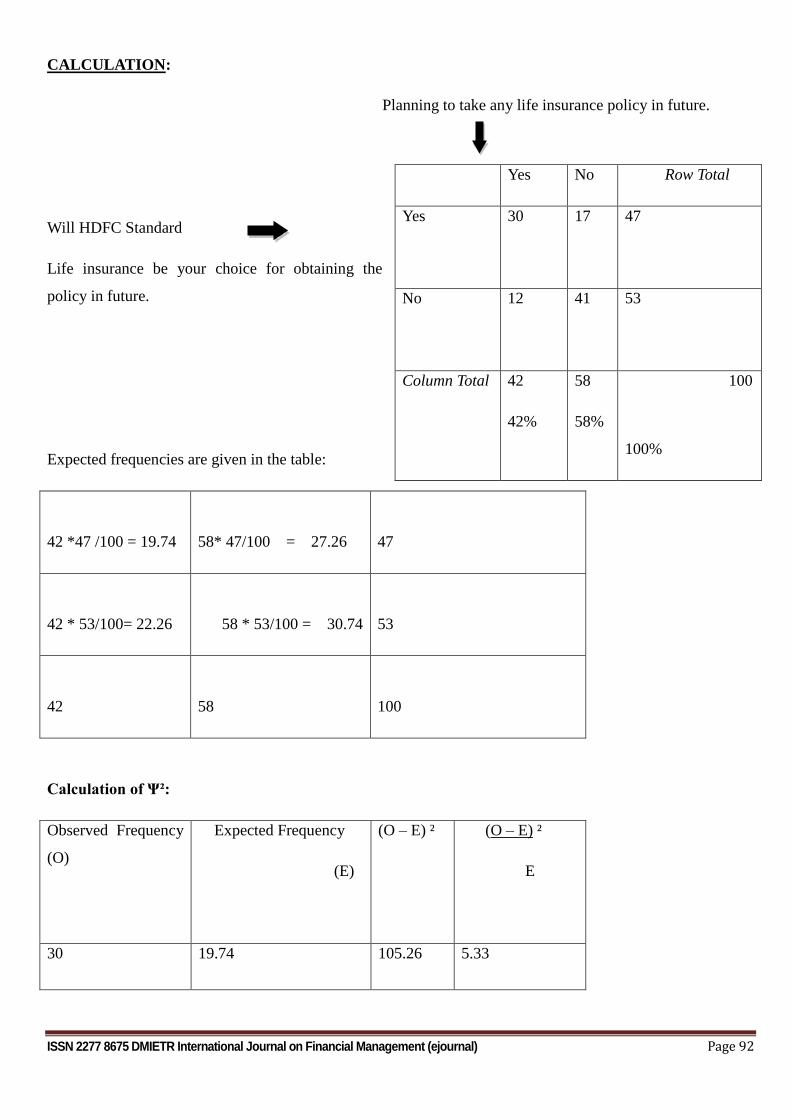
ISSN 2277 8675 DMIETR International Journal on Financial Management (ejournal) Page 92
CALCULATION:
Planning to take any life insurance policy in future.
Will HDFC Standard
Life insurance be your choice for obtaining the
policy in future.
Expected frequencies are given in the table:
42 *47 /100 = 19.74
58* 47/100 = 27.26
47
42 * 53/100= 22.26
58 * 53/100 = 30.74
53
42
58
100
Calculation of Ψ²:
Observed Frequency
(O)
Expected Frequency
(E)
(O – E) ² (O – E) ²
E
30 19.74 105.26 5.33
Yes No Row Total
Yes 30
17
47
No 12
41
53
Column Total 42
42%
58
58%
100
100%
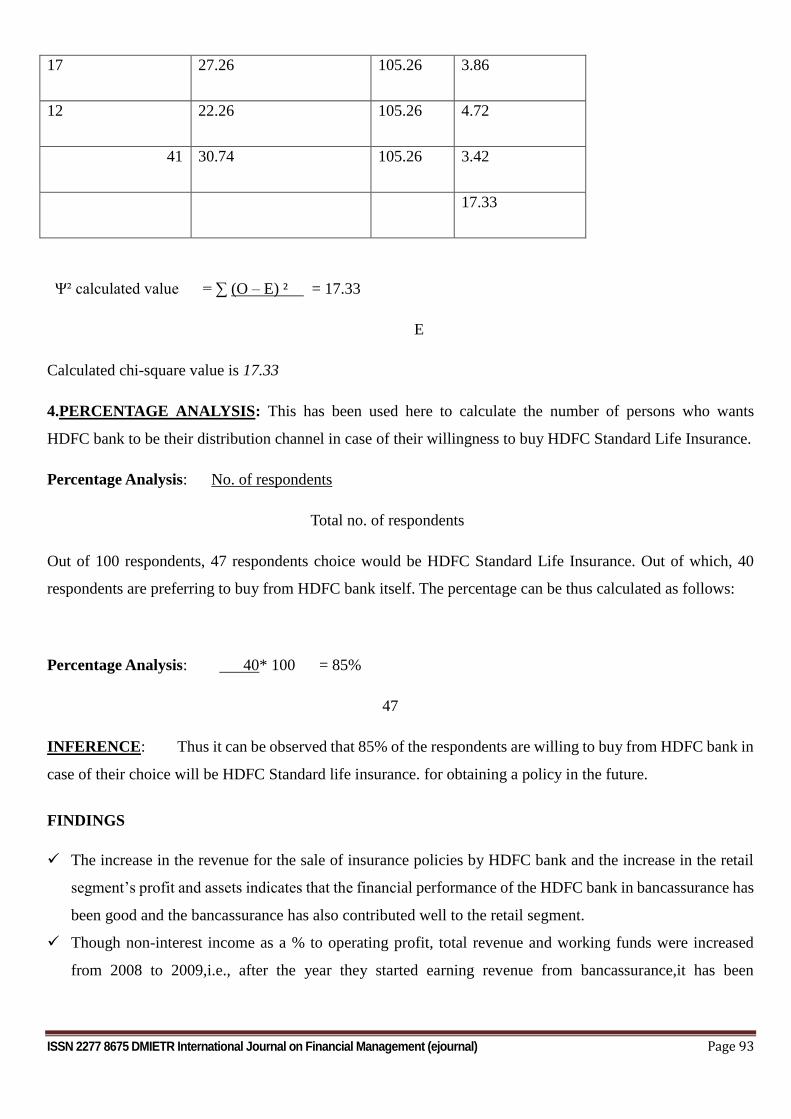
ISSN 2277 8675 DMIETR International Journal on Financial Management (ejournal) Page 93
17 27.26 105.26 3.86
12 22.26 105.26 4.72
41 30.74 105.26 3.42
17.33
Ψ² calculated value = ∑ (O – E) ² = 17.33
E
Calculated chi-square value is 17.33
4.PERCENTAGE ANALYSIS: This has been used here to calculate the number of persons who wants
HDFC bank to be their distribution channel in case of their willingness to buy HDFC Standard Life Insurance.
Percentage Analysis: No. of respondents
Total no. of respondents
Out of 100 respondents, 47 respondents choice would be HDFC Standard Life Insurance. Out of which, 40
respondents are preferring to buy from HDFC bank itself. The percentage can be thus calculated as follows:
Percentage Analysis: 40 * 100 = 85%
47
INFERENCE: Thus it can be observed that 85% of the respondents are willing to buy from HDFC bank in
case of their choice will be HDFC Standard life insurance. for obtaining a policy in the future.
FINDINGS
The increase in the revenue for the sale of insurance policies by HDFC bank and the increase in the retail
segment’s profit and assets indicates that the financial performance of the HDFC bank in bancassurance has
been good and the bancassurance has also contributed well to the retail segment.
Though non-interest income as a % to operating profit, total revenue and working funds were increased
from 2008 to 2009,i.e., after the year they started earning revenue from bancassurance,it has been
ISSN 2277 8675 DMIETR International Journal on Financial Management (ejournal) Page 94
decreased in the year 20010-11.With the increase in performance in bancassurance,the same can be
overcome.
It is desirable also that the bank can improve its existing performance to increase its return on assets and to
reduce the operating expenses of the bank.
Business per employee and profit per employee of the bank are decreasing over the years that it can affect
the sale of insurance policies that the bank’s immediate attention is required.
Capital adequacy ratio has been found satisfactory, as it has been above the prescribed norms of RBI that it
reveals the potentiality of HDFC Bank to perform bancassurance operations. The other prescribed norm,
which is NPA, also looks reasonable. But, steps can be taken to reduce the same, as its % to customer assets
has been increasing over the years.
Thus, it is quite clear that HDFC Bank is expected to take still more initiatives to improve its existing
performance in bancassurance. To analyze the ways and means for it, responses are collected from the
customers. It also indicates the necessity of further initiatives and the areas where they need to focus and can
cash in on the situation for better prospects. Following are the justifications from the primary data:
Though general opinion about insurance is pretty good among the people, most of the respondents are
uncertain about insurance as an investment option.
Though most of the respondents are aware of HDFC standard life, awareness needs to be created about the
fact that HDFC bank is cross-selling HDFC Standard Life Policies.
Most of the respondents are not cognizant enough with the HDFC Standard Life Insurance policies as the
initiatives taken by HDFC Bank have been inadequate. This is also proved statistically through correlation
analysis.
Though the other relationship building factors are found satisfactory among most of the customers,
emphasis is needed in the area of Easy and advantageous banking over other banks since it is denied by
majority of the respondents. As these factors, especially the easy and advantageous banking determines the
mindset of the customer in considering the bank as an integrated financial solutions, this requires immense
attention by HDFC bank. The same is also proved statistically through correlation analysis.
Majority of the respondents are satisfied with the customer services provided by HDFC bank that it is a
positive sign for bancassurance.
53% of the respondents are not holding any life insurance policy so far that it is clear that there are still lot of
untapped source which the bank can explore and reap the harvest.
47% of the respondents choice would be HDFC standard life insurance for obtaining a policy. Out of which,
30 respondents are planning to take an insurance policy in the immediate future .The association between
this two is also proved through Chi-square test. Tax benefits, better returns, invest in child dreams, post
ISSN 2277 8675 DMIETR International Journal on Financial Management (ejournal) Page 95
retirement income, protecting the family in case of unfortunate occurrences are the increasing order of
preference in terms of essentiality among most of the respondents in the near future for taking a policy
And out of 47 respondents who are in favour of HDFC Standard Life 40 respondents i.e., 85% of the
respondents prefer HDFC bank to be their distribution channel. This clearly indicates the advantage the
bank can make use of and if taken more initiatives it can even make more customers to buy HDFC Standard
life insurance policies from HDFC bank
CONCLUSION
The study thus points out that the financial performance of HDFC bank in bancassurance has been good and it
also provides a helping hand to the overall progress of the bank. The prospect for bancassurance is also bright as
HDFC bank is found to be a preferable distribution channel among the customers who wish to buy HDFC
standard life policy. With more initiatives and focus in the specified areas the bank can even have the potentially
of making more customers to buy HDFC Standard Life policy from HDFC bank. With the merger of centurion
bank, it can also take the advantage of more customer base and can become more competitive. Thus with its
increase in the existing performance, in the upcoming years, HDFC bank will definitely play a predominant role
in the bancassurance industry and thereby can contribute more to the upliftment of the bank.
BIBLIOGRAPHY & WEBLIOGRAPH
JOURNALS:
Amel Dean Barnes colleen, Panetta Fabio & Sallen Carmelo “Consolidation and Efficiency in the
financial sector: A review of the international evidence”, Journal of banking and Finance Volume No:
28, March 2000,Page numbers: 2493-2519
Browne M.J & Kim.K- “An international analysis of Life insurance Demand”, Journal of Risk and
Insurance Volume No:60,January 1993,Page numbers: 616-634
Carow Kenneth. A “Challenging Barriers between banking and Insurance”, Journal of Banking and
Finance Volume No: 25,April 2001.Page numbers: 1553-1571
WEBLIOGRAPHY:
www.google.co.in
www.watsonwyatt.com
www.hdfcbank.com
www.insuremagic.com
www.hdfcinsurance.com
www.insureegypt.com

ISSN 2277 8675 DMIETR International Journal on Financial Management (ejournal) Page 96