Embed Size (px)
Citation preview
ISSN 2277 8675 - DMIETR International Journal on Finance Management
1
International Journal on journal)
Volume 1
Issue- June
www.dmietr.edu.in ISSN 2277 8675 June-2013
DMIETR
Department of Business Management (MBA)
Datta Meghe Institute of Engineering, Technology
& Research.
International Journal on
Financial Management
ISSN 2277 8675 - DMIETR International Journal on Finance Management
2
DMIETR International Journal on Finance Management (e-journal)
Volume 2
Issue- JUNE 2013
DMIETR, Wardha
ISSN 2277 8675 - DMIETR International Journal on Finance Management
3
©DMIETR,
No part of this publication may reproduced store in a retrieval system or
transmitted in any form or by any means, electronic, mechanical,
photocopying, recording or otherwise, without the prior permission of the
publisher, Press, DMIETR. The publisher does not responsible does not
assume any responsibility for any injury and / or damage to person or
property as matter of product liability , negligence or otherwise or from any
use or operation of any use or operation of any method , instruction or ideas
contained in material here in.

ISSN 2277 8675 - DMIETR International Journal on Finance Management
4
Chief Editor
Prof. Shailesh Kediya, HOD D.M.I.E.T.R
Managing Editors
Prof. Atul Kharad Prof.Rupesh Dahake
Lecturer, Lecturer
D.M.I.E.T.R. D.M.I.E.T.R
Editorial Advisory Board Editorial Board
Dr. Sachin Untawale
Chairman & Principal
D.M.I.E.T.R.
Dr. Kiran Nerkar
Associate Editor
Dr. Bharat Meghe
Dean, Faculty of Commerce,
RTM Nagpur University, Nagpur
Dr. Ajit Shringarpure
Associate Editor
Dr. Vinayak Deshpande
Professor & Director,
Department of Business Management,
RTM Nagpur university, Nagpur
Dr. K. V. Somnadh
Associate Editor
Dr. Kiran Nerkar
Chairman,
Business Management Board,
RTM Nagpur university, Nagpur
Dr. Ajay Pethe
Member
Dr. Sujit Metre
Director, DMIMS, Nagpur
Prof. Ms. Aparna Tiwari
Member
Dr. Rajiv Jadhao
Head of Commerce Dept
Associate Professor
Lok Mahavidyalaya, Wardha
Prof. B. M. Mujumdar
Former Director,
DAMS, G.S.College of Commerce, Wardha

ISSN 2277 8675 - DMIETR International Journal on Finance Management
5
Index acceptance
Sr. No Name of the Author Topic Name Page
No.
1 Dr. Ajit A. Shringarpure &
Yogesh B. Dhoke
Investment Approaches and Management
In Changing Economic Scenario 6
2 Dr. Ram O. Panchariya
“Non-Performing Assets – A Study Of Public
Sector Banks Operating In Wardha District,
Maharashtra”
17
3 Swapnil b. Bante Foreign Direct Investment in Indian Retail
Sector - An Analysis 30
4 Dr. Kanchan Naidu
Prof. Vandana Gandhi
Impact of mergers and acquisition on
financial performance of merged banks (A
Case Study of Bank of Baroda)
42

ISSN 2277 8675 - DMIETR International Journal on Finance Management
6
Investment Approaches and Management
In Changing Economic Scenario
Dr. Ajit A. Shringarpure Yogesh B. Dhoke (Director) (Assistant Professor)
Real Institute of Management & Research, Manish Nagar,
Nagpur
Introduction:
Investment involves making of a sacrifice in the present with the hope of deriving future benefits. Investment
has many meetings and facets. The two most important features of an investment are current sacrifice and
future benefit. Investment refers to a commitment of funds to one or more assets that will be held over some
future time period. Almost all individuals have wealth of some kind, ranging from the value of their services
in the workplace to tangible assets to monetary assets. Anything not consumed today and saved for future use
can be considered an investment.
Objective of Investment:
We invest in order to improve our future welfare. Funds to be invested come from assets already owned,
borrowed money, and savings or foregone consumption. By foregoing consumption today and investing the
savings, we except to enhance our future consumption possibilities. Regardless of why we invest, we should
all seek to manage our wealth effectively, obtaining the most from it. This includes protecting our assets from
inflation, taxes and other factors.
ABSTRACT
What has been the level of public investment in the current economy, and how has it performed
over the past century? What are the challenges in highly inflationary condition and what level of
investment is necessary? This paper attempts to provide an historical context to these questions
in order to assist Investment Approaches In Changing Economic Scenario.

ISSN 2277 8675 - DMIETR International Journal on Finance Management
7
Investment Attributes:
Some of the main investment attributes which cover the investment
decision are:
a) Risk & return
b) Liquidity of the investment
c) Tax advantage
d) Convenience
Investment Approaches Alternatives
In India we have generally seen that investor invest their hard earn
money by traditional way such as high risk , medium risk and very low risk
category securities or instruments by keeping in mind safety, security and
expected return. Following are some well known alternatives of investment:
Two basic investment avenues are:
1) Financial Assets
2) Physical Assets(Real Assets)
3) Investment in Financial assets consists of
Securitized investment
Non-securitized investment
Equity
Preference Share
Debentures
Bonds or Fixed income securities
Government Securities
Saving Bonds
Private sector debentures
PSU Bonds
Money Market Securities
Treasury bills
Certificates of deposits
Commercial papers
Repos
Non-marketable financial Assets
Bank deposits
Post office time deposits (POTA
Kisan Vikas Patra
National Saving certificates
Company Deposits
Employees provident fund scheme
Public provident fund scheme.

ISSN 2277 8675 - DMIETR International Journal on Finance Management
8
Real Estate
Residential House
Commercial Property
Agriculture Land
Suburban Land
Time share in a holiday resort
Precious objects
Gold & Silver
Precious Stones
Art Objects
Insurance Policies
Endowment Assurance
Money Back Plan
Whole life assurance
Unit Linked Plan
Immediate Annuity
Deferred Annuity
As we continuously seeing that market ,internal –external factor and
economy condition has been always changing and our investment getting
affected due to same but no any investor try to understand these changing
aspects and behave accordingly.
REASONS WHY PEOPLE LOSE MONEY INVESTING
There are various investment companies in the world today, we have some on
the internet and others are available in our country physically. People are
therefore advised to invest in their own interest in other to secure a brighter
future for them and their families. Knowing the right investment is a key
factor and also knowing the right company to invest in is another factor to
consider. People tend to lose money by making the wrong choices and
choosing the wrong companies. I have listed out 10 things to consider before
investing: 1. Choose your investment company wisely and read properly about their
profile.
2. Read the rules and frequently asked questions
3. Know how mush investment you can make.
4. Invest little and allow it to grow.
5. Don‟t borrow to invest
6. Know the risks involved in investing with the company of your choice
7. Know how much gain or loss you can make
ISSN 2277 8675 - DMIETR International Journal on Finance Management
9
8. Be patient with your investment
9. Remove the get quick rich syndrome
10. Have faith and you will make it .
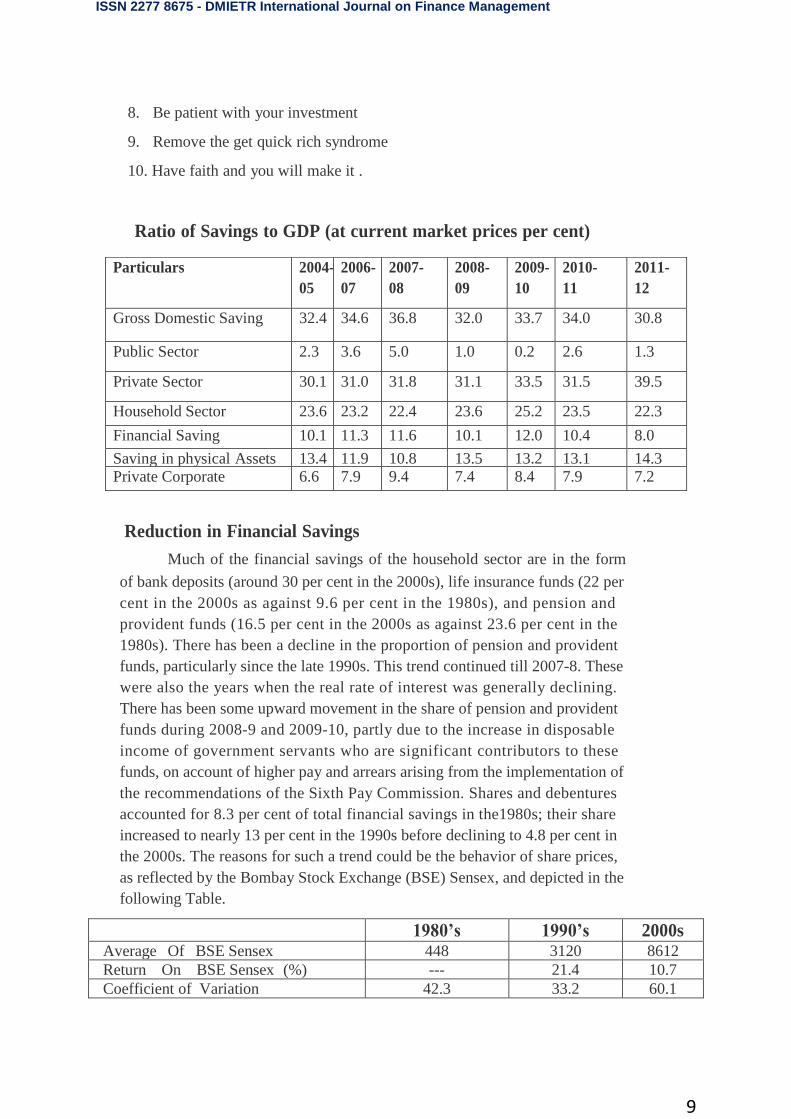
Ratio of Savings to GDP (at current market prices per cent)
Reduction in Financial Savings
Much of the financial savings of the household sector are in the form
of bank deposits (around 30 per cent in the 2000s), life insurance funds (22 per
cent in the 2000s as against 9.6 per cent in the 1980s), and pension and
provident funds (16.5 per cent in the 2000s as against 23.6 per cent in the
1980s). There has been a decline in the proportion of pension and provident
funds, particularly since the late 1990s. This trend continued till 2007-8. These
were also the years when the real rate of interest was generally declining.
There has been some upward movement in the share of pension and provident
funds during 2008-9 and 2009-10, partly due to the increase in disposable
income of government servants who are significant contributors to these
funds, on account of higher pay and arrears arising from the implementation of
the recommendations of the Sixth Pay Commission. Shares and debentures
accounted for 8.3 per cent of total financial savings in the1980s; their share
increased to nearly 13 per cent in the 1990s before declining to 4.8 per cent in
the 2000s. The reasons for such a trend could be the behavior of share prices,
as reflected by the Bombay Stock Exchange (BSE) Sensex, and depicted in the
following Table.
1980’s 1990’s 2000s
Average Of BSE Sensex 448 3120 8612
Return On BSE Sensex (%) --- 21.4 10.7
Coefficient of Variation 42.3 33.2 60.1
Particulars 2004-
05
2006-
07
2007-
08
2008-
09
2009-
10
2010-
11
2011-
12
Gross Domestic Saving 32.4 34.6 36.8 32.0 33.7 34.0 30.8
Public Sector 2.3 3.6 5.0 1.0 0.2 2.6 1.3
Private Sector 30.1 31.0 31.8 31.1 33.5 31.5 39.5
Household Sector 23.6 23.2 22.4 23.6 25.2 23.5 22.3
Financial Saving 10.1 11.3 11.6 10.1 12.0 10.4 8.0
Saving in physical Assets 13.4 11.9 10.8 13.5 13.2 13.1 14.3
Private Corporate 6.6 7.9 9.4 7.4 8.4 7.9 7.2
ISSN 2277 8675 - DMIETR International Journal on Finance Management
10
Handbook of Statistics on Indian Economy.
The increase in the proportion of shares and debentures in total
financial savings in the 1990s could be ascribed to higher returns (21.4 per
cent per annum on an average for the decade) along with lower volatility as
reflected by a lower coefficient of variation that declined from 42.3 in 1980s
to 33.2 in the 1990s. The returns on the BSE Sensex halved to 10.7 per cent in
the 2000s and volatility increased as can be seen from the higher value of the
coefficient of variation at 60.1. Thus a combination of lower returns and
higher volatility in the 2000s vis-à-vis the 1990s could have contributed to the
reduced share of shares and debentures in total financial savings. This,
coupled with high inflation, could also be one of the reasons why gold has
become a „safe haven‟ investment in recent times. Acquisition of gold by the
households in the country tends to have a negative impact on savings and on
household financial investments.
New Alternative of Investment:
So till now we have talk about various investment options and their
risk and return but according to current inflationary ,fiscal deficit , high risk
and continuous changes in economy, so by keeping in mind all above factors,
investor should go towards new avenue of investment and that is Debt
Market.
Investing in Debt Market can be better choice:
Broadly, the phases of public debt in India could be divided into the
following phases.
Up to 1867: when public debt was driven largely by needs of financing
campaigns.
1867- 1916: when public debt was raised for financing railways and canals
and other such purposes.
1917-1940: when public debt increased substantially essentially out of the
considerations.
1940-1946: when because of war time inflation, the effort was to mop up as
much a possible of the current war time incomes
1947-1951: represented the interregnum following war and partition and the
economy was unsettled. Government of India failed to achieve the estimates
for borrowings for which credit had been taken in the annual budgets.
1951-1985: when borrowing was influenced by the five year plans.
1985-1991: when an attempt was made to align the interest rates on
government securities with market interest rates in the wake of the
recommendations of the Chakraborti Committee Report.
1991 to date: When comprehensive reforms of the Government Securities

ISSN 2277 8675 - DMIETR International Journal on Finance Management
11
market were undertaken and an active debt management policy put in place.
Ad Hoc Treasury bills were abolished; commenced the selling of securities
through the auction process; new instruments were introduced such as zero
coupon bonds, floating rate bonds and capital indexed bonds; the Securities
Trading Corporation of India was established; a system of Primary Dealers in
government securities was put in place; the spectrum of maturities was
broadened; the system of Delivery versus payment was instituted; standard
valuation norms were prescribed; and endeavours made to ensure transparency
in operations through market process, the dissemination of information and
efforts were made to give an impetus to the secondary market so as to broaden
and deepen the market to make it more efficient.
In India and the world over, Government Bonds have, from time to
time, have not only adopted innovative methods for rising resources (legalised
wagering contracts like the Prize Bonds issued in the 1940s and later 1950s in
India) but have also been used for various innovative schemes such as finance
for development; social engineering like the abolition of the Zamindari
system; saving the environment; or even weaning people away from gold (the
gold bonds issued in 1993).
Debt Market and its history:
Traditionally, the capital markets in India are more synonymous with
the equity markets – both on account of the common investors‟ preferences
and the oft huge capital gains it offered – no matter what the risks involved
are. The investor‟s preference for debt market, on the other hand, has been
relatively a recent phenomenon – an outcome of the shift in the economic
policy, whereby the market forces have been accorded a greater leeway in
influencing the resource allocation.
In a developing economy such as India, the role of the public sector and its
financial requirements need no emphasis. Growing fiscal deficits and the
policy stance of “directed investment” through statutory pre emption (the
statutory liquidity ratio – SLR - for banks), ensured a captive but passive
market for the Government securities. Besides, participation of the Reserve
Bank of India (RBI) as an investor in the Government borrowing programme
(monetisation of deficits) led to a regime of financial repression. In an
eventual administered interest rate regime, the asset liability mismatches pose
no threat to the balance sheets of financial institutions. As a result, the banking
system, which is the major holder of the Government securities portfolio,
remained a dominant passive investor segment and the market remained
dormant.
The Indian Bond Market has been traditionally dominated by the Government
securities market. The reasons for this are :
ISSN 2277 8675 - DMIETR International Journal on Finance Management
12
The high and persistent government deficit and the need to promote an
efficient government securities market to finance this deficit at an
optimal cost,
A captive market for the government securities in the form of public
sector banks which are required to invest in government securities a
certain per cent of deposit liabilities as per statutory requirement1,
The predominance of bank lending in corporate financing and
Regulated interest rate environment that protected the banks‟ balance
sheets on account of their exposure to the government securities.
While these factors ensured the existence of a big Government securities
market, the market was passive with the captive investors buying and holding
on to the government securities till they mature. The trading activity was
conspicuous by its absence.
The scenario changed with the reforms process initiated in the early
nineties. The gradual deregulation of interest rates and the Government‟s
decision to borrow through auction mechanism and at market related rates.
Debt Market:
Debt market as the name suggests is where debt instruments or bonds
are traded. The most distinguishing feature of these instruments is that the
return is fixed i.e. they are as close to being risk free as possible, if not totally
risk free. The fixed return on the bond is known as the interest rate or the
coupon rate. Thus, the buyer of a bond gives the seller a loan at a fixed rate,
which is equal to the coupon rate. Debt Markets are therefore, markets for
fixed income securities issued by:
Central and State Governments
Municipal Corporations
Entities like Financial Institutions, Banks, Public Sector Units, and
Public Ltd. companies. The money market also deals in fixed income instruments. However,
difference between money and bond markets is that the instruments in
the bond markets have a larger time to maturity (more than one year).
The money market on the other hand deals with instruments that have a
lifetime of less than one year.

ISSN 2277 8675 - DMIETR International Journal on Finance Management
13
Return on Debt Fund
Year Central Government S
ecurities
State Government
Securities Year Central Government Securities
Range Weighted Average Range
1980-81 5.98 - 7.50 7.03 1980-81 5.98 - 7.50
1981-82 6.00 - 8.00 7.29 1981-82 6.00 - 8.00
1982-83 6.25 - 9.00 8.36 1982-83 6.25 - 9.00
1983-84 7.75 - 10.00 9.29 1983-84 7.75 - 10.00
1984-85 7.75 - 10.50 9.98 1984-85 7.75 - 10.50
1985-86 9.00 - 11.50 11.08 1985-86 9.00 - 11.50
1986-87 10.00 - 11.50 11.38 1986-87 10.00 - 11.50
1987-88 10.50 - 11.50 11.25 1987-88 10.50 - 11.50
1988-89 10.00 - 11.50 11.40 1988-89 10.00 - 11.50
1989-90 10.50 - 11.50 11.49 1989-90 10.50 - 11.50
1990-91 10.50 - 11.50 11.41 1990-91 10.50 - 11.50
1991-92 10.50 - 12.50 11.78 1991-92 10.50 - 12.50
1992-93 12.00 - 12.75 12.46 1992-93 12.00 - 12.75
1993-94 12.00 - 13.40 12.63 1993-94 12.00 - 13.40
1994-95 11.00 - 12.71 11.90 1994-95 11.00 - 12.71
1995-96 13.25 - 14.00 13.75 1995-96 13.25 - 14.00
1996-97 13.40 - 13.85 13.69 1996-97 13.40 - 13.85
1997-98 10.85 - 13.05 12.01 12.30 - 13.05 12.82
1998-99 11.10 - 12.60 11.86 12.15 - 12.50 12.35
1999-00 10.73 - 12.45 11.77 11.00 - 12.25 11.89
2000-01 9.47 - 11.70 10.95 10.50 - 12.00 10.99
2001-02 6.98 - 11.00 9.44 7.80 - 10.53 9.20
2002-03 6.57 - 8.62 7.34 6.67 - 8.00 7.49
2003-04 4.62 - 6.35 5.71 5.78 - 6.40 6.13
2004-05 4.49 - 8.24 6.11 5.60 - 7.36 6.45
2005-06 6.70 - 7.79 7.34 7.32 - 7.85 7.63
2006-07 7.06 - 8.75 7.89 7.65 - 8.66 8.10
2007-08 7.55 - 8.64 8.12 7.84 - 8.90 8.25
2008-09 5.44 - 10.03 7.69 5.80 - 9.90 7.87
2009-10 6.07 - 8.43 7.23 7.04 - 8.58 8.11
2010-11 5.98 - 8.67 7.92 8.05 - 8.58 8.39
2011-12 7.80 - 10.01 8.52 8.36 - 9.49 8.79
ISSN 2277 8675 - DMIETR International Journal on Finance Management
14
Why should one invest in fixed income securities?
Fixed Income securities offer a predictable stream of payments by way of
interest and repayment of principal at the maturity of the instrument. The debt
securities are issued by the eligible entities against the moneys borrowed by
them from the investors in these instruments. Therefore, most debt securities
carry a fixed charge on the assets of the entity and generally enjoy a
reasonable degree of safety by way of the security of the fixed and/or movable
assets of the company.
The investors benefit by investing in fixed income securities as they
preserve and increase their invested capital or also ensure the receipt of
dependable interest income.
The investors can even neutralize the default risk on their investments
by investing in Govt. securities, which are normally referred to as risk-free
investments due to the sovereign guarantee on these instruments. Debt
Markets in India and all around the world are dominated by Government
securities, which account for between 50 – 75% of the trading volumes and the
market capitalization in all markets. Government securities (G-Secs) account
for 70 – 75% of the outstanding value of issued securities and 90-95% of the
trading volumes in the Indian Debt Markets.
What are the advantages of investing in Government Securities
(G-Secs) and Debt fund ?
The Zero Default Risk is the greatest attraction for investments in G-
secs so that it enjoys the greatest amount of security possible. The other
advantages of investing in G- Secs are:
Greater safety and lower volatility as compared to other
financial instruments.
Variations possible in the structure of instruments like Index
linked Bonds, STRIPS
Higher leverage available in case of borrowings against G-
Secs.
No TDS on interest payments
Tax exemption for interest earned on G-Secs. up to Rs.3000/-
over and above the limit of Rs.9000/- under Section 80L
Greater diversification opportunities
Adequate trading opportunities with continuing volatility expected in
interest rates the world over The returns earned on the government securities
are normally taken as the benchmark rates of returns and are referred to as the
risk free return in financial theory. The Risk Free rate obtained from the G-sec
rates are often used to price the other non-govt. securities in the financial
markets.

ISSN 2277 8675 - DMIETR International Journal on Finance Management
15
Comparative Table (Showing Return and Tax benefit)
CONCLUSION
One should not enter into any investment decision in a hasty manner.
A smart investor must proactively seek information on the various investment
options available. He or she must also be sensitive to the prevailing investment
climate and market conditions. Investors must always remember to exercise
prudence when it comes to making an investment choice and decision.
I think from the above study it has been clear that current economy and
by keeping in mind future economy policy, Interest Rate, Market condition
and time-value –money one should go for safe, sufficient risk and maximum
fixed return and i.e. Investment in Debt Fund so that financial management of
these type of product and services will going to be smooth.
Name of
Investment
Rate of Interest (Per
Annum)
Term Income Tax
Deduction
1.Fixed Deposits 9-12% Short u/s 80L
2. Public
Provident Fund
8-8.6% Long Sec.88 rebate
+Interest Tax
Free
3.NSS 10-11% Long As Above
4. NSC 11% Long Sec.88 & Sec 80
L
5.Units of Mutual
Fund
Variable Long Sec. 80L
6.LIC Variable Long Sec.88
7.Mutual Fund Variable Short
8.Debt Fund 10-11% Floating
Rate
Short-Long Tax-free under
DDT
(Dividend Distri.
Tax)

ISSN 2277 8675 - DMIETR International Journal on Finance Management
16
References
1. Security Analysis and Portfolio Management- Sudhindra
Bhat
2. Investment Analysis and Portfolio Management -
Prasanna Chandra
3. www.rbi.org.in (Database- Handbook)
4. www. indiabudget.nic.
5. www.moneycontrol.com
6. www.moneycontrol.com/stocksmarketsindia
7. www.businessstandard.com

ISSN 2277 8675 - DMIETR International Journal on Finance Management
17
“NON-PERFORMING ASSETS – A STUDY OF PUBLIC
SECTOR BANKS OPERATING IN WARDHA DISTRICT,
MAHARASHTRA”
Dr. Ram O. Panchariya
MBA, M.Com., M.Phil., PGDFM, Ph.D.
Asst. Professor
Department of Management Studies
B. D. College of Engineering, Sevagram , Wardha (Maharashtra)
M/ 9822920920
ABSTRACT
The primary function of banks is to lend funds as loans to various sectors such as agriculture,
industry, personal loans, housing loans etc., in recent times the banks have become very cautious in
extending loans, this is due to mounting nonperforming assets (NPAs). Therefore, an NPA account
not only reduces profitability of banks by provisioning in the profit and loss account, but their
carrying cost is also increased which results in excess & avoidable management attention. Apart from
this, a high level of NPA also puts strain on a banks net worth because banks are under pressure to
maintain a desired level of Capital Adequacy and in the absence of comfortable profit level, banks
eventually look towards their internal financial strength to fulfil the norms thereby slowly eroding the
net worth. Considering all the above facts banking industry has to give more importance to NPA and
to structure proper remedial solutions.
The biggest ever challenge that the banking industry now faces is management of NPA. The
magnitude of NPA has a direct impact on banks profitability, liquidity & equity. "NPA is an
important parameter in the analysis of financial performance of banks". The management of
NPAs has been one of the focus areas of the bank with the objective being to achieve the global
benchmark.
Key words: Banking Industry, Public sector Banks, Profitability, Advances and NPA.

ISSN 2277 8675 - DMIETR International Journal on Finance Management
18
Better
banking leads
to a chain of
economic
activities
which further
improves the
overall
economy of
the country.
INTRODUCTION
To start with, performance in terms of profitability is a benchmark for any business enterprise
including the banking industry. Extension of credit is one of the major activities of banks and
financial institution. Credit represents the bulk of the bank and financial institution‟s asset portfolio.
However, increasing NPAs have a direct impact on banks profitability as legally banks are not
allowed to book income on such accounts and at the same time banks are forced to make provision on
such assets as per the central Bank guidelines. Also, with increasing deposits made by the public in
the banking system, the banking industry cannot afford defaults by borrower s since NPAs affects the
repayment capacity of banks. Further, central Bank successfully creates excess liquidity in the system
through various rate cuts and banks fail to utilize this benefit to its advantage due to the fear of
burgeoning non-performing assets.
Amongst many risk that bank faces one of the most critical is borrower
risk – the risk of non payment of the disbursed loans. Failure to collect fund
disbursed may sometimes results in the bank‟s inability to make repayment of the
money to depositors and return to the shareholders. The bankers have the
responsibility of safeguarding the interest of the depositors, shareholder and
society they are serving. If bank behaves unresponsively the cost born by the
economy is enormous. Banking sector is volatile and sensitive sectors of national
economy, which require effective monitoring and efficient supervision. Smooth
and effective operation of banking activities is most for sustainable economic
growth of a country. The regulatory agency should always be watchful of banking
activities carried out by government and non governmental banking and financial
institution.
MEANING OF NPA1
Non Performing Asset means an asset or account of borrower, which has been classified by a
bank or financial institution as sub-standard, doubtful or loss asset, in accordance with the
directions or guidelines relating to asset classification issued by RBI. An amount due under
any credit facility is treated as "past due" when it has not been paid within 30 days from the
due date. Due to the improvement in the payment and settlement systems, recovery climate,
up gradation of technology in the banking system, etc., it was decided to dispense with 'past
due' concept, with effect from March 31, 2001. Accordingly, as from that date, a Non
performing asset (NPA) shell be an advance where
1 Source: RBI Master Circular - Prudential norms on Income Recognition, Asset Classification and provisioning
pertaining to Advance.
ISSN 2277 8675 - DMIETR International Journal on Finance Management
19
Banks
across the
world are
facing
issues
with
respect to
asset
quality.
i. Interest and /or installment of principal remain overdue for a period of
more than 180 days in respect of a Term Loan,
ii. The account remains 'out of order' for a period of more than 180 days,
in respect of an overdraft/ cash Credit (OD/CC),
iii. The bill remains overdue for a period of more than 180 days in the case
of bills purchased and discounted,
iv. Interest and/ or installment of principal remains overdue for two harvest seasons but for a
period not exceeding two half years in the case of an advance granted for agricultural
purpose, and
v. Any amount to be received remains overdue for a period of more than 180 days in respect
of other accounts.
With a view to moving towards international best practices and to ensure greater
transparency, it has been decided to adopt the '90 days overdue' norm for identification of
NPAs, from the year ending March 31, 2004. Accordingly, with effect from March 31, 2004,
a non-performing asset (NPA) shell be a loan or an advance where;
i. Interest and /or installment of principal remain overdue for a period of more than 90 days in
respect of a Term Loan,
ii. The account remains 'out of order' for a period of more than 90 days, in respect of an
overdraft/ cash Credit(OD/CC),
iii. The bill remains overdue for a period of more than 90 days in the case of bills purchased
and discounted,
iv. Interest and/ or installment of principal remains overdue for two harvest seasons but for a
period not exceeding two half years in the case of an advance granted for agricultural
purpose, and
v. Any amount to be received remains overdue for a period of more than 90 days in respect of
other accounts.

ISSN 2277 8675 - DMIETR International Journal on Finance Management
20
ASSET CLASSIFICATION2
Loan assets of the banks are broadly classified as Performing and Non-Performing assets and
again Non-Performing assets (NPA) are classified into Substandard, Doubtful and loss assets.
Assets are classified into following four categories:
Standard Assets
Standard assets are the ones in which the bank is receiving interest as well as the principal
amount of the loan regularly from the customer. Here it is also very important that in this case
the arrears of interest and the principal amount of loan do not exceed 90 days at the end of
financial year. If asset fails to be in category of standard asset that is amount due more than
90 days then it is NPA and NPAs are further need to classify in sub categories.
Banks are required to classify non-performing assets further into the following three
categories based on the period for which the asset has remained non-performing and the
reasonability of the dues:
1) Sub-standard Assets :
With effect from 31 March 2005, a substandard asset would be one, which has remained
NPA for a period less than or equal to 12 month. The following features are exhibited by
substandard assets: the current net worth of the borrowers / guarantor or the current market
value of the security charged is not enough to ensure recovery of the dues to the banks in full;
and the asset has well-defined credit weaknesses that jeopardize the liquidation of the debt
and are characterized by the distinct possibility that the banks will sustain some loss, if
deficiencies are not corrected.
2) Doubtful Assets :
A loan classified as doubtful has all the weaknesses inherent in assets that were classified as
sub-standard, with the added characteristic that the weaknesses make collection or liquidation
in full, on the basis of currently known facts, conditions and values – highly questionable and
improbable. With effect from March 31, 2005, an asset would be classified as doubtful if it
remained in the sub-standard category for 12 months.
2 Source: RBI Master Circular - Prudential norms on Income Recognition, Asset Classification and provisioning
pertaining to Advance.
ISSN 2277 8675 - DMIETR International Journal on Finance Management
21
3) Loss Assets:
A loss asset is one which considered uncollectible and of such little value that its continuance
as a bankable asset is not warranted- although there may be some salvage or recovery value.
Also, these assets would have been identified as “loss assets” by the bank or internal or
external auditors or the RBI inspection but the amount would not have been written-off
wholly.
TYPES OF NPA
1) Gross NPA
Gross NPAs are the sum total of all loan assets that are classified as NPAs as per RBI
guidelines as on Balance Sheet date. Gross NPA reflects the quality of the loans made by
banks. It consists of all the nonstandard assets like as sub-standard, doubtful, and loss assets.
It can be calculated with the help of following ratio:
Gross NPAs Ratio = Gross NPAs
Gross Advances
2) Net NPA
Net NPAs are those type of NPAs in which the bank has deducted the provision regarding
NPAs. Net NPA shows the actual burden of banks. Since in India, bank balance sheets
contain a huge amount of NPAs and the process of recovery and write off of loans is very
time consuming, the provisions the banks have to make against the NPAs according to the
central bank guidelines, are quite significant. That is why the difference between gross and
net NPA is quite high. It can be calculated by following:
Net NPA Ratio = Gross NPAs – Provisions
Gross Advances – Provisions
REVIEW OF LITERATURE
In the banking literature, the problem of non-performing assets has been revisited in several
theoretical and empirical studies. A synoptic review of the relevant literature on the NPAs
issues examined by different researchers is presented as follows:
Debarshi Ghosh and Sukanya Ghosh (2011)3 in their article stated management of non-
performing assets in the perspective of the public sector banks in India under strict asset
classification norms, use of latest technological platform based on Core Banking Solution,
recovery procedures and other bank specific indicators in the context of stringent regulatory
3 International Conference on Management (ICM 2011) Proceeding, Penang, Malaysia (13-14 June 2011), ISBN: 978-967-5705-03-8.

ISSN 2277 8675 - DMIETR International Journal on Finance Management
22
framework of the Reserve Bank of India. Non-performing Asset is an important parameter in
the analysis of financial performance of a bank as it results in decreasing margin and higher
provisioning requirement for doubtful debts.
Mahipal Singh Yadav (2011)4
in his article “Impact of Non Performing Assets on
Profitability and Productivity of Public Sector Banks in India” has stated that Banks directly
or indirectly affect economic development because of their many facets.
Dr. Jagdish R. Raiyani and Dr. Gaurav Lodha (2011)5 in their article “Evolution of Non-
Perorming Assets : An Empirical Analysis” has stated that the NPAs are considered as an
important parameter to judge the performance and financial health of banks. The level of
NPAs is one of the drives of financial stability and growth of banking sector.
Dr. M. Jayasree and R. Radhika (2011)6 in their article stated Non- Performing assets are
assets which cease to generate any income for the bank. These have become the major
concern of banks in India. NPA‟s have direct impact on net-profit and also on the
performance of the banks.
Ms. Rajni Saluja and Dr. Roshan Lal (2010)7 in their paper stated the burgeoning NPAs in
banking Industry is a matter of deep concern. It is just not a problem for banks but also
proves fatal to the economic growth of the country. PSBs are under severe pressures of NPAs
as compared to its counterparts that private and foreign banks. NPAs reduce the profitability
of banks, weaken its financial health and erode its solvency.
OBJECTIVES OF THE STUDY
Objectives for this research are as follows:-
1. To highlight loan and advances trend of the selected PSBs operating in Wardha
District.
2. To study the magnitude and trends of Non-Performing Assets of the selected PSBs
operating in Wardha District.
3. To study the association between NPAs and Advances of the selected PSBs operating
in Wardha District.
HYPOTHESES OF THE STUDY
4 AFBE Journal, Volume 4, No. 1, June 2011, ISSN 2071-7873.
5 Indian Journal of Applied Research, Volume 1, Issue 3, December 2011, ISSN- 2249-555x.
6 International Journal of Research in Commerce & Management, Volume No: 1 (2011), Issue No. 1 (May) ISSN 2231-4245.
7 International Journal of Research in Commerce & Management, Volume No: 1 (2010), Issue No. 7 (November) ISSN 0976-2183.
ISSN 2277 8675 - DMIETR International Journal on Finance Management
23
Hypotheses for this research are as follows:-
1. There is no significant association between Gross NPAs and Gross advances of the
selected PSBs operating in Wardha District.
2. There is no significant association between Net NPAs and Net advances of the
selected PSBs operating in Wardha District.
NATURE / TYPE OF THE STUDY
This research is diagnostic in nature because it is regarding the knowing of causes of non-performing
assets prevailing in banks.
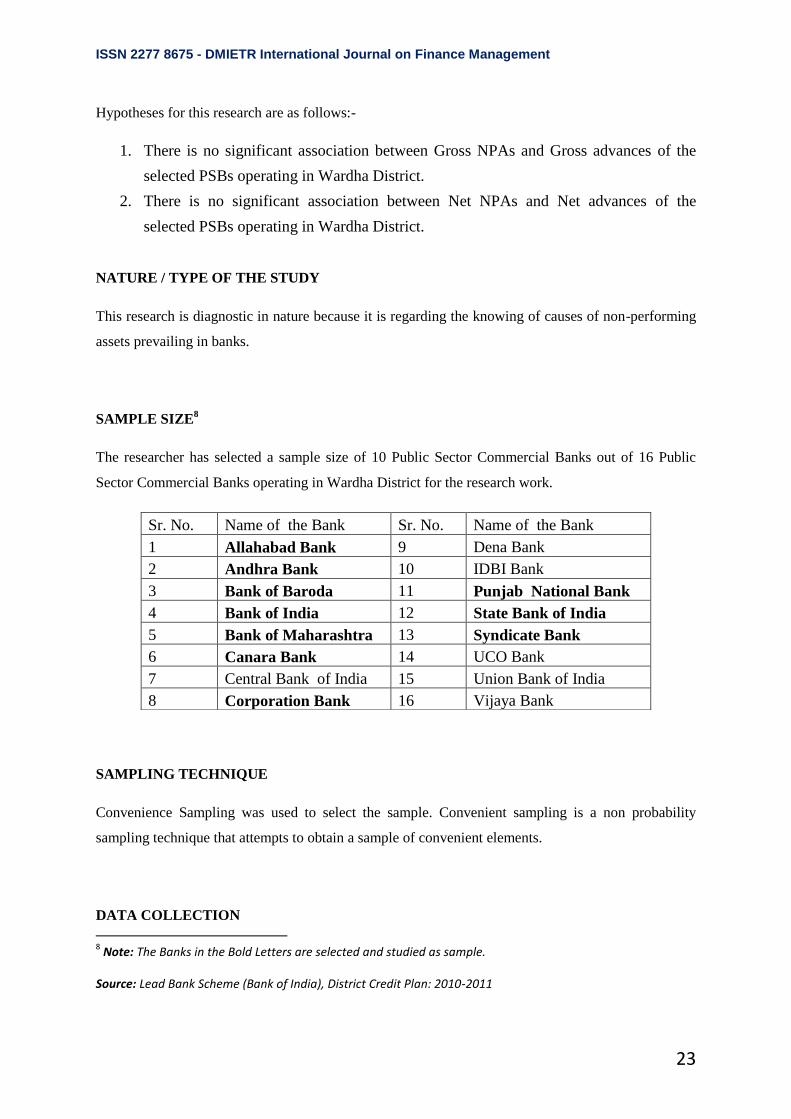
SAMPLE SIZE8
The researcher has selected a sample size of 10 Public Sector Commercial Banks out of 16 Public
Sector Commercial Banks operating in Wardha District for the research work.
SAMPLING TECHNIQUE
Convenience Sampling was used to select the sample. Convenient sampling is a non probability
sampling technique that attempts to obtain a sample of convenient elements.
DATA COLLECTION
8 Note: The Banks in the Bold Letters are selected and studied as sample.
Source: Lead Bank Scheme (Bank of India), District Credit Plan: 2010-2011
Sr. No. Name of the Bank Sr. No. Name of the Bank
1 Allahabad Bank 9 Dena Bank
2 Andhra Bank 10 IDBI Bank
3 Bank of Baroda 11 Punjab National Bank
4 Bank of India 12 State Bank of India
5 Bank of Maharashtra 13 Syndicate Bank
6 Canara Bank 14 UCO Bank
7 Central Bank of India 15 Union Bank of India
8 Corporation Bank 16 Vijaya Bank
ISSN 2277 8675 - DMIETR International Journal on Finance Management
24
The research is based on the secondary data only. The technique used to obtain the secondary data is
the annual reports of concerned banks and other reports were downloaded from the websites. Various
publication of RBI was collected from website of RBI. Similarly the references of RBI directives and
guidelines have been obtained from website of RBI, various reports, textbooks and journals.
STATISTICAL TOOLS
Statistical tools are the mathematical techniques used to facilitate the analysis and interpretation of
numerical data. Following statistical tools have been used in this study.
Percentages, Correlation, Coefficient of determination, Adjusted Coefficient of determination,
Regression.
LEVEL OF SIGNIFICANCE: The level of Significance is 5% (0.05)
LIMITATIONS OF STUDY
The major limitations of the study are:-
This research is concerned only with the Non- Performing Assets of the selected banks.
It doesn‟t consider other aspects of banks.
This research is focused on public sector commercial banks operating in Wardha District
only as public sector commercial banks constitute a major portion in banking sector.
The period of the study is limited for fiscal year 2006-07 to 2010-11.
Because of the strict policy of the banks, the study is mainly based on secondary data.
The data published in annual reports of respective banks, articles, publication, journal
etc. have been taken into consideration. Any misrepresentation, mistakes, omission etc.
may affect the outcome of the study. Thus, the reality of the study depends on secondary
sources of the data.
TIME SCHEDULE: The period of study is from the year 2006-07 to 2010-11.
.
ISSN 2277 8675 - DMIETR International Journal on Finance Management
25
DATA ANALYSIS AND INTERPRETATION
Hypothesis No. 1
H0: There is no significant association between Gross NPAs (GNPA) and Gross Advances (GA)
of selected banks functioning in Wardha District.
H1: There is significant association between Gross NPAs (GNPA) and Gross Advances (GA) of
selected banks functioning in Wardha District.
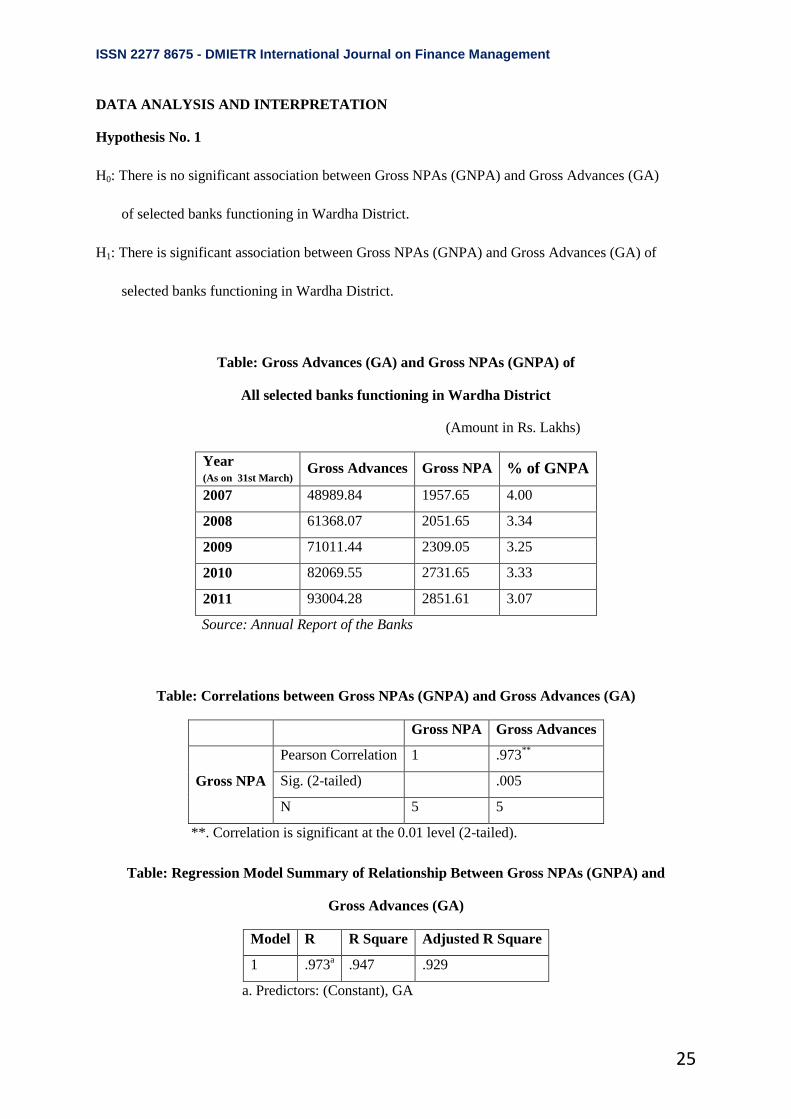
Table: Gross Advances (GA) and Gross NPAs (GNPA) of
All selected banks functioning in Wardha District
(Amount in Rs. Lakhs)
Year (As on 31st March)
Gross Advances Gross NPA % of GNPA
2007 48989.84 1957.65 4.00
2008 61368.07 2051.65 3.34
2009 71011.44 2309.05 3.25
2010 82069.55 2731.65 3.33
2011 93004.28 2851.61 3.07
Source: Annual Report of the Banks
Table: Correlations between Gross NPAs (GNPA) and Gross Advances (GA)
Gross NPA Gross Advances
Gross NPA
Pearson Correlation 1 .973**
Sig. (2-tailed) .005
N 5 5
**. Correlation is significant at the 0.01 level (2-tailed).
Gross Advances (GA)
Model R R Square Adjusted R Square
1 .973a .947 .929
a. Predictors: (Constant), GA
Table: Regression Model Summary of Relationship Between Gross NPAs (GNPA) and

ISSN 2277 8675 - DMIETR International Journal on Finance Management
26
The statistical test of Pearson correlation shows that there is high degree of positive correlation
between Gross Advances and Gross NPAs with R=0.973 and p-value is 0.005. In the test R Square is
0.947 and adjusted R square is 0.929. On the basis of adjusted R square it can be stated that 92.9 % of
variation in Gross NPAs is explained by variation Gross Advances.
Hypothesis No. 2
H0 : There is no significant association between Net NPAs(NNPA) and Net Advances(NA)
of selected banks functioning in Wardha District.
H1 : There is significant association between Net NPAs(NNPA) and Net Advances(NA) of
selected banks functioning in Wardha District.
Table: Net Advances (NA) and Net NPAs (NNPA) of
All selected banks functioning in Wardha District
(Amount in Rs. Lakhs)
Year (As on 31st March)
Net Advances Net NPA % of NNPA
2007 47605.05 915.19 1.92
2008 60028.76 967.10 1.61
2009 69702.75 1205.45 1.73
2010 80366.87 1451.73 1.81
2011 91364.85 1419.85 1.55
Source: Annual Report of the Banks
Table: Correlations between Net NPAs (NNPA) and Net Advances (NA)
Net NPA Net Advances
Net NPA
Pearson Correlation 1 .944*
Sig. (2-tailed) .016
N 5 5
*. Correlation is significant at the 0.05 level (2-tailed).
ISSN 2277 8675 - DMIETR International Journal on Finance Management
27
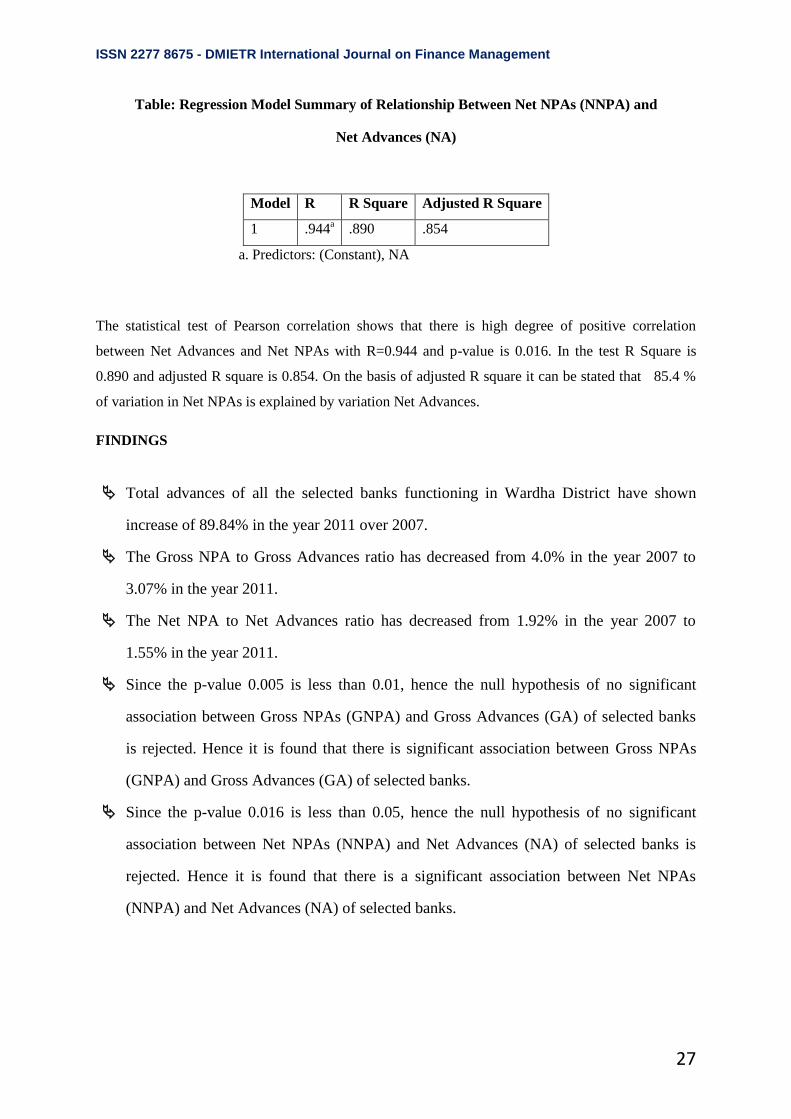
Table: Regression Model Summary of Relationship Between Net NPAs (NNPA) and
Net Advances (NA)
Model R R Square Adjusted R Square
1 .944a .890 .854
a. Predictors: (Constant), NA
The statistical test of Pearson correlation shows that there is high degree of positive correlation
between Net Advances and Net NPAs with R=0.944 and p-value is 0.016. In the test R Square is
0.890 and adjusted R square is 0.854. On the basis of adjusted R square it can be stated that 85.4 %
of variation in Net NPAs is explained by variation Net Advances.
FINDINGS
Total advances of all the selected banks functioning in Wardha District have shown
increase of 89.84% in the year 2011 over 2007.
The Gross NPA to Gross Advances ratio has decreased from 4.0% in the year 2007 to
3.07% in the year 2011.
The Net NPA to Net Advances ratio has decreased from 1.92% in the year 2007 to
1.55% in the year 2011.
Since the p-value 0.005 is less than 0.01, hence the null hypothesis of no significant
association between Gross NPAs (GNPA) and Gross Advances (GA) of selected banks
is rejected. Hence it is found that there is significant association between Gross NPAs
(GNPA) and Gross Advances (GA) of selected banks.
Since the p-value 0.016 is less than 0.05, hence the null hypothesis of no significant
association between Net NPAs (NNPA) and Net Advances (NA) of selected banks is
rejected. Hence it is found that there is a significant association between Net NPAs
(NNPA) and Net Advances (NA) of selected banks.
ISSN 2277 8675 - DMIETR International Journal on Finance Management
28
CONCLUSION
In this study it is found that all the selected banks are facing the problem of NPAs but there is
improvement in the asset quality as reflected by decline in the diverse NPA ratios of the
selected banks. It can be concluded from the study that there is a significant association
between NPAs and Advances of selected PSBs operating in Wardha District.
REFERENCES
Banambar Sahoo, Bankers Hand book on N.P.A. Management, S/P Gogia C/o
Asia Law House, Hyderabad, Second Edition, 2002.
Agrawal N. P. and Jain S. C., Management of Non- performing Assets, Raj
publishing House, Jaipur, First Edition, 2004.
Reddy B. Ramchandra, Management of Non- performing Assets in Banks and
Financial Institutions, Serials publications, New Delhi, First Edition, 2004.
Jain S. C., Non- performing Assets in Banks, RBSA Publishers, Jaipur, First Edition,
2005.
Vibha Jain, “Non-Performing Assets in commercial Banks”, Regal Publication,
New Delhi, 1st Edition 2007, Pages 78-79, 2007.
Kothari C. R., Research Methodology Methods and Techniques, New Age
International (P) Limited Publishers, New Delhi, Second Revised Edition.
Krishnaswamy , O. R. and Reddy D. Obul, Research Methodology and Statistical
Tools, Himalaya Publishing House Pvt. Ltd., Mumbai, First Edition, 2008.
Debarshi Ghosh and Sukanya Ghosh (2011), Management of Non-Performing
Assets in Public Sector Banks: Evidence from India”, International Conference on
Management (ICM 2011)Proceeding, Penang, Malaysia (13-14 June 2011), ISBN:
978-967-5705-03-8.
Mahipal Singh Yadav (2011), “Impact of Non Performing Assets on Profitability
and Productivity of Public Sector Banks in India”, AFBE Journal, Volume 4, No.
1, June 2011, ISSN 2071-7873.
Dr. Jagdish R. Raiyani and Dr. Gaurav Lodha (2011), “Evolution of Non-
Perorming Assets : An Empirical Analysis” Indian Journal of Applied Research,
Volume 1, Issue 3, December 2011, ISSN- 2249-555x.
Dr. M. Jayasree and R. Radhika (2011), “Non-Performing Assets: A study of
Scheduled Commercial Banks in India” International Journal of Research In
Commerce & Management, Volume No: 1 (2011), Issue No. 1 (May) ISSN 2231-
4245.
Ms. Rajni Saluja and Dr. Roshan Lal (2010), “Comparative Analysis on Non-
Performing Assets (NPA‟s) of Public Sector, Private Sector and Foreign Banks in

ISSN 2277 8675 - DMIETR International Journal on Finance Management
29
India” International Journal of Research in Commerce & Management, Volume
No: 1 (2010), Issue No. 7 (November) ISSN 0976-2183.
Manoj Kumar Dash and Gaurav Kabra (2010), “The Determinants of Non-
Performing Assets in Indian Commercial Bank: An Econometric Study” Middle
Eastern Finance and Economics, Issue 7 (2010), ISSN: 1450-2889.
Reddy, Y.V. (2004), “Credit Policy, Systems, and Culture” Reserve Bank of India
Bulletin, March, 2004.
Muniappan G. (2002), “The NPA Overhang - Magnitude, Solutions, Legal Reforms”
Academic Foundation's Bulletin on Banking & Finance: Volume – 30, 2002 Edition;
ISBN - 81-7188-260-9.
ISSN 2277 8675 - DMIETR International Journal on Finance Management
30
“Foreign Direct Investment in Indian Retail Sector - An
Analysis”
Swapnil b. Bante
Department of business administration & management
Sant gadge baba amravati university, amravati 444602.
ABSTRACT
The Indian government initially is very interested for introducing the Foreign Direct
Investment in the retail sector in India. Indian retail industry is one of the sunrise sectors with
huge growth potential, according to the Investment Commission of India, the retail sector is
expected to grow almost three times its current levels to $ 660 billion by 2015. However, in
spite of the recent development in retailing and its immense contribution to economy,
retailing continues to be the least evolved industries and the growth of organized retailing in
India has been much slower as compared to rest of the world.
The unorganized retail sector contributes about 14% to the GDP and absorbs about 7% of our
labour force. Hence the issue of displacement of labour consequent to FDI is of primal
importance.
There are different viewpoints on the impact of Foreign Direct Investment in the Indian retail
sector.
This paper highlight the Introduction & definitions of retail, Classification of retail sector,
FDI policy with regard to retailing in India, and SWOT analysis of retail sector and
conclusion.
Key Words: Retail Sector, Competition, Foreign Direct Investment, SWOT Analysis.
INTRODUCTION
India being a signatory to World Trade Organizations General Agreement on Trade in
Services, which include wholesale and retailing services, had to open up the retail trade sector
to foreign investment. There were initial reservations towards opening up of retail sector
arising from fear of job losses, procurement from international market, competition and loss
of entrepreneurial opportunities. However, the government in a series of moves has opened
ISSN 2277 8675 - DMIETR International Journal on Finance Management
31
up the retail sector slowly to Foreign Direct Investment (FDI). In 1997, FDI in cash and carry
(wholesale) with 100 percent ownership was allowed under the Government approval route.
It was brought under the automatic route in 2006. 51% investment in a single brand retail
outlet was also permitted in 2006. FDI in Multi-Brand retailing is prohibited in India.
All Indian households have traditionally enjoyed the convenience of calling up the corner
grocery “kirana” store, which is all too familiar with their brand preferences, offers credit,
and applies flexible conditions for product return and exchange. And while mall based
shopping formats are gaining popularity in most cities today, the price-sensitive Indian
shopper has reached out to store such as „Big Bazar‟ mainly for the sleep discounts and bulk
prices.
Objectives of the Study
The following are the main objectives of this paper.
1. To study the FDI Inflow in Indian retail industry.
2. To understand the FDI policy towards retail industry.
Methodology of the study
The study is based on secondary sources of data. The sources of data are various Economic
Surveys of India and Ministry of Commerce and Industry data, online database of Indian
Economy, journals, articles, newspapers, etc.
Definition of Retail: In 2004, The High Court of Delhi defined the term “Retail” as a sale
for final consumption in contrast to a sale for further sale or processing (i.e. wholesale). A
sale to ultimate consumer.
Thus, Retail can be said that the sale of goods and services from individuals or business to the
end-user, or in other words All activities involve in selling goods or services directly to final
consumer for their personal, non-business use. Retailers are part of an integrated system
called the supply chain. A retailer purchases goods or products in large quantities from
manufacturers directly or through a wholesaler, and then sells smaller quantities to the
consumer for a profit.
ISSN 2277 8675 - DMIETR International Journal on Finance Management
32
Classification of the Retail on the basis of types of products as follows:
Food Products
Hard goods or durable goods - Appliances, electronics, furniture, sporting goods, etc
Goods that do not quickly wear out and provide utility over time.
Soft goods or consumables - clothing, apparel, and other fabrics. Goods that are
consumed after one use of have a limited period (typically under three years) in which
you may use them.
Division of Retail Industry: The retail industry is mainly divided into:
1) Organized and
2) Unorganized Retailing.
Organized retailing refers to trading activities undertaken by licensed retailers, that is, those
who are registered for sales tax, income tax, etc. These include the corporate-backed hyper
markets and retail chains, and also the privately owned large retail businesses. In other words
we can say that organized retailing comprises mainly of modern retailing with busy shopping
malls, multi storied malls and huge complexes that offer a large variety of products in terms
of quality, value for money and makes shopping a memorable experience.
Unorganized retailing on other hand, unorganized or traditional retail outlets are normally
street markets, counter stores and vendors, where the ownership and management rest with
one person only. This sector accounts for two third of the market and requires low skilled
labour. These are highly competitive outlets, with negligible rental costs and low taxes and
overheads. In other words we can say that unorganized retailing refers to the traditional
formats of low-cost retailing, for example the local kirana shops, owner manned general
stores, paan/beedi shops, convenience stores, hand cart and pavement vendors, etc
Retailing Scenario in India
Most of the retail sector in India is unorganized, which were known as mom-pop stores. The
biggest advantage in this sector is the consumer familiarity that passes on from one
generation to next. The transformation stage of the retail sector started in late 1990‟s. The
emergence of pure retailer has started at this stage as it is been perceived as a beginner and
the organized retailing is getting more attractive. In India, the retail business contributes
ISSN 2277 8675 - DMIETR International Journal on Finance Management
33
around 11 percent of GDP in 2005. Of this, the organized retail sector accounts only for about
3 percent share, and the remaining share is contributed by the unorganized sector.
FDI Policy in India:
FDI as defined in Dictionary of Economics (Graham Bannock et.al) is investment in a foreign
country through the acquisition of a local company or the establishment there of an operation
on a new (Greenfield) site. To put in simple words, FDI refers to capital inflows from abroad
that is invested in or to enhance the production capacity of the economy.
Foreign Investment in India is governed by the FDI policy announced by the Government of
India and the provision of the Foreign Exchange Management Act (FEMA) 1999. The
Reserve Bank of India (RBI) in this regard had issued a notification, which contains the
Foreign Exchange Management (Transfer or issue of security by a person resident outside
India) Regulations, 2000. This notification has been amended from time to time.
The Ministry of Commerce and Industry, Government of India is the nodal agency for
motoring and reviewing the FDI policy on continued basis and changes in sectoral policy/
sectoral equity cap. The FDI policy is notified through Press Notes by the Secretariat for
Industrial Assistance (SIA), Department of Industrial Policy and Promotion (DIPP).The
foreign investors are free to invest in India, except few sectors/activities, where prior
approval from the RBI or Foreign Investment Promotion Board (FIPB) would be required.
FDI Policy with Regard to Retailing in India:
It will be prudent to look into Press Note 4 of 2006 issued by DIPP and consolidated FDI
Policy issued in October 2010 which provide the sector specific guidelines for FDI with
regard to the conduct of trading activities.
a) FDI up to 100% for cash and carry wholesale trading and export trading allowed under
the automatic route.
b) FDI up to 51 % with prior Government approval (i.e. FIPB) for retail trade of Single
Brand „products, subject to Press Note 3 (2006 Series).
c) FDI is not permitted in Multi Brand Retailing in India.
Changes in FDI Policy for Retail Sector
In India The government (led by Dr. Manmohan Singh, announced following prospective
reforms in Indian Retail Sector
1. India will allow FDI of up to 51% in multi brand sector.
2. Single brand retailers such as Apple and IKEA, can own 100% of their Indian stores, up
from previous cap of 51%.
ISSN 2277 8675 - DMIETR International Journal on Finance Management
34
3. The retailers (both single and multi brand) will have to source at least 30% of their goods
from small and medium sized Indian suppliers.
4. All retail stores can open up their operations in population having over 1million.Out of
approximately 7935 towns and cities in India, 55 suffice such criteria.
5. Multi-brand retailers must bring minimum investment of US$ 100 million. Half of this
must be invested in back-end infrastructure facilities such as cold chains, refrigeration,
transportation, packaging etc. to reduce post-harvest losses and provide remunerative
prices to farmers.
6. The opening of retail competition (policy) will be within parameters of state laws and
regulations.
Foreign Investors Concern Regarding FDI policy in India:
For those brands which adopt the franchising route as a matter of policy, the current FDI
Policy will not make any difference. They would have preferred that the Government
liberalize rules for maximizing their royalty and franchise fees. They must still rely on
innovative structuring of franchise arrangements to maximize their returns. Consumer
durable majors such as LG and Samsung, which have exclusive franchisee owned stores, are
unlikely to shift from the preferred route right away. For those companies which choose to
adopt the route of 51% partnership, they must tie up with a local partner. The key is finding a
partner which is reliable and who can also teach a trick or two about the domestic market and
the Indian consumer.
Currently, the organized retail sector is dominated by the likes of large business groups which
decided to diversify into retail to cash in on the boom in the sector corporate such as Tata
through its brand Westside, RPG Group through Food world, Pantaloon of the Raheja Group
and Shopper‟s Stop. Do foreign investors look to tie up with an existing retailer or look to
others not necessarily in the business but looking to diversify, as many business groups are
doing?
An arrangement in the short to medium term may work wonders but what happens if the
Government decides to further liberalize the regulations as it is currently contemplating? Will
the foreign investor terminate the agreement with Indian partner and trade in market without
him? Either way, the foreign investor must negotiate its joint venture agreements carefully,
with an option for a buy-out of the Indian partner‟s share if and when regulations so permit.
They must also be aware of the regulation which states that once a foreign company enters
ISSN 2277 8675 - DMIETR International Journal on Finance Management
35
into a technical or financial collaboration with an Indian partner, it cannot enter into another
joint venture with another Indian company or set up its own subsidiary in the „same‟ field‟
without the first partner‟s consent if the joint venture agreement does not provide for a
„conflict of interest‟ clause. In effect, it means that foreign brand owners must be extremely
careful whom they choose as partners and the brand they introduce in India. The first brand
could also be their last if they do not negotiate the strategic arrangement diligently.
FDI in Single Brand Retail:
The Government has not categorically defined the meaning of “Single Brand” anywhere
neither in any of its circulars or nor any notifications. In single brand retail, FDI up to 51
percent is allowed, subject to Foreign Investment Promotion Board (FIPB) approval and
subject to the conditions mentioned in following
a) Only single brand products would be sold (i.e. retail of goods of multi brand even if
produced by the same manufacturer would not be allowed)
b) Products should be sold under the same brand internationally,
c) Single brand product retail would only cover products which are branded during
manufacturing and
d) Any addition to product categories to be sold under “single brand” would require fresh
approval from the government.
FDI in Multi Brand Retail:
The government has also not defined the term Multi Brand. FDI in Multi Brand retail implies
that a retail store with a foreign investment can sell multiple brands under one roof.
In July 2010, Department of Industrial Policy and Promotion (DIPP), Ministry of Commerce
circulated a discussion paper on allowing FDI in multi brand retail. The paper doesn‟t suggest
any upper limit on FDI in multi-brand retail. If implemented, it would open the doors for
global retail giants to enter and establish their footprints on the retail landscape of India.
Opening up FDI in multi brand retail will mean that global retailers including Wal Mart,
Carrefour and Tesco can open stores offering a range of household items and grocery directly
to consumers in the same way as the ubiquitous „kirana‟ store.
Growth and Evolution of Indian Retail Sector:
The Indian Retail Industry is the 5th largest retail destination and the second most attractive
market for investment in the globe after Vietnam as reported by AT Kearney‟s seventh
annual Globe Retail Development Index (GRDI), in 2008.The growing popularity of Indian

ISSN 2277 8675 - DMIETR International Journal on Finance Management
36
Retail sector has resulted in growing awareness of quality products and brands. As a whole
Indian retail has made life convenient, easy, quick and affordable. Indian retail sector
specially organized retail is growing rapidly, with customer spending growing in
unprecedented manner. It is undergoing metamorphosis. Till 1980 retail continued in the
form of kiranas that is unorganized retailing. Later in 1990 branded retail outlet like Food
World, Nilgiris and local retail outlets like Apna Bazaar came into existence. Now big
players like Reliance, Tata, Bharti, ITC and other reputed companies have entered into
organized retail business.
The multinationals with 51% opening of FDI in single brand retail has led to direct entrance
of companies like Nike, Reebok, Metro etc. or through joint ventures like Wall Mart with
Bharti, Tata with Tesco etc.
SWOT Analysis of Retail Sector:
1. Strength
Major contribution to GDP: the retail sector in India is hovering around 33-35% of GDP
as compared to around 20% in USA.
High Growth Rate: the retail sector in India enjoys an extremely high growth rate of
approximately 46%.
High Potential: since the organized portion of retail sector is only 2-3%, thereby creating
lot of potential for future players.
High Employment Generator: the retail sector employs 7% of work force in India, which
is right now limited to unorganized sector only. Once the reforms get implemented this
percentage is likely to increase substantially.
2. Weaknesses :
Lack of Competitors: AT Kearney„s study on global retailing trends found that India is
least competitive as well as least saturated markets of the world.
Highly Unorganized: The unorganized portion of retail sector is only 97% as compared to
US, which is only 20%.
Low Productivity: Mckinsey study claims retail productivity in India is very low as
compared to its international peers.
Shortage of Talented Professionals: the retail trade business in India is not considered as
reputed profession and is mostly carried out by the family members (self-employment and
captive business). Such people are not academically and professionally qualified.

ISSN 2277 8675 - DMIETR International Journal on Finance Management
37
No Industry status, hence creating financial issues for Retailers: The retail sector in India
does not enjoy industry status in India, thereby making difficult for retailers to raise
funds.
3. Opportunities
There will be more organization in the sector: Organized retail will need more workers.
According to findings of KPMG, in China, the employment in both retail and wholesale
trade increased from 4% in 1992 to about 7% in 2001, post reforms and innovative
competition in retail sector in that country.
Healthy Competition will be boosted and there will be a check on the prices
(inflation):Retail giants such as Wal-Mart, Carrefour, Tesco, Target and other global
retail companies already have operations in other countries for over 30 years. Until now,
they have not at all become monopolies rather they have managed to keep a check on the
food inflation through their healthy competitive practices.
Create transparency in the system: the intermediaries operating as per mandi norms do
not have transparency in their pricing. According to some of the reports, an average
Indian farmer realizes only one-third of the price, which the final consumer pays.
Intermediaries and Mandi system will be evicted, hence directly benefiting the farmers
and producers: the prices of commodities will automatically be checked. For example,
according to Business Standard, Wal-Mart has introduced Direct Farm Project at Haider
Nagar in Punjab, where 110 farmers have been connected with Bharti Wal-Mart for
sourcing fresh vegetables directly.
Quality Control and Control over Leakage and Wastage: due to organization of the sector,
40% of the production does not reach the ultimate consumer. According to the news in
Times of India, 42% of the children below the age group of 5 are malnourished and Prime
Minister Dr. Manmohan Singh has termed it as national shamel. Food often gets rot in
farm, in transit and in state-run warehouses. Cost conscious and highly competitive
retailers will try to avoid these wastages and losses and it will be their Endeavour to make
quality products available at lowest prices, hence making food available to weakest and
poorest segment of Indian society.
Heavy flow of capital will help in building up the infrastructure for the growing
population: India is already operating in budgetary deficit. Neither the government of
India nor domestic investors are capable of satisfying the growing needs (school,
ISSN 2277 8675 - DMIETR International Journal on Finance Management
38
hospitals, transport etc.) of the ever growing Indian population. Hence foreign capital
inflow will enable us to create a heavy capital base.
There will be sustainable development and many other economic issues will be focused
upon: many Indian small shop owners employ workers, who are not under any contract
and also under aged workers giving rise to child labour. It also boosts corruption and
black money.
4. Threats
Current Independent Stores will be compelled to close: This will lead to massive job loss
as most of the operations in big stores like Wal-Mart are highly automated requiring
fewer work forces.
Big players can knock-out competition: they can afford to lower prices in initial stages,
become monopoly and then raise price later.
India does not need foreign retailers: as they can satisfy the whole domestic demand.
Remember East India Company it entered India as trade rand then took over politically.
The government hasn‟t able to build consensus.
In view of the above analysis, if we try to balance opportunities and prospects attached to
the given economic reforms, it will definitely cause good to Indian economy and
consequently to public at large, if once implemented. Thus the period for which we delay
these reforms will be loss for government only, since majority of the public is in favour of
reforms. All the above mentioned drawbacks are mostly politically created. With the
implementation of this policy all stakeholders will benefit whether it is consumer through
quality products at low price, farmers through more transparency in trading or Indian
corporate with 49% profit share remaining with Indian companies only.
FDI and Global business environment:
FDI is regarded as predominantly a source of finance, which has impact on the balance of
payments and macroeconomic management of the global economy. A significant
characteristic of FDI is that it has become a key source of external finance for developing
countries (DCs). Flow of FDI has reduced the degree of international conflict and
encouraged co-operation between countries.
If we considering FDI and globalization, it should be mentioned that apart from being a
source of finance, Business Globalization can benefit from FDI through:
ISSN 2277 8675 - DMIETR International Journal on Finance Management
39
a transfer of technology, and
Spillovers, whereby the indirect impact of FDI is to increase productivity in local firms.
Here again there is a wealth of information on these topic areas. In brief, it has been found
that a country is more likely to benefit from multinational investment when it is integrated
into the national development and technological policies and plans. This is particularly
adopted in the context of sustainable development.
It is well known fact that FDI can complement local development efforts in a number of
ways, including boosting export competitiveness, generating employment and strengthening
the skills base, enhancing technological capabilities (transfer, diffusion and generation of
technology) and increasing financial resources for development. It can also help plug a
country into the international trading system as well as promote a more competitive business
environment.
Conclusion:
The government has added an element of social benefit to its latest plan for calibrated
opening of the multi-brand retail sector to foreign direct investment (FDI). Only those foreign
retailers who first invest in the back-end supply chain and infrastructure would be allowed to
set up multi brand retail outlets in the country. The idea is that the firms must have already
created jobs for rural India before they venture into multi-brand retailing.
It can be said that the advantages of allowing unrestrained FDI in the retail sector evidently
outweigh the disadvantages attached to it and the same can be deduced from the examples of
successful experiments in countries like Thailand and China where too the issue of allowing
FDI in the retail sector was first met with incessant protests, but later turned out to be one of
the most promising political and economic decisions of their governments and led not only to
the commendable rise in the level of employment but also led to the enormous development
of their country‟s GDP.
Moreover, in the fierce battle between the advocators and antagonist of unrestrained FDI
flows in the Indian retail sector, the interests of the consumers have been blatantly and utterly
disregarded. Therefore, one of the arguments which inevitably need to be considered and
addressed while deliberating upon the captioned issue is the interests of consumers at large in
relation to the interests of retailers.
ISSN 2277 8675 - DMIETR International Journal on Finance Management
40
It is also pertinent to note here that it can be safely contended that with the possible advent of
unrestrained FDI flows in retail market, the interests of the retailers constituting the
unorganized retail sector will not be gravely undermined, since nobody can force a consumer
to visit a mega shopping complex or a small retailer/sabji mandi. Consumers will shop in
accordance with their utmost convenience, where ever they get the lowest price, max variety,
and a good consumer experience.
The Industrial policy 1991 had crafted a trajectory of change whereby every sectors of Indian
economy at one point of time or the other would be embraced by liberalization, privatization
and globalization. FDI in multi-brand retailing and lifting the current cap of 51% on single
brand retail is in that sense a steady progression of that trajectory. But the government has by
far cushioned the adverse impact of the change that has ensued in the wake of the
implementation of Industrial Policy 1991 through safety nets and social safeguards. But the
change that the movement of retailing sector into the FDI regime would bring about will
require more involved and informed support from the government. One hopes that the
government would stand up to its responsibility, because what is at stake is the stability of the
vital pillars of the economy- retailing, agriculture, and manufacturing. In short, the socio
economic equilibrium of the entire country.

ISSN 2277 8675 - DMIETR International Journal on Finance Management
41
References:
Websites:-
www.cci.gov.in
www.dnaindia.com
www.studyfreak.com
www.scribd.com
www.studymode.com
www.vijayvaani.com
www.indiatoday.intoday.in
Articles/Reports:-
1. Dr. R. K. Balyan “FDI in Indian Retail- Beneficial or Detrimental”-research paper
2. Rupali Gupta “FDI in Indian retail sector: analysisof competition in Agri-food sector”
2012.
3. Dr.G. Shashidhar Rao & C.H. Prashanth Foreign Direct Investment in Indian Retail
Industry (IJCBM), 2012.
4. Binod Kumar Sinha Icfai Academy Raipur, “Retailing in India: The WayAhead”.
5. Government of India: Manual on FDI in India, May 2003.
6. Dr. Usha. N. Patil: Foreign Direct Investment in Indian Retail Sector.
7. Dr. RanaZehraMasood: FDI and its Impact on Indian and Chinese Economy
Newspapers:-
The Economic Times
The Business Standard
ISSN 2277 8675 - DMIETR International Journal on Finance Management
42
IMPACT OF MERGERS AND ACQUISITION ON FINANCIAL
PERFORMANCE OF MERGED BANKS (A Case Study of Bank of
Baroda)
Dr. Kanchan Naidu
Assistant Professor
RCOEM, Nagpur.
(m) 9373100321
Mail: [email protected]
&
Prof. Vandana Gandhi
Assistant Professor
RCOEM, Nagpur
(m) 9326787286
Mail: [email protected]
Abstract
Mergers and acquisitions (M & A) have been a very important market entry strategy as well as expansion strategy. This present era is known as competition era. Merger in the banking sector in India is crucial from various aspects. Present banking scene in India demands consolidated efforts to pave the way for healthy competition and improved vibrancy of banks. In the present paper attempt is made to evaluate the impact of mergers on the merged bank of country i.e. Bank of Baroda with Banaras Bank. The main objective of the study is to analyze the impact of merger on financial performance of the merged Bank. Thisevaluation is done using CAMEL Model and various ratios therein. The entire period of study is divided into pre- merger and post- merger period. The study is secondary based and data is mainly collected from the annual reports of Bank of Baroda.Statistical tools like average, standard deviation, coefficient of variation etc. is calculated.The present study concludes that the overall financial performance of the bank is strong after the merger and this is also supported by the t-testand in almost all parameters of CAMEL Model.
Introduction:
The nationalization phase of the early 1970‟s brought some of the elite banks under the
government‟s control. The next decade heralded the second phase of nationalization with the
merging of old private sector banks. The 1990s saw partial liberalization of new private
sector banks as well as international banks. During the next few years, fears of liberalization
were put to rest and in the past decade the banking system has gained much from it.
Liberalization brought out the best in the industry inducing competitive spirit among various
banks. It was during this period that the banks were restructured, shed the flab of over
employment, embraced technology and ventured into themselves to cater to the ever
demanding customers. Also during this period the banks put in place effective risk

ISSN 2277 8675 - DMIETR International Journal on Finance Management
43
management mechanism and added fresh capital, which is very important to the banking
industry. By concentrating on the top line and bottom line, banks across the abroad have
improved their profit while reducing their operational costs and more number of banks are
improved their financial performance by using the concept of mergers and acquisitions.
With the development of the banking sector, it is interesting to know how the selected
merged banks have performed. The present study carried out a closer analysis on three
merged banks based on their annual results before and after the merger. For the purpose of
analysis of financial performance of the merged banks, world renowned, CAMEL model is
applied. CAMEL stands for Capital Adequacy, Asset Quality, Management, earning Quality
and Liquidity. But the financial performance is measured through spread, burden,
profitability, capital adequacy, asset quality and liquidity of the merged banks before and
after merger. They are the crucial parameters which reflect the operating as well as the level
of Net Non-performing Assets (NNPAs) as a percentage to total assets and advances.
A ratio is a simple arithmetical expression of the relationship of one number to another.
Financial ratio analysis is the study of ratios between various items or groups of items in
financial statements. The ratio analysis is one of the most powerful tools of financial analysis.
It is widely used as a device to analyze and interpret the financial health of an enterprise. It is
with help of ratios that the financial statement can be analyzed more clearly and it is easy to
identify operational efficiency, liquidity and soundness of banks.
Main Objective of the Study:
1. To analyze the financial performance ofBanks of Baroda Banks using CAMEL Model
and various Ratios therein.
2. To analyze the impact of merger on financial performance of Bank of Baroda with
Banaras State Banks Limited.
3. To examine the success of M&A‟s strategy in banking sector by analyzing financial
performance of selected Merged Banks.
Research Methodology:
To assess the financial performance of merged banks, the study adopted the world renowned
CAMEL Model (with minor modifications). Apart from analyzing the merged banks on each
ratios based on CAMEL model, the study also considered the test of hypotheses by selecting
the student t statistics for measuring the financial performance.

ISSN 2277 8675 - DMIETR International Journal on Finance Management
44
Sampling:
A sample of one case of merger was considered for the purpose of analysis.
Data:
The relevant data has been collected from PROWESS, a corporate database developed by the
Centre for Monitoring Indian Economy (CMIE), annual report of selected sample bank,
journal, magazine, news, bulletin, website and reports.
CAMEL Model
The modified CAMEL model is aimed to analyze the growth of spread Ratios, Burden
Ratios, Profitability Ratios, Liquidity Ratios, Solvency Ratios and Asset Quality Ratios of
merged banks before and after merger.
1. Spread Ratios:
Spread is the difference between Interest earned and interest paid. So spread is amount
available to banks for meeting their administrative, operative and other expenses. As a matter
of practice, banks try to increase spread volume so that it is sufficiently available to meet the
non-interest expenses and remainder contributes to the profit volume.
2. Burden Ratio:
Burden is defined as the difference between noninterest expenses (comprising establishment
expenses and other expenses of current and noncurrent nature) and non-interest income
(consisting of commission, exchange brokerage and other miscellaneous receipts) of
commercial banks. It represents non-interest expenses which are not covered by non-interest
income and remains to be covered by spread so as to arrive at profit. Thus profit of
commercial banks is the difference between spread and burden. If burden is more, it
adversely affects the profit and vice versa. Therefore banks always try to maintain burden at
the minimum so as to get higher profits.
Profitability Ratios:
Profitability ratio is the common ratio to judge the profitability of Banks. This ratio measures
the profitability or the operational efficiency of the banks. Employing more resources and
making effective utilization of those resources can increase absolute profits. There are two
groups of person who may be especially interested in the analysis of profitability if the banks.
These are (i) the management which is interested in the overall profitability and operational
ISSN 2277 8675 - DMIETR International Journal on Finance Management
45
efficiency of the banks and (ii) the equity shareholders who are interested in the ultimate
returns available to them. The profitability ratios are calculated by relating the returns with
the (i) income of the banks (ii) assets of the banks (iii) the owner‟s contribution.
3. PAT/Net Sales:
Net profit is obtained when interest is expanded; operating expenses and taxes are deducted
from total income. This ratio establishes relationship between profit and total income. It
indicates management efficiency.
Net Profit/ Net Assets
This ratio measures the return on assets employed or efficiency in utilization of the assets. It
is arrived at by dividing net profit by total assets.
4. Rate of Return to Net worth (RON):
Returns on shareholders‟investment, popularly known as return on investment or return on
shareholders‟ fund is the relationship between net profits and the proprietors‟ fund. Net profit
after interest and tax is divided by the shareholders funds. This ratio is one of the most
important ratios used for measuring the overall efficiency of the banks. The primary objective
of the business is to maximize the earning and this ratio indicates the extent to which this
primary objective of the business is being achieved. His ratio is of a gear importance to the
present and prospective shareholders as well as management of the banks.
5. EPS:
Earnings per share indicate the return earned per share. It is a bit different from return on
equity capital. It is calculated by dividing the net profit after taxes and preference dividend by
the total number of equity shares. It is good measure of profitability and when compared with
EPS similar other banks, it gives a view of the comparative earning or earning power of
banks. EPS indicates whether the earning power of the banks has increased or not.
6. Liquidity Ratio:
The liquidity refers to the maintenance of cash, bank balance and those assets which are
easily converted into cash in order to meet the liabilities as and when arising. So, the liquidity
ratios examine the banks‟ short term solvency and its ability to pay off the liabilities. These
ratios as a group are intended to provide information about the banks liquidity and the
primary concern is the banks‟ ability to pay its current liabilities. These ratios focus on
current assets and current liabilities. If the bank does not have sufficient liquidity, it may not
be in a position to meet its commitments and thereby may lose its credit worthiness.

ISSN 2277 8675 - DMIETR International Journal on Finance Management
46
7. Quick Assets to Total Deposits:
This ratio measures the liquidity available to the deposits of a bank. Quick assetsinclude cash
in hand, balance with RBI, balance with other banks (both in India and abroad) and money at
call and short notice. Total deposits include demand deposits, savings deposits, term deposits
and deposits of other financial institutions.
8. Quick Assets/ Total Assets:
Quick assets include cash in hand, balance with RBI, balance with other banks (both in India
and abroad) and money at call and short notice. The ratio is arrived at by dividing quick
assets by total assets.
Liquidity/Quick Ratio:
It is defined as the relationship between quick or liquid assets and current or liquid liabilities.
Liquid assets include cash in hand, balance with RBI, balance with other banks (both in India
and abroad) and money at call and short notice. Current liabilities include short term
borrowings, short term deposits, bills payable and outstanding expenses.
9. Current Ratio:
Current ration may be defined as the relationship between current assets and current
liabilities. It is a measure of general liquidity and it is widely used to make the analysis of a
short term financial position or liquidity of a bank. It is calculated by dividing the total
current assets by total current liabilities.
Solvency Ratio:
The term solvency refers to the ability of a bank to meet its long term obligations. These
ratios indicate a bank‟s ability to meet the fixed interest and costs and repayment schedule
associated with its long term deposits.
10. Capital Adequacy Ratio (CAR):
Capital adequacy reflects the overall financial condition of the bank and also the ability of the
management to meet the need for additional capital. It reflects a bank‟s leverage. This ratio is
taken to reflect on the capital position of banks and is calculated by dividing capital by risk
weighted assets. Many of the banks are trying to maintain this above the 9 percent as
accepted by the apex bank for Basel II implementation. It is arrived at by dividing the Tier-I
and Tier-II capital by risk weighted assets. The higher the CAR, the stronger is the bank.
11. Tier-I Capital:
ISSN 2277 8675 - DMIETR International Journal on Finance Management
47
It includes equity capital and free reserves. The higher the ratio better is the soundness of the
bank.
12. Tier-II Capital:
It comprises sub ordinate debt of five to ten year tenure. The higher the ratio better is the
soundness of the bank.
13. Debt Equity Ratio:
It is arrived at by dividing the total borrowings and deposits by shareholder‟s net worth,
which includes equity capital and reserves and surpluses. This ratio is calculated to measure
the relative claims of outsiders and the owners against the bank‟s assets.
14. Interest Coverage Ratio:
Net income to debt service ratio or simply debt service is used to test the debt servicing
capacity of a bank. Interest coverage ratio indicates the number of times interest is covered by
the profits available to pay the interest charges. Long term creditors of a bank are interested
in knowing the bank‟s ability to pay interest on their long term borrowings. Generally, higher
the ratio, safer is the long term creditors because even if earnings of the firm fall, the bank
shall be able to meet its commitment of fixed interest charges. But a too high interest
coverage ratio may not be good for the bank because it may imply that firm is not using debt
as a source of finance so as to increase the earning per share.
15. Asset Quality Ratio:
The purpose of measuring the asset quality is to ascertain the component of nonperforming
assets as a percentage of total assets and net advances. In addition, the parameter also
ascertains the NPA movement and the amount locked up in investment as a percentage of the
total assets.
16. Net NPA’s to Net Advances:
Net NPA‟s are Gross NPA‟s net of provisions on NPAs and suspense account. NNPA ratio
has been taken to measure the quality of assets and is calculated by dividing net advances.
Nonperforming Assets (NPA) are represented by Net NPA to Net Advances. Thelevel of net
NPA above one percent needs to be viewed seriously and shall be reined in to sustain the
organizational objectives.
Hypothesis:
From the above objectives of the paper the following hypothesis is formulated to test the
financial efficiency of the merged banks:
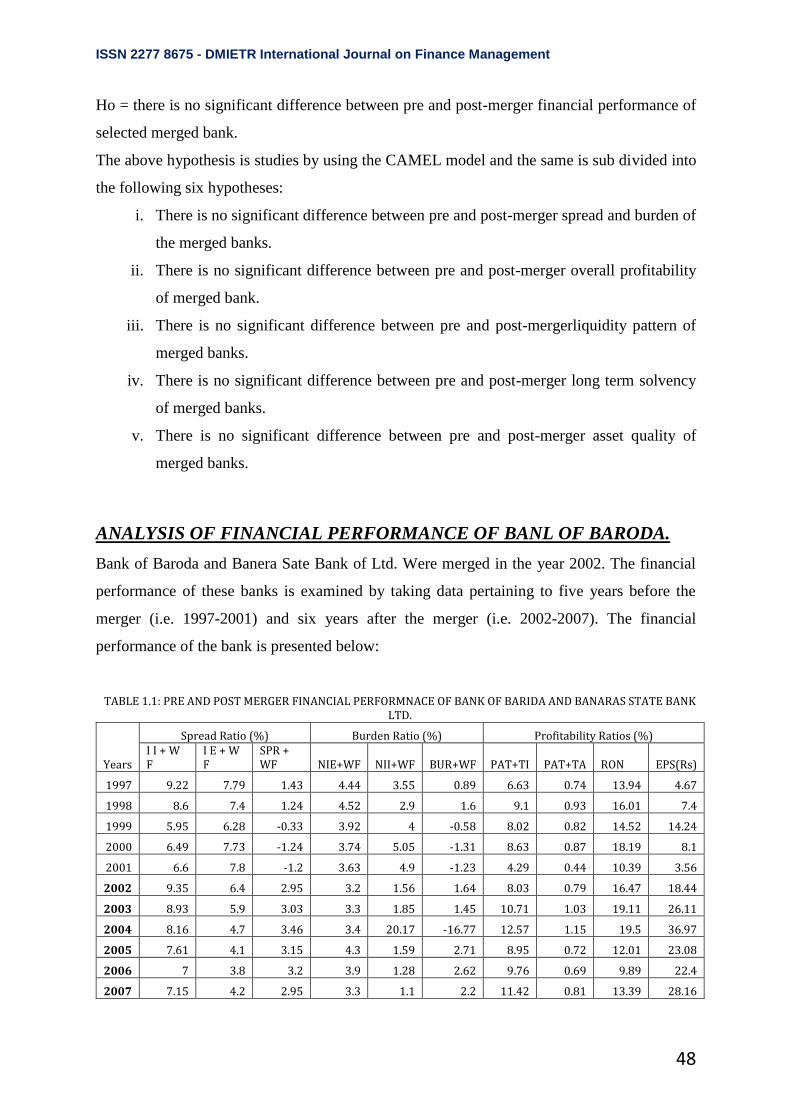
ISSN 2277 8675 - DMIETR International Journal on Finance Management
48
Ho = there is no significant difference between pre and post-merger financial performance of
selected merged bank.
The above hypothesis is studies by using the CAMEL model and the same is sub divided into
the following six hypotheses:
i. There is no significant difference between pre and post-merger spread and burden of
the merged banks.
ii. There is no significant difference between pre and post-merger overall profitability
of merged bank.
iii. There is no significant difference between pre and post-mergerliquidity pattern of
merged banks.
iv. There is no significant difference between pre and post-merger long term solvency
of merged banks.
v. There is no significant difference between pre and post-merger asset quality of
merged banks.
ANALYSIS OF FINANCIAL PERFORMANCE OF BANL OF BARODA.
Bank of Baroda and Banera Sate Bank of Ltd. Were merged in the year 2002. The financial
performance of these banks is examined by taking data pertaining to five years before the
merger (i.e. 1997-2001) and six years after the merger (i.e. 2002-2007). The financial
performance of the bank is presented below:
TABLE 1.1: PRE AND POST MERGER FINANCIAL PERFORMNACE OF BANK OF BARIDA AND BANARAS STATE BANK LTD.
Years
Spread Ratio (%) Burden Ratio (%) Profitability Ratios (%) I I + W F
I E + W F
SPR + WF NIE+WF NII+WF BUR+WF PAT+TI PAT+TA RON EPS(Rs)
1997 9.22 7.79 1.43 4.44 3.55 0.89 6.63 0.74 13.94 4.67
1998 8.6 7.4 1.24 4.52 2.9 1.6 9.1 0.93 16.01 7.4
1999 5.95 6.28 -0.33 3.92 4 -0.58 8.02 0.82 14.52 14.24
2000 6.49 7.73 -1.24 3.74 5.05 -1.31 8.63 0.87 18.19 8.1
2001 6.6 7.8 -1.2 3.63 4.9 -1.23 4.29 0.44 10.39 3.56
2002 9.35 6.4 2.95 3.2 1.56 1.64 8.03 0.79 16.47 18.44
2003 8.93 5.9 3.03 3.3 1.85 1.45 10.71 1.03 19.11 26.11
2004 8.16 4.7 3.46 3.4 20.17 -16.77 12.57 1.15 19.5 36.97
2005 7.61 4.1 3.15 4.3 1.59 2.71 8.95 0.72 12.01 23.08
2006 7 3.8 3.2 3.9 1.28 2.62 9.76 0.69 9.89 22.4
2007 7.15 4.2 2.95 3.3 1.1 2.2 11.42 0.81 13.39 28.16

ISSN 2277 8675 - DMIETR International Journal on Finance Management
49
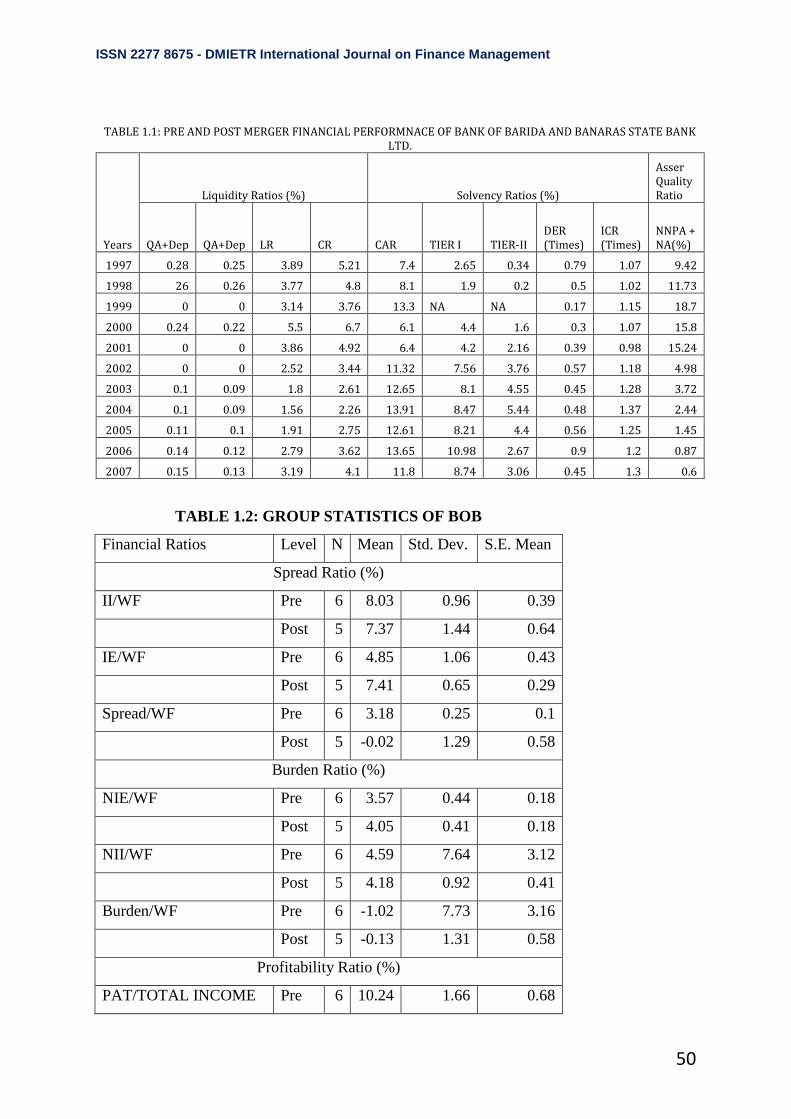
ISSN 2277 8675 - DMIETR International Journal on Finance Management
50
TABLE 1.1: PRE AND POST MERGER FINANCIAL PERFORMNACE OF BANK OF BARIDA AND BANARAS STATE BANK LTD.
Years
Liquidity Ratios (%) Solvency Ratios (%)
Asser Quality Ratio
QA+Dep QA+Dep LR CR CAR TIER I TIER-II DER (Times)
ICR (Times)
NNPA + NA(%)
1997 0.28 0.25 3.89 5.21 7.4 2.65 0.34 0.79 1.07 9.42
1998 26 0.26 3.77 4.8 8.1 1.9 0.2 0.5 1.02 11.73
1999 0 0 3.14 3.76 13.3 NA NA 0.17 1.15 18.7
2000 0.24 0.22 5.5 6.7 6.1 4.4 1.6 0.3 1.07 15.8
2001 0 0 3.86 4.92 6.4 4.2 2.16 0.39 0.98 15.24
2002 0 0 2.52 3.44 11.32 7.56 3.76 0.57 1.18 4.98
2003 0.1 0.09 1.8 2.61 12.65 8.1 4.55 0.45 1.28 3.72
2004 0.1 0.09 1.56 2.26 13.91 8.47 5.44 0.48 1.37 2.44
2005 0.11 0.1 1.91 2.75 12.61 8.21 4.4 0.56 1.25 1.45
2006 0.14 0.12 2.79 3.62 13.65 10.98 2.67 0.9 1.2 0.87
2007 0.15 0.13 3.19 4.1 11.8 8.74 3.06 0.45 1.3 0.6
TABLE 1.2: GROUP STATISTICS OF BOB
Financial Ratios Level N Mean Std. Dev. S.E. Mean
Spread Ratio (%)
II/WF Pre 6 8.03 0.96 0.39
Post 5 7.37 1.44 0.64
IE/WF Pre 6 4.85 1.06 0.43
Post 5 7.41 0.65 0.29
Spread/WF Pre 6 3.18 0.25 0.1
Post 5 -0.02 1.29 0.58
Burden Ratio (%)
NIE/WF Pre 6 3.57 0.44 0.18
Post 5 4.05 0.41 0.18
NII/WF Pre 6 4.59 7.64 3.12
Post 5 4.18 0.92 0.41
Burden/WF Pre 6 -1.02 7.73 3.16
Post 5 -0.13 1.31 0.58
Profitability Ratio (%)
PAT/TOTAL INCOME Pre 6 10.24 1.66 0.68

ISSN 2277 8675 - DMIETR International Journal on Finance Management
51
Post 5 7.33 1.94 0.87
PAT/TA Pre 6 0.86 0.18 0.08
Post 5 0.76 0.19 0.09
RON Pre 6 15.06 3.92 1.6
Post 5 14.61 2.88 1.29
EPS Pre 6 25.86 6.38 2.6
Post 5 7.59 4.16 1.86
Liquidity Ratio (Times)
QA/DEPOSITS Pre 6 0.1 0.05 0.02
Post 5 0.16 0.14 0.06
QA/TA Pre 6 0.09 0.05 0.02
Post 5 0.14 0.13 0.06
LR Pre 6 2.29 0.64 0.56
Post 5 4.03 0.88 0.39
CR Pre 6 3.13 0.7 0.29
Post 5 5.07 1.06 0.47
Solvency Ratio
CAR (%) Pre 6 12.66 1.01 0.41
Post 5 8.26 2.93 1.31
TIER I (%) Pre 6 8.68 1.2 0.49
Post 5 3.29 1.21 0.61
TIER II (%) Pre 6 3.98 1.2 0.42
Post 5 1.08 0.96 0.48
DEBT/EQUITY RATIO
(TIMES) Pre 6 0.57 0.17 0.07
Post 5 0.43 0.23 0.1
INETERST
COVERAGE (TIMES) Pre 6 1.26 0.07 0.03
Post 5 1.06 0.06 0.03
Asset Quality Ratio (%)
NNPA/NA Pre 6 2.34 1.72 0.7
Post 5 14.18 3.64 1.63
Source: Compiled from Table 1.1.
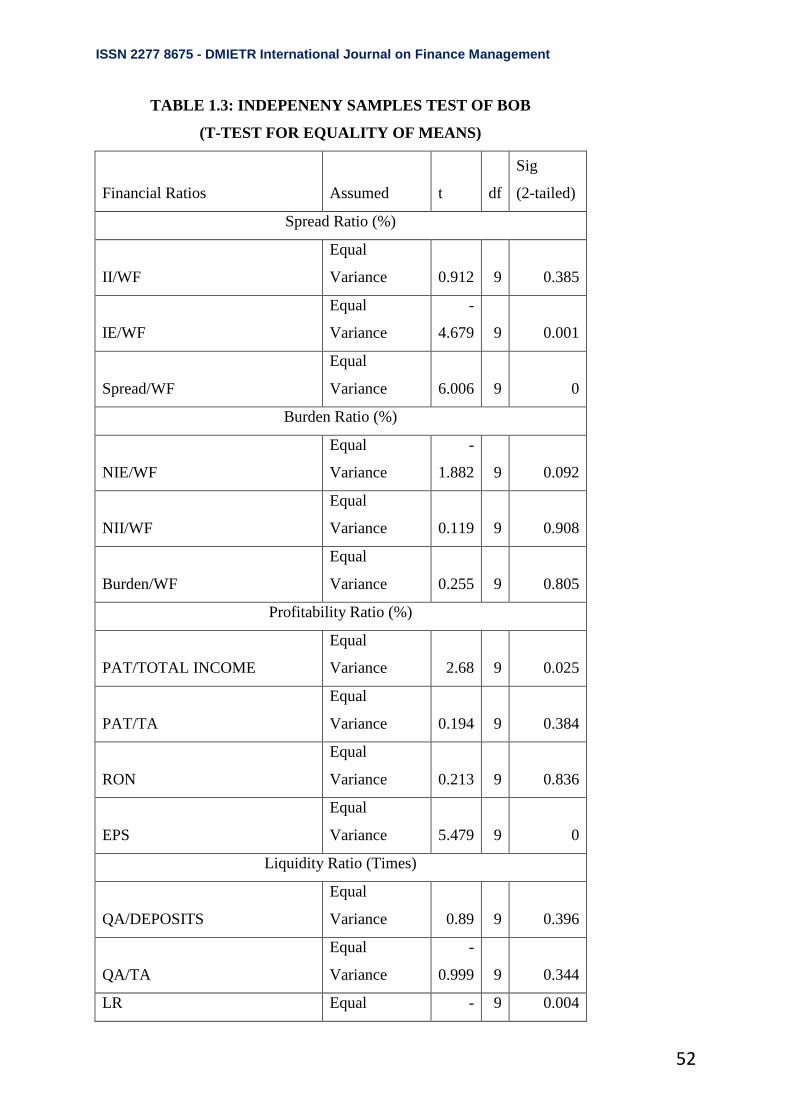
ISSN 2277 8675 - DMIETR International Journal on Finance Management
52
TABLE 1.3: INDEPENENY SAMPLES TEST OF BOB
(T-TEST FOR EQUALITY OF MEANS)
Financial Ratios Assumed t df
Sig
(2-tailed)
Spread Ratio (%)
II/WF
Equal
Variance 0.912 9 0.385
IE/WF
Equal
Variance
-
4.679 9 0.001
Spread/WF
Equal
Variance 6.006 9 0
Burden Ratio (%)
NIE/WF
Equal
Variance
-
1.882 9 0.092
NII/WF
Equal
Variance 0.119 9 0.908
Burden/WF
Equal
Variance 0.255 9 0.805
Profitability Ratio (%)
PAT/TOTAL INCOME
Equal
Variance 2.68 9 0.025
PAT/TA
Equal
Variance 0.194 9 0.384
RON
Equal
Variance 0.213 9 0.836
EPS
Equal
Variance 5.479 9 0
Liquidity Ratio (Times)
QA/DEPOSITS
Equal
Variance 0.89 9 0.396
QA/TA
Equal
Variance
-
0.999 9 0.344
LR Equal - 9 0.004

ISSN 2277 8675 - DMIETR International Journal on Finance Management
53
Variance 3.808
CR
Equal
Variance
-
3.663 9 0.005
Solvency Ratio
CAR (%)
Equal
Variance
-
1.464 9 0.177
TIER I (%)
Equal
Variance 1.98 9 0.083
TIER II (%)
Equal
Variance 2.006 9 0.08
DEBT/EQUITY RATIO
(TIMES)
Equal
Variance
-
1.079 9 0.309
INETERST COVERAGE
(TIMES)
Equal
Variance
-
3.634 9 0.005
Asset Quality Ratio (%)
NNPA/NA
Equal
Variance
-
8.559 9 0
Source: Compiled from Table 1.1.
Spread:
The bank should keep their interest low on deposits and high on advances for greater spread.
The spread would determine the earning capacity of the bank. As per Table 1.2 pre and post
average spread to working fund ratio of BOB and Banaras State Bank Ltd are -0.02% and
3.18% respectively. The relation between interest income to working fund of bank during pre
and post-merger average are 7.37% and 8.03% (Table 1.2) respectively and the average ration
interest expenses and working fund during pre and post-merger are 7.41% and 4.85% (Table
1.2) respectively. There is an increase in interest income t working fund and decrease in
interest expenses to working fund results to increase the spread of the bank. This is also
proved by the t-test at 5% level significance that the spread of the bank is increased after the
merger.
Burden:
It is the difference between noninterest expenses and non-interest income of the bank. Profit
of the bank is the difference between spread and burden. If the burden is more, it‟s adversely
affects profit and vice versa. Pre and post-merger average burden of BOB and BSL ratio is

ISSN 2277 8675 - DMIETR International Journal on Finance Management
54
that -0.126% and -1.025% (Table 1.2) respectively. The pre and post-merger relationship
between noninterest expenses and working fund is 4.05% and 3.6 % respectively and non-
interest income to working fund is recorded at 4.2% and 4.6% (Table 1.2) respectively. The
burden of the bank is decreased as per the above figure but the same is not proved by the t-
test. So we can conclude that the average decrease in burden to the bank has not helped to
satisfy the test.
Profitability:
The ratio measures the operational efficiency of the bank. Employing more resources and
making effective utilization of resources can increase the absolute profits. The pre and post-
merger mean relationship between profits after tax by total income is recorded at 7.33% and
10.24% respectively. The relationship between profits after tax by total assets indicated at
0.76 and 0.86% respectively for pre and post-merger period. The return on net worth of the
bank at pre-merger is 14.61% and post-merger is 15.06% (Table 1.2). The EPS of the bank is
increased from Rs. 7.59 to Rs. 25.86 (Table 1.2) from the pre to post merger. The overall
profitability of the bank has increased after the merger and the same is proved by t-test in
case of profit after tax by total income and earnings per share.
Liquidity:
It refers to the maintenance of cash, bank balance and those assets which are easily converted
into cash in order to meet the liabilities as and when arising. The pre and post-merger
relationship between quick assets and total deposits is recorded at 0.16 and 0.10 times (Table
1.2) respectively. The relation between quick assets and total depositsis 0.14 and 0.09 times
before and after merger of the bank. The quick ratio of the bank is 4.03 and 2.29 times (Table
1.2) at pre and post-merger period. The current ratio of the bank stood at 5.08 and 3.13 times
(Table 1.2) at pre and post-merger period. With the help of these figures, we can say that the
liquidity of the bank has decreased during the post-merger period and the t-test also has
proved in the case of quick and current ratios. As a matter of bank‟s policy the liquidity is
reduced so that it is not having any impact on the efficiency of the bank.
Solvency:
Solvency refers to the ability of a bank to meet its long term obligations. The pre and post-
merger relationship between capital adequacy, tier I, Tier II, debt equity and interest coverage
ratios are recorded at 8.26%, 3.29% 1.08%, 0.3 times, 1.06 times and 12.66%, 8.68%, 3.98%,
0.57 times, 1.26times (Table 1.2) respectively. The overall long term repaying capacity of the
ISSN 2277 8675 - DMIETR International Journal on Finance Management
55
bank is improved after the merger and the same is proved by the t-test at 5% level of
significance in the case of interest coverage ratio.
Asset Quality:
The objective of measuring the asset quality is to ascertain the component of net non-
performing assets as a percentage of the net advances. The pre and post-merger net non-
performing assets to net advances are recorded at 14.18 and 2.34% (Table 1.2) respectively
and the same is proved by the t-statistics. Hence, we conclude that the non-performing assets
of the bank are reduced tremendously and it has a right plan to reduce the non-performing
assets.
From the above analysis we can draw the following inferences:
1. The average spread of the bank is increased with 160 times after the merger and the
mean burden of the bank was decreased with 7.13 times after the merger. Hence, the
first hypotheses isproved that the spread is increased and burden is decreased.
2. The overall profitability of the bank is higher at 3.08% after the merger. So we can
say that the confidence of the stakeholders is increased after the merger are the
second hypotheses is proved.
3. The liquidity ability of the bank is reduced with 0.44 times after the merger. As a
policy matter the liquidity of the bank is reduced. Therefore, the third hypothesis
that the liquidity of the bank is different after the merger is proved.
4. The capital adequacy of the bank after the merger period is increased with 53.25%.
The long term paying capacity of the bank was increased more than 50% after the
merger. So that the fourth hypothesis is proved.
5. The non-performing asset quality of the bank is decreased from 14.18 to 2.34%
(Table1.2). The bank has strategically reduced the non-performing assets and thus the
fifth hypothesis that the merged bank asset quality has improved is also proved.
6. The overall financial performance of the bank is strong after the merger and this is
also supported by the t-test (Table1.3). The set of five hypotheses are proved by the
Bank of Baroda and finally we can say that the profitability, asset quality,
manageability, liquidity and solvency of the bank have improved after the
merger and the shareholders are benefited by this merger.

ISSN 2277 8675 - DMIETR International Journal on Finance Management
56
FINDINGS
There is no effect of merger and acquisition on return on total assets, return on capital
employed, return on investment and return on shareholders‟ fund of Bank of Baroda. There is
significant effect of merger and acquisition on net profit and shareholders‟ equity to total
assets of sampled banks.
LIMITATIONS
The study is based on secondary data collected from several websites. The limitations of
secondary data, if any, will also influence study. The researcher has also modified some of
the formula used in the study. The arbitrariness, if any, in the modification of the formula will
also influence the study.
REFERENCE:
1. Gupta Sumeet & Verma Renu, “Comparative Analysis of Financial Performance of Private
Sector Banks in India: Application of CAMEL Model”, Journal of Global Economy, Vol. 4,
No.2, April-June, 2008, pp. 144-159.
2. Jain Paras Mal, “Consolidation in Banking Sector Through Mergers and Acquisitions”,
“Banking Reforms and Globalisation”, ed. by Mohan Prasad Shrivastava, Pradeep Kumar
Pandey, V.P. Vidyarthi, APH Publishing Corporation, New Delhi, 2007, pp. 93-105.
3. Joshua Okpanachi, “Comparative Analysis of the Impact of Mergers and Acquisitions on
Financial Efficiency of Banks in Nigeria”, Journal of Accounting and Taxation, Vol. 3(1), pp.
1-7, May, 2011.
4. Kaur Pardeep & Kaur Gian, “Impact of Mergers on the Cost Efficiency of Indian
Commercial Banks”, Eurasian Journal of Business and Economics, 3(5), 2010, pp. 27-50.
5. Prajapati Sadhana, “Mergers & Acquisitions in the Indian Banking system- An Overview”,
International Referred Research Journal, ISSN-0974, 2832, Vol. II, Issue. 19, August 2010.
6. Rai Rohan, “Corporate Excellence through Mergers and Acquisitions: A study of ICICI
Bank- Bank of Madura Merger”, Asian Journal of Technology and Management Research,
Vol. 01- Issue. Jan-June 2011.
7. Sultan Singh, “Banking Sector Reforms in India”, Kanishka Publishers, New Delhi,
pp.131-144, 2007.
8. Tiwari Amdhesh Kr, “Mergers and Acquisitions in Indian Banking Industry- A Case
Study”, APJRBM, Vol.2, Issue 2, February, 2011.
9. Annual Reports of Bank of Baroda, Various Issues.