Embed Size (px)
Citation preview
Journal of Theoretical and Applied Information Technology10th September 2015. Vol.79. No.1
© 2005 - 2015 JATIT & LLS. All rights reserved.
ISSN: 1992-8645 www.jatit.org E-ISSN: 1817-3195
38
MEL FREQUENCY CEPSTRAL COEFFICIENTS (MFCC)FEATURE EXTRACTION ENHANCEMENT IN THE
APPLICATION OF SPEECH RECOGNITION:A COMPARISON STUDY
1SAYF A. MAJEED, 2HAFIZAH HUSAIN, 3SALINA ABDUL SAMAD, 4TARIQ F. IDBEAA1,2,3,4 Digital Signal Processing Lab, Department of Electrical, Electronic and System Engineering,
Universiti Kebangsaan Malaysia, 43600 UKM, Bangi, Selangor, Malaysia
E-mail: [email protected], [email protected], [email protected], [email protected]
ABSTRACT
Mel Frequency Cepstral Coefficients (MFCCs) are the most widely used features in the majority of thespeaker and speech recognition applications. Since 1980s, remarkable efforts have been undertaken for thedevelopment of these features. Issues such as use suitable spectral estimation methods, design of effectivefilter banks, and the number of chosen features all play an important role in the performance and robustnessof the speech recognition systems. This paper provides an overview of MFCC's enhancement techniquesthat are applied in speech recognition systems. The details such as accuracy, types of environments, thenature of data, and the number of features are investigated and summarized in the table combined with thecorresponding key references. Benefits and drawbacks of these MFCC's enhancement techniques have beendiscussed. This study will hopefully contribute to raising initiatives towards the enhancement of MFCC interms of robustness features, high accuracy, and less complexity.
Keywords: Mel Frequency Cepstral Coefficients (MFCC); Feature Extraction; Speech Recognition.
1. INTRODUCTION
Speech is probably the most crucial tool forcommunication in our daily lives. Thereforeconstructing a speech recognition system isdesirable at all times. Basically, speech recognitionis the process of converting an acoustic signal to aset of words. The recognized words can be the finalresults, as for applications such as commands andcontrol, data entry, and document preparation. Theycan also serve as the input to further linguisticprocessing in order to achieve speechunderstanding. Many parameters have an impact onthe accuracy of speech recognition system such asspeaker dependency, vocabulary size, recognitiontime, type of speech (continuous, isolated) andrecognition environment condition. A speechrecognition systems involve several procedures inwhich signal modeling or what is known as featureextraction and classification (pattern matching) aretypically important. Feature extraction refers toprocedure of transforming the speech signal into anumber of parameters, while pattern matching is atask of obtaining parameter sets from memorywhich closely matches the parameter set extracted
from the input speech signal. In simple words, theessence a speech recognizer is to provide apowerful and accurate mechanism to transcribespeech into text [1].
Feature extraction is a crucial step of the speechrecognition process. The best presented algorithmin feature extraction is Mel Frequency CepstralCoefficients (MFCC) introduced in [2], and theperceptual linear predictive (PLP) featureintroduced in [3]. Between them MFCC featuresare, the more commonly used, most popular, androbust technique for feature extraction in currentlyavailable speech recognition systems especially inclean speech or clean environment [2]. On the otherhand the overall performance of MFCC features isnot a superior in noisy environment. In real worldapplications the performance of MFCC degradesrapidly because of the noise [4], for this reason theresearchers devoted themselves to find the solutionsto overcome the weaknesses of MFCC in noisyspeech. Since 1980, notable efforts have beencarried out to enhance MFCC feature in noisyenvironments.

Journal of Theoretical and Applied Information Technology10th September 2015. Vol.79. No.1
© 2005 - 2015 JATIT & LLS. All rights reserved.
ISSN: 1992-8645 www.jatit.org E-ISSN: 1817-3195
39
The intention of this review is to examine andclassify the most significant enhanced approachesin MFCC algorithm applied to speech recognition,which will offer a beneficial knowledge on thechallenges and issues that have been confronted andtheir solutions. The rest of this paper is organizedas follows: section 2 describes the conventionalMFCC feature extraction algorithm. Section 3discusses the enhancement techniques for theMFCC algorithm. Section 4 discusses theenhancement techniques of MFCC, and theconclusion is summarized in section 5.
2. MEL FREQUENCY CEPSTRALCOEFFICIENTS (MFCC) FEATUREEXTRACTION
The first stage of speech recognition is tocompress a speech signal into streams of acousticfeature vectors, referred to as speech featurevectors. The extracted vectors are assumed to havesufficient information and to be compact enoughfor efficient recognition [5]. The concept of featureextraction is actually divided into two parts: first istransforming the speech signal into feature vectors;secondly is to choose the useful features which areinsensitive to changes of environmental conditionsand speech variation [6]. However, changes ofenvironmental conditions and speech variations arecrucial in speech recognition systems whereaccuracy has degraded massively in the case oftheir existence. As examples of changes ofenvironmental condition: changes in thetransmission channel, changes in properties of themicrophone, cocktail effects, and the backgroundnoise, etc. Some examples of speech variationsinclude accent differences, and male-female vocaltract difference. For developing robust speechrecognition, speech features are required to beinsensitive to those changes and variations. Themost commonly used speech feature is definitelythe Mel Frequency Cepstral Coefficients (MFCC)features, which is the most popular, and robust dueto its accurate estimate of the speech parametersand efficient computational model of speech [7].Moreover, MFCC feature vectors are usually a 39dimensional vector, composing of 13 standardfeatures, and their first and second derivatives. Theprocedure of this MFCC feature extraction isexplained and summarized as follows in Figure 1[6].
Figure 1: The standard procedures of MFCC featureextraction [6]
Pre-emphasis: In this step, the signal spectrumsare pre-emphasized, and the DC offset is removed,a low order digital system (generally a first orderFIR filter) is applied to the digitized speech signalx(n) to spectrally flatten the signal in order to makeit less susceptible to find precision effects later inthe signal processing [7, 8].( ) = 1 − 0.9 < < 1 (1)
The most typical value of a is about 0.95 [7].However, the signal spectrum is boostedapproximately 20 dB/decade by pre-emphasis filter[6-8].
Framing The speech signal is normally dividedinto small duration blocks, called frames, and thespectral analysis is carried out on these frames. Thisis due to the fact that the human speech signal isslowly time varying and can be treated as a quasi-stationary process. The very popular frame lengthand frame shift for the speech recognition task are20-30 ms and 10 ms respectively [8].
Windowing After framing, each frame ismultiplied by a window function prior to reduce theeffect of discontinuity introduced by the framingprocess by attenuating the values of the samples atthe beginning and end of each frame. TheHamming window is commonly used, it decreasesthe frequency resolution of the spectral analysiswhile reducing the sidelobe level of the windowtransfer function [6, 9]( ) = ( ) ( ) (2)
Hamming window is used for speech recognitiontask as:( ) = 0.54 − 0.46cos( ) (3)
Spectral estimation spectral estimation iscomputed for each frame by applying DiscreteFourier Transform (DFT) to produce spectralcoefficients. These coefficients are complexnumbers comprising the two magnitude and phase

Journal of Theoretical and Applied Information Technology10th September 2015. Vol.79. No.1
© 2005 - 2015 JATIT & LLS. All rights reserved.
ISSN: 1992-8645 www.jatit.org E-ISSN: 1817-3195
40
information. Phase information is usually removedand only the magnitude of the spectral coefficientsare extracted. Additionally, it is common to utilizethe power of the spectral coefficients [6, 8]. DFTcan be defined as:
( ) = ∑ ( ) 0≤ , ≥ − 1 (4)
Where ( ) are the spectral coefficients, and( ) the framed speech signal
Mel filtering A group of triangle band pass filtersthat simulate the characteristics of the human's earare applied to the spectrum of the speech signal.This process is called Mel filtering [10]. The humanears analyze the sound spectrum in groups based ona number of overlapped critical bands. These bandsare distributed in a manner that the frequencyresolution is high in the low frequency region andlow in the high frequency region as illustrated inFigure 2 [6].
Figure 2: The Mel-scale filter bank [6]
The Mel frequency is computed from the linearfrequency as:= 2525 × log(1 + ) (5)
Where is the Mel frequency for the linearfrequency f. The filter bank energy is obtained afterMel filtering.= ∑ | ( )| . ( ) (6)
Where | ( )| is the amplitude spectrum, is thefrequency index, are the ith Mel band pass filter,1 ≤ ≤ , and is number of Mel-scaledtriangular band-pass filters. is the filter bankenergy.
Natural logarithm The natural logarithmapproximates the relationship between the human'sperception of the loudness and the sound intensity[11]. Furthermore, the natural logarithm converts
the multiplication relationship between parametersinto addition relationship [12]. The convolutionaldistortions, like the filtering effect of microphoneand channel, plus the multiplication in thefrequency domain, like the amplification of softsound, become simple addition after the logarithm[6].
Discrete cosine transform The cepstralcoefficients are obtained after applying the DCT onthe log Mel filterbank coefficients [13]. The higherorder coefficients represent the excitationinformation, or the periodicity in the waveform,while the lower order cepstral coefficients representthe vocal tract shape or smooth spectral shape [14,15]. DCT can be defined as:= ∑ log( ) . ( )
(7)
In speech recognition systems, only the lowerorder coefficients (order<20) are being used, thus adimension reduction is achieved. Anotheradvantage of DCT is that the created cepstralcoefficients are less correlated compared to log Melfilterbank coefficients [6].
Log energy calculation The energy of the speechframe is additionally computed from the time-domain signal of a frame as a feature along with thenormal MFCC features. In some cases, it isreplaced by C0, the 0th component of the MFCCfeature, which is the sum of the log Mel filterbankcoefficients [6].
Derivatives and accelerations calculation Thetime derivatives (the first delta) and accelerations(second delta) are used to restore the trendinformation of the speech signals that have beenlost in the frame-by-frame analysis. The derivativeof coefficient x(n) can be calculated as [14]̇ ( ) ≡ ( ) ≈ ∑ ( + ) (8)
Where 2M + 1 is the number of frames regardedin the evaluation. To produce the second orderderivative, the same formula can be applied to thefirst order derivative. The final feature vectors areformed simply by adding the derived features to theoriginal cepstral features.
3. MFCC ENHANCEMENT APPROACHES
Robustness is a major concern for speechrecognition systems, especially when they are
0 0.5 1 1.5 2 2.5 3 3.5 40
0.1
0.2
0.3
0.4
0.5
0.6
0.7
0.8
0.9
1
Frequency (kHz)
Mel Filter Bank

Journal of Theoretical and Applied Information Technology10th September 2015. Vol.79. No.1
© 2005 - 2015 JATIT & LLS. All rights reserved.
ISSN: 1992-8645 www.jatit.org E-ISSN: 1817-3195
41
deployed or embedded in real world applicationsthat are surrounded by ambient noises ordegradation factors. The authors explore severalapproaches that have been proposed to amelioratethe performance of speech recognizers in noisyenvironments.
3.1 Spectral Estimation EnhancementAs mentioned earlier in section 2, MFCC used
DFT as a spectral estimation method. In thissection, we will reviewed the most powerfulapproaches used to enhance the spectral estimation.
3.1.1 group delay function (GDF)This method based on the Fourier transform phaseof a signal, instead of the conventional Fouriertransform magnitude for speech recognition [16].Where, it has been shown recently how the phasespectrum is informative [17, 18], leading to derivesignificant features from the phase spectrum of thesignal. The group delay function is generallyprocessed to obtain significant information likepeaks in the spectral envelope. Given a discrete-time real signal x(n), Fourier transform is given by( ) = | ( )| ( ) (9)
The Group delay function is then defined as( ) = − ( )(10)
Where ( ) is the GDF and can be computedfrom the speech signal directly:( ) = ( ) ( ) ( ) ( )| ( )| (11)
Where R, and I denoted the real and imaginarypart, ( ), and ( ) are the Fourier transform ofnoisy ( ) and clean ( ) speech respectively.
Murthy and Gadde [16] have modified the groupdelay function (MGDF) to reduce the effect ofzeros by replacing the power spectrum |X(w)| inthe denominator with the cepstrally smoothedpower spectrum (S(w)) using lower order cepstralwindow that capture the dynamic range of |X(w)|.This gives the MGDF as:̃ ( ) = ( ) ( ) ( ) ( )( ( )) (12)
However, there are limitations on representationof the speech signal, when the features derived
from either the power spectrum or the phasespectrum.
In 2004, [18] extracted the MFCC coefficientsfrom the product spectrum which merge the powerspectrum and the phase spectrum. Thesecoefficients are called Mel-frequency productspectrum cepstral coefficients (MFPSCCs). In theirwork a comparison has also carried out with theconventional MFCC and MFMGDCCs which basedon Mel-frequency modified group delay cepstralcoefficients. Results indicated that the MFPSCCsoffered the best performance. The product spectrumQ(w) is the product of the power spectrum and theGDF as follows:( ) = | ( )| ( ) = ( ) ( ) +( ) ( ) (13)
3.1.2 autocorrelation processingThe first use of the autocorrelation domain withMFCC was in [18], while the extracted featurescalled autocorrelation Mel frequency cepstralcoefficient (AMFCC). Furthermore, autocorrelationdomain has two important properties: Polepreserving property, the poles of the autocorrelationsequence is going to be just like the poles of theoriginal signal [19]. This implies the featuresextracted from the autocorrelation sequence couldsubstitute the features extracted from the originalspeech signal. The second property is noiseseparation, the speech signal information isdistributed over all the lags in the autocorrelationfunction, while the noise signal is limited to lowerlags in the autocorrelation function. Consequently,providing an effective way to eliminate the noise byremoving lower-lag autocorrelation coefficients.Figure 3 illustrated the method of the AMFCC,while the autocorrelation for each frame iscalculated using equation (14) [20, 21].
Figure 3: AMFCC block diagram( ) = ∑ ( ) ( + 1),i = 0,1,...., N-1 (14)
Where i is the lag index in the Autocorrelationsequence
According to [21], all the lower lag up to 3 mstogether with the zero-lag autocorrelationcoefficient are removed from the analyzed

Journal of Theoretical and Applied Information Technology10th September 2015. Vol.79. No.1
© 2005 - 2015 JATIT & LLS. All rights reserved.
ISSN: 1992-8645 www.jatit.org E-ISSN: 1817-3195
42
sequence. Then a Kaiser window which has a 80dB side lobe attenuation is applied on the one-sidedhigher-lag autocorrelation sequence. Next thewindowed autocorrelation sequence is processed byFourier transform to get the power spectralestimation of the signal. This spectrum will be usedto get the 13 AMFCCs. The dynamic range of theresulting spectrum estimate is the same order as thepower spectrum of the original speech signal.
The final AMFCC features set (39 features) areobtained by concatenating the delta and doubledelta to the base features set, Experiment results byShannon and Paliwal showed that these featureswere more robust to background noise thanconventional MFCC [20].
The disadvantage of this method is using theKaiser window which is computationally morecostly compared to the Hamming window. Shannonand Paliwal [20], proposed a design method forcomputing a window function that contains twicethe dynamic range of the Hamming windowfunction used on the time domain signal, theycalled this window function double dynamic range(DDR) Hamming window and its dynamic rangewas about 86 dB. Their experiments proved that(DDR) Hamming window works just like theKaiser window function in terms of its spectralestimation performance. Furthermore, theperformance of AMFCC features was much betterthan MFCC features for noisy environment [20].
The AMFCC was one of the methods that workin the magnitude domain. On the other hand, thephase domain (angle) has received more attentionby the researchers [22, 23]. Mainly because phase(angle) is less sensitive to the external noise thanthe magnitude. However, phase autocorrelation(PAC) is an example of the phase domain.
The measure of correlation in phaseautocorrelation used the angle between the signalvectors rather than the dot product. Therefore thefeatures expectation will be more robust to noisewhen compared with the conventional features,which are based on the normal autocorrelation [22].
The phase differences between various sinusoidalcomponents in the speech signal were removed inEquation (14) which is computed as a dot product.However, if two vectors defined as:= { ̃ [0], ̃ [1], … , ̃ [ − 1]}= { ̃ [ ], … , ̃ [ − 1], ̃ [0], … , ̃ [ − 1]} (15)
[ ] = (16)
The magnitude of the two vectors and isthe same, since the set of individual vectorcomponents of these two vectors is the same. If ‖ ‖represents the magnitude of the vectors and theangle between them in the N dimensional space,then Eq. (16) can be rewritten as:[ ] = ‖ ‖ cos( ) (17)
The new set of correlation coefficients [ ] arecreated by using the angle θ as the measure ofcorrelation, instead of the dot product. Thesecoefficients [ ] are computed as:[ ] = = cos [ ]‖ ‖ (18)
From the above mentioned equations, PACcoefficients [ ] depend only on which isexpected to be less susceptible to the external noise,as compared to [ ].
This method was applied to MFCC in [22], theproposed features are known as PAC MFCC whichshowed superior to conventional MFCC in noisyspeech, while in the clean speech the conventionalMFCC showed superiority.
The two main reasons of this issue are firstly theframe energy information has been discarded,which supposedly was to be crucial for the cleanspeech. Secondly, the inverse cosine operation wasfurther degraded the clean speech due to thesmoothing of the spectral valley.
3.1.3 minimum variance distortionless response(MVDR)
The Minimum Variance Distortionless Response(MVDR) spectrum is also referred to as minimumvariance (MV) spectrum, the Capon method, andthe maximum likelihood method (MLM). Thismethod provides all-pole spectra that are robust formodeling both voiced and unvoiced speech.However, the high order MVDR spectrum modelsvoiced speech spectra effectively, especially at theperceptually important harmonics, and features asmooth contoured envelope [24]. The powerspectrum that has been obtained by DFT relies onthe bandpass filter, which its nature is frequencyand data independent, and determined only by thenature and length of the window used. The windowlength is usually equal to the data segment length.

Journal of Theoretical and Applied Information Technology10th September 2015. Vol.79. No.1
© 2005 - 2015 JATIT & LLS. All rights reserved.
ISSN: 1992-8645 www.jatit.org E-ISSN: 1817-3195
43
In contrast, in the MVDR method the powermeasuring filters determined by the distortionlessfilters are data dependent and frequency dependent.Consequently, the MVDR spectrum has been foundto have higher frequency resolution than the DFTbased methods [25, 26].
Utilization of MVDR in MFCC is reported in[25] where it has used as spectrum estimationtechniques. Figure 4 shows a schematic diagram ofthe MVDR-based MFCC. Regardless, the problemwith this method was the high computation of high-
order MVDR as well as cepstral averaging.
Figure 4: Schematic diagram of the MVDR-based MFCC
Another study [26] has utilized the regularizedminimum variance distortionless response(RMVDR). This method penalizes the rapidchanges in all-pole spectral envelope andconsequently, produces a smooth spectral estimatekeeping the formant positions unaffected.Experimental results showed that the RMVDR gavesignificant improvement in word accuracy over theMVDR-based MFCC and conventional MFCCmethods.
3.2 Enhancement of Mel Filter BanksThe functions of filter banks had been mentioned
in section 2, However, many methods have beenproposed at this stage to improve the robustness ofthe features in MFCC. Some researchers tried tooptimize the shape of each filter in the filter-bank,while the others tried to manipulate with thenumber of filters. The most important and powerfultechniques have been highlighted and discussed.
3.2.1 shape of the filterIn order to achieve more discriminativerepresentation of speech features, a series of workof filter-bank design has been introduced in [27]. Inthis study, positions, bandwidths, and shapes of thefilters in the filter-bank can all be adjusted andoptimized based on the criterion of MinimumClassification Error (MCE). Although this may betrue, the MCE training needs high computationcomplexity with many different parameters to bedetermined altogether for a certain task. As anexample, the overall filter-bank is required to be re-trained when the back-end classifier structure is
relatively adjusted for an alternative task withdifferent speech corpus.
However, [28] applied the principal componentanalysis (PCA) on the Mel filter-bank to drive theshape of each filter. Based on PCA, the shapes offilters are totally different from one another as wellas not necessarily triangular. Let the kth filtercoefficients are the components of the columnvector w , where= [ (1) (2) … ( )] (19)
Then, the PCA optimized kth filter coefficientsrepresented by the column vector , which isdefined as:
, = max Σ (20)
The largest variance of the kth filter output= , can be obtained when = , .Furthermore, , is generally proved to be theeigenvector of the covariance matrix Σ , of ,corresponding to the largest eigenvalue. Thismethod is easy to achieve for a given task andcorpus. However, experiments indicated that theextracted features with PCA-optimized filter-bankare better performance in noisy environment andcomparable performance for clean speech incomparison with the conventional MFCC features[28]. It's because the PCA-optimized filter-bankmaximizes both the signal to noise variance as wellas the variation of the features.
Nonetheless, this method has a major drawbackas several filter coefficients might be negativebecause those coefficients are the components of aneigenvector of a covariance matrix, which meansthis may result in the filter output , =, be negative, thus fails to be converted intothe log-spectral domain. This issue was solved by[29], who has modified the PCA under constraintsfor optimizing the filter. The PCA was modified asfollows:
, = max ( ), ( ) =( ) = Σ (21)
under two constraints,( ) ≥ 0, 1 ≤ ≤ and ∑ ( ) = 1In the first constraint, , which refer to
the modified PCA is not necessarily the eigenvectorof the covariance matrix Σ that corresponds to the

Journal of Theoretical and Applied Information Technology10th September 2015. Vol.79. No.1
© 2005 - 2015 JATIT & LLS. All rights reserved.
ISSN: 1992-8645 www.jatit.org E-ISSN: 1817-3195
44
largest eigenvalue. While constraint two is similarto the condition of an eigenvector.
3.2.2 number of filtersOnly a few works are examined and compared theeffect of the number of filters and enumeratedparameters to the speech recognition accuracy. [30]examined a lot of experiments to verify theoptimum number of coefficients enumerated in theMFCC that provide the best accuracy. Literally,these experiments were conducted either by anincreasing of filters' number for a fixed number ofcoefficients or opposite, by increasing the numberof coefficients for a fixed number of filters (bands).The bank of filters was increased from 4 to 26filters while the number of coefficients wasenumerated from 4×3=12 to 26×3=78, includingthe static MFCC, delta, and double delta. Theirresults showed that the best accuracy oscillatesbetween 82 and 83.5%. However, with 9 filters and7×3=21 coefficients, a very high accuracy andstable was obtained. This work considered evidencethat the optimal setting of the MFCC can beachieved with a significantly less number of filtersas compared to what was recommended by thecritical bandwidths theory.
Recently, A novel approach that utilizes theArtificial Intelligence techniques like geneticalgorithm (GA) and particle swarm optimization(PSO) to optimize the number and spacing of Melfilter bank in MFCC features has been used in [31].The triangular Mel filterbank was optimizedaccording to three parameters which match thefrequency values: when the triangle for the filterbegins with α (Left), reaches up to its maximum β(center), lastly ends in γ (Right). Each chromosomein GA represents a different filterbank, which isdefined as a series of triangular filters representedby three frequencies α, β, and γ. Filterbank can bedefined as:= [ | = 1,… , ] (22)
Where is a 3-tuple (α , β , γ ), and numberof filters. The filter edge frequencies needs to beimproved within a limit, where (left edge < centeredge < right edge) is required to be retained. MFCCfilterbank optimization by genetic algorithm hadbetter performance at lower SNRs like 6 dB, 12 dBand 18 dB as compared to conventional MFCC.
On the other hand, the particle swarmoptimization (PSO) is a type of optimization tooldepends on iteration, particle swarm optimization
(PSO) has memory ability besides his globalsearching ability. In the multi-dimensional space,each particle in the swarm is migrated towards theoptimal point of having a velocity with its position.Three elements which control the velocity of aparticle are inertial momentum, cognitive, andsocial. At a specific time, the best position (bestfitness) found by each particle known as pbest,while gbest refers to the overall best out of all theparticles in the population. The position of eachparticle moves toward pbest and gbest dependingon the particle velocity, which is defined over thefollowing iteration as [31, 32]:= + − +− (23)
Where w is the inertia weight, which is used tomanage the impact of the previous history ofvelocities on the current velocity. Appropriateselection of the inertia weight gives a balancebetween global and local exploration abilities,thereby requires less iteration on average to obtainthe optimum; and are acceleration constantswhich guiding the particles into the improvedpositions, they deal with the relative influencetoward pbest and gbest by scaling each resultingdistance vector; and are uniformly distributedrandom variables between 0 and 1, and refers tothe evolution iteration. Selecting these parametersplay a crucial role in the optimization process [33].
The individual initial population particles are setup randomly as X_i=(X_i1,X_i2,…,X_id), usingthe same width as the width of MFCC filterbanks.In addition a size of 100 particles of the swarm hasbeen selected as the ideal compromise between theperformance and the computational time.
Experiments in [31], proved that the optimizedfilterbank by PSO has less numbers of filtersperformed either lower or equal in performancewhen compared to conventional MFCC. Moreover,PSO is superior to GA due to its high accuracy andfast convergence (around 15 generations) incomparison to that for GA (around 35 generations).
3.2.3 vocal tract length normalization (VTLN)A substantial portion of the variability in the speechsignal is because of speaker dependent variations invocal tract length. In Vocal Tract LengthNormalization (VTLN), the frequency axis of thepower spectrum are wrapped for attempting toconsider this effect, while the Mel filter-bankremains unchanged [34]. In a basic model, human
Journal of Theoretical and Applied Information Technology10th September 2015. Vol.79. No.1
© 2005 - 2015 JATIT & LLS. All rights reserved.
ISSN: 1992-8645 www.jatit.org E-ISSN: 1817-3195
45
vocal tract was considered as a straight uniformtube of length L based on this Model, changing in Lby a specific factor α leads to a scaling of thefrequency axis by α . Hence, the frequency axisneeds to be scaled to compensate for the variabilitycaused by various vocal tracts of individualspeakers [35]. A mathematical relation of thisscaling can be defined:= ( ) (24)
Where is warped-frequency, and ( ) is thefrequency-warping function.
There are a lot of interesting to obtain a directlinear transformation between static conventional(MFCC) features C and the static VTLN-warpedMFCC ( ), since = .Where A representsa matrix transformation, which from it the VTLN-warped cepstra can be obtained directly fromstatic conventional MFCC features .
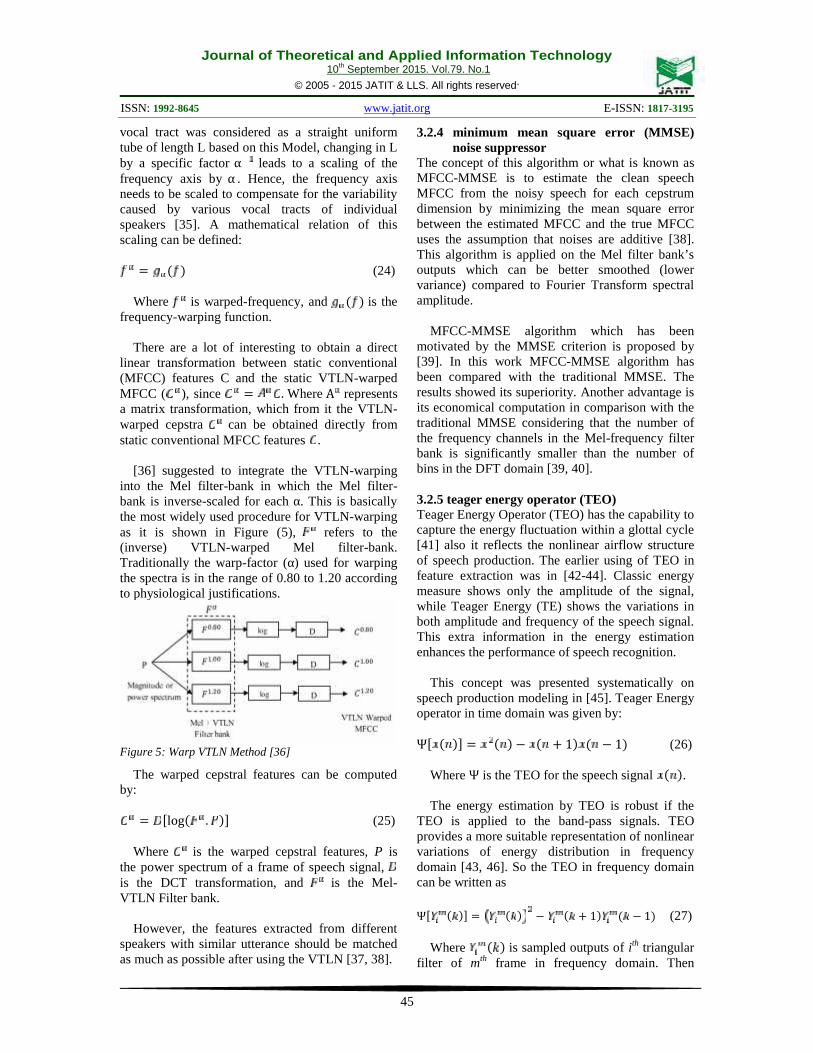
[36] suggested to integrate the VTLN-warpinginto the Mel filter-bank in which the Mel filter-bank is inverse-scaled for each α. This is basicallythe most widely used procedure for VTLN-warpingas it is shown in Figure (5), refers to the(inverse) VTLN-warped Mel filter-bank.Traditionally the warp-factor (α) used for warpingthe spectra is in the range of 0.80 to 1.20 accordingto physiological justifications.
Figure 5: Warp VTLN Method [36]
The warped cepstral features can be computedby:= [log( . )] (25)
Where is the warped cepstral features, P isthe power spectrum of a frame of speech signal,is the DCT transformation, and is the Mel-VTLN Filter bank.
However, the features extracted from differentspeakers with similar utterance should be matchedas much as possible after using the VTLN [37, 38].
3.2.4 minimum mean square error (MMSE)noise suppressor
The concept of this algorithm or what is known asMFCC-MMSE is to estimate the clean speechMFCC from the noisy speech for each cepstrumdimension by minimizing the mean square errorbetween the estimated MFCC and the true MFCCuses the assumption that noises are additive [38].This algorithm is applied on the Mel filter bank’soutputs which can be better smoothed (lowervariance) compared to Fourier Transform spectralamplitude.
MFCC-MMSE algorithm which has beenmotivated by the MMSE criterion is proposed by[39]. In this work MFCC-MMSE algorithm hasbeen compared with the traditional MMSE. Theresults showed its superiority. Another advantage isits economical computation in comparison with thetraditional MMSE considering that the number ofthe frequency channels in the Mel-frequency filterbank is significantly smaller than the number ofbins in the DFT domain [39, 40].
3.2.5 teager energy operator (TEO)Teager Energy Operator (TEO) has the capability tocapture the energy fluctuation within a glottal cycle[41] also it reflects the nonlinear airflow structureof speech production. The earlier using of TEO infeature extraction was in [42-44]. Classic energymeasure shows only the amplitude of the signal,while Teager Energy (TE) shows the variations inboth amplitude and frequency of the speech signal.This extra information in the energy estimationenhances the performance of speech recognition.
This concept was presented systematically onspeech production modeling in [45]. Teager Energyoperator in time domain was given by:Ψ[ ( )] = ( ) − ( + 1) ( − 1) (26)
Where Ψ is the TEO for the speech signal ( ).The energy estimation by TEO is robust if the
TEO is applied to the band-pass signals. TEOprovides a more suitable representation of nonlinearvariations of energy distribution in frequencydomain [43, 46]. So the TEO in frequency domaincan be written as
Ψ[ ( )] = ( ) − ( + 1) ( − 1) (27)
Where ( ) is sampled outputs of ith triangularfilter of mth frame in frequency domain. Then
Journal of Theoretical and Applied Information Technology10th September 2015. Vol.79. No.1
© 2005 - 2015 JATIT & LLS. All rights reserved.
ISSN: 1992-8645 www.jatit.org E-ISSN: 1817-3195
46
Average energy E of ith sequence Y (k) of mth
frame is:E = ∑ |[ ( )]| (28)
i = 1,2,...., L m = 1,2,..,M
Where L is the total number of filters in a Melfilter bank and Ni is the number of frequencysamples in the spectrum. So average frame energyE of mth frame isE = ∑ E (29)
Correspondingly, average Teager energy ofith sequence Ψ[ ( )] of mth frame is= ∑ |Ψ[ ( )]| (30)
While the average frame Teager energy ofmth frame is= ∑ (31)
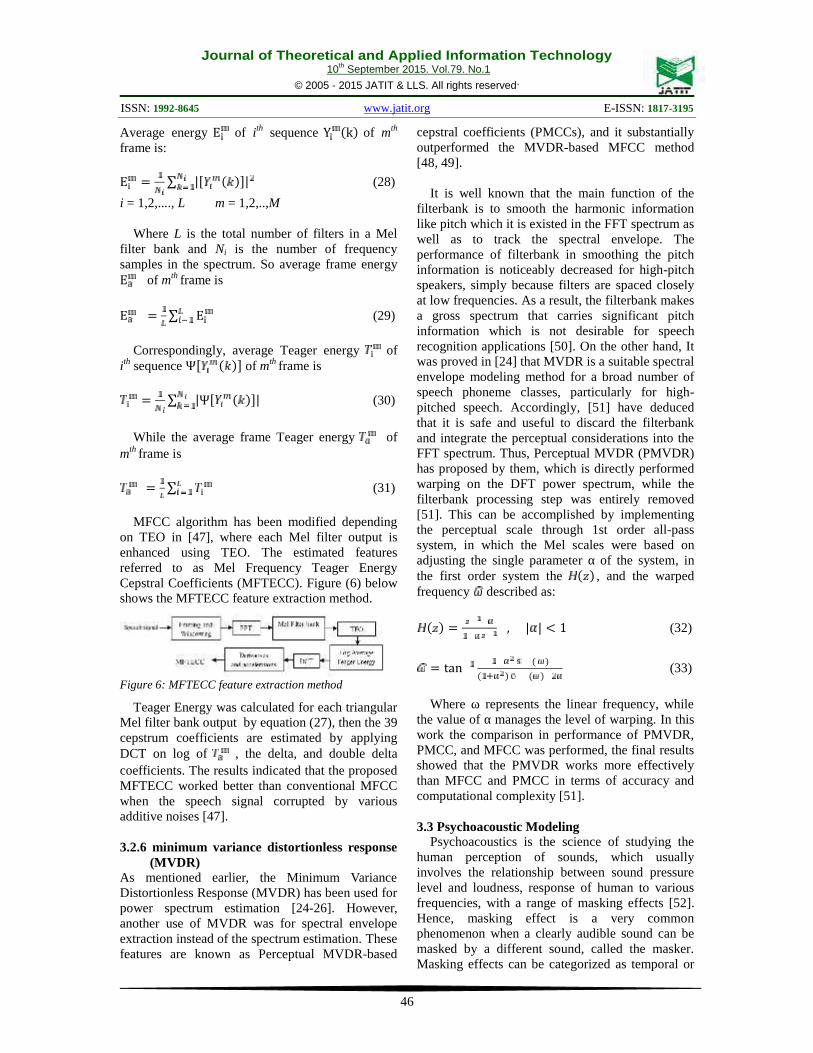
MFCC algorithm has been modified dependingon TEO in [47], where each Mel filter output isenhanced using TEO. The estimated featuresreferred to as Mel Frequency Teager EnergyCepstral Coefficients (MFTECC). Figure (6) belowshows the MFTECC feature extraction method.
Figure 6: MFTECC feature extraction method
Teager Energy was calculated for each triangularMel filter bank output by equation (27), then the 39cepstrum coefficients are estimated by applyingDCT on log of , the delta, and double deltacoefficients. The results indicated that the proposedMFTECC worked better than conventional MFCCwhen the speech signal corrupted by variousadditive noises [47].
3.2.6 minimum variance distortionless response(MVDR)
As mentioned earlier, the Minimum VarianceDistortionless Response (MVDR) has been used forpower spectrum estimation [24-26]. However,another use of MVDR was for spectral envelopeextraction instead of the spectrum estimation. Thesefeatures are known as Perceptual MVDR-based
cepstral coefficients (PMCCs), and it substantiallyoutperformed the MVDR-based MFCC method[48, 49].
It is well known that the main function of thefilterbank is to smooth the harmonic informationlike pitch which it is existed in the FFT spectrum aswell as to track the spectral envelope. Theperformance of filterbank in smoothing the pitchinformation is noticeably decreased for high-pitchspeakers, simply because filters are spaced closelyat low frequencies. As a result, the filterbank makesa gross spectrum that carries significant pitchinformation which is not desirable for speechrecognition applications [50]. On the other hand, Itwas proved in [24] that MVDR is a suitable spectralenvelope modeling method for a broad number ofspeech phoneme classes, particularly for high-pitched speech. Accordingly, [51] have deducedthat it is safe and useful to discard the filterbankand integrate the perceptual considerations into theFFT spectrum. Thus, Perceptual MVDR (PMVDR)has proposed by them, which is directly performedwarping on the DFT power spectrum, while thefilterbank processing step was entirely removed[51]. This can be accomplished by implementingthe perceptual scale through 1st order all-passsystem, in which the Mel scales were based onadjusting the single parameter α of the system, inthe first order system the ( ) , and the warpedfrequency described as:( ) = , | | < 1 (32)
= tan ( )( ) ( ) (33)
Where ω represents the linear frequency, whilethe value of α manages the level of warping. In thiswork the comparison in performance of PMVDR,PMCC, and MFCC was performed, the final resultsshowed that the PMVDR works more effectivelythan MFCC and PMCC in terms of accuracy andcomputational complexity [51].
3.3 Psychoacoustic ModelingPsychoacoustics is the science of studying the
human perception of sounds, which usuallyinvolves the relationship between sound pressurelevel and loudness, response of human to variousfrequencies, with a range of masking effects [52].Hence, masking effect is a very commonphenomenon when a clearly audible sound can bemasked by a different sound, called the masker.Masking effects can be categorized as temporal or
Journal of Theoretical and Applied Information Technology10th September 2015. Vol.79. No.1
© 2005 - 2015 JATIT & LLS. All rights reserved.
ISSN: 1992-8645 www.jatit.org E-ISSN: 1817-3195
47
simultaneous based on the time of occurrence of thesignals. Nevertheless, In temporal masking, if themasker appears earlier in time leading the signal,the masking effect is named forward masking.While it is known as backward masking if themasker occurs after the signal [53]. Forwardmasking is more effective than backward masking,for that reason, many modeling and applicationshave been focused on forward masking [54, 55].
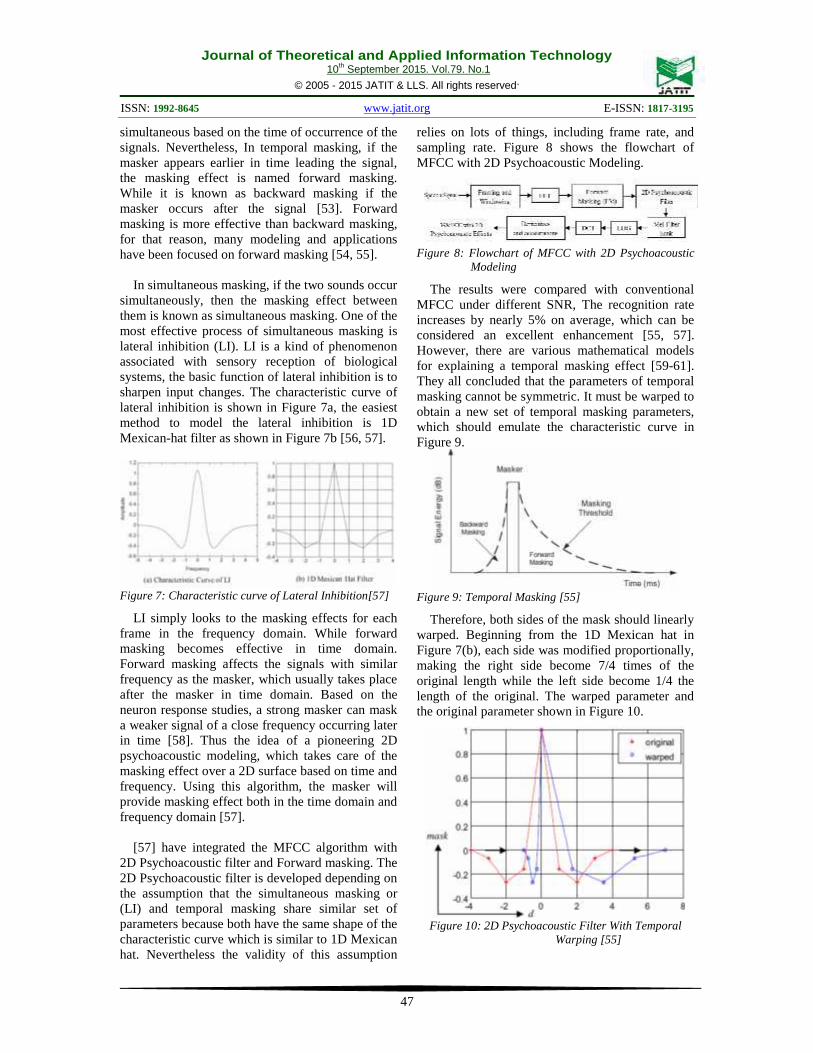
In simultaneous masking, if the two sounds occursimultaneously, then the masking effect betweenthem is known as simultaneous masking. One of themost effective process of simultaneous masking islateral inhibition (LI). LI is a kind of phenomenonassociated with sensory reception of biologicalsystems, the basic function of lateral inhibition is tosharpen input changes. The characteristic curve oflateral inhibition is shown in Figure 7a, the easiestmethod to model the lateral inhibition is 1DMexican-hat filter as shown in Figure 7b [56, 57].
Figure 7: Characteristic curve of Lateral Inhibition[57]
LI simply looks to the masking effects for eachframe in the frequency domain. While forwardmasking becomes effective in time domain.Forward masking affects the signals with similarfrequency as the masker, which usually takes placeafter the masker in time domain. Based on theneuron response studies, a strong masker can maska weaker signal of a close frequency occurring laterin time [58]. Thus the idea of a pioneering 2Dpsychoacoustic modeling, which takes care of themasking effect over a 2D surface based on time andfrequency. Using this algorithm, the masker willprovide masking effect both in the time domain andfrequency domain [57].
[57] have integrated the MFCC algorithm with2D Psychoacoustic filter and Forward masking. The2D Psychoacoustic filter is developed depending onthe assumption that the simultaneous masking or(LI) and temporal masking share similar set ofparameters because both have the same shape of thecharacteristic curve which is similar to 1D Mexicanhat. Nevertheless the validity of this assumption
relies on lots of things, including frame rate, andsampling rate. Figure 8 shows the flowchart ofMFCC with 2D Psychoacoustic Modeling.
Figure 8: Flowchart of MFCC with 2D PsychoacousticModeling
The results were compared with conventionalMFCC under different SNR, The recognition rateincreases by nearly 5% on average, which can beconsidered an excellent enhancement [55, 57].However, there are various mathematical modelsfor explaining a temporal masking effect [59-61].They all concluded that the parameters of temporalmasking cannot be symmetric. It must be warped toobtain a new set of temporal masking parameters,which should emulate the characteristic curve inFigure 9.
Figure 9: Temporal Masking [55]
Therefore, both sides of the mask should linearlywarped. Beginning from the 1D Mexican hat inFigure 7(b), each side was modified proportionally,making the right side become 7/4 times of theoriginal length while the left side become 1/4 thelength of the original. The warped parameter andthe original parameter shown in Figure 10.
Figure 10: 2D Psychoacoustic Filter With TemporalWarping [55]

Journal of Theoretical and Applied Information Technology10th September 2015. Vol.79. No.1
© 2005 - 2015 JATIT & LLS. All rights reserved.
ISSN: 1992-8645 www.jatit.org E-ISSN: 1817-3195
48
This 2D psychoacoustic filter uses to improve thehigh frequencies and sharpen the spectral peaks. In2011, [55] have proposed and applied the warped2D Psychoacoustic filter with MFCC, a comparisonhas done against conventional MFCCs, forwardmasking (FM), lateral inhibition (LI), and theoriginal 2D filter. All of them are integrated withMFCC algorithm. The final results confirm that 2DPsychoacoustic filter successfully increases therecognition rate under noisy environments. Table 1shows the experimental results. Avg 0-20 refers tothe average over SNR 0-20 dB.
Table 1: Recognition Rate (%) of Warped 2D FilterVs. Other Techniques [55]
SNR (dB) Clean 10 Avg 0-20MFCC (39) 99.3617 81.16 71.29FM 99.0283 85.89 77.34LI 99.4217 83.29 73.97FM+LI 99.0617 86.26 77.47Original 2D 99.3150 87.41 77.64Warped 2D 99.3267 90.21 80.36
Further study done by [62] has indicated that theduration of speech signal can has an effect on theentire masking, which is known as temporalintegration (TI). A temporal integration describeshow portions of information are linked together bythe listener which are coming to the ears at differenttimes in mapping speech sounds onto meaning [63].It is well known that speech has active/non-activedurations its power is more focused in some areas,both longer in duration and larger in energy.Consequently, temporal integration apt to imposemore impact on speech. [62] were successfullyimplemented forward masking (FM), lateralinhibition (LI) and temporal integration (TI) using a2D psychoacoustic filter in a MFCC based speechrecognition system. They are proving that temporalintegration can help to improve the SNR of thenoisy speech. The proposed 2D psychoacousticfilter was successfully removed noise. Furthermore,significant improvements were achieved based onexperimental results.
3.4 Utilization of Wavelet TransformThe wavelet transform utilizes short windows to
determine the high frequency information in thesignal, while the low frequency content of thesignal measured by long windows. In theory anyfunction with zero mean and finite energy can be awavelet.
The first utilization of the wavelet transform inspeech recognition has been done in [64] who haveimplemented the Discrete Wavelet Transform(DWT) to the Mel-scaled log filterbank energies of
a speech frame to obtain the new features known asMel-Frequency Discrete Wavelet Coefficients(MFDWC). MFDWC tried to achieve good timeand frequency localization similar to subband-based(SUB) features and multi-resolution (MULT)features. Regardless, MFDWC has superiortime/frequency localization in comparison to SUBand MULT features. The MFDWC features yieldedbetter recognition rates than SUB, MULT and theconventional MFCC [64].
Sub-Band Wavelet Packets (WPs) decompositionstrategy has been another approach used in [65]. Inthis work, the frequency band has been divided intothree bigger bands. The first band from 0-1 kHzand the third band from 3-5.5 kHz are the widedividing frequency bands. The second band from 1-3 kHz was divided into detailed frequency bandsspacing the same as the Mel scale due to the well-known fact that the most sensitive frequency rangeof the human ear is from 1 kHz to 3 kHz. Theexperiment results demonstrated that therecognition rate of Sub-Band WPs approachsuccessfully outperformed that of the conventionalMFCC. Their proposed Sub-Band WPs approachwas improved the recognition rate while thedimension of feature did not increase [65].
However, [66] proposed new MFCCenhancement technique based on the bark wavelet[66]. The Bark wavelet is designed in particular forspeech signal. It is depending on thepsychoacoustic Bark scale. Furthermore, Gaussianfunction selected as mother function of Barkwavelet, mother wavelet needs to have the equalbandwidth in the Bark domain. The waveletfunction in the Bark domain written as:( ) = (34)
The constant is selected as 4ln2, when thebandwidth is 3dB. b is the bark frequency whichcan be obtained from the linear frequency by:= 13. arctan(0.76 ) + 3.5. arctan( . ) (35)
Bark wavelet technique combined with a MFCCalgorithm to produce new feature vectors called(BWMFCC), Figure 11 shows the block diagram ofBWMFCC.

Journal of Theoretical and Applied Information Technology10th September 2015. Vol.79. No.1
© 2005 - 2015 JATIT & LLS. All rights reserved.
ISSN: 1992-8645 www.jatit.org E-ISSN: 1817-3195
49
Figure 11: The block diagram of BWMFCC featurescoefficients
The wavelet transform portioned signalfrequency into 25 sub-bands. Then DFT has appliedto each of those bands. Subsequently Mel filterbank and logarithmic energy are carried out on thesynthesized spectra. Then applying the barkwavelet transform to the logarithmic energy to getthe final speech features. The result indicated thatBWMFCC features can keep on high recognitionrate under low SNRs [66].
The weakness of the BWMFCC is the weakunderstandability of the speech signals which areanalyzed by the fixed wavelet threshold. [67] haveapplied adaptive wavelet thresholding to enhancethe noisy speech corrupted by white and colorednoises. Based on the types of noise, Several typesof the adaptive threshold function of the wavelettransform are utilized to improve the noisy speechsignals.
ℎ ( , ) = ( )(| | − ) | | ≥0 | | < (36)
Where is the wavelet coefficient before de-noising on scale i, ℎ ( , ) is the waveletcoefficient after thresholding, is the soft thresholdfunction defined as (37):= 2 (37)
Where N is the sequence length of the inputsignal, δ is the noise standard deviation. The softthreshold function of equation (37) may vary basedon the variety of the noise standard deviation. Thisapproach is known as Enhanced Bark waveletMFCC (EBWMFCC), which has more effectivefeatures than BWMFCC in low SNR [67].
3.5 Log Function EnhancementThe main objective of Logarithm function is to
compress the Mel filter bank energies as well as tolower their dynamic range. The problems ofLogarithm function are inability to identify theenergies which are less affected by noise. Also, the
negligible distortions in the power spectrumdomain become significant after the logarithmiccompression of Mel filter bank energies [68]. Inorder to find solutions to this problem. [69] haveobserved that the low energy banks are often moredamaged by the noise due to the steep's slope of thelog transformation in the lower energy. Thereforethey proposed to replace the lower segment of theLog function by a power function as:
( ) = ≤log + − log > (38)
This function ( ( ) ) incorporates a powerfunction and the log function, where C is the noisemasking level chosen based on the noise level, and
is the compression coefficient specified tominimize the effects of noise while reserving asmuch speech information as possible to producehigh clean speech. According to their experimentalresults the optimal values of C and λ were C = 107
and λ = 2. With this method the performance wasimproved effectively.
Another solution was introduced by [68], theyproposed a compression function that is computedbased on SNR- dependent root function in Mel sub-bands instead of log function in conventionalMFCC.
The idea of this method was to compensateadditive noise effects on MFCC features, thegeneral form of proposed method can be shown by= ( , , ) = ( − ) (39)
Where is compensated Mel filter bank output,is the compression factor and the bias relies
on noise spectral characteristics. Equation (39)comprises two steps: subtraction and energycompression. In subtraction step, the reduction isperformed because of the additive noise. While incompression step, the less affected filter bankenergies by noise are emphasized. After that, thecompensated MFCC can be calculated by thefollowing equation (DCT equation):= ∑ . ( ) = ∑ ( −) . ( )
(40)
Where is the compensated MFCC. It isobvious from equation (40) that the log function inthe conventional MFCC was replaced by this

Journal of Theoretical and Applied Information Technology10th September 2015. Vol.79. No.1
© 2005 - 2015 JATIT & LLS. All rights reserved.
ISSN: 1992-8645 www.jatit.org E-ISSN: 1817-3195
50
function. The proposed method is illustrated inFigure 12.
Figure 12: Block diagram of the compensated MFCC[68]
The compression root function is formulated as:= . 1 − − = . ( , ) (41)
Where is known as a constant root between 0and 1, is a parameter that manages the steepnessof the compression function, G denotes to SNR-dependent function with values between 0 and 1,and is the signal to noise ratio in ith Melfrequency sub-band. In equation (41), the lowmust be more compressed at sub-bands, while thehigh needs less compression at sub-bands.For this reason, the needs to be close to zero forhigh values, whilst for low values theshould be close to one. formulated based on
can be computed as:= 1 − ( ) = 1 − ( ) (42)
Where µSNR and σSNR are mean and standarddeviation of SNR calculated from all Mel sub-bands of a speech frame.
However, based on the equation (41) andequation (42), the sub-band SNR controls thechange in compression root . This proposedmethod is known as CMSBS which refers toCompression and Mel Sub- Band Spectralsubtraction. CMSBS has been shown significantlyincreasing in the accuracy of speech recognition inthe presence of various additive noises with variousSNR values [68].
Furthermore, Table 2. summarized the mostpowerful enhancement techniques in MFCCalgorithm with a comparison in accuracy of noisyand clean speech.
4. DISCUSSION
Although the conventional MFCC algorithm isbetter in clean speech, but it is highly sensitive innoisy speech. The drawbacks of MFCC features innoisy environments rely on many factors. Thesefactors include spectrum estimation methods,design of effective filter banks, and the number ofchosen features, which are also affecting thecomplexity of the speech recognition systems.
In conventional MFCC, only the magnitude ofDFT is used as spectrum estimation, while thephase is discarded. Researchers have identified theimportance of the phase spectra in performance ofspeech recognition systems due to their lesssensitivity to additive noise compared to themagnitude spectra.
Spectrum estimation enhancement methods arevaried from adding the phase spectra to thecomputation of spectrum estimation to using thephase spectra alone as the spectrum estimation. Agood example is a group delay function (GDF).However, the authors believed that both magnitudeand phase spectra are complementary to each otherand should not neglect any of them.
Other factors which have a significant impact onthe robustness of MFCC features is designing theFilterbank. From previous studies, It was clear thatis possible to obtain robust features when a certainshape of Filter banks is selected for a certainenvironment. However, this method is impracticalbecause it needs re-tuning and selecting the filtershape at every use as well as when changing theenvironment. In addition, it has been shown that thehigher accuracy can be obtained with less numberof filters compare to those used in MFCC.Therefore, the computational complexity of thesubsequent stages will be reduced.
The authors believe that it is possible to obtainhigh recognition accuracy with less computationalcomplexity by combining the methods presented inthis review. As an example combines MelFrequency product spectrum Cepstral coefficients(MFPSCC) with the Teager Energy Operator(TEO).

Journal of Theoretical and Applied Information Technology10th September 2015. Vol.79. No.1
© 2005 - 2015 JATIT & LLS. All rights reserved.
ISSN: 1992-8645 www.jatit.org E-ISSN: 1817-3195
51
5. CONCLUSION
Speech recognition systems have been recentlyused in wide varieties of real applications especiallyafter the enormous technological revolution wheresmart phone and other gadgets within the reach ofeveryone. On the other hand, It is well known thatMFCC features affect the accuracy of the speechrecognition systems. In this review, thefundamentals of the MFCC have been discussedand a wide variety of MFCC enhancement methodshave been reviewed and investigated. Most of thesemethods were classified in a way that became easierfor the researchers to identify the improving'slocation and techniques used in the original MFCCalgorithm. These methods vary in simplicity, andenvironment conditions. Usually, simplification canlead to reduce the recognition accuracy. However,the main challenges in conventional MFCC are thecomplexity, robustness of the features, and theweak performance in the presence of noise.However, most of the scientific studies haveindicated that a large number of features can besignificantly useful when it comes to noisy speech.But the processing of these features is consideredcomputationally complex. So, there must becompatibility between the number of features onthe one hand and the required accuracy of the otherhand. In addition to the knowing the type of theenvironment and the existing noise. All thesefactors have a great effect on the performance androbustness of the speech recognition systems. Theattention in this paper focused on the MFCCalgorithm enhancement techniques in speechrecognition. This research will lead to theincreasing need to develop a robust and improvedMFCC features in speech recognition system.
REFERENCES
[1] S. Gaikwad, B. Gawali, P. Yannawar, and S.Mehrotra, "Feature extraction using fusionMFCC for continuous marathi speechrecognition," in India Conference(INDICON), 2011 Annual IEEE, 2011, pp. 1-5.
[2] S. Davis and P. Mermelstein, "Comparison ofparametric representations for monosyllabicword recognition in continuously spokensentences," Acoustics, Speech and SignalProcessing, IEEE Transactions on, vol. 28,pp. 357-366, 1980.
[3] H. Hermansky, "Perceptual linear predictive(PLP) analysis of speech," The Journal of theAcoustical Society of America, vol. 87, p.1738, 1990.
[4] N. S. Nehe and R. S. Holambe, "IsolatedWord Recognition Using Normalized TeagerEnergy Cepstral Features," in Advances inComputing, Control, & TelecommunicationTechnologies, 2009. ACT '09. InternationalConference on, 2009, pp. 106-110.
[5] Y. Lü and Z. Wu, "Maximum likelihoodsubband polynomial regression for robustspeech recognition," Applied Acoustics, vol.74, pp. 640-646, 2013.
[6] X. Xiong, "Robust speech features andacoustic models for speech recognition," PhD.Thesis, 194 p., Nanyang TechnologicalUniversity, Singapore, 2009.
[7] M. Anusuya and S. Katti, "Front end analysisof speech recognition: a review,"International Journal of Speech Technology,vol. 14, pp. 99-145, 2011.
[8] L. R. Rabiner and B. B. H. Juang,Fundamentals of Speech Recognition:Prentice Hall, 1993.
[9] S. K. Mitra, Digital signal processing: acomputer-based approach vol. 1221:McGraw-Hill New York, 2011.
[10] X. Huang, A. Acero, and H.-W. Hon, Spokenlanguage processing vol. 15: Prentice HallPTR New Jersey, 2001.
[11] G. Von Békésy and E. G. Wever, Experimentsin hearing vol. 8: McGraw-Hill New York,1960.
[12] T. F. Quatieri, Discrete-time speech signalprocessing: Pearson Education, 2002.
[13] L. R. Rabiner and R. W. Schafer, Theory andApplications of Digital Speech Processing:Pearson, 2010.
[14] J. W. Picone, "Signal modeling techniques inspeech recognition," Proceedings of the IEEE,vol. 81, pp. 1215-1247, 1993.
[15] Y. Ephraim and M. Rahim, "On second-orderstatistics and linear estimation of cepstralcoefficients," Speech and Audio Processing,IEEE Transactions on, vol. 7, pp. 162-176,1999.
[16] H. A. Murthy and V. Gadde, "The modifiedgroup delay function and its application tophoneme recognition," in Acoustics, Speech,and Signal Processing, 2003.Proceedings.(ICASSP'03). 2003 IEEEInternational Conference on, 2003, pp. I-68-71 vol. 1.

Journal of Theoretical and Applied Information Technology10th September 2015. Vol.79. No.1
© 2005 - 2015 JATIT & LLS. All rights reserved.
ISSN: 1992-8645 www.jatit.org E-ISSN: 1817-3195
52
[17] K. K. Paliwal and L. Alsteris, "Usefulness ofphase spectrum in human speech perception,"in Proc. Eurospeech, 2003, pp. 2117-2120.
[18] D. Zhu and K. K. Paliwal, "Product of powerspectrum and group delay function for speechrecognition," in Acoustics, Speech, and SignalProcessing, 2004. Proceedings.(ICASSP'04).IEEE International Conference on, 2004, pp.I-125-8 vol. 1.
[19] D. McGinn and D. Johnson, "Estimation ofall-pole model parameters from noise-corrupted sequences," Acoustics, Speech andSignal Processing, IEEE Transactions on,vol. 37, pp. 433-436, 1989.
[20] B. J. Shannon and K. K. Paliwal, "Featureextraction from higher-lag autocorrelationcoefficients for robust speech recognition,"Speech Communication, vol. 48, pp. 1458-1485, 2006.
[21] B. J. Shannon and K. K. Paliwal, "MFCCComputation from Magnitude Spectrum ofhigher lag autocorrelation coefficients forrobust speech recognition," in Proc. ICSLP,2004, pp. 129-132.
[22] S. Ikbal, H. Misra, H. Hermansky, and M.Magimai-Doss, "Phase AutoCorrelation(PAC) features for noise robust speechrecognition," Speech Communication, 2012.
[23] G. Farahani, M. Ahadi, and M. M.Homayounpour, "Autocorrelation-basedMethods for Noise-Robust SpeechRecognition," Robust Speech Recognition andUnderstanding, p. 239, 2007.
[24] M. N. Murthi and B. D. Rao, "All-polemodeling of speech based on the minimumvariance distortionless response spectrum,"Speech and Audio Processing, IEEETransactions on, vol. 8, pp. 221-239, 2000.
[25] S. Dharanipragada and B. D. Rao, "MVDRbased feature extraction for robust speechrecognition," in Acoustics, Speech, and SignalProcessing, 2001. Proceedings.(ICASSP'01).2001 IEEE International Conference on,2001, pp. 309-312.
[26] M. J. Alam, P. Kenny, and D. O'Shaughnessy,"Speech recognition using regularizedminimum variance distortionless responsespectrum estimation-based cepstral features,"in Acoustics, Speech and Signal Processing(ICASSP), 2013 IEEE InternationalConference on, 2013, pp. 8071-8075.
[27] A. Biem, S. Katagiri, E. McDermott, and B.-H. Juang, "An application of discriminativefeature extraction to filter-bank-based speechrecognition," Speech and Audio Processing,IEEE Transactions on, vol. 9, pp. 96-110,2001.
[28] S.-M. Lee, S.-H. Fang, J.-w. Hung, and L.-S.Lee, "Improved MFCC feature extraction byPCA-optimized filter-bank for speechrecognition," in Automatic SpeechRecognition and Understanding, 2001.ASRU'01. IEEE Workshop on, 2001, pp. 49-52.
[29] J.-w. Hung, "Optimization of filter-bank toimprove the extraction of MFCC features inspeech recognition," in IntelligentMultimedia, Video and Speech Processing,2004. Proceedings of 2004 InternationalSymposium on, 2004, pp. 675-678.
[30] J. Psutka, L. Müller, and J. V. Psutka,"Comparison of mfcc and plpparameterization in the speaker independentcontinuous speech recognition task,"Proceedings of Eurospeeech, pp. 1813-1816,2001.
[31] R. Aggarwal and M. Dave, "Filterbankoptimization for robust ASR using GA andPSO," International Journal of SpeechTechnology, vol. 15, pp. 191-201, 2012.
[32] Z. Li, X. Liu, X. Duan, and F. Huang,"Comparative research on particle swarmoptimization and genetic algorithm,"Computer and Information Science, vol. 3, p.P120, 2010.
[33] J. F. Kennedy, J. Kennedy, and R. C.Eberhart, Swarm intelligence: MorganKaufmann, 2001.
[34] A. Andreou, T. Kamm, and J. Cohen,"Experiments in vocal tract normalization," inProc. CAIP Workshop: Frontiers in SpeechRecognition II, 1994.
[35] A. Zolnay, D. Kocharov, R. Schlüter, and H.Ney, "Using multiple acoustic feature sets forspeech recognition," Speech Communication,vol. 49, pp. 514-525, 2007.
[36] L. Lee and R. Rose, "A frequency warpingapproach to speaker normalization," Speechand audio processing, ieee transactions on,vol. 6, pp. 49-60, 1998.
[37] D. R. Sanand and S. Umesh, "VTLN UsingAnalytically Determined Linear-Transformation on Conventional MFCC,"Audio, Speech, and Language Processing,IEEE Transactions on, vol. 20, pp. 1573-1584, 2012.

Journal of Theoretical and Applied Information Technology10th September 2015. Vol.79. No.1
© 2005 - 2015 JATIT & LLS. All rights reserved.
ISSN: 1992-8645 www.jatit.org E-ISSN: 1817-3195
53
[38] R. Sinha and S. Umesh, "A shift-basedapproach to speaker normalization using non-linear frequency-scaling model," SpeechCommunication, vol. 50, pp. 191-202, 2008.
[39] D. Yu, L. Deng, J. Droppo, J. Wu, Y. Gong,and A. Acero, "A minimum-mean-square-error noise reduction algorithm on mel-frequency cepstra for robust speechrecognition," in Acoustics, Speech and SignalProcessing, 2008. ICASSP 2008. IEEEInternational Conference on, 2008, pp. 4041-4044.
[40] D. Yu, L. Deng, J. Droppo, J. Wu, Y. Gong,and A. Acero, "Robust speech recognitionusing a cepstral minimum-mean-square-error-motivated noise suppressor," Audio, Speech,and Language Processing, IEEE Transactionson, vol. 16, pp. 1061-1070, 2008.
[41] P. Maragos, J. F. Kaiser, and T. F. Quatieri,"Energy separation in signal modulations withapplication to speech analysis," SignalProcessing, IEEE Transactions on, vol. 41,pp. 3024-3051, 1993.
[42] D. Dimitriadis, P. Maragos, and A.Potamianos, "Auditory Teager energycepstrum coefficients for robust speechrecognition," in Proc of Interspeech, 2005, pp.3013-3016.
[43] H. Gao, S. Chen, and G. Su, "Emotionclassification of infant voice based on featuresderived from Teager Energy Operator," inImage and Signal Processing, 2008. CISP'08.Congress on, 2008, pp. 333-337.
[44] A. Potamianos and P. Maragos, "Time-frequency distributions for automatic speechrecognition," Speech and Audio Processing,IEEE Transactions on, vol. 9, pp. 196-200,2001.
[45] J. F. Kaiser, "On a simple algorithm tocalculate theenergy'of a signal," in Acoustics,Speech, and Signal Processing, 1990.ICASSP-90., 1990 International Conferenceon, 1990, pp. 381-384.
[46] T. L. Nwe, S. W. Foo, and L. C. De Silva,"Classification of stress in speech using linearand nonlinear features," in Acoustics, Speech,and Signal Processing, 2003.Proceedings.(ICASSP'03). 2003 IEEEInternational Conference on, 2003, pp. II-9-12 vol. 2.
[47] N. Nehe and R. Holambe, "Mel FrequencyTeager Energy Features for Isolate WordRecognition in Noisy Environment," inEmerging Trends in Engineering andTechnology (ICETET), 2009 2nd
International Conference on, 2009, pp. 904-908.
[48] U. H. Yapanel and S. Dharanipragada,"Perceptual MVDR-based cepstralcoefficients (PMCCs) for robust speechrecognition," in Acoustics, Speech, and SignalProcessing, 2003. Proceedings.(ICASSP'03).2003 IEEE International Conference on,2003, pp. I-644-I-647 vol. 1.
[49] U. H. Yapanel and J. H. Hansen, "A newperspective on feature extraction for robust in-vehicle speech recognition," in Proceedings ofEurospeech, 2003.
[50] L. Gu and K. Rose, "Split-band perceptualharmonic cepstral coefficients as acousticfeatures for speech recognition," ISCAInterspeech-01/EUROSPEECH-01, Aalbrg,Denmark, pp. 583-586, 2001.
[51] U. H. Yapanel and J. H. Hansen, "A newperceptually motivated MVDR-based acousticfront-end (PMVDR) for robust automaticspeech recognition," Speech Communication,vol. 50, pp. 142-152, 2008.
[52] B. Gold, N. Morgan, and D. Ellis, Speech andaudio signal processing: processing andperception of speech and music: Wiley. com,2011.
[53] M. N. Kvale and C. E. Schreiner, "Short-termadaptation of auditory receptive fields todynamic stimuli," Journal ofneurophysiology, vol. 91, pp. 604-612, 2004.
[54] A. J. Oxenham, "Forward masking:Adaptation or integration?," The Journal ofthe Acoustical Society of America, vol. 109, p.732, 2001.
[55] P. Dai and I. Y. Soon, "A temporal warped2D psychoacoustic modeling for robustspeech recognition system," SpeechCommunication, vol. 53, pp. 229-241, 2011.
[56] X. Luo, Y. Soon, and C. K. Yeo, "An auditorymodel for robust speech recognition," inAudio, Language and Image Processing,2008. ICALIP 2008. International Conferenceon, 2008, pp. 1105-1109.
[57] P. Dai, Y. Soon, and C. K. Yeo, "2Dpsychoacoustic filtering for robust speechrecognition," in Information, Communicationsand Signal Processing, 2009. ICICS 2009. 7thInternational Conference on, 2009, pp. 1-5.
[58] S. A. Shamma, "Speech processing in theauditory system II: Lateral inhibition and thecentral processing of speech evoked activityin the auditory nerve," The Journal of theAcoustical Society of America, vol. 78, p.1622, 1985.
Journal of Theoretical and Applied Information Technology10th September 2015. Vol.79. No.1
© 2005 - 2015 JATIT & LLS. All rights reserved.
ISSN: 1992-8645 www.jatit.org E-ISSN: 1817-3195
54
[59] B. Strope and A. Alwan, "A model ofdynamic auditory perception and itsapplication to robust word recognition,"Speech and Audio Processing, IEEETransactions on, vol. 5, pp. 451-464, 1997.
[60] K.-Y. Park and S.-Y. Lee, "An engineeringmodel of the masking for the noise-robustspeech recognition," Neurocomputing, vol.52, pp. 615-620, 2003.
[61] P. T. Nghia and P. V. Binh, "A new wavelet-based wide-band speech coder," in AdvancedTechnologies for Communications, 2008. ATC2008. International Conference on, 2008, pp.349-352.
[62] P. Dai and I. Y. Soon, "A temporal frequencywarped (TFW) 2D psychoacoustic filter forrobust speech recognition system," SpeechCommunication, vol. 54, pp. 402-413, 2012.
[63] N. Nguyen and S. Hawkins, "Temporalintegration in the perception of speech:introduction," Journal of Phonetics, vol. 31,pp. 279-287, 2003.
[64] Z. Tufekci and J. Gowdy, "Feature extractionusing discrete wavelet transform for speechrecognition," in Southeastcon 2000.Proceedings of the IEEE, 2000, pp. 116-123.
[65] J. Hai and E. M. Joo, "Using sub-bandwavelet packets strategy for featureextraction," in Proceedings of the 2nd WSEASInternational Conference on Electronics,Control and Signal Processing, 2003, p. 80.
[66] X.-y. Zhang, J. Bai, and W.-z. Liang, "Thespeech recognition system based on barkwavelet MFCC," in Signal Processing, 20068th International Conference on, 2006.
[67] Z. Jie, L. Guo-liang, Z. Yu-zheng, and L.Xiao-ying, "A novel noise-robust speechrecognition system based on adaptivelyenhanced bark wavelet mfcc," in FuzzySystems and Knowledge Discovery, 2009.FSKD'09. Sixth International Conference on,2009, pp. 443-447.
[68] B. Nasersharif and A. Akbari, "SNR-dependent compression of enhanced Mel sub-band energies for compensation of noiseeffects on MFCC features," Patternrecognition letters, vol. 28, pp. 1320-1326,2007.
[69] Z. Wu and Z. Cao, "Improved MFCC-basedfeature for robust speaker identification,"Tsinghua Science & Technology, vol. 10, pp.158-161, 2005.
[70] S. Ikbal, H. Misra, and H. Bourlard, "Phaseautocorrelation (PAC) derived robust speechfeatures," in Acoustics, Speech, and SignalProcessing, 2003. Proceedings.(ICASSP'03).2003 IEEE International Conference on,2003, pp. II-133-6 vol. 2.
[71] S. Dharanipragada and B. D. Rao, "MVDRbased feature extraction for robust speechrecognition," in Acoustics, Speech, and SignalProcessing, IEEE International Conferenceon, 2001, pp. 309-312.

Journal of Theoretical and Applied Information Technology10th September 2015. Vol.79. No.1
© 2005 - 2015 JATIT & LLS. All rights reserved.
ISSN: 1992-8645 www.jatit.org E-ISSN: 1817-3195
55
Table 2. Summary Of Enhanced Mfcc Algorithm Techniques
Technique Name EnvironmentsNature of the
DataDataSet
Accuracy %No. ofFeatur
esYear [Ref]
Mel Frequency Modified GroupDelay cepstral coefficients(MFMGDCC)
Additivebackground
noise
Connecteddigits
Aurora2
81.06@ ∞ db54.98 @ ave.
392003 [16]2004 [18]
Mel Frequency product spectrumcepstral coefficients (MFPSCC)
99.31@ ∞ db72.48@ ave.
Autocorrelation MFCC (AMFCC)Additive
backgroundnoise
Connecteddigits
Aurora2
99.08@ ∞ db81.2 @10db
392004 [21]2006 [20]2007 [23]991 words
vocabulary
Resource
Management(RM)
93.44@ ∞ db51.29@10db
Phase AutoCorrelation(PAC-MFCC)
Additivebackground
noise
connectedtelephoneNumbers
OGINumber
s 95
87.8@ ∞ db84@10db
392003 [70]2012 [22]
Connecteddigits
Aurora2
97.55∞ db76.30@10db
MVDR based MFCC Car noise 178 wordsCustom
Data88.2@ 60
mph39 2001 [71]
Regularized MVDR (RMVDR)Additive
backgroundnoise
largevocabularycontinuous
speech
Aurora4
65.79 @ avg 39 2013 [26]
Mel filter bankshapemodification
Via PCA
Additivebackground
noise
MandarinDigit String
NUM-100A
96.43∞ db46.23@10db
392001 [28]2004 [29]
Via PCA inlinear
spectraldomain
97.47∞ db54.37@10db
Via PCA inLog spectral
domain
97.41∞ db55.29@10db
Optimize the No.and spacing ofMel filter bank
GA Additivebackground
noise
HindiVowels
CustomData
92.87@∞ db73.32@ 12db
Various No.
offilters
2012 [31]PSO
93.01∞ db78.06@ 12db
VTLN- MFCC
noise-freeIsolated
wordTIDIGI
TS97.5 39
2012 [37]Additivebackground
noise
largevocabularycontinuous
speech
Aurora4
78.8 45
MFCC-MMSE realisticautomobile
environments
NoisyIsolated
Digit
Aurora3
87.87@avg39
2008 [40]2008 [39]Improved MFCC-MMSE 88.64@avg
Improved MFCC-MMSE+CMVN 89.77@avg
Mel Frequency Teager cepstralCoefficients (MFTECC)
Additivebackground
noise
Isolatedword
TI-2098.04 @ ∞ db43.09 @ 10db
39 2009 [47]
Perceptual Minimum VarianceDistortionless Response(PMVDR)
Real carenvironments
noisy wordsCu-
Move92.26@ avg
392003 [48]2003 [49]2008 [51]
Actual Stress noisy speech SUSAS 85.07 @ avg
noise-free
largevocabularycontinuous
speech
WSJWallstreet
Journal
95.18 @ avg

Journal of Theoretical and Applied Information Technology10th September 2015. Vol.79. No.1
© 2005 - 2015 JATIT & LLS. All rights reserved.
ISSN: 1992-8645 www.jatit.org E-ISSN: 1817-3195
56
Perceptual MVDR-Based CepstralCoefficients (PMCC)
Real carenvironments
noisy wordsCu-
Move90.13@ avg
Actual Stress noisy speech SUSAS 81.38@ avg
noise-free
largevocabularycontinuous
speech
WSJWallstreet
Journal
95.07@ avg
2D Psychoacoustic Filter + MFCCAdditive
backgroundnoise
Isolateddigits
Aurora2
99.31@ ∞ db87.41@ 10db
392009 [57]2011 [55]2012 [62]
Temporal Warped 2DPsychoacoustic Filter + MFCC Additive
backgroundnoise
Additivebackground
noise
Isolateddigits
continuousspeech
Aurora2
TIMIT
99.33@ ∞ db90.21@ 10db
3915
2009 [57]2011 [55]2012 [62]2000 [64]
(Temporal Integration + FM + LI+ 2D Psychoacoustic Filter) +MFCC
99.02@ ∞ db91.65@10 db
Mel-Frequency Discrete WaveletCoefficients (MFDWC)
59.71@ ∞ db
Sub-band feature (SUB) Additivebackground
noiseAdditive
backgroundnoise
continuousspeechIsolated
Digit
TIMITT146
58.11@ ∞ db 16
2000 [64]2003 [65]
Multi-resolution feature (MULT) 56.2@ ∞ db1616Sub-Band Wavelet Packets (WPs) 87.3 @ 20db
Mel filter-like WPs Additivebackground
noisenoise-free
IsolatedDigit
30 words
T146Custom
Data
84.3@ 20db1616
2003 [65]2006 [66]2009 [67]Bark Wavelet MFCC 95.69@ ∞ db
Enhancement Bark WaveletMFCC
noise-freeAdditive
backgroundnoise
30 wordscontinuous
speech
CustomData
TIMIT
96.35@ ∞ db1626
2006 [66]2009 [67]2005 [69]Modified the Log transformation
97.2@ ∞ db53@10 db
Compression and Mel Sub-bandSpectral Subtraction (CMSBS)
Additivebackground
noise
Isolatedword
TIMIT 97 24 2007 [68]
Root MFCC (RMFCC) Additivebackground
noise
Isolatedword
TIMIT90
24 2007 [68]


![ISSN: 1992-8645 E-ISSN: A NEW STATIC ...some of these are: frequency planning, sectoring, and Fractional Frequency Reuse (FRF) [6]. Frequency planning means dividing the available](https://img.pdfslide.us/doc/110x75/5e91c4a33cd849146311230c/issn-1992-8645-e-issn-a-new-static-some-of-these-are-frequency-planning.jpg)