Embed Size (px)
Citation preview

ISSN 1835-9728
Environmental Economics Research Hub Research Reports
Cost-Benefit Analysis of the Protection of Malleefowl in the Lachlan Catchment
Tertius Greyling and Jeff Bennett
Research Report No. 99
March 2011
About the authors Tertius Greyling is a research assistant at the Crawford School of Economics and Government at the
Australian National University.
Jeff Bennett is a Professor at the Crawford School of Economics and Government at the Australian
National University.

Environmental Economics Research Hub Research Reports are published by the
Crawford School of Economics and Government, Australian National University,
Canberra, 0200 Australia.
These Reports present work in progress being undertaken by project teams within the
Environmental Economics Research Hub (EERH). The EERH is funded by the
Department of Sustainability, Environment, Water, Population and Communities under
the Commonwealth Environment Research Facility.
The authors would like to thank the Lachlan Catchment Management Authority and in
particular Angus Arnott and Milton Lewis for their assistance in conducting this study.
The views and interpretations expressed in these Reports are those of the author(s) and
should not be attributed to any organisation associated with the EERH.
Because these reports present the results of work in progress, they should not be
reproduced in part or in whole without the authorisation of the EERH Director, Professor
Jeff Bennett ([email protected])
Crawford School of Economics and Government
THE AUSTRALIAN NATIONAL UNIVERSITY
http://www.crawford.anu.edu.au
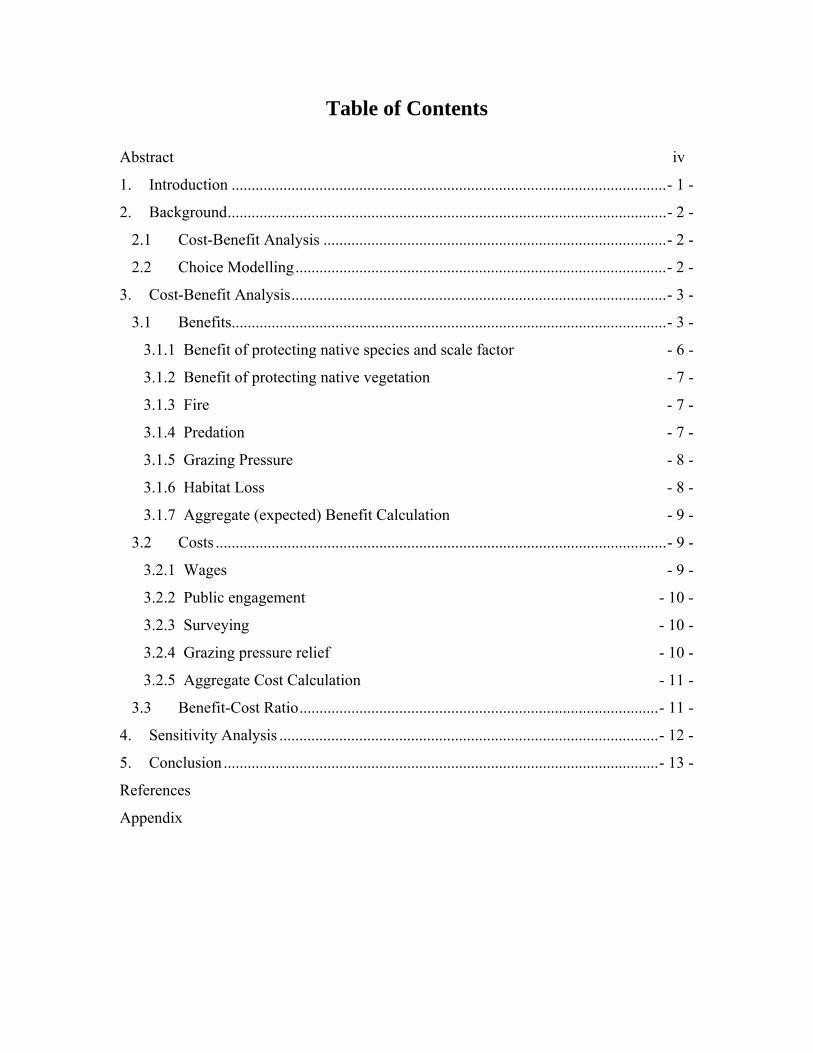
Table of Contents
Abstract iv
1. Introduction ............................................................................................................. - 1 -
2. Background .............................................................................................................. - 2 -
2.1 Cost-Benefit Analysis ...................................................................................... - 2 -
2.2 Choice Modelling ............................................................................................. - 2 -
3. Cost-Benefit Analysis .............................................................................................. - 3 -
3.1 Benefits ............................................................................................................. - 3 -
3.1.1 Benefit of protecting native species and scale factor - 6 -
3.1.2 Benefit of protecting native vegetation - 7 -
3.1.3 Fire - 7 -
3.1.4 Predation - 7 -
3.1.5 Grazing Pressure - 8 -
3.1.6 Habitat Loss - 8 -
3.1.7 Aggregate (expected) Benefit Calculation - 9 -
3.2 Costs ................................................................................................................. - 9 -
3.2.1 Wages - 9 -
3.2.2 Public engagement - 10 -
3.2.3 Surveying - 10 -
3.2.4 Grazing pressure relief - 10 -
3.2.5 Aggregate Cost Calculation - 11 -
3.3 Benefit-Cost Ratio .......................................................................................... - 11 -
4. Sensitivity Analysis ............................................................................................... - 12 -
5. Conclusion ............................................................................................................. - 13 -
References
Appendix

Abstract
A cost-benefit analysis (CBA) of an investment in the protection of malleefowl and
associated native vegetation in the Lachlan Catchment’s central-west yielded a benefit-
cost ratio of 1.4. The CBA is based on project expenditures over the past four years
coupled with benefit estimates from a recent Choice Modelling study in the Lachlan
Catchment. The project targets the protection of malleefowl on private land which has
not yet been surveyed but where the species is known to be present. The CBA is subject to
significant uncertainty due to a lack of available data. Nonetheless, sensitivity analysis
indicates that the BCR is consistently larger than unity, if marginal in some cases. This
suggests that the project is a worthwhile investment at this early stage. Furthermore,
greater gains may be achieved by addressing the numerous threats facing the species and
its habitat. The increased cost of such an investment may be more than offset by the gains
in benefits due to relatively conservative assumptions associated with the benefit
calculations in the BCA.
Key words: Cost-benefit analysis, Benefit-cost ratio, Choice modelling, Malleefowl,
Lachlan Catchment.
- 1 -
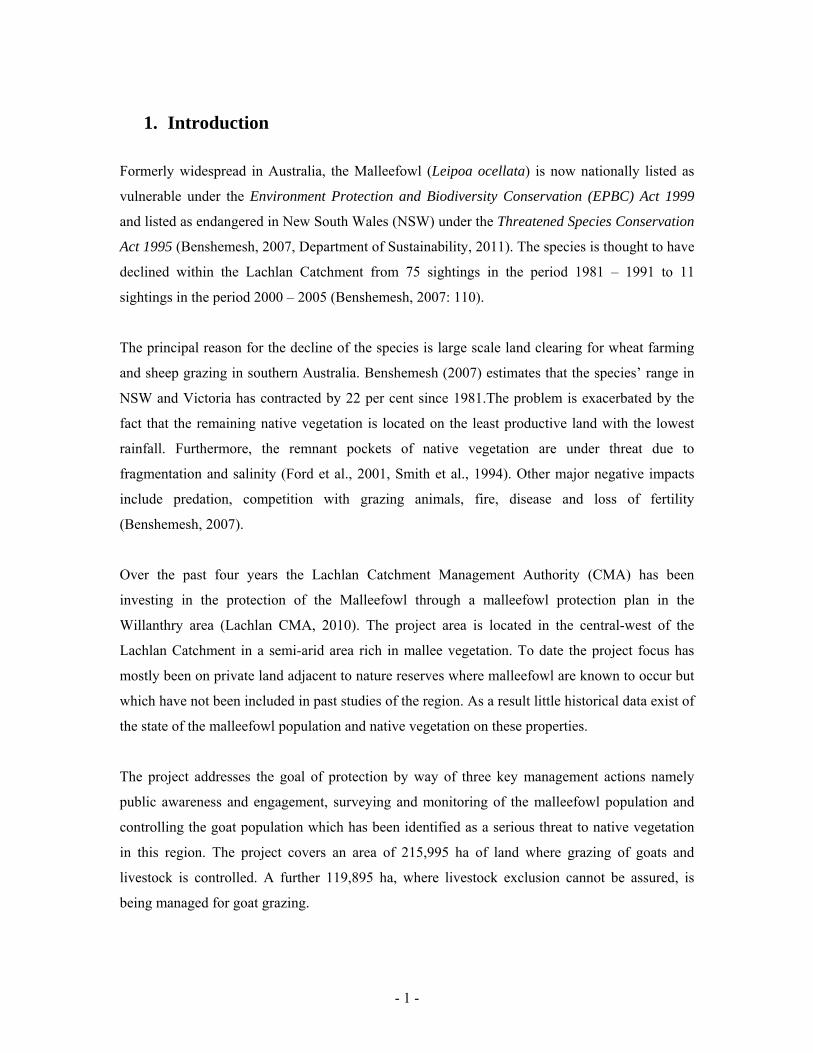
1. Introduction
Formerly widespread in Australia, the Malleefowl (Leipoa ocellata) is now nationally listed as
vulnerable under the Environment Protection and Biodiversity Conservation (EPBC) Act 1999
and listed as endangered in New South Wales (NSW) under the Threatened Species Conservation
Act 1995 (Benshemesh, 2007, Department of Sustainability, 2011). The species is thought to have
declined within the Lachlan Catchment from 75 sightings in the period 1981 – 1991 to 11
sightings in the period 2000 – 2005 (Benshemesh, 2007: 110).
The principal reason for the decline of the species is large scale land clearing for wheat farming
and sheep grazing in southern Australia. Benshemesh (2007) estimates that the species’ range in
NSW and Victoria has contracted by 22 per cent since 1981.The problem is exacerbated by the
fact that the remaining native vegetation is located on the least productive land with the lowest
rainfall. Furthermore, the remnant pockets of native vegetation are under threat due to
fragmentation and salinity (Ford et al., 2001, Smith et al., 1994). Other major negative impacts
include predation, competition with grazing animals, fire, disease and loss of fertility
(Benshemesh, 2007).
Over the past four years the Lachlan Catchment Management Authority (CMA) has been
investing in the protection of the Malleefowl through a malleefowl protection plan in the
Willanthry area (Lachlan CMA, 2010). The project area is located in the central-west of the
Lachlan Catchment in a semi-arid area rich in mallee vegetation. To date the project focus has
mostly been on private land adjacent to nature reserves where malleefowl are known to occur but
which have not been included in past studies of the region. As a result little historical data exist of
the state of the malleefowl population and native vegetation on these properties.
The project addresses the goal of protection by way of three key management actions namely
public awareness and engagement, surveying and monitoring of the malleefowl population and
controlling the goat population which has been identified as a serious threat to native vegetation
in this region. The project covers an area of 215,995 ha of land where grazing of goats and
livestock is controlled. A further 119,895 ha, where livestock exclusion cannot be assured, is
being managed for goat grazing.

- 2 -
2. Background
2.1 Cost-Benefit Analysis
Cost-benefit analyses (CBA) are often conducted to evaluate public expenditures. The goal is to
weigh up the total costs against the benefits of the expenditure in order to determine whether in
economic terms it is a worthwhile investment. In this assessment this will be done by way of the
benefit-cost ratio (BCR), i.e. the ratio of the aggregate benefits to the aggregate costs. If the ratio
is unity or greater the benefits outweigh the costs and the expenditure is usually considered to be
worthwhile.
Though the evaluation of environmental investments is often controversial, it is a necessary step
in order to ensure more efficient allocation of societal resources (Boardman et al., 2006). It is
important to bear in mind that the value of environmental assets are expressed in dollar-terms to
enable comparison across different costs and benefits (Hanley and Barbier, 2009), not to create a
market for its subsequent trading as goods. Evaluation of environmental assets and its subsequent
use in BCA allows environmental decision-makers to make more informed decisions about the
allocation of public funds.
2.2 Choice Modelling
The valuation method used in this assessment to estimate the non-market environmental benefits
associated with protecting the malleefowl is Choice Modelling (CM), a stated preference
technique. In a CM study conducted by Mazur and Bennett (2009), New South Wales (NSW)
households were asked about their preferences regarding investment in natural resource
management in the Lachlan Catchment. The availability of this economic model to determine the
benefit of environmental investment in the Lachlan Catchment is fortunate because finding values
for ‘non-market goods’ is often difficult or costly to determine through surveying. Therefore this
presented an ideal opportunity to evaluate the Malleefowl conservation project in the Lachlan
Catchment.
In the Lachlan CM survey the respondents were asked about their preferences regarding four
attributes: native species; native vegetation; healthy waterways; and agricultural employment.
These attributes were presented to the respondents in the form of choice sets which each contain
different scenarios where the four attributes are set to different levels. For example, one scenario

- 3 -
provided 2,090 native species; 8,000 square kilometres of native vegetation; 380 km of healthy
waterways and 8,700 people working in agriculture at a cost of $50 per household per year paid
over 5 years. In each choice set the respondent was asked to compare three of these scenarios
including the status quo scenario which provided the level of the four attributes within the
catchment that would occur in 20 years time if there were no new NRM investments made. By
choosing one of the scenarios a respondent reveals her relative preferences for the four attributes.
The implicit price of each of the attributes can then be determined by examining the respondents’
average willingness to pay to secure more of each environmental attribute, all else remaining
constant.
The implicit prices of the attributes from this CM study are presented in table 1. A benefit
estimate for improvements in each of the attributes can be calculated from these implicit prices by
multiplying the implicit price with the change in the level of the attribute achieved, the number of
households in NSW and the response rate. In this particular CBA only the implicit prices of
native species and native vegetation are relevant.
Table 1: NPV of implicit prices for the CM attributes
Attribute Units Lachlan Sydney Rural NSW
Native Vegetation $ per sq. km. per household p.a.
0.04 0.09 -
Native Species $ per species per household p.a.
19.53 35.11 32.25
Healthy Waterways $ per km. per household p.a.
3.59 1.52* 5.59
Agricultural Employment
$ per person per household p.a.
1.17 - 0.95*
*Significant only at the 10 per cent level. All values discounted at a rate of 5 per cent over 5 years.
3. Cost-Benefit Analysis
3.1 Benefits
The benefit estimate derived from the CM application is based on the protection of native species
and native vegetation that would be achieved from the conservation programme. However,

- 4 -
because this project has only been operational for four years it still faces a number of challenges
before the final outcome can be determined with any certainty. This uncertainty is addressed by
introducing probability factors into the calculation of expected benefits. In effect the benefits
derived by the investment is weighted by the probability associated with each benefit being
realised (Hanley and Barbier, 2009, Campbell and Brown, 2003).
A literature survey to determine the possible threats which may affect the probability of
successfully protecting malleefowl and the associated native vegetation yielded seven possible
threats across Australia. The literature mentions five major threats: fire; predation; competition
with grazing species; habitat loss; and climate change. A further two threats related to infertility
and road killings are also mentioned (Benshemesh, 2007). In this assessment the threat of climate
change, though regarded by some as significant (Brereton et al., 1995), is not included because of
the extreme uncertainty of its impacts. Infertility is possibly a result of the use of agricultural
chemicals whilst road-killings are likely due to spillage of grain next to roads. These two threats
are also not included in the benefit calculation due to their limited relevance in this case (A.
Arnott, personal communication, March 2, 2011).
The remaining four categories of threats are broken down according to specific management
actions in table 2. As the literature survey span across all Australian populations of the species
some of the specific actions present in other locations may not necessarily be relevant to this
project. These actions are marked as not applicable (N/A) in the table. Other actions are marked
as present or absent according to the present management programme.
Due to the lack of knowledge about the impact of the mitigation of the threats facing malleefowl
and their habitat a conservative approach is followed in the assessment of the benefits of the
existing management programme. A major challenge for the project is dealing with the possible
interaction of the different threats. For example, relieving the pressure from grazing by
controlling the rabbit population may in fact have a negative overall impact on the malleefowl
population if it shifts predator attention (e.g. the red fox) to the malleefowl (Benshemesh and
Burton, 1999). Ideally the management programme should address all relevant threats across the
board to ensure success.

- 5 -
Table 2: Malleefowl threats and management actions
Threat Possible management
actions References
Implementation at Lachlan
Fire
Build awareness amongst public & landholders
(Saunders, 1989) Present
Fire management plan (Benshemesh, 2007); N/A: Private land Promote traditional burning practises
(Benshemesh, 2007) N/A: Private land
Predation
Control fox population (Priddel and Wheeler, 1997); (NSW DECCW, 2010)
Absent
Control cat population (Priddel and Wheeler, 1997) N/A Control dingo/feral dog population
(Dennings, 2009); (Benshemesh, 2007)
N/A
Captive malleefowl breeding programmes
(DECCW NSW, 2011); (Priddel and Wheeler, 1997)
Absent
Grazing
Control goat population (Benshemesh, 2007) Present Control rabbit population (Benshemesh, 2007) Yes but only limited Control kangaroo population where very abundant
(Benshemesh, 2007) N/A
Restrict access of cattle/sheep to remnant habitat on private land
(Dennings, 2009); (Benshemesh, 2007) Yes but not all land
Close or fence off artificial water sources
(Benshemesh, 2007) Absent
Habitat loss
Replanting native vegetation (Benshemesh, 2007) Absent Fencing existing native vegetation (relieving total grazing pressure)
(Benshemesh, 2007) Yes, but limited
Controlling the impact of industries (e.g. mining & harvesting of mallee eucalypts)
(Benshemesh, 2007)
N/A
Protection of remaining NV on private land (e.g. Native Vegetation Act 2003 & establishment of covenants)
(Saunders, 1989); (Benshemesh, 2007)
Present
Removal of introduced weed species
(Dennings, 1998) Absent
Addressing losses due to salinity
(Benshemesh, 2007) N/A
- 6 -
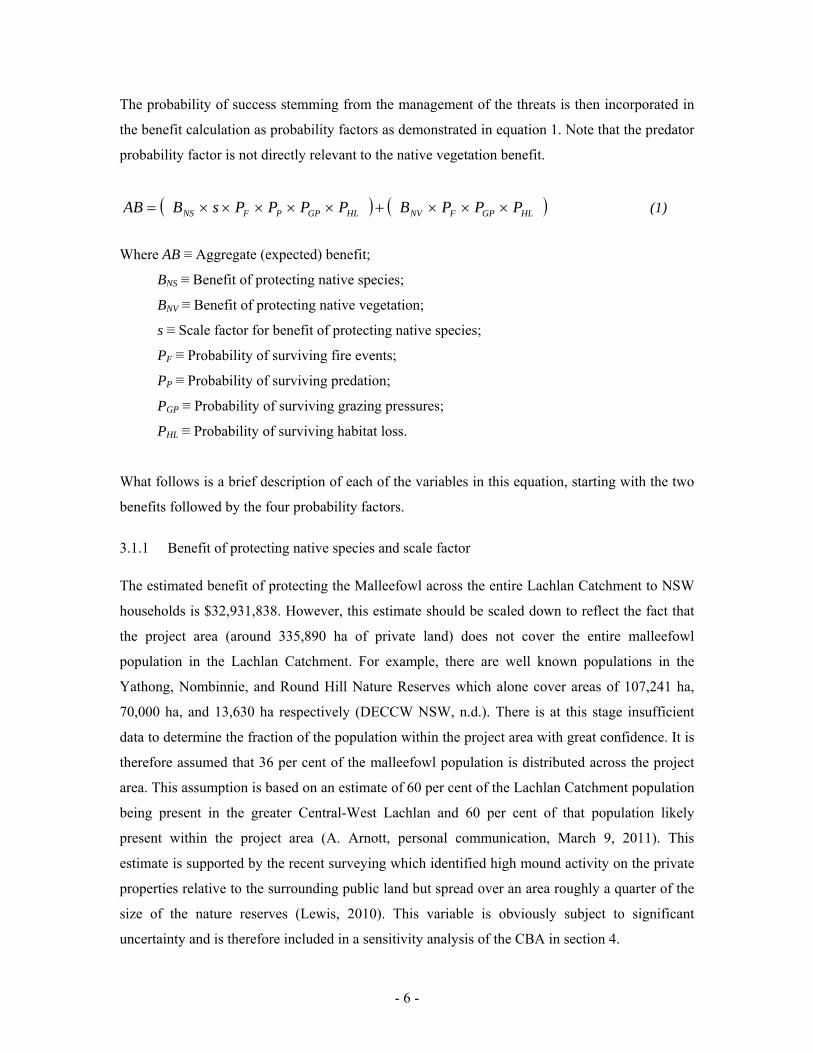
The probability of success stemming from the management of the threats is then incorporated in
the benefit calculation as probability factors as demonstrated in equation 1. Note that the predator
probability factor is not directly relevant to the native vegetation benefit.
HLGPFNVHLGPPFNS PPPBPPPPsBAB (1)
Where AB ≡ Aggregate (expected) benefit;
BNS ≡ Benefit of protecting native species;
BNV ≡ Benefit of protecting native vegetation;
s ≡ Scale factor for benefit of protecting native species;
PF ≡ Probability of surviving fire events;
PP ≡ Probability of surviving predation;
PGP ≡ Probability of surviving grazing pressures;
PHL ≡ Probability of surviving habitat loss.
What follows is a brief description of each of the variables in this equation, starting with the two
benefits followed by the four probability factors.
3.1.1 Benefit of protecting native species and scale factor
The estimated benefit of protecting the Malleefowl across the entire Lachlan Catchment to NSW
households is $32,931,838. However, this estimate should be scaled down to reflect the fact that
the project area (around 335,890 ha of private land) does not cover the entire malleefowl
population in the Lachlan Catchment. For example, there are well known populations in the
Yathong, Nombinnie, and Round Hill Nature Reserves which alone cover areas of 107,241 ha,
70,000 ha, and 13,630 ha respectively (DECCW NSW, n.d.). There is at this stage insufficient
data to determine the fraction of the population within the project area with great confidence. It is
therefore assumed that 36 per cent of the malleefowl population is distributed across the project
area. This assumption is based on an estimate of 60 per cent of the Lachlan Catchment population
being present in the greater Central-West Lachlan and 60 per cent of that population likely
present within the project area (A. Arnott, personal communication, March 9, 2011). This
estimate is supported by the recent surveying which identified high mound activity on the private
properties relative to the surrounding public land but spread over an area roughly a quarter of the
size of the nature reserves (Lewis, 2010). This variable is obviously subject to significant
uncertainty and is therefore included in a sensitivity analysis of the CBA in section 4.

- 7 -
3.1.2 Benefit of protecting native vegetation
As mentioned above, approximately 335,890 ha of land is currently being improved. However,
the area where both goats and livestock grazing are addressed is limited to 215,995 ha. Therefore
the potential benefit derived from the protection of native vegetation is conservatively limited to
the smaller area. The estimated benefit that will accrue from the protection of this area of native
vegetation comes to $4,296,537.
3.1.3 Fire
Malleefowl are particularly vulnerable to major fire events. It may take years for populations to
recover from major fires which destroy large areas of their habitat (Benshemesh, 2007).
Furthermore, due to the fractured nature of malleefowl habitat, local populations can easily
become extinct during these events. It is therefore important to have an effective fire management
plan. However, wildfire prevention through fuel-reduction burns also places pressure on the
habitat available to the species for its routine foraging activities. The need for careful
management of the habitat through a mix of old and more recently burned habitat was noted by
Hassel (2001) as a management approach for birds including the Malleefowl in a study in the
Fitzgerald River National Park in Western Australia (as cited in Bell, 2001). It is also
recommended that traditional burning practices be used where possible (Benshemesh, 2007).
Implementation of fire management plans is much more feasible in nature reserves than on a
collection of scattered private land. The vulnerability of these malleefowl populations to fire is
reflected in the low probability of survival factor of 30 per cent. Due to the inherent uncertainty
associated with this factor the sensitivity of the CBA to variability in its value is tested in section
4.
3.1.4 Predation
Relatively little is known about the interactions of different predator and prey species as most
studies focus on the impact of the removal of one predator species often on only one prey species
(Davey et al., 2006). Davey (2006) also notes the increase of feral cat populations in studies
where foxes have been removed. This can have an even greater impact on target prey species.
Nonetheless, it is generally recognised that the Red Fox (Vulpes vulpes) is one of the greatest
threats to the survival of the Malleefowl (Priddel, 1990). Foxes are known to take malleefowl at
all stages of their life cycle (Short, 2004). Many other malleefowl protection programmes make
use of fox baiting to mitigate their impact on malleefowl (and other species). Though baiting is

- 8 -
practised in the adjacent nature reserves, e.g. Yathong Nature Reserve, this project does not
control the fox population on the targeted land. There may be an indirect benefit from a reduction
of the roaming fox population through the baiting that happens on the adjacent nature reserves but
the absence of fox baiting pose a threat to the project’s malleefowl population. As a result the
probability of survival from predation factor is assumed to be relatively low (30 per cent)
compared to the other factors. This factor is also included in the sensitivity analysis in section 4.
3.1.5 Grazing Pressure
The malleefowl depends on its habitat not only for food but also organic plant material which it
uses to construct and maintain its large mounds. The material serves as a heat source in the
incubating mound as it decomposes (Jones and Birks, 1992, Weathers et al., 1993). A large
number of species are considered to be competing directly or indirectly with malleefowl for these
resources (see table 2). Of these, where present in large numbers, feral goats are known to be
particularly destructive. The significant damage caused by goats on the target land area of the
project has led to a significant proportion of the project’s resources being dedicated to goat
trapping. A reduction in the goat population should significantly improve the probability of
survival from grazing pressure. The probability of survival from grazing pressure factor is
therefore assumed to be relatively high at 70 per cent. Again, this factor is included in the
sensitivity analysis as a result of the uncertainty associated with it.
3.1.6 Habitat Loss
In a study of the impact of the land use change on avifaunal species in the 1980s across Western
Australia’s Wheatbelt, Saunders (1989) reported the local extinction of different species
including the Malleefowl. The losses were largely ascribed to an overall loss of native vegetation
coupled with the fact that the remaining native vegetation was of a fragmented nature. It stands to
reason that unless a concerted effort is made to not only protect but also improve existing native
vegetation through for instance connecting patches of vegetation, both the native vegetation and
the associated malleefowl are at risk. The implementation of fencing to reduce total grazing
pressure on important areas should, however, assist in mitigating this threat to some degree. The
probability of survival from the threat of habitat loss is assumed to be in the order of 50 per cent.
This factor is also tested in section to determine the sensitivity of the CBA to changes in it.

- 9 -
3.1.7 Aggregate (expected) Benefit Calculation
The aggregate (expected) benefit calculation is based on equation 1:
AB = ($32,931,838 x 0.36 x 0.30 x 0.30 x 0.60 x 0.50) + ($4,296,537 x 0.30 x 0.60 x 0.50)
= $706,786.
Note that the inherent uncertainty associated with assigning probabilities to the probability factors
is addressed in the sensitivity analysis (see section 4).
3.2 Costs
Project costs can be categorised as wages (W), public engagement (PE), surveying (S) and
grazing pressure relief (GP). The aggregate project cost is calculated as expressed in equation 2.
The present value (PV) of these costs are calculated at an interest rate (i) of 5 per cent and
aggregated over the past four fiscal years.
GPSPEW PVPVPVPVAC (2)
where AC ≡ Aggregate cost;
PVMC ≡ Present value of wages;
PVLC ≡ Present value of public engagement;
PVFA ≡ Present value of surveying;
PVGP ≡ Present value of grazing pressure relief.
3.2.1 Wages
Wages were a major component of the project costs and are the only cost which has been present
for the duration of the project. This reflects the fact that the project is still in an early stage of its
development where a large proportion of resources have to be assigned to establishing the project.
The annual wage costs increased from $10,617 in 2007/08 to $72,750 in 2010/11. These costs are
estimates as not all personnel are dedicated exclusively to this project. It includes the man-hours
of management personnel as well as administrative personnel who are often involved in public
engagement (A. Arnott, personal communication, January 21, 2011). The net present value of the

- 10 -
wage costs for the duration of the project when accounting for appreciation at an interest rate of 5
per cent is $203,493.
3.2.2 Public engagement
A major goal of the project has been the establishment of a strong working relationship with the
local community. Not only is it an investment for possible future involvement from the general
public but it is also crucial to the successful involvement of the local landholders which is the
focus of this project. The net present value of this cost over the four years at an interest rate of 5
per cent is $3,151.
3.2.3 Surveying
This project presented an opportunity to survey private land adjacent to nature reserves where
malleefowl communities are known to occur. The chosen method was via aerial surveying with a
helicopter, which was significantly more cost and time effective than having to hire a team to do
similar work via ground surveying (M. Lewis, personal communication, 20 March 2011). The use
of aerial surveying with a helicopter, though relatively costly, provided the best means to
establish with a high level of confidence what the present malleefowl population is on these
properties. Furthermore, the establishment of a baseline for the malleefowl population on these
properties will allow future monitoring of population growth trends and assist natural resource
managers to engage in adaptive management of the species. Surveying commenced in 2008/09
and is ongoing at present. Expenditures over the past three fiscal years were around $43,500,
$14,500 and $34,000 respectively. This amounts to a net present value of $97,184 at an interest
rate of 5 per cent.
3.2.4 Grazing pressure relief
Feral goats
On-the-ground work to mitigate threats to the malleefowl population is focussed on grazing
animals. The largest component of this cost is control of the goat population through trapping.
Goats have been identified as one of the main reasons for deterioration of the native vegetation
and as a result goat numbers have been controlled over the past two fiscal years. The area should
benefit from this action not only in the form of native vegetation conservation but also the
provision of habitat to the malleefowl. The net present value of this cost component is $148,600
(at 5 per cent appreciation over the two year period).

- 11 -
Rabbit control
Another threat to the malleefowl habitat is competition from rabbits. Only one ripping operation
took place on a property in 2009/10. Though ripping is a relatively expensive operation other
properties badly affected by rabbits may be needed. The net present value of this cost component
is $11,760.
Total grazing pressure
In order to relieve the total grazing pressure from various grazing species including non-pest
species such as kangaroos and farm livestock, funding of around $60,000 are being allocated for
fencing of strategic areas of malleefowl habitat. This management action is targeted for the
current financial year.
3.2.5 Aggregate Cost Calculation
The aggregate of the net present values of the various cost components is calculated from
equation 2:
AC = $203,493 + $3,151 + $97,184 + ($148,600 + $11,760 + $60,000) = $524,188.
3.3 Benefit-Cost Ratio
The BCR is calculated as the ratio of the aggregate benefits to the aggregate costs as summarised
in table 3.
Table 3: Summary of costs and benefits
Costs Dollars
($) Benefits Dollars
($)
Wages 203,493 Native Vegetation 386,688
Public Engagement 3,151
Surveying 97,184 Native Species 320,097
Grazing pressure relief 220,360
Aggregate Costs (AC) 524,188 Aggregate Benefits (AB) 706,786
Benefit Cost Ratio 1.35
- 12 -
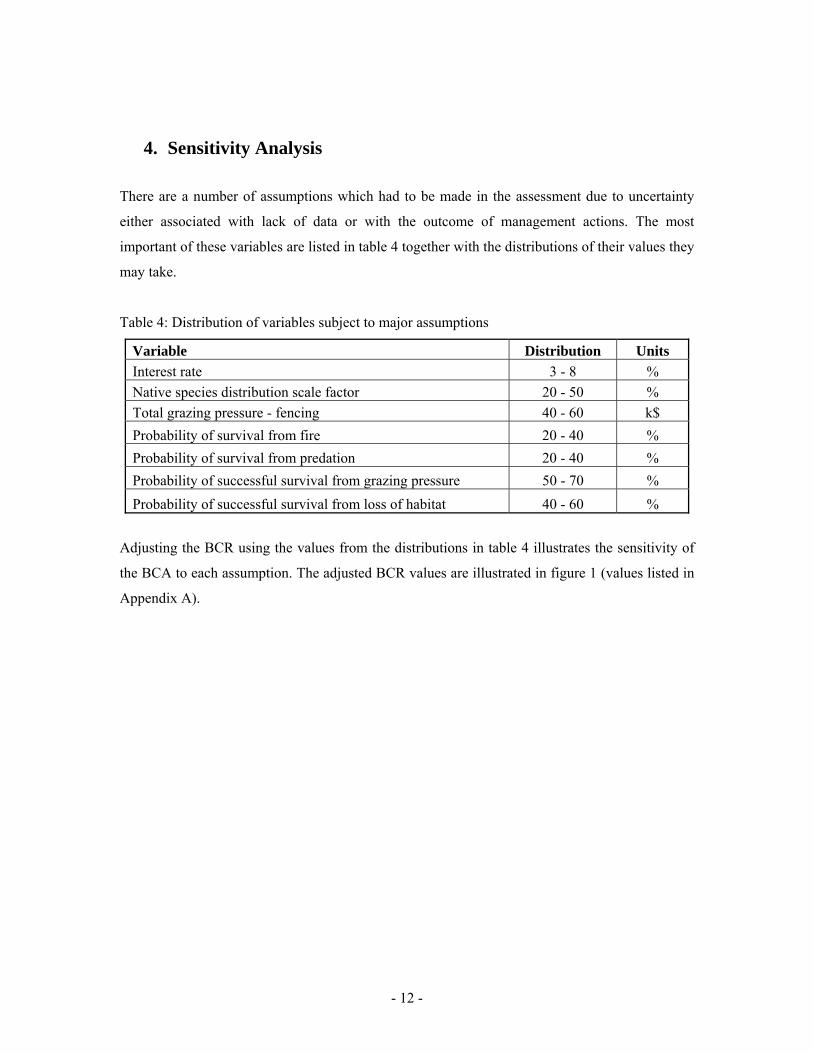
4. Sensitivity Analysis
There are a number of assumptions which had to be made in the assessment due to uncertainty
either associated with lack of data or with the outcome of management actions. The most
important of these variables are listed in table 4 together with the distributions of their values they
may take.
Table 4: Distribution of variables subject to major assumptions
Variable Distribution Units
Interest rate 3 - 8 %
Native species distribution scale factor 20 - 50 %
Total grazing pressure - fencing 40 - 60 k$
Probability of survival from fire 20 - 40 %
Probability of survival from predation 20 - 40 %
Probability of successful survival from grazing pressure 50 - 70 %
Probability of successful survival from loss of habitat 40 - 60 %
Adjusting the BCR using the values from the distributions in table 4 illustrates the sensitivity of
the BCA to each assumption. The adjusted BCR values are illustrated in figure 1 (values listed in
Appendix A).
- 13 -
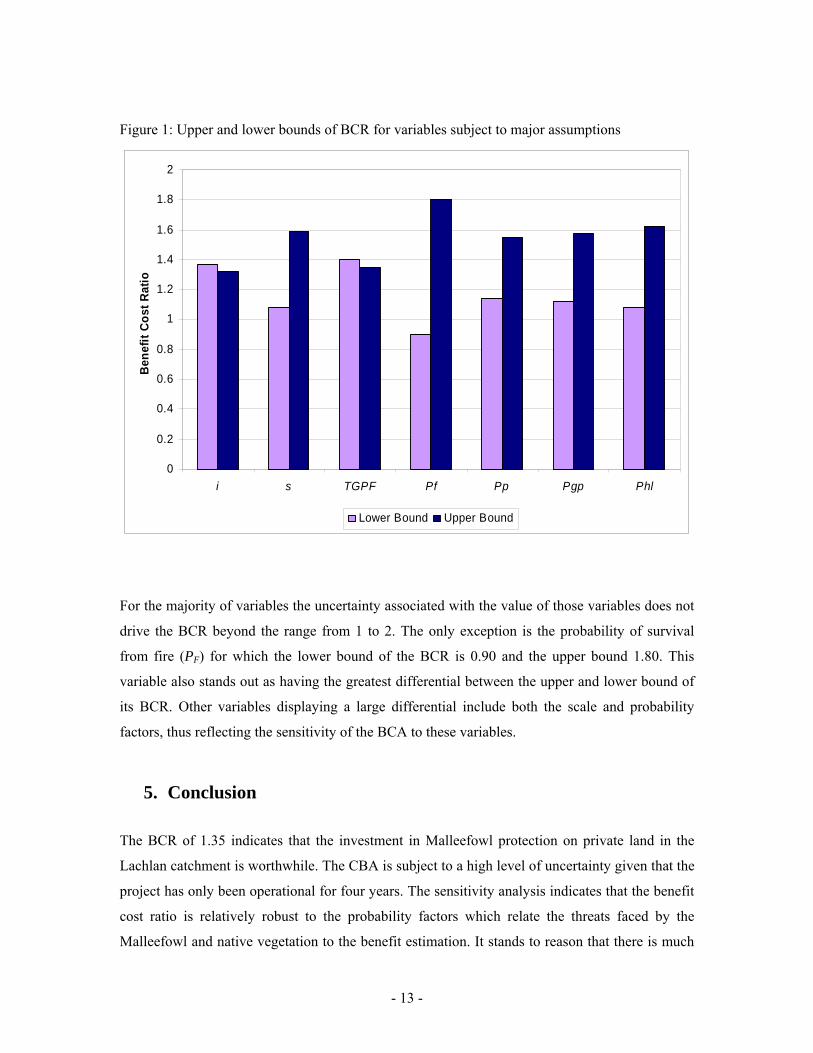
Figure 1: Upper and lower bounds of BCR for variables subject to major assumptions
0
0.2
0.4
0.6
0.8
1
1.2
1.4
1.6
1.8
2
i s TGPF Pf Pp Pgp Phl
Ben
efit
Co
st R
atio
Lower Bound Upper Bound
For the majority of variables the uncertainty associated with the value of those variables does not
drive the BCR beyond the range from 1 to 2. The only exception is the probability of survival
from fire (PF) for which the lower bound of the BCR is 0.90 and the upper bound 1.80. This
variable also stands out as having the greatest differential between the upper and lower bound of
its BCR. Other variables displaying a large differential include both the scale and probability
factors, thus reflecting the sensitivity of the BCA to these variables.
5. Conclusion
The BCR of 1.35 indicates that the investment in Malleefowl protection on private land in the
Lachlan catchment is worthwhile. The CBA is subject to a high level of uncertainty given that the
project has only been operational for four years. The sensitivity analysis indicates that the benefit
cost ratio is relatively robust to the probability factors which relate the threats faced by the
Malleefowl and native vegetation to the benefit estimation. It stands to reason that there is much
- 14 -
room for improving the BCR by addressing these threats in future which should increase the
benefits of the project.
The allocation of a large part of the available funding to monitoring activities is critical to the
establishment of a reliable baseline against which future observations can be measured, thus
allowing the progress of the management programme to be tracked and adaptively managed.
However, at this initial stage it does mean that much of the available resources are applied to
actions which do not of themselves improve the status of the malleefowl population. If in coming
years the balance of expenditure is shifted towards on-the-ground actions to improve the
probability of survival of the species such as fox baiting, then the BCR should improve
significantly. In other words, the thorough initial surveying ought to be viewed as a necessary
initial investment which should offer returns in the long run but which at this stage translates into
a relatively lower return on investment.
Examples of possible management actions taken in other locations include breeding programmes
(though with limited success) (Priddel and Wheeler, 1997) and habitat restoration in addition to
expansion of the predator and grazing control programme beyond foxes and goats to for example
include cats and rabbits. The investment in community engagement is aimed at generating future
involvement in on-the-ground work. For instance, volunteers have provided valuable assistance
in malleefowl management programmes elsewhere by participating in surveying. The
involvement of the local community could also serve to encourage private landholders to protect
the remnant native vegetation on their land as described by Saunders (1989, p.115): “One
important step towards involving people must be to encourage them to collect data on the natural
resources of their immediate area and to monitor changes within remnants. It is only by making
people aware of their natural heritage and the changes their habitat is undergoing that they can be
mobilised to protect it.”

- 1 -
References BELL, D. (2001) Ecological response syndromes in the flora of southwestern Western Australia:
Fire resprouters versus reseeders. The Botanical Review, 67, 417-440. BENSHEMESH, J. (2007) National Recovery Plan for Malleefowl. Department for Environment
and Heritage, South Australia. BENSHEMESH, J. & BURTON, P. (1999) Fox predation on Malleefowl three years after the
spread of RCD in Victoria. Parks Victoria and Department of Natural Resources and Environment, Mildura.
BOARDMAN, A. E., GREENBERG, D. H., VINING, A. R. & WEIMER, D. L. (2006). Cost-
Benefit Analysis: Concepts and Practice, Pearson Education, New Jersey. BRERETON, R., BENNETT, S. & MANSERGH, I. (1995) Enhanced greenhouse climate change
and its potential effect on selected fauna of south-eastern Australia: A trend analysis. Biological Conservation, 72, 339-354.
CAMPBELL, H. F. & BROWN, R. P. C. (2003). Benefit-Cost Analysis: Financial and Economic
Appraisal using Spreadsheets, Cambridge University Press, Port Melbourne, Australia. DAVEY, C., SINCLAIR, A. R. E., PECH, R. P., ARTHUR, A. D., KREBS, C. J., NEWSOME,
A. E., HIK, D., MOLSHER, R. & ALLCOCK, K. (2006) Do Exotic Vertebrates Structure the Biota of Australia? An Experimental Test in New South Wales. Ecosystems, 9, 992 – 1008.
DECCW NSW (2011) Malleefowl [Online]. Department of Environment, Climate Change and
Water Available: http://www.environment.nsw.gov.au/animals/TheMalleefowl.htm [Accessed 25 February 2011].
DECCW NSW (n.d.) Reserve types in NSW - Nature reserve [Online]. Department of
Environment, Climate Change and Water. Available: http://www.environment.nsw.gov.au/nationalparks/parktypes.aspx?type=naturereserve [Accessed].
DENNINGS, S. Year. “Its Gnow or Never”: a case study of community action for malleefowl
conservation in the wheatbelt area of Western Australia. In: VAN ACHTERBERG, C., ed. Third International Megapode Symposium, 1998 Leinden. Zoologische Verhandelingen.
DENNINGS, S. (2009) A Community Search for Malleefowl at Menangina Station. Heron
Resources Limited, Perth. DEPARTMENT OF SUSTAINABILITY, E., WATER, POPULATION AND COMMUNITIES
(2011) Leipoa ocellata — Malleefowl [Online]. Canberra: Department of Sustainability, Environment, Water, Population and Communities. Available: http://www.environment.gov.au/cgi-bin/sprat/public/publicspecies.pl?taxon_id=934 [Accessed 28 February 2011].

- 2 -
FORD, H. A., BARRETT, G. W., SAUNDERS, D. A. & RECHER, H. F. (2001) Why have birds in the woodlands of Southern Australia declined? Biological Conservation, 97, 71-88.
HANLEY, N. & BARBIER, E. B. (2009). Pricing Nature: Cost-Benefit Analysis and
Environmental Policy, Edward Elgar, Cheltenham, UK. JONES, D. & BIRKS, S. (1992) Megapodes: Recent Ideas on Origin, Adaptations and
Reproduction. TREE, 7, 88-91. LACHLAN CMA (2010) Lachlan Catchment Management Authority Annual Report 2010.
Lachlan Catchment Management Authority, Forbes, NSW. LEWIS, M. (2010) Draft Progress Report: Conservation of endangered Malleefowl Leipoa
ocellata within the Lachlan Catchment. Lachlan Catchment Management Authority. MAZUR, K. & BENNETT, J. (2009) Choice Modelling Survey of Community Attitudes to
Improvements in Environmental Quality in NSW Catchments. EERH Report No 13, Australian National University, Canberra.
NSW DECCW (2010) Draft Threat Abatement Plan for Predation by the Red Fox (Vulpes
vulpes). NSW Department of Environment, Climate Change and Water, Hurstville. PRIDDEL, D. (1990). Conservation of the malleefowl in New South Wales: an experimental
management strategy. In: J. C. NOBLE, P. & JONES, J. J. G. K. (eds.) The mallee lands: a conservation perspective. CSIRO, Melbourne.
PRIDDEL, D. & WHEELER, R. (1997) Efficacy of Fox Control in Reducing the Mortality of
Released Captive-reared Malleefowl, Leipoa ocellata. Wildlife Research, 24, 469 – 482. SAUNDERS, D. A. (1989) Changes in the Avifauna of a Region, District and Remnant as a
Result of Fragmentation of Native Vegetation: the Wheatbelt of Western Australia: A Case Study. Biological Conservation, 50, 99-135.
SHORT, J. Year. Conservation of the Malleefowl: are there lessons from the successful
conservation of native mammals by intensive fox control? In: Proceedings of the National Malleefowl Forum, 2004 Mildura. Victorian Malleefowl Recovery Group, 54 - 68.
SMITH, P. J., PRESSEY, R. L. & SMITH, J. E. (1994) Birds of particular conservation concern
in the Western Division of New South Wales. Biological Conservation, 69, 315-338. WEATHERS, W. W., SEYMOUR, R. S. & BAUDINETTE, R. V. (1993) Energetics of mound-
tending behaviour in the malleefowl, Leipoa ocellata (Megapodiidae). Animal Behaviour, 45, 333-341.

- 1 -
Appendix A. Upper and lower bounds of the BCR for variable subject to major assumptions Variable Value BCR
Interest rate: Lower bound 3% 1.37
Interest rate: Upper bound 8% 1.32
Native species benefit scale factor: Lower bound 20% 1.08
Native species benefit scale factor: Upper bound 50% 1.59
Total grazing pressure - fencing: Lower bound $40k 1.40
Total grazing pressure - fencing: Upper bound $60k 1.35
Probability of survival from fire: Lower bound 20% 0.90
Probability of survival from fire: Upper bound 40% 1.80
Probability of survival from predation: Lower bound 20% 1.14
Probability of survival from predation: Upper bound 40% 1.55
Probability of successful survival from grazing pressure: Lower bound 50% 1.12
Probability of successful survival from grazing pressure: Upper bound 70% 1.57
Probability of successful survival from loss of habitat: Lower bound 40% 1.08
Probability of successful survival from loss of habitat: Upper bound 60% 1.62