Embed Size (px)
Citation preview

i
ISSN 1835-9728
Environmental Economics Research Hub
Research Reports
An Integrated Assessment approach to linking
biophysical modelling and economic valuation tools
Marit Kragt, Jeff Bennett and Tony Jakeman
Research Report No. 53
March 2010
About the authors
Marit Kragt is a PhD Student at the Crawford School of Economics and Government, Australian National University, Canberra ACT 0200, AUSTRALIA Jeff Bennett is a Professor at the Crawford School of Economics and Government at the Australian National University. Tony Jakeman is a Professor at the Fenner School of Environment and Society at the Australian National University.
E-mail: [email protected]

ii
Environmental Economics Research Hub Research Reports are published by The
Crawford School of Economics and Government, Australian National University,
Canberra 0200 Australia.
These Reports present work in progress being undertaken by project teams within
the Environmental Economics Research Hub (EERH). The EERH is funded by the
Department of Environment and Water Heritage and the Arts under the
Commonwealth Environment Research Facility.
The views and interpretations expressed in these Reports are those of the author(s)
and should not be attributed to any organisation associated with the EERH.
Because these reports present the results of work in progress, they should not be
reproduced in part or in whole without the authorisation of the EERH Director,
Professor Jeff Bennett ([email protected])
Crawford School of Economics and Government
THE AUSTRALIAN NATIONAL UNIVERSITY
http://www.crawford.anu.edu.au

iii
Table of Contents
Abstract iv
1. Introduction 1
2. Analytical Framework 2
3. Tools 5
4. The George Catchment Model 8
5. Results 13
6. Discussion and Conclusions 16
References 17
Appendix 1 20
Appendix 2 21
Appendix 3 23

iv
Abstract
Natural resource management (NRM) typically involves complex decision problems that
affect a wide variety of stakeholder values. Efficient NRM that achieves the greatest
environmental, social and financial net benefits, necessitates assessments of the
environmental impacts, costs and benefits of investments in an integrated manner. Integrated
assessment (IA) provides an approach to incorporate the several dimensions of catchment
NRM by considering multiple issues and knowledge from various disciplines and
stakeholders. Despite the need for IA, there are few studies that integrate biophysical
modelling tools with economic valuation.
In this paper, we demonstrate how economic non-market valuation tools can be used to
support an IA of catchment NRM changes. We develop a Bayesian Network model that
integrates a process-based water quality model, ecological assessments of native riparian
vegetation, estimates of management costs and non- market (intangible) values of changes in
riparian vegetation. The modelling approach illustrates how information from different
sources can be integrated in one framework to evaluate the environmental and economic
impacts of NRM actions, as well as the uncertainties associated with the estimated welfare
effects. The estimation of marginal social costs and benefits enables a Cost-Benefit Analysis
of alternative management intervention, providing more economic rationality to NRM
decisions.
Keywords: Bayesian Networks; Bio-economic modelling; Catchment Management;
Cost-Benefit Analysis; Environmental values; Integrated Assessment and Modelling; Non-
market valuation; Riparian Vegetation

An IA approach to linking biophysical models and economic valuation
Paper submitted to iEMSs 2010 1
1. Introduction
Natural resource management (NRM) typically involves complex decision problems that
involve a variety of issues and evolve in a dynamic social context (Ritchey, 2004; Letcher and
Giupponi, 2005). There may be a range of perspectives among stakeholders about the values
at stake, varying from environmental and ecological issues to social and economic concerns.
It is increasingly acknowledged that catchment NRM requires integrated approaches to
address all the potential economic, social and environmental impacts of policy decisions
(Letcher and Giupponi, 2005). An integrated assessment (IA) approach to catchment NRM
aims to integrate and share scientific and stakeholder knowledge drawn from multiple
disciplinary backgrounds, in order to evaluate a decision problem from different perspectives
and provide support for its solution (TIAS, 2009). Different tools, methods and procedures
are needed to inform the different phases of the assessment process, for example biophysical
modelling tools, participatory methods and cost-effectiveness analysis (De Ridder et al.,
2007).
Integrated catchment management calls for targeted investments to achieve the greatest
environmental, social and financial net benefits (NWI, 2004). If IA is to support the
development of efficient catchment NRM, all the marginal social costs and benefits
associated with the impacts of alternative NRM actions need to be assessed. However, despite
the policy interest and identified need for IA, there are few studies that integrate
environmental impact assessments with economic analysis of marginal costs and benefits in a
robust framework to guide NRM decisions (Kirkpatrick and Lee, 1999; Croke et al., 2007).
Economics valuation tools can improve the estimates of marginal social costs and benefits of
NRM changes. Non-market values are expressed in monetary terms, allowing for a direct
comparison of the trade-offs between different environmental impacts. The decision
framework for economic valuation is based on cost-benefit analysis (CBA). CBA can support
economically rational decision making by systematically assessing and comparing the
marginal social costs and benefits of catchment NRM actions. The decision rule is that if the
benefits of a policy change exceed its costs by a larger amount than any other management
alternative, then the proposed policy should be adopted. Traditionally, CBA has focused on
financial analysis and the scientific underpinning of CBA has often been poor (Brouwer et al.,
2003: 35). The limited integration of biophysical modelling into traditional CBA studies
reduces their flexibility to assist in the formulation and assessment of efficient policies.
In this paper, we demonstrate how economic valuation tools can be integrated with
predictions of biophysical changes in one modelling framework. An IA approach underlies
the development of an integrated Bayesian Network (BN) model of NRM changes in the
George catchment, Tasmania. We show how the model can be used to support a CBA of

An IA approach to linking biophysical models and economic valuation
Paper submitted to iEMSs 2010 2
catchment management decisions. In the next section, the analytical framework that underlies
this study is described. It is shown were biophysical and economic tools and techniques can
be used to inform the IA process, and how IA can be combined with CBA to support
economically efficient NRM decisions. The various tools that were used to predict impacts of
NRM actions on catchment water quality, native riparian vegetation and non-market
environmental values are briefly described in Section 3. The model development process and
the techniques used to integrate information about multiple systems in the BN model are
described in Section 4. The results are illustrated by a model scenario in Section 5. A final
section concludes.
2. Analytical framework
The dynamic nature and multiple dimensions of catchment NRM problems require integrated
assessment (IA) approaches to help inform and design targeted policies that, in theory,
achieve the greatest net social benefit. In order to evaluate the net benefits of alternative
policy investments in a CBA decision framework, all the marginal costs and benefits
associated with a management change need to be estimated. Environmental changes and
financial costs and benefits of NRM changes may be relatively easy to estimate. However,
changes in catchment environments will also impact non-market values that people derive
from ecosystem goods and services (Hanley and Barbier, 2009: 40). Predicting the changes in
these non-market costs and benefits requires the use of non-market valuation techniques.
Although there are challenges involved in estimating non-market values (Hanley and Barbier,
2009: 55-61, 67-70 and 91-93), not accounting for non-market values of environmental
impacts may lead to a misallocation of resources and less efficient decision making (Bennett,
2005).
We propose the use of an IA approach to assess the changes in environmental1 and socio-
economic systems resulting from catchment NRM changes. IA provides a flexible and
multidisciplinary approach to identifying and predicting the impacts on multiple systems. The
iterative nature of the IA approach to policy assessments recognises that catchment systems
continuously evolve, changing the context of the system and leading to the emergence of new
issues and values (Ritchey, 2004).
1 In this paper, the term ‘environmental’ refer to natural systems and impacts on biophysical indicators.

An IA approach to linking biophysical models and economic valuation
Paper submitted to iEMSs 2010 3
Figure 1 Analytical steps in an IA process to policy analysis
The set of tools and techniques that is used to carry out an IA should be adapted to the
requirements of the issue under consideration (Lee, 2006). Different tools can be used to
inform different stages of the assessment process (De Ridder et al., 2007). For example,
participatory techniques may be useful to gain an understanding about the existing economic,
environmental and social context of the issue. Conceptual influence diagrams may be used to
describe the multiple system variables and their interrelationships. The identification of
alternative policy strategies can be aided by surveys, focus group discussions or other tools
such as General Morphological Analysis (Ritchey, 2004). A prediction of environmental or
socio-economic changes can be based on biophysical models or economic valuation tools.
Evaluating the likely outcomes of alternative policies requires the use of decision support
tools such as cost-benefit or cost-effectiveness analysis (Ward, 2009).
The research context
Defining the research context requires an understanding about the system variables that are
related to the issue under consideration and the interrelationships between them (Jakeman et
al., 2006). This entails a description of the biophysical drivers and processes, as well as an
analysis of institutions, the affected population, the spatial scales and time periods involved.
One major feature of IA is the identification of interest groups and a recognition of different
1. Understanding the context of the issue
2. Identifying
policy changes
3. Predicting
environmental impacts
4. Predicting socio-
economic impacts
Assessing the impacts of a change in the system context on a range of biophysical indicators (using,
e.g., biophysical modelling tools)
Estimating the economic value impacts of management and environmental changes on human
welfare (using, e.g., economic valuation tools)
Describing the system variables and interactions, analysing the institutional and policy context,
identifying the stakeholders involved as well as the system’s spatial and temporal boundaries
5. Policy
evaluation
Evaluate the impacts of alternative policy actions on the system under consideration (using, e.g. cost-
benefit analysis as a decision making framework)
Characterising the (policy) scenarios to be considered -which may include controllable and
uncontrollable factors- and specifying the indicators used to assess impacts.
IA phases

An IA approach to linking biophysical models and economic valuation
Paper submitted to iEMSs 2010 4
stakeholder concerns. Stakeholders may include different scientific disciplines, model
developers, natural resource managers, and/or local landholders, who will typically have
different (and sometimes conflicting) ideas about the issues at stake. An iterative IA approach
that involves multiple stakeholders can strengthen a shared understanding about the issue
under consideration.
Policy changes
The aim of the second phase is to identify the alternative future policy actions that may be
undertaken to address the issues identified in the first step (De Ridder et al., 2007). IA
recognises that catchment NRM problems are often not well-defined. A wide range of
management scenarios may need to be considered, and these scenarios may need to be
amended or refined as the assessment proceeds (Lee, 2006). It is important that the policy
scenarios match the (scientific, political and socio-economic) context of the system and are
relevant to the stakeholders involved. A characterisation of multiple policy scenarios enables
a comparison of the impacts of alternative courses of actions. One of the courses of action
should include an analysis of a status quo scenario: the future effects of ‘doing nothing’
(Dobes, 2009: 48). This establishes the baseline, against which the impacts of alternative
policies are assessed.
Environmental impacts
All the potential impacts of the alternative policy actions specified in phase two need to be
assessed. This includes an analysis of impacts on bio-physical processes. Science-based
modelling tools are useful to represent the interactions between management actions and
environmental systems, and to predict the changes in a range of (biophysical) indicators that
are impacted by NRM changes. An important feature of IA in this phase is an analysis of the
risks and uncertainties in modelling inputs, structure and model predictions (Jakeman and
Letcher, 2003).
Socio-economic impacts
An economic valuation of all the relevant impacts of NRM actions is required to allow an
assessment of the costs and benefits of alternative policy scenarios. IA modelling studies
often focus on natural systems, with a sparse representation of socio-economic costs and
benefits (Ward, 2009). Economic tools are needed to estimate the impacts of NRM changes
on socio-economic values in monetary terms. The use of money as an indicator of changes
allows for a direct analysis of the trade-offs between different systems (such as water quality
and biodiversity).2 All the market and non-market impacts of a policy change are valued over
2 Note that an assessment of physical impacts remains an essential prerequisite to environmental valuation

An IA approach to linking biophysical models and economic valuation
Paper submitted to iEMSs 2010 5
the time period of the project, and discounted into present value terms (Dobes, 2009; Hanley
and Barbier, 2009).
Policy evaluation
An IA of catchment NRM implies an analysis of changes in multiple systems and output
indicators. This approach reflects different stakeholder perspectives and shows the complexity
of the interactions between natural and human systems. However, the use of multiple
indicators in the assessment means that impacts are measured in disparate units, which does
not allow for a comparison of impacts in a meaningful way (Brouwer et al., 2003: 32). Cost-
benefit analysis provides a decision making framework to consistently compare NRM impacts
by measuring all impacts in identical (monetary) units. This enables an analysis of the trade-
offs between the marginal costs and benefits of alternative policy proposals and can aid
decision makes to evaluate the economic efficiency of management changes.
3. Tools
In the research described in this paper, multiple tools are used to inform different phases of
the IA process. The principal research objective is to demonstrate how IA can be used to
integrate environmental modelling predictions with economic information on the non-market
costs and benefits of catchment management changes. The IA process and integration of tools
are demonstrated by developing an integrated model for a case study of the George catchment
in Tasmania. Knowledge uncertainties about environmental system processes and human-
environment interactions are explicitly considered in the modelling approach, allowing an
analysis of the risks associated with catchment NRM changes. Acknowledging the diversity
of perspectives about catchment management issues, this study engages multiple academic
disciplines along with public and other stakeholder representatives.
The first phases of the project were aimed at gaining an understanding of the George
catchment system. A complete assessment of all the processes and interactions between
variables was not feasible, if possible at all, within the time frame of this study. Subsequent
phases therefore narrowed down to assessing changes in ecosystem indicators that were
considered to affect human welfare.
Water quality modelling
A physically based, semi-distributed catchment model was developed for the George
catchment to predict the impacts of different management actions on river flows, sediment
delivery and nutrient loads, calculated as steady-state averages (Kragt and Newham, 2009).
The model was based on the Catchment Scale Management of Diffuse Sources framework
(CatchMODS - Newham et al., 2004). CatchMODS requires a relatively small number of

An IA approach to linking biophysical models and economic valuation
Paper submitted to iEMSs 2010 6
parameters and has already been developed and successfully tested in other parts of Australia
(Newham et al., 2004; Drewry et al., 2005; Vigiak et al., 2009). The framework integrates a
range of process-based hydrologic, erosion and economic sub-models to simulate the effects
of different management interventions on various sources of pollution (Figure 2). Scenarios
that were considered in the George catchment application include land-use changes, stream-
bank remediation actions and riparian-zone revegetation (Kragt and Newham, 2009).
Figure 2 CatchMODS framework (Adapted from Newham et al., 2004)
Choice Experiments
Information about the non-market value impacts of changed catchment NRM was elicited
using choice experiment (CE) techniques. CEs use a survey in which respondents are
presented with a series of choice questions describing the outcomes of alternative
hypothetical policy scenarios (Bennett and Blamey, 2001; Hensher et al., 2005). The
outcomes are described in terms of different levels of a monetary attribute (costs) and several
non-marketed attributes. Respondents are asked to choose their preferred option in each
choice question. This allows an analysis of the trade-offs that respondents make between
attributes. If cost is included as one of the attributes, these trade-offs can be used to estimate
the marginal value of each environmental attribute in monetary terms. The CE technique is
especially useful in cases where management decisions are expected to affect an array of
attributes and where policy makers are interested in the trade-offs between attributes (Bennett
and Blamey, 2001).
For the present study, a CE survey was developed using a combination of literature review,
biophysical modelling, interviews with science experts and regional natural resource
managers and feedback from focus group discussions (Kragt and Bennett, 2008). An example
choice question is shown in Figure 3. The survey was administered in various regions in
Tasmania between November 2008 and March 2009.
Gully erosion
sources
Road erosion
sources
Hillslope erosion
sources
Point sources
Urban sources
Groundwater sources
Downstream output
Costs
Streambank erosion sources
Tributary inputs
Land use, management practices and remediation
Stream link
Nutrient uptake
Floodplain deposition
Remediation actions
Costs
Climate change

An IA approach to linking biophysical models and economic valuation
Paper submitted to iEMSs 2010 7
Figure 3 Example choice question in the George catchment CE (Source: Kragt and Bennett,
2009b)
Bayesian Networks
A major challenge in this study was the integration of knowledge from different sources about
changes in catchment systems. A process-based model provided predictions of water quality
changes, literature values and expert judgements were used to assess changes in ecosystem
variables, and CE survey data provided information about non-market value impacts. These
different data sources needed to be combined into a logically consistent modelling
framework. A further challenge was the representation of knowledge uncertainty about
biophysical and socio-economic systems and the interactions between them. A modelling
technique that can incorporate different data sources and represent uncertainties are Bayesian
Networks (BNs - Pearl, 1988). In this research, BN modelling techniques are used to predict
changes in native riparian vegetation and to link the information about multiple catchment
systems in a single integrated model for decision support.
BNs (sometimes called belief networks) are probabilistic graphical models, consisting of a
directed acyclic graph of variables (called ‘nodes’). The values each variable can assume are
classified into discrete, mutually exclusive, ‘states’. These states can be defined in
quantitative levels (e.g. <50, 50-150, 150-300 and >300mg/L) or as qualitative categories
(e.g. ‘decrease’, ‘no change’, and ‘decrease’), enabling the use of different data sources,
including expert opinion when observational data is not available (Pearl, 1988). The
propagation of information between variables is described by conditional probability tables.
Unlike most integrated modelling approaches, BNs thus use probabilistic, rather than
deterministic, expressions to describe the relationships between variables (Borsuk et al.,
2004).
BNs are widely used for knowledge representation and reasoning under uncertainty in NRM
and have been applied to different catchment issues (see, for example, Bromley et al., 2005;
McCann et al., 2006; Castelletti and Soncini-Sessa, 2007). There are, however, few BN

An IA approach to linking biophysical models and economic valuation
Paper submitted to iEMSs 2010 8
applications that focus on economic impacts of environmental changes. We found only one
BN publication that has incorporated non-market costs and benefits of catchment
management changes (Barton et al., 2008). In that study, financial costs of nutrient abatement
measures and impacts of changed land management practices on lake water quality in the
Morsa catchment, Norway were analysed. The integration of the expected abatement costs
and environmental impacts enabled a cost-effectiveness ranking of abatement measures. The
non-market benefits of improved water quality on recreation were also evaluated, using
results from a 1994 contingent valuation survey. Combining the economic valuation of water
quality benefits to abatement costs allowed a cost-benefit analysis of alternative management
actions in the catchment. The study showed that accounting uncertainty through a BN
modelling approach could conflict with the outcomes of deterministic cost-effectiveness or
cost-benefit analyses. However, the economic data collected in Barton et al. (Barton et al.,
2008) was not specifically designed to match the biophysical modelling predictions.
Synchronous model development could have improved the integration of biophysical and
economic knowledge.
4. The George catchment model
The IA study described in this paper demonstrates the integration of environmental modelling
predictions with economic information in a BN model of catchment management in
Tasmania. A multidisciplinary process involving researchers from various disciplines was
used to select a study area that was suitable for both the biophysical modelling and the
economic research. The George catchment, in North-Eastern Tasmania, was chosen as a
suitable study area because scientific monitoring data were available for catchment
hydrology, water quality and ecosystem conditions and because the catchment has significant
socio-economic values through its environmental assets, recreational values and aquaculture
production in the estuary. Land use in the catchment is dominated by native vegetation, native
forestry, forest plantations and agriculture. Although the catchment environment is currently
in good condition (Davies et al., 2005), there are significant concerns that land use changes
are affecting catchment ecosystem conditions (Sprod, 2003; BOD, 2007).
In the first phase of the IA process, a conceptual influence diagram was developed to define
the scale and scope of the system under consideration. Natural scientists, policy makers and
community stakeholders were involved in the conceptual model development3, to ensure that
3 The consultation process involved three workshops with Tasmanian scientist between November 2007 and September 2008, 31 structured interviews with experts on river health, threatened species, bird ecology, forestry management, riparian vegetation, estuary ecology and local natural resource

An IA approach to linking biophysical models and economic valuation
Paper submitted to iEMSs 2010 9
the considered variables and links between variables matched the scientific and policy context
of the system. The geographical scale of the system was based on the contours of the George
catchment, delineated using digital elevation models. A projection of changes in the next
twenty years was considered an appropriate time frame from both a biophysical and socio-
economic modelling perspective. The model development was an iterative process, aimed at
identifying a parsimonious model that would represent the interactions between catchment
management actions and environmental variables that impact human welfare (Kragt and
Bennett, 2009a; Kragt et al., 2009). The conceptual model for the George catchment
(Appendix 1) incorporated three main ecosystem indicators (used as attributes in the CE
survey): native riparian vegetation, number of rare native species and the area of seagrass in
the estuary. Local management changes that impact these ecosystem attributes are: (i) Stream-
bank engineering works; (ii) Riparian zone management through limiting stock access to
rivers and establishing buffer zones; (iii) Changed catchment land use; and (iv) Vegetation
management through weed removal. Some of these actions are already being implemented in
the George catchment on a small scale, which increases the plausibility of the management
scenarios for respondents to the CE study.
There was not enough information about changes in all the variables included in the
conceptual model (Appendix 1) to develop a fully functioning Bayesian Network (BN) for the
whole George catchment system. To adequately populate the conditional probability tables
for all variables, one needs to know the probability that a certain state is observed at every
possible combination of the input variables. Within the time frame of this study, it was not
feasible to collect data about all the variables in the conceptual model and specify the
relationships between them as probability distributions. Research efforts therefore focused on
a sub-section of the conceptual model. A BN was developed that integrates the costs of
management actions (stream-bank engineering, establishing riparian buffer zones, changing
catchment land use and weed management) with predictions of river water quality (flows and
total suspended sediment, phosphorus and nitrogen loads), native riparian vegetation length
and non-market values (Figure 4). Each of the model variables is described in more detail in
Appendix 2. The different techniques used to predict the levels of the variables and the ways
in which they were integrated into one BN model are described below.
managers and eight focus group discussions with members of the public in Hobart, St Helens and Launceston in February and August 2008.

An IA approach to linking biophysical models and economic valuation
Paper submitted to iEMSs 2010 10
Household WTP for native riparianvegetation ($/km)
Catchmentland use
Establishing riparianbuffer zones
Stream-bank
engineering
PV of catchmentland use ($m)
Costs (PV) of undertakingstream-bankengineering works ($)
River totalnitrogen (t/yr)
Riverflow (ML/yr)
River totalphosphorus (t/yr)
River totalsuspendedsediment (t/yr)
Aggregation assumptions(# of households with apositive WTP)
Weedmanagement
Costs (PV) ofestablished riparianbuffer zones ($)
Length of
NativeRiparianVegetation
Non-market valueof nativeriparian vegetation ($m)
Native Veg in
riparian zone given differentland uses (km)
Figure 4 Integrated model for predicting water quality changes, impacts on native riparian vegetation, and changes in economic costs and benefits in the George catchment
Predicting management costs
The main focus of this research was the integration of environmental modelling and non-
market valuation. However, in order to demonstrate how the integrated assessment and
modelling approach can be used in a CBA, the direct costs associated with implementing and
maintaining management actions were included in the model. Assumptions about the costs of
NRM in the George catchment were based on literature values (Appendix 3). The impacts of
land use changes were represented as the change in aggregate present values (PVs) of
different land use scenarios in the George catchment. The costs of establishing riparian buffer
zones and stream-bank engineering works were calculated as the PV of the summed one-off
implementation costs and discounted maintenance costs over a twenty year period. A discount
rate of three percent was used in the PV calculation. It is worth noting here that the BN could
be extended with a ‘discount rate’ node to show how alternative discount rates would impact
the predicted management costs.
Notwithstanding efforts to obtain accurate information, the knowledge about management
costs in the George catchment remains limited. Uncertainties arise from, for example,
knowledge gaps about the returns to land use, the types of materials used and the labour time
involved in implementation and maintenance. These uncertainties are represented in the BN
model by estimating a range of costs, rather than a single value (Appendix 3). Given the
limited number of data-sources and the high levels of uncertainty in knowledge, the predicted
costs should be seen as an illustration rather than reliable estimates for a CBA.
Predicting water quality changes
The process-based George-CatchMODS water quality model was used to predict the impacts
of management changes on steady state average mean annual river flow (MAF in ‘000

An IA approach to linking biophysical models and economic valuation
Paper submitted to iEMSs 2010 11
ML/year) and steady state average loadings of total suspended sediment (TSS in tonnes/year),
total phosphorus (TP in tonnes/year) and total nitrogen (TN in tonnes/year) to the George
catchment streams and estuary. Monte Carlo simulations of the George-CatchMODS model
were run that combined different scenarios of land use changes with varying lengths of
stream-bank engineering works and riparian buffer. The results from the Monte Carlo
simulations were used to define the conditional probability distributions for the water quality
variables. Uncertainties in the predictions arise from uncertainty in the model parameters and
were specified as an uncertainty bound around the deterministic predictions from the George-
CatchMODS model.
Predicting impacts on native riparian vegetation
The impacts of NRM actions on native riparian vegetation were predicted based on
information collected through literature reviews and expert interviews (Kragt and Bennett,
2008).4 The most important management actions assumed to impact native riparian vegetation
in the George catchment are land use changes, establishing riparian buffer zones5 and weed
management in the catchment (Figure 4). An intermediate node (‘Native Veg in riparian zone
given different land uses’) was included to measure the length of native vegetation in the
riparian zone under different land use scenarios. Assumptions about the proportion of the
riparian zone that is likely to be vegetated under each land use, and the ‘naturalness’ of that
vegetated riparian zone were based on Tasmanian digital vegetation mapping (DPIW, 2005a;
DPIW, 2005b) and expert review (Table 1).
Table 1 Modelling assumptions about the percentage of native vegetation in the riparian zone under different land uses
Land use % of total riparian zone likely
to be vegetated % of native vegetation
Native vegetation non-production 100 80
Native production forest 90 70
Forestry plantations 80 30
Grazing pastures 0 -
Irrigated agriculture 0 -
Urban areas 0 -
4 The review included regional, State and National documents about the impacts of catchment management on native vegetation conditions, and previously developed models of vegetation changes in river catchments. Structured interviews were conducted with Tasmanian experts on river health and riparian vegetation. 5 Note that establishment of riparian buffer does not change catchment land use in our model

An IA approach to linking biophysical models and economic valuation
Paper submitted to iEMSs 2010 12
The ‘Length of Native Riparian Vegetation’ variable in Figure 4 measures the total length of
rivers in the George catchment with healthy native vegetation along both sides of the river.
The intermediate node ‘Native Veg given land use’ was assumed to contribute directly to the
total Length of Native Riparian Vegetation in the George catchment. The base case
assumption was that agricultural and urban areas did not have any vegetation in their riparian
zones, but that the establishment of riparian buffers and weed management could increase
this. The ‘nativeness’ of the newly established riparian buffers depend on the type of
vegetation that is planted and the extent of weed management in the riparian zone (Daley,
2008). It was assumed different weed management scenarios would result in different
proportions of native vegetation in the established riparian buffer:
• ‘low’ weed management → 15 percent of healthy native vegetation in the established
riparian buffer zones;
• ‘medium’ weed management → 50 percent of healthy native vegetation in the
established riparian buffer zones;
• ‘high’ weed management → 85 percent of healthy native vegetation in the established
riparian buffer zones.
These assumptions mean that if, for example, six km of riparian buffer is established with
‘medium’ weed management, the contribution to the total Length of Native Riparian
Vegetation in the George catchment is three km (in addition to the native vegetation in the
riparian zone under the given land use scenario). Uncertainty in the assumptions was
accounted for by imposing a 95% uncertainty bound on the calculated values.
The riparian vegetation model was used to predict the length of native riparian vegetation in
the George catchment under a ‘best case’ and ‘worst case’ scenario. The predictions ranged
from 40km (the ‘worst case’ scenario) to 81km (the ‘best case’ scenario) and were used as
attribute levels in the CE survey (Kragt and Bennett, 2009b).
Estimating non-market values
The non-market values of the native riparian vegetation in the George catchment were
estimated based on results from the CE study. CE results indicated that Tasmanian
households are, on average, willing to pay (WTP) 3.57$ for every km increase in native
riparian vegetation (Kragt and Bennett, 2009b). Note that the point of reference (the ‘status
quo scenario) presented in the CE survey was the ‘worst case’ scenario of 40km of native
riparian vegetation in the George catchment and that the WTP results are valid within the
range of presented scenarios (i.e. 40-81km). The CE results also provided information about
the uncertainty range in the WTP distribution, with an estimated standard deviation of 0.532.

An IA approach to linking biophysical models and economic valuation
Paper submitted to iEMSs 2010 13
Household WTP estimates are expressed as marginal values. This means that the CE data
provides information about the non-market value of a change in the length of riparian
vegetation. Individual household WTP was aggregated over the total numbers of households
in the ‘relevant’ population to calculate the total non-market values of changed native riparian
vegetation condition in the George catchment. What constitutes the ‘relevant’ population and
which proportion of this population has a positive WTP is subject to debate (Morrison, 2000).
To reflect this aggregation issue, an additional variable ‘Aggregation assumptions’ was
included in the BN. This variable represents three alternative assumptions for aggregating the
household WTP estimates:
• Only the survey respondents have a positive WTP = 832 households;
• 64 percent6 of all households at the sample locations has a positive WTP = 35,799
households;
• 64 percent of all Tasmanian households have a positive WTP = 116,418 households
(ABS, 2006a).
5. Results
Different tools and data sources were used to define the conditional probability distributions
that link the various components of the catchment system in one BN model (Figure 4). A
process-based water quality model was integrated with a probabilistic model of native
riparian vegetation length through a matching of management scenarios. These biophysical
models predict the environmental conditions in the George catchment, given a certain
management input. Note that CBA of NRM actions are based on analyses of marginal
changes, which requires predictions of changes in environmental conditions that result from
implementing new management actions. In the integrated model, this was achieved by using
the predictions from the biophysical models in a before and after the management change
(Figure 5).The costs of changed management were predicted based on literature values.
Predictions of changes in the length of native riparian vegetation were integrated with data
from a choice experiment (CE) study to provide information about the non-market benefits of
changed native riparian vegetation conditions.
The integrated model can be used to assess the impacts of NRM actions on a range of
indicators, including water quality parameters, native riparian vegetation condition and non-
market environmental values. Including the management costs of NRM actions as well as
non-market benefits allows a cost-benefit analysis (CBA) to determine which management
6 The average survey response rate was 64 percent (Kragt and Bennett, 2009b)

An IA approach to linking biophysical models and economic valuation
Paper submitted to iEMSs 2010 14
investments deliver the greatest net returns to society. Using a BN modelling approach
accounts for knowledge uncertainty in the input data and allows an analysis of the probability
that one of the output indicators is in a certain state, given the management interventions.
Policy evaluation
To illustrate how the model enables an integrated impact assessment of different scenarios,
results of an example scenario are presented in Figure 5. In this scenario, land use in the
George catchment is as currently observed, and no stream-bank engineering works are
undertaken. The top part of the figure illustrates the predicted environmental conditions
before implementing a management change. For example, the model predicts a 73.3 percent
probability that total suspended sediment loads are between 6900 and 8000 tonnes/year. The
bottom part of Figure 5 illustrates the impacts of establishing between six and twelve km of
additional riparian buffers combined with ‘medium’ weed management actions. Total
suspended sediment loads are now predicted to be between 6100 and 6900 tonnes/year. The
direct costs of establishing new riparian buffers are approximately $149,000 (Figure 5).
Uncertainty in the predicted costs is represented in the model by predicting a 92.3 percent
probability that costs are somewhere between $100,000 and $200,000. If no changes are made
to land use or stream-bank engineering, establishing an additional six to twelve km of riparian
buffers with ‘medium’ weed management is most likely to increase the length of native
riparian vegetation in the George catchment from between 45 and 67km (‘before’) to between
67 and 78km (‘after’). Note that uncertainty in the model still leads to a 32.4 percent
probability that the length of native riparian vegetation will remain between 45 and 67km.
If we assume that 64 percent of the population at the sample locations has a positive WTP for
riparian vegetation changes, there is a 32.4 percent probability that the total non-market value
of the change in native riparian vegetation is between two and five million dollars. However,
uncertainty in the predicted length of native riparian vegetation and uncertainty in household
WTP results in a predicted probability of 24.3 percent that the total non-market values are
between one and two million dollars, and even a 21.9 percent probability that there is no
change in non-market values at all. Hence, although the length of native riparian vegetation is
likely to increase as a result of establishing riparian buffer zones in the George catchment,
there remains a probability that the benefits will not outweigh the costs.
Sensitivity analysis
Sensitivity analyses were also conducted, to assess which variables have the largest influence
on reducing the uncertainty in predicted length of native riparian vegetation and total non-
market values. These analyses revealed that, in our model, establishing new riparian buffer
zones, land use changes and the assumptions on native vegetation under different land uses

An IA approach to linking biophysical models and economic valuation
Paper submitted to iEMSs 2010 15
have the largest impact on uncertainty in the predicted total Length of Native Riparian
Vegetation in the George catchment. The predicted Length of Native Riparian Vegetation,
establishing riparian buffers and land use changes have the largest impact on uncertainty in
the predicted total non-market values.
Flow(ML/yr)
TN(t/yr)
TP(t/yr)
Catchment land use
(current land use scenario)
Stream-bank engineering (0 km)
Native Vegetation inthe riparian zonegiven land use (km)
Total Suspended Sediment (t/yr)
4500 to 5500
5500 to 61006100 to 69006900 to 80008000 to 12300
4.00
4.0084.04.004.00
6600 ± 890
Establishing riparian buffer (km)
none0 to 6 km
6 to 12 km> 12km
0 0
100 0
9 ± 1.7
MANAGEMENT AND ENVIRONMENTAL CONDITIONS - BEFORE
MANAGEMENT AND ENVIRONMENTAL CONDITIONS - AFTER
TN(t/yr)
TP(t/yr)
Flow(ML/yr)
Total Suspended Sediment (t/yr)
4500 to 55005500 to 6100
6100 to 69006900 to 80008000 to 12300
6.676.67
6.6773.36.67
7290 ± 1100
Catchment land use(current land use scenario)
Stream-bank engineering (0 km)
Length of Native Rip Veg (km)
<45 km45-67 km67-78 km>78 km
2.0088.59.50 0
57.2 ± 8.3
Weed management
LowMediumHigh
100 0 0
0.15
Native Vegetation inthe riparian zonegiven land use (km)
Establishing riparian buffer (km)
none0 to 6 km6 to 12 km> 12km
100 0 0 0
0 ± 0
Household WTP ($) for changes in NatRi...
0 to 22 to 3
3 to 44 to 55 to 66 to 10
0.1613.9
64.820.70.37 0 +
3.57 ± 0.67
Aggregation assumptions (# of hholds)
Only sampled hh
RR at sample locationsRR at all TAS
0
100 0
35799
Total non-market value of change in Nat...
no value change0-0.5 $m
0.5-1 $m1-2 $m2-5 $m5-10 $m10-20 $m20-45 $m
>45$m
21.97.97
11.824.332.41.240.40 0 +
0
-13.6 ± 35
BENEFITS
Weed management
Low
MediumHigh
0
100 0
0.5
Length of Native Rip Veg (km)
<45 km
45-67 km67-78 km>78 km
0.80
32.465.31.50
67.5 ± 11
PV ofchangedcatchment
land use($m)
Costs (PV) ofundertaking additionalstream-bank
engineering('000$)
COSTS
Costs (PV) of establishing additional ripa...
no costs0-40 ('000$)40-100 ('000$)
100-200 ('000$)200-500 ('000$)500-2500 ('000$)
1.541.541.54
92.31.541.54
149 ± 270
Figure 5 Scenario analysis of establishing between 6-12 km new riparian buffers with ‘medium’ weed management in the George catchment, assuming that 65 percent of the population at the sample locations have a positive WTP and keeping land use and stream-bank engineering constant

An IA approach to linking biophysical models and economic valuation
Paper submitted to iEMSs 2010 16
6. Discussion and conclusion
The research described in this paper aimed to assess the impacts of catchment NRM actions in
the George catchment, Tasmania, on biophysical and economic systems in an integrated
manner. IA provided a useful approach to integrate the multiple dimensions of catchment
NRM, by considering a range of issues and knowledge from different stakeholders. Various
academic disciplines, policy makers and community stakeholders were engaged in the model
development. The iterative consultation process provided valuable inputs to account for
multiple stakeholder perspectives in the final integrated model. Probabilistic modelling
techniques were used to integrate results from deterministic models, expert interviews and
survey data into a Bayesian Network (BN) model of management costs, river water quality,
native riparian vegetation and non-market values.
A major focus of this research was the integration of non-market valuation with scientific
predictions of environmental changes. The integrated, iterative process to developing the
biophysical models and the economic non-market valuation survey tailored the information
exchange between separate model components and ensured that the outputs of the different
tools were compatible with each other. A conceptual BN model was developed that
demonstrates the integration of environmental modelling with economic information about
the costs and benefits of NRM actions. Including these costs and benefits in the modelling
framework allows for a cost-benefit analysis of alternative NRM investment strategies,
providing policy makers with a tool to assess the net social benefits of their decisions.
Contrary to traditional CBA studies, the integrated model accounts for uncertainties in the
relationships between NRM actions, environmental impacts and economic consequences in a
probabilistic way. The wide probability distributions in the scenario predictions show the
large uncertainties in predicted costs and benefits. The explicit recognition of these
probabilities enables an assessment of the risks associated with implementing new
management actions.
Some challenges related to using a BN modelling approach should also be mentioned here.
The stakeholders involved in the model development process found it difficult to express their
knowledge about relationships between variables as probability distributions. Another
limitation of BN models lies in its use of discrete states, rather than continuous probability
distributions. Information losses arise from discretisation of probability distributions, which
may affect modelling outcomes.
The model development was based on limited information about management costs and
ecosystem changes in the George catchment. This means that model predictions of the net
welfare impacts should not be considered as reliable inputs into a CBA. Results from the

An IA approach to linking biophysical models and economic valuation
Paper submitted to iEMSs 2010 17
sensitivity analysis indicated that future research should focus on the impacts of riparian
buffers or land use on native vegetation in the riparian zone to reduce the uncertainty in the
model predictions. It is also recommended that the estimated management costs undergo
further peer review to improve the accuracy of predictions.
References
ABARE (2009) Australian forest and wood products statistics, September and December quarters 2008. Canberra, Australian Bureau of Agricultural and Resource Economics.
ABS (2006a) 2006 Census. Canberra, Australian Bureau of Statistics. ABS (2006b) Agricultural State Profile, Tasmania, 2004-05. Australian Bureau of Statistics.
Canberra, Australian Bureau of Statistics. BARTON, D. N., SALORANTA, T., MOE, S. J., EGGESTAD, H. O. & KUIKKA, S. (2008)
Bayesian belief networks as a meta-modelling tool in integrated river basin management -- Pros and cons in evaluating nutrient abatement decisions under uncertainty in a Norwegian river basin. Ecological Economics, 66, 91-104.
BENNETT, J. (2005) Australasian environmental economics: contributions, conflicts and 'cop-outs'. The Australian Journal of Agricultural and Resource Economics, 49, 243-261.
BENNETT, J. & BLAMEY, R. (2001) The Choice Modelling Approach to Environmental Valuation, Cheltenham, UK, Edward Elgar.
BOD (2007) Break O'Day NRM Survey 2006 - Summary of Results. St Helens, Break O'Day Council.
BORSUK, M. E., STOW, C. A. & RECKHOW, K. H. (2004) A Bayesian network of eutrophication models for synthesis, prediction, and uncertainty analysis. Ecological Modelling, 173, 219-239.
BROMLEY, J., JACKSON, N. A., CLYMER, O. J., GIACOMELLO, A. M. & JENSEN, F. V. (2005) The use of Hugin to develop Bayesian networks as an aid to integrated water resource planning. Environmental Modelling & Software, 20, 231-242.
BROUWER, R., TURNER, R. K., GEORGIOU, S. & VAN DEN BERGH, J. C. J. M. (2003) Integrated assessment as a decision support tool. IN TURNER, R. K., VAN DEN BERGH, J. C. J. M. & BROUWER, R. (Eds.) Managing wetlands: an ecological economics approach. Cheltenham, UK, Edward Elgar Publishing.
CASTELLETTI, A. & SONCINI-SESSA, R. (2007) Bayesian Networks and participatory modelling in water resource management. Environmental Modelling & Software, 22, 1075-1088.
CROKE, B., TICEHURST, J., LETCHER, R., NORTON, J., NEWHAM, L. & JAKEMAN, A. (2007) Integrated assessment of water resources: Australian experiences. Water Resources Management, 21, 351-373.
DALEY, E. (2008) personal communication. Hobart, University of Tasmania. DAVIES, P. E., LONG, J., BROWN, M., DUNN, H., HEFFNER, D. & KNIGHT, R. (2005)
The Tasmanian Conservation of Freshwater Ecosystem Values (CFEV) framework: developing a conservation and management system for rivers. The freshwater protected areas conference 2004. Sydney, IRN and WWF-Australia.
DE RIDDER, W., TURNPENNY, J., NILSSON, M. & VON RAGGAMY, A. (2007) A framework for tool selection and use in integrated assessment for sustainable development. Journal of Environmental Assessment Policy and Management, 9, 423-441.
DOBES, L. (2009) A practical guide to cost-benefit analysis. IN ARGYROUS, G. (Ed.) Evidence for policy and decision-making: a practical guide. Sydney, University of New South Wales Press.
DPIW (2005a) The Conservation of Freshwater Ecosystem Values data layers. Hobart, Department of Primary Industries and Water, Water Assessment Branch.

An IA approach to linking biophysical models and economic valuation
Paper submitted to iEMSs 2010 18
DPIW (2005b) TASVEG, the Tasmanian Vegetation Map. Hobart, Department of Primary Industries and Water, Information and Land Services Division.
DREWRY, J. J., NEWHAM, L. T. H., GREENE, R. S. B., JAKEMAN, A. J. & CROKE, B. F. W. (2005) An Approach To Assess And Manage Nutrient Loads In Two Coastal Catchments Of The Eurobodalla Region, NSW, Australia. IN ZERGER, A. & ARGENT, R. M. (Eds.) MODSIM 2005, International Congress on Modelling and Simulation. Melbourne, 12-15 December 2005, Modelling and Simulation Society of Australia and New Zealand.
DYACK, B., ROLFE, J., HARVEY, J., O’CONNELL, D. & ABEL, N. (2007) Valuing recreation in the Murray: An assessment of the non-market recreational values at Barmah Forest and the Coorong. Canberra, CSIRO: Water for a Healthy Country National Research Flagship.
FPA (2007) State of the Forests Tasmania 2006. Hobart, Forest Practices Authority,. FREEMAN, B. & DUMSDAY, R. (2003) Evaluation of Environmental Services Provided by
Farm Forestry – A Discussion Paper. FINAL REPORT. URS Australia Pty Ltd. HANLEY, N. & BARBIER, E. B. (2009) Pricing Nature. Cost-Benefit Analysis and
Environmental Policy, Cheltenham, UK, Edward Elgar. HENSHER, D. A., ROSE, J. M. & GREENE, W. H. (2005) Applied Choice Analysis: A
Primer, Cambridge, Cambridge University Press. JAKEMAN, A. J. & LETCHER, R. A. (2003) Integrated assessment and modelling: features,
principles and examples for catchment management. Environmental Modelling & Software, 18, 491-501.
JAKEMAN, A. J., LETCHER, R. A. & NORTON, J. P. (2006) Ten iterative steps in development and evaluation of environmental models. Environmental Modelling & Software, 21, 602-614.
KIRKPATRICK, C. & LEE, N. (1999) Special issue: Integrated appraisal and decision-making. Environmental Impact Assessment Review, 19, 227-232.
KRAGT, M. E. & BENNETT, J. (2008) Developing a Questionnaire for Valuing Changes in Natural Resource Management in the George Catchment, Tasmania. Environmental Economics Research Hub Research Report No.8. Canberra, Crawford School of Economics and Government, Australian National University.
KRAGT, M. E. & BENNETT, J. (2009a) Integrated hydro-economic modelling: challenges and experiences in an Australian catchment. 17th Annual conference of the European Association of Environmental and Resource Economists. Pre-conference on hydro-economic modeling. Amsterdam, The Netherlands, 24 June 2009.
KRAGT, M. E. & BENNETT, J. (2009b) Using Choice Experiments to value River and Estuary Health in Tasmania with Individual Preference Heterogeneity. Environmental Economics Research Hub Research Report No.16. Canberra, Crawford School of Economics and Government, Australian National University.
KRAGT, M. E. & NEWHAM, L. T. H. (2009) Developing a Water Quality Model for the George Catchment, Tasmania. Technical Report No.16. Hobart, Landscape Logic
KRAGT, M. E., NEWHAM, L. T. H. & JAKEMAN, A. J. (2009) A Bayesian network approach to integrating economic and biophysical modelling. MODSIM 2009, International Congress on Modelling and Simulation. Cairns, 13-17 July 2009, Modelling and Simulation Society of Australia and New Zealand.
LEE, N. (2006) Bridging the gap between theory and practice in integrated assessment. Environmental Impact Assessment Review, 26, 57-78.
LETCHER, R. A. & GIUPPONI, C. (2005) Policies and tools for sustainable water management in the European Union. Environmental Modelling & Software, 20, 93-98.
LLIFF, G. (2002) George River Catchment: Plan for Rivercare Works for the Upper Catchment, North George and South George Rivers. St Helens, George River Catchment Coordinator, 2002.
MCCANN, R. K., MARCOT, B. G. & ELLIS, R. (2006) Bayesian belief networks: applications in ecology and natural resource management. Canadian Journal of Forest Research, 36, 3053-3062.

An IA approach to linking biophysical models and economic valuation
Paper submitted to iEMSs 2010 19
MORRISON, M. (2000) Aggregation Biases in Stated Preference Studies. Australian Economic Papers, 39, 215-230.
NEWHAM, L. T. H., LETCHER, R. A., JAKEMAN, A. J. & KOBAYASHI, T. (2004) A framework for integrated hydrologic, sediment and nutrient export modelling for catchment-scale management. Environmental Modelling & Software, 19, 1029-1038.
NLWRA (2000) Australian Natural Resources Atlas. http://www.anra.gov.au/. Canberra, National Land & Water Resources Audit.
NWI (2004) Intergovernmental Agreement on a National Water Initiative. COAG Council of Australian Governments.
PEARL, J. (1988) Probabilistic reasoning in intelligent systems : networks of plausible inference, San Mateo, California, Morgan Kaufmann Publishers.
RITCHEY, T. (2004) Wicked Problems. Structuring Social Messes with Morphological Analysis. Lecture given at the Royal Institute of Technology. Stockholm, Swedish Morphological Society.
SPROD, D. (2003) Draft rivercare plan Lower George River. St Helens, Lower George Landcare Group.
THORN, K. (2007) personal communication. St.Helens, Break O'Day Council. TIAS (2009) The Integrated Assessment Society (TIAS), http://www.tias-web.info.
Osnabrück. TOURISM TASMANIA (2008) Tasmanian Visitor Survey. Hobart,
www.tourismtasmania.com.au, viewed 24 Dec 2009. VIGIAK, O., NEWHAM, L. T. H., WHITFORD, J., MELLAND, A. & BORSELLI, L.
(2009) Comparison of landscape approaches to define spatial patterns of hillslope-scale sediment delivery ratio. MODSIM 2009, International Congress on Modelling and Simulation. Cairns, 13-17 July 2009, Modelling and Simulation Society of Australia and New Zealand.
WARD, F. A. (2009) Economics in integrated water management. Environmental Modelling & Software, 24, 948-958.

An IA approach to linking biophysical models and economic valuation
Paper submitted to iEMSs 2010 20
Appendix 1 - Conceptual model for the George catchment, incorporating four management actions (stream-bank engineering, creating riparian buffer zones, land use changes and weed management) and three environmental attributes (seagrass, rare native species and native riparian vegetation)
River totalsuspendedsediment (t/yr)
River totalphosphorus (t/yr)
River totalnitrogen (t/yr)
NativeExoticRatio
Habitat connectivity
Riverflow (ML/yr)
Establishingriparianbuffer zones
Stream-bankengineering
Weedmanagement
Changingcatchmentland use
Estuarysuspendedsediment
EstuaryNOx
Estuary PO4
Riverwaterquality
Estuary Turbidity
Chlorophyll a
Light attenuation
Seagrassarea
NativeRiparianVegetation
Rare nativespecies
Non-marketvalues of changes in estuaryseagrass area
WTP for seagrasschanges ($)
Non-market valuesof changes in thenumber of rare species
WTP for protectingrare species ($)
Non-market valuesof changes in the length of nativeriparian vegetation
WTP for nativeriparian vegetation ($)
Costs (PV) of undertakingstream-bankengineering works ($)
Costs (PV) of establishingriparian buffer zones ($)
PV of catchmentland use ($)
Costs (PV) of weedmanagement ($)

An IA approach to linking biophysical models and economic valuation
Paper submitted to iEMSs 2010 21
Appendix 2 Variables in the integrated model for the George catchment model
Variable Description States Variable type Data/information sources
Costs of undertaking stream-bank engineering works
Present value of the one-off implementation costs of stream-bank engineering works plus the discounted maintenance costs^
0, 0-50, 50-100, 100-150, 150-200, 200-400 (‘000$)
Utility, continuous
Literature values
(see Appendix 3)
PV of catchment land use changes
Total present value of land use changes in the George catchment
<-10, -10to-5. -5to-2, -2to0, 0, 0-2, 2-5, 5-10, >10 ($m)
Utility, continuous
Literature values
(see Appendix 3)
Costs of established riparian buffer zones
Present value of the one-off implementation costs of establishing a riparian buffer zone plus the discounted maintenance costs associated with continuing weed management in the riparian buffer zone^
0, 0-40, 40-100, 100-200, 200-500, 500-2,500 (‘000$)
Utility, continuous
Literature values
(see Appendix 3)
Stream-bank engineering
Length of stream-bank engineering works undertaken in the George catchment to reduce stream-bank erosion
none, 0-3, 3-7, >7 (km) Management action, continuous
Observed length of actively eroding sites from George Rivercare Plans (Sprod, 2003; Lliff, 2002).
Establishing riparian buffer zones
Length of riparian buffers established on agricultural and urban lands to reduce stream-bank erosion and trap sediment runoff from hill-slope erosion
none, 0-6, 6-12, >12 (km) Management action, continuous
Modelling assumptions
Changing catchment land use
Changes in the total catchment area under alternative land uses (native vegetation non-production, native production forest, forestry plantations, grazing pastures, irrigated agriculture, urban area)
Current land use, loss native vegetation, expanding native vegetation, expanding production forest, expanding plantation forest, expanding agriculture, urbanisation (low, medium, high)
Management action, discrete
Modelling assumptions
Weed management Weed control measures and planting native vegetation to improve the naturalness of the riparian zone
low, medium, high Management action, discrete
Australian National Resource Atlas (NLWRA, 2000)

An IA approach to linking biophysical models and economic valuation
Paper submitted to iEMSs 2010 22
Variable Description States Variable type Data/information sources
River total suspended sediment (TSS)
Total Suspended Sediments loads into the Georges Bay at St. Helens under alternative management scenarios
4500-5500, 5500-6100, 6100-6900, 6900-8000, 8000-12300 (tonnes/year)
Nature, continuous
Modelled in CatchMODS water quality model
River total phosphorus (TP)
Total Phosphorus loads into the Georges Bay at St. Helens under alternative management scenarios
2.4-3.6, 3.6-4.1, 4.1-4.6, 4.6-5.7, 5.7-12 (tonnes/year)
Nature, continuous
Modelled in CatchMODS water quality model
River total nitrogen (TN)
Total Nitrogen loads into the Georges Bay at St. Helens under alternative management scenarios
66-80, 80-90, 90-100, 100-120, 120-220 (tonnes/year)
Nature, continuous
Modelled in CatchMODS water quality model
River flow Total river flows into the Georges Bay at St. Helens under alternative land use scenarios
178-183, 183-188, 188-191, 191-203, 203-230 (‘000 ML/year)
Nature, continuous
Modelled in CatchMODS water quality model
Native veg in riparian zone given different land uses
The total length of native vegetation in the riparian zone under alternative land use scenarios
<60, 60-65, 65-70, >70 (km) Nature, continuous
Calculated in the model, based on assumptions of native vegetation
Length of Native Riparian Vegetation
The total length of native riparian vegetation given land use changes, creation of riparian buffers and weed management
<45, 45-67, 67-78, >78 (km)
(equivalent to <40%, 40-60%, 60-70%, >70% of total catchment stream length)
Nature, continuous
Calculated in the model, based on assumptions of native vegetation from expert consultation
Aggregation assumptions
Assumptions on the total number of households in Tasmania with a positive marginal willingness-to-pay
Only sampled households ( = 832),
RR at sample locations ( = 35,799),
RR at all TAS ( = 116,418)
Nature, discreet
Modelling assumptions based on choice experiment response rate and total number of households in Tasmania
Household WTP for change in native riparian vegetation
Household marginal willingness-to-pay for every additional km of native riparian vegetation, compared to the base case scenario (= 40km of native riparian vegetation left in the catchment)
<2, 2 to 3, 3 to 4, 4 to 5, 5 to 6, >6 ($) Nature, continuous
Choice experiment survey results
Total non-market values of changes in native riparian vegetation
The total non-market value of increased length in native riparian vegetation in the George catchment, compared to the base case scenario
0, 0-0.5, 0.5-1, 1-2, 2-5, 5-10, 10-20, 20-45, >45 (m$)
Utility, continuous
Equation combining parent nodes ‘WTP’, ‘Aggregation assumptions’ and ‘Native Riparian Vegetation’
^ Discounted at three percent over a twenty year period
An IA approach to linking biophysical models and economic valuation
Paper submitted to iEMSs 2010 23
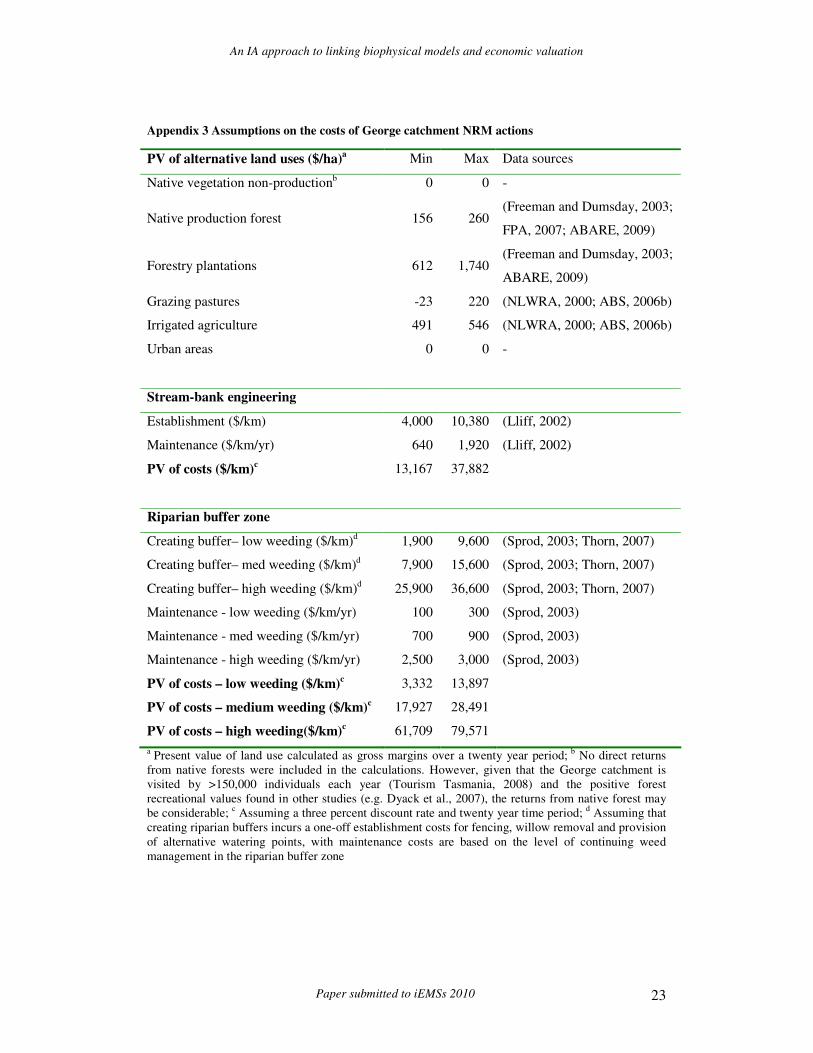
Appendix 3 Assumptions on the costs of George catchment NRM actions
PV of alternative land uses ($/ha)a Min Max Data sources
Native vegetation non-productionb 0 0 -
Native production forest 156 260 (Freeman and Dumsday, 2003;
FPA, 2007; ABARE, 2009)
Forestry plantations 612 1,740 (Freeman and Dumsday, 2003;
ABARE, 2009)
Grazing pastures -23 220 (NLWRA, 2000; ABS, 2006b)
Irrigated agriculture 491 546 (NLWRA, 2000; ABS, 2006b)
Urban areas 0 0 -
Stream-bank engineering
Establishment ($/km) 4,000 10,380 (Lliff, 2002)
Maintenance ($/km/yr) 640 1,920 (Lliff, 2002)
PV of costs ($/km)c 13,167 37,882
Riparian buffer zone
Creating buffer– low weeding ($/km)d 1,900 9,600 (Sprod, 2003; Thorn, 2007)
Creating buffer– med weeding ($/km)d 7,900 15,600 (Sprod, 2003; Thorn, 2007)
Creating buffer– high weeding ($/km)d 25,900 36,600 (Sprod, 2003; Thorn, 2007)
Maintenance - low weeding ($/km/yr) 100 300 (Sprod, 2003)
Maintenance - med weeding ($/km/yr) 700 900 (Sprod, 2003)
Maintenance - high weeding ($/km/yr) 2,500 3,000 (Sprod, 2003)
PV of costs – low weeding ($/km)c 3,332 13,897
PV of costs – medium weeding ($/km)c 17,927 28,491
PV of costs – high weeding($/km)c 61,709 79,571
a Present value of land use calculated as gross margins over a twenty year period; b No direct returns
from native forests were included in the calculations. However, given that the George catchment is visited by >150,000 individuals each year (Tourism Tasmania, 2008) and the positive forest recreational values found in other studies (e.g. Dyack et al., 2007), the returns from native forest may be considerable; c Assuming a three percent discount rate and twenty year time period; d Assuming that creating riparian buffers incurs a one-off establishment costs for fencing, willow removal and provision of alternative watering points, with maintenance costs are based on the level of continuing weed management in the riparian buffer zone