Embed Size (px)
Citation preview
EUROPEAN ECONOMY
Economic Papers 469 | November 2012
Long-term care: need, use and expenditure in the EU-27
Barbara Lipszyc, Etienne Sail and Ana Xavier
Economic and Financial Aff airs
ISSN 1725-3187
Economic Papers are written by the Staff of the Directorate-General for Economic and Financial Affairs, or by experts working in association with them. The Papers are intended to increase awareness of the technical work being done by staff and to seek comments and suggestions for further analysis. The views expressed are the author’s alone and do not necessarily correspond to those of the European Commission. Comments and enquiries should be addressed to: European Commission Directorate-General for Economic and Financial Affairs Publications B-1049 Brussels Belgium E-mail: [email protected] This paper exists in English only and can be downloaded from the website ec.europa.eu/economy_finance/publications A great deal of additional information is available on the Internet. It can be accessed through the Europa server (ec.europa.eu) KC-AI-12-469-EN-N ISBN 978-92-79-22990-9 doi: 10.2765/27485 © European Union, 2012
European Commission
Directorate-General for Economic and Financial Affairs
Long-term care: Need, use and expenditure in the EU-27 By Barbara Lipszyc, Etienne Sail and Ana Xavier Abstract Public provision of long-term care (LTC) will pose an increasing challenge to the sustainability of public finances in the EU, due to an ageing population. In this view, the paper aims to provide indications on the timing and potential fiscal impact associated to changes in the demographic structure. The ageing of the population is expected to put pressure on governments to provide long-term care services as (very) old people often develop multi-morbidity conditions, which require not only long-term medical care but assistance with a number of daily tasks. This paper presents the projections of public expenditure on LTC in the long run (2060) under alternative assumptions. All scenarios project a non-negligible increase in public expenditure. All other things being equal, the expected increase in the demand for formal LTC support will vary across EU-27 Member States according to their current patterns of LTC provision: the balance between formal and informal care, the emphasis they put on institutional care, home care or provision of cash benefits, the supply constraints both in the formal and informal care sectors, the current average cost and coverage rate for each type of care and their distribution across age groups. The paper also discusses policy implications of the projection results.
JEL classification: H51, I18, J14, J18 Key words: long-term care, sustainability of public finances, formal care, informal care, ageing population, dependency, care provision, public policy
Acknowledgements We are thankful to the members of the EPC-Ageing Working Group for the information provided and the joint work that led to the 2012 Ageing Report, on which the present paper draws.
EUROPEAN ECONOMY Economic Papers 469

2
3
Table of Contents
1 INTRODUCTION ....................................................................................................... 7
1.1 Long-term care components .............................................................................. 7
1.2 Various national settings ................................................................................... 9
1.3 Size and extent .................................................................................................. 9
1.3.1 Public and private expenditure .......................................................... 13
1.3.2 Public expenditure by type of (formal) care ...................................... 14
1.3.3 The balance between formal and informal care ................................ 15
1.3.4 The combination/balance between formal care at home and in institutions ......................................................................................... 16
1.3.5 The balance between benefits in kind and in cash ............................ 18
1.4 Scope of the analysis and policy implications................................................. 18
2 DETERMINANTS OF LONG-TERM CARE EXPENDITURE: DEMAND AND SUPPLY – NEEDS AND PROVISION ......................................................... 20
2.1 Demography .................................................................................................... 21
2.2 Dependency levels - developments in health status ........................................ 23
2.3 Patterns of long-term care provision ............................................................... 26
2.4 Care supply – availability of human resources ............................................... 27
2.4.1 Formal care ........................................................................................ 27
2.4.2 Informal care: availability and propensity to provide care ................ 28
2.4.2.1 Absolute and relative availability of carers: dependency ratios .................................................................................. 28
2.4.2.2 Propensity to provide care ................................................. 33
2.4.3 Expected substitution effects ............................................................. 35
3 FUTURE EXPENDITURE: THE VARIOUS SCENARIOS ................................... 36
3.1 Methodology ................................................................................................... 36
3.2 The various scenarios ...................................................................................... 38
3.2.1 The impact of future demographic change ........................................ 38
3.2.1.1 "Base case scenario" .......................................................... 38
3.2.1.2 "High life expectancy scenario" ........................................ 39
3.2.2 The impact of future changes in the prevalence of disability: the "delayed dependency scenario" ......................................................... 39
3.2.3 The impact of future changes in policy ............................................. 40
3.2.3.1 "Shift to formal care" ........................................................ 41
4
3.2.3.2 "Coverage convergence scenario" ..................................... 41
3.2.4 The impact of future changes in unit cost: the "cost convergence scenario" ............................................................................................ 42
4 PROJECTION RESULTS AND ANALYSIS .......................................................... 43
4.1 The impact of future demographic change ...................................................... 43
4.1.1 "Base-case scenario" ......................................................................... 43
4.1.2 "High life expectancy scenario" ........................................................ 47
4.2 The impact of future changes in the prevalence of disability/dependency ..... 48
4.3 The impact of future changes in policy ........................................................... 49
4.3.1 "Shift to formal care" ........................................................................ 50
4.3.2 "Coverage convergence scenario" ..................................................... 51
4.4 The impact of future changes in unit cost: the "cost convergence scenario" .. 53
5 CONCLUSIONS AND POLICY IMPLICATIONS ................................................ 56
6 LIST OF REFERENCES .......................................................................................... 59
7 GLOSSARY .............................................................................................................. 63
8 ANNEXES ................................................................................................................ 67
8.1 ANNEX I: Input data used to project long-term care expenditure.................. 67
8.1.1 Types of care, data sources and categories ........................................ 67
8.1.1.1 Public expenditure on long-term care ............................... 67
8.1.1.2 Disabled and recipients ..................................................... 68
8.1.2 Input data ........................................................................................... 69
8.1.2.1 Age-related expenditure profiles per beneficiary and per capita ................................................................................. 70
8.1.2.2 Dependency rates .............................................................. 71
8.1.2.3 Coverage rates ................................................................... 71
8.2 ANNEX II – National characteristics of LTC ................................................. 75
8.3 ANNEX III – Summary of the projections methodology ............................... 78
8.3.1 Overview of the model structure ....................................................... 78
8.3.2 Mathematical illustration of the long-term care scenarios ................ 81

5
List of Tables
Table 1 – Public spending on care, 2010: long-term care and/or acute health care? ............... 11
Table 2 – Public expenditure on in-kind LTC, as % of GDP; recent trend ............................. 13
Table 3 – Public expenditure on LTC as % of GDP, by type of care, 2010 ............................ 15
Table 4 – Disability rates in 2006 and 2009 ............................................................................. 25
Table 5 – Unit cost of each type of formal care, as % of GDP per capita, 2010 ..................... 26
Table 6 – Share of 65+ and 80+ among 15+ disabled and care recipients ............................... 31
Table 7 – Base case scenario - Total public spending on LTC as % of GDP .......................... 46
Table 8 – High life expectancy scenario (1 year) - Total public spending on LTC as % of GDP .......................................................................................................................................... 48
Table 9 - Delayed dependency scenario - Total public spending on LTC as % of GDP ......... 49
Table 10 – Shift to formal care scenario - Total public spending on LTC as % of GDP ........ 51
Table 11 - Coverage convergence scenario - Total public spending on LTC, as % of GDP ... 53
Table 12 – Cost convergence scenario - Total public spending on LTC as % of GDP ........... 54
Table 13 – Overview of results across scenarios: increase in spending as p.p. of GDP, 2010-2060 .................................................................................................................................. 55
Table 14 – Dependency rates: Total, 2009 ............................................................................... 71
Table 15 – Coverage rates in the base case scenario, +15 ....................................................... 72
Table 16 – LTC services: Public and private shares, 2008 ...................................................... 75
Table 17 – In-kind LTC: non-coverage (2010) ........................................................................ 75
Table 18 – Long-term care cash benefits in the EU Member States ........................................ 76
Table 19 – Requirements for being legally considered as "dependent", i.e. potential beneficiary of LTC services ............................................................................................. 77
Table 20 - Overview of the different LTC scenarios ............................................................... 80
List of Graphs
Graph 1 – Public LTC expenditure, as % of GDP, 2010 ......................................................... 10
Graph 2 – Age structure of the population in 2010 and 2060, European Union. ..................... 12
Graph 3 – LTC coverage by age groups, EU-27 ...................................................................... 12
Graph 4 – Long-term nursing care services: Public and private shares, 2008 ......................... 14
Graph 5 – Share of total LTC coverage by provider, 2010 ...................................................... 16
Graph 6 – LTC in kind: formal coverage by provider, 2010 ................................................... 17
6
Graph 7 – Dependency rate across age groups, EU-27, 2009 .................................................. 19
Graph 8 – Age-related expenditure profiles per capita, 2010, EU-15 ...................................... 21
Graph 9 – Age-related expenditure profiles per capita, 2010, EU-12 ...................................... 22
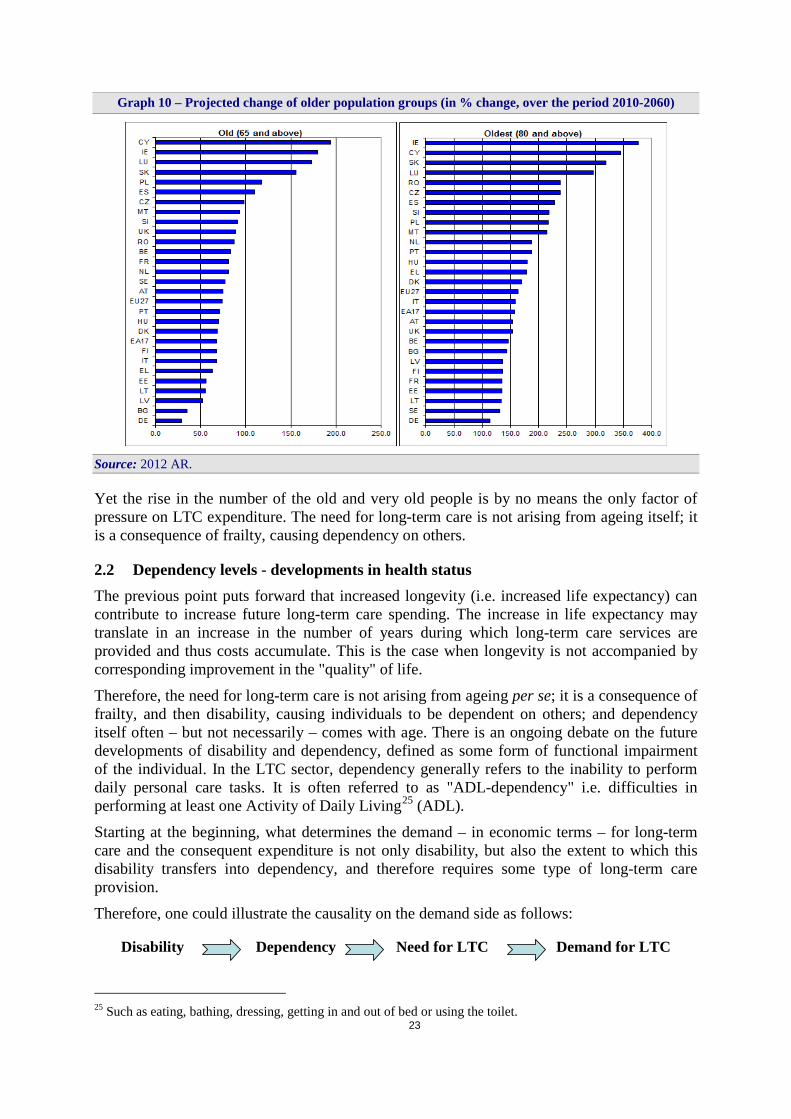
Graph 10 – Projected change of older population groups (in % change, over the period 2010-2060) ................................................................................................................................. 23
Graph 11 – Projection of population by main age groups, EU-27 (in millions) ...................... 29
Graph 12 – Economic dependency ratios, EU-27 (in millions) ............................................... 30
Graph 13 – Caring dependency ratios, EU-27 (in millions) .................................................... 30
Graph 14 – Life expectancy at birth and at age 65: narrowing gender gap ............................. 32
Graph 15 – Percentage of people married and living at home ................................................. 33
Graph 16 – Participation rates by gender (45-64) .................................................................... 34
Graph 17 – Schematic presentation of the projection methodology ........................................ 37
Graph 18 – Expected number of disabled in 2060, according to disability status ................... 40
Graph 19 – Age-gender expenditure profiles (per user of formal in-kind LTC), EU-15 and EU-12 ............................................................................................................................... 44
Graph 20 – Base case scenario: Public spending on LTC as % of GDP; 2010-2060 .............. 45
Graph 21 - Projected spending according to the different scenarios: EU-27, % of GDP ........ 57
Graph 22 – Age-gender expenditure profiles (per beneficiary), in EU-15 and EU-12 ............ 70
Graph 23 – LTC coverage by age groups, EU-15 and EU-12 ................................................. 73
Graph 24 – LTC coverage (in-kind and cash benefits), 15+ .................................................... 74
7
1 INTRODUCTION This paper describes the main determinants of public expenditure on long-term care services and, on that basis, proposes a methodology to project public expenditure on long-term care for the period spanning from 2010 up to 2060. Long-term projections are done on the basis of so-called projection scenarios. Each scenario tries to capture the effect of one determinant of public expenditure, separately from the effect of other determinants. The aim is to provide indications on the timing and potential fiscal impact associated to changes in the demographic structure and, more specifically, to an ageing population. The paper also discusses policy implications of the projection results. The paper draws on the joint work conducted by the Directorate-General for Economic and Financial Affairs of the European Commission (DG ECFIN) and the Ageing Working Group of the Economic Policy Committee (AWG) since 2003.1,2
Projecting long-term care expenditure over the long run aims at showing where, when, and to what extent, ageing pressure can accelerate as the baby-boom generation ages and the average life span continues to increase. However, long-term projections are not forecasts. Projections are a helpful tool in highlighting the possible – what if? – immediate and future policy challenges posed by demographic trends for governments facing public budget choices. The uncertainty surrounding the projections of demographic and economic developments is high. The longer the projection period, the higher is the degree of uncertainty, especially in the domain of health and disability trends.
Moreover, considering the age-structure of the population today and how it will look in coming decades is only a starting point. Indeed, the demographic factor is only one of many determinants of the future provision of long-term care (LTC) and therefore, public expenditure. The paper tries to capture a number of other possible determinants of long-term care demand. However, the set of determinants considered is not exhaustive, in part due to data limitations. In addition, most scenarios assume that current policy will not change, although a couple of scenarios attempt to project expenditure in the case of defined policy changes. Therefore, the projection results presented are constrained by data availability and policy uncertainty.
The present section defines the subject of research, namely long-term care and long-term care expenditure, and puts it in context. It sets the stage for the analysis by illustrating the definition, size and scope of long-term care services and associated costs. It provides an overview of the various country-specific settings in the long-term care sector. Section 2 reviews the different variables that may have an impact on the future demand and supply of long-term care. The different projection scenarios are explained in Section 3, with the aim of capturing the various determinants of LTC expenditure. Section 4 displays the related projection results for each scenario, while Section 5 concludes by initiating policy discussion.
1.1 Long-term care components The term "long-term care services" refers to the organisation and delivery of a broad range of services and assistance to people who are limited in their ability to function independently on
1 The 2012 results of this joint work are published in the "2012 Ageing Report": European Commission – Directorate General for Economic and Financial Affairs and Economic Policy Committee, "The 2012 Ageing Report: Economic and budgetary projections for the 27 EU Member States (2010-2060)", European Economy. 2/2012, Brussels. See: http://ec.europa.eu/economy_finance/publications/european_economy/2012/2012-ageing-report_en.htm. 2 Authors are also indebted to N. Diez Guardia and B. Przywara who had worked with E. Sail on a previous draft (2010).
8
a daily basis over an extended period of time, due to mental and/or physical disability. Such services are crucial to many dependent people, most often pertaining to the older age categories.3 Typically, care consists of assistance with so-called activities of daily living (ADL), such as eating, bathing, dressing, getting in and out of bed or using the toilet. In addition, these personal care components are often provided in combination with basic medical services, such as help with wound dressing, pain management, medication, health monitoring, prevention, rehabilitation or services of palliative care. Besides, long-term care services can also be combined with lower-level help relating to so-called "Instrumental Activities of Daily Living" (IADL), such as meals, shopping and housework.
This definition means that long-term care comprises a mix of both health and social components, therefore pertaining to both health and social sectors. This complexity is a challenge when it comes to defining a clear, understandable and feasible boundary between the two long-term care components: health care and social care. Besides, most Member States provide some kind of long-term care related "cash benefits" – so-called "cash-for-care" – that can also be used to pay for services mainly provided by the private sector or by informal carers.
Long-term care services may be provided in a variety of settings including home care, institutional (nursing homes, hospitals), or residential care, internally or externally provided, sometimes under mixed forms (assisted living arrangements other than nursing homes, sheltered housing, etc.), for which a wide range of national arrangements and national labels exist. Semi-residential care in particular is aimed at the promotion or preservation of the ability to live independently. It generally consists in day-care centres that offer a complete package of services to the persons during the day – such as provision of meals, daily health, educational and rehabilitation services – or in temporary stays in care centres for social rehabilitation and integration.
Formal care and informal care services coexist, either complementing or substituting for each other, generally depending on the type of dependency. Formal care is provided in either the public or the private sector, by care assistants who are paid under some form of employment contract, and who are mainly lower-skilled caregivers or nurses. To the contrary, to be considered informal, the provision of care cannot be paid as if purchasing a service, even though an informal caregiver may receive income transfers and, possibly, some informal payments from the person receiving care.
Informal carers usually have an existing social tie to the care recipient. In fact, most informal long-term care is delivered by families and friends – mainly spouses, daughters and step-daughters. In this context, respite care can be seen as a "side-category", as it aims at giving the informal carer a short-term break from his/her usual care commitments. It can be an important support in alleviating the – sometimes long-term – negative effects that heavy care commitments may have on informal carers.
Besides formal and informal LTC services, cash benefits are formal payments which can be used to purchase formal care services at home or in an institution or which can be paid to informal caregivers as income support. Indeed, if not eligible to receive formal care, disabled patients are taken care of by informal carers, if available. These would include: spouses or
3 The OECD has elaborated the following definition: "long-term care brings together a range of services for people who are dependent on help with basic activities of daily living (ADL) over an extended period of time. Such activities include bathing, dressing, eating, getting in and out of bed or chair, moving around and using the bathroom. These long-term care needs are due to long-standing chronic conditions causing physical or mental disability", (OECD, 2005).
9
partners, children, other members of the household, relatives, friends or neighbours. In this regard, long-term care is not their main professional activity and they are not formally remunerated.
Therefore, many countries supplement or replace long-term care services with cash support which can be used by patients to purchase required services. Broadly speaking, cash benefits can take three general forms: payments to the person needing care, personal budgets and consumer-directed employment of care assistants, or income support payments to informal care givers (Lundsgaard, 2005). The large variety of arrangements makes the analysis of the systems and the data comparability difficult. This also makes expenditure projections a challenge.4
1.2 Various national settings Long-term care is fairly recent in social protection systems. There was no comprehensive grasp of what we now define as "need of care" or "long-term care" until the late 1970s when some countries, including France and what are now the Czech and Slovak Republics, recognised what was termed the "need of assistance by third persons", and provided special allowances for this. Early elements of LTC provision can be found in the legislation on invalidity and old-age pensions, but also in social assistance schemes – for people with disabilities – or in disability schemes (Bulletin luxembourgeois, 2005). Up to that point, long-term care needs were not regarded as a distinct phenomenon or a special risk. Since then, better descriptions of the need have been developed and various settings have emerged in the EU Member States.
The EU's Mutual Information System on Social Protection5 (MISSOC) provides very detailed and comparable information about national social protection systems in the 27 EU Member States. It shows how much EU Member States differ in the area of LTC organization (financing and provision), although they have to face similar challenges.6 For better understanding of the current cross-country variety and better information about the basis of the projection scenarios, it is interesting to observe the country-specific situations in terms of: 1) the combination of and the balance between formal care at home and in institutions; 2) the balance between formal support in kind (services) and in cash; and 3) the balance between formal and informal care. The next section gives an overview of these combinations, which are crucial to understand the size and extent of the issue across the EU-27.
1.3 Size and extent The provision of long-term care services represents a non-negligible and growing share of GDP and total government spending (see Graph 1).
4 Annex I presents the data sources and relevant categories that have been used in the projections. 5 The 2011 release, see: http://ec.europa.eu/employment_social/missoc/db/public/compareTables.do for additional information. 6 Along with financial sustainability, goals of access to adequate LTC and high-level quality in LTC services were agreed upon in the context of the Open Method of Coordination (OMC) on social protection and social inclusion. For more details and examples of good practices in achieving these goals, see European Commission – Directorate General for Employment, Social Affairs and Inclusion (2008).
10
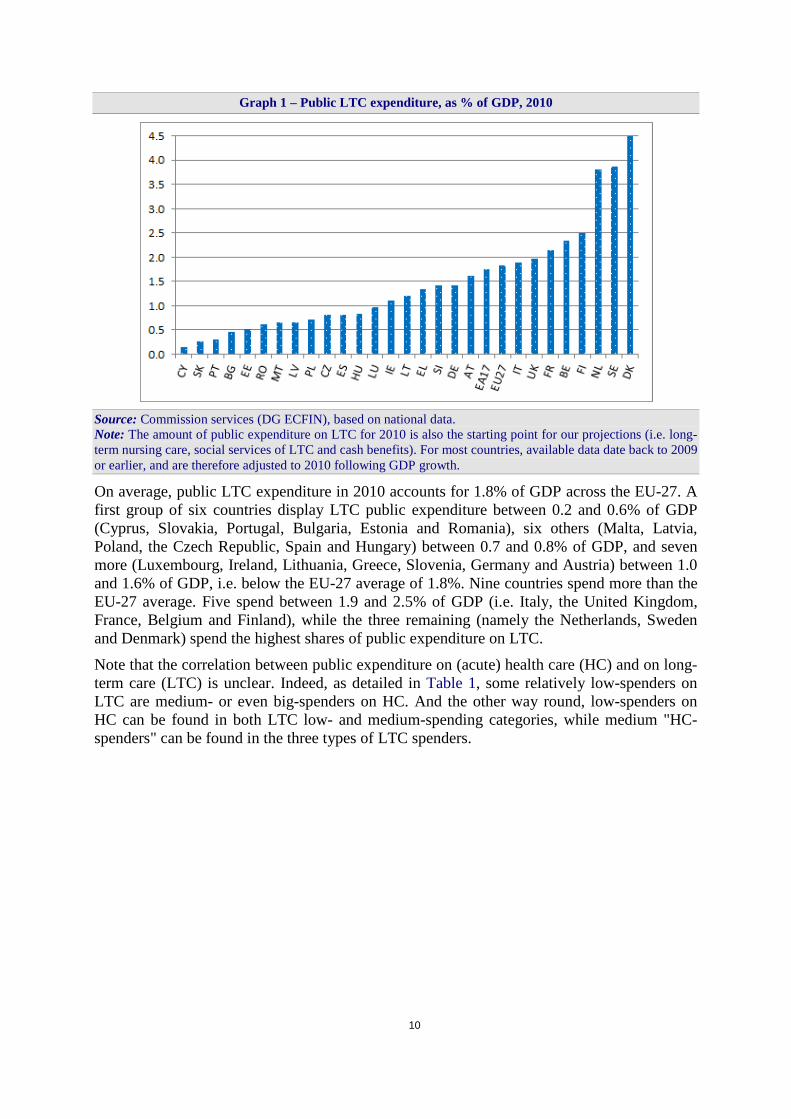
Graph 1 – Public LTC expenditure, as % of GDP, 2010
Source: Commission services (DG ECFIN), based on national data. Note: The amount of public expenditure on LTC for 2010 is also the starting point for our projections (i.e. long-term nursing care, social services of LTC and cash benefits). For most countries, available data date back to 2009 or earlier, and are therefore adjusted to 2010 following GDP growth.
On average, public LTC expenditure in 2010 accounts for 1.8% of GDP across the EU-27. A first group of six countries display LTC public expenditure between 0.2 and 0.6% of GDP (Cyprus, Slovakia, Portugal, Bulgaria, Estonia and Romania), six others (Malta, Latvia, Poland, the Czech Republic, Spain and Hungary) between 0.7 and 0.8% of GDP, and seven more (Luxembourg, Ireland, Lithuania, Greece, Slovenia, Germany and Austria) between 1.0 and 1.6% of GDP, i.e. below the EU-27 average of 1.8%. Nine countries spend more than the EU-27 average. Five spend between 1.9 and 2.5% of GDP (i.e. Italy, the United Kingdom, France, Belgium and Finland), while the three remaining (namely the Netherlands, Sweden and Denmark) spend the highest shares of public expenditure on LTC.
Note that the correlation between public expenditure on (acute) health care (HC) and on long-term care (LTC) is unclear. Indeed, as detailed in Table 1, some relatively low-spenders on LTC are medium- or even big-spenders on HC. And the other way round, low-spenders on HC can be found in both LTC low- and medium-spending categories, while medium "HC-spenders" can be found in the three types of LTC spenders.
11
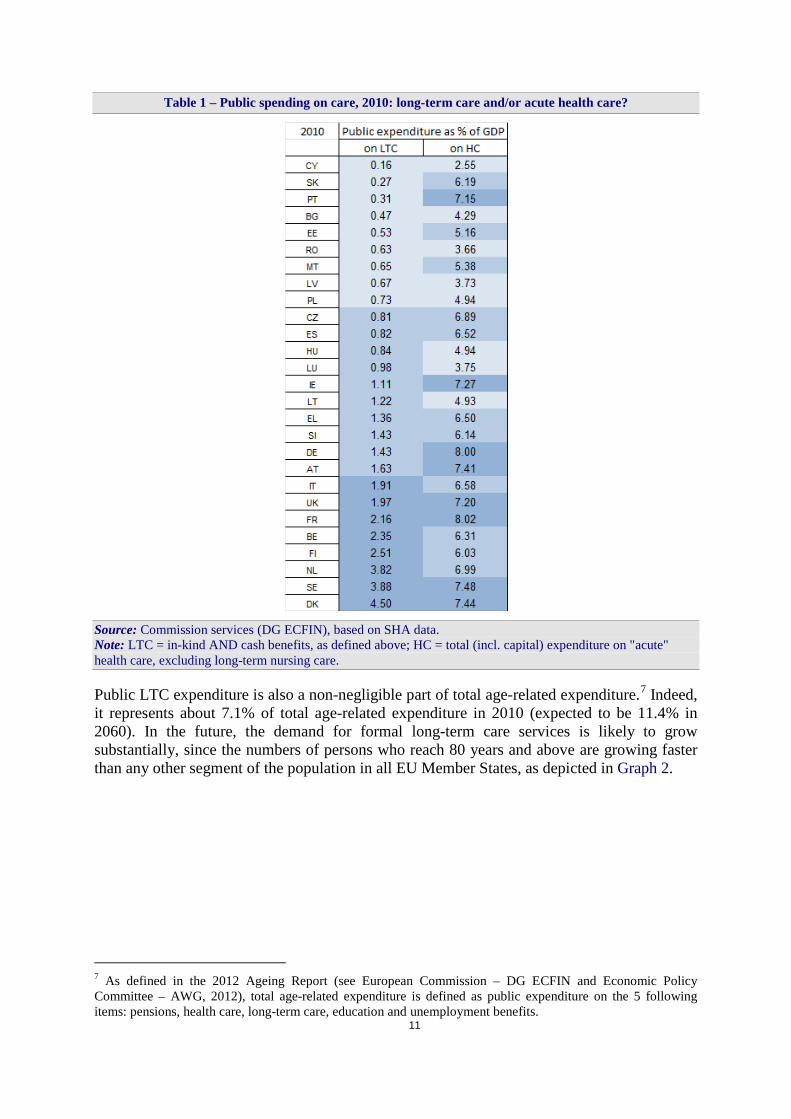
Table 1 – Public spending on care, 2010: long-term care and/or acute health care?
Source: Commission services (DG ECFIN), based on SHA data. Note: LTC = in-kind AND cash benefits, as defined above; HC = total (incl. capital) expenditure on "acute" health care, excluding long-term nursing care.
Public LTC expenditure is also a non-negligible part of total age-related expenditure.7 Indeed, it represents about 7.1% of total age-related expenditure in 2010 (expected to be 11.4% in 2060). In the future, the demand for formal long-term care services is likely to grow substantially, since the numbers of persons who reach 80 years and above are growing faster than any other segment of the population in all EU Member States, as depicted in Graph 2.
7 As defined in the 2012 Ageing Report (see European Commission – DG ECFIN and Economic Policy Committee – AWG, 2012), total age-related expenditure is defined as public expenditure on the 5 following items: pensions, health care, long-term care, education and unemployment benefits.
12
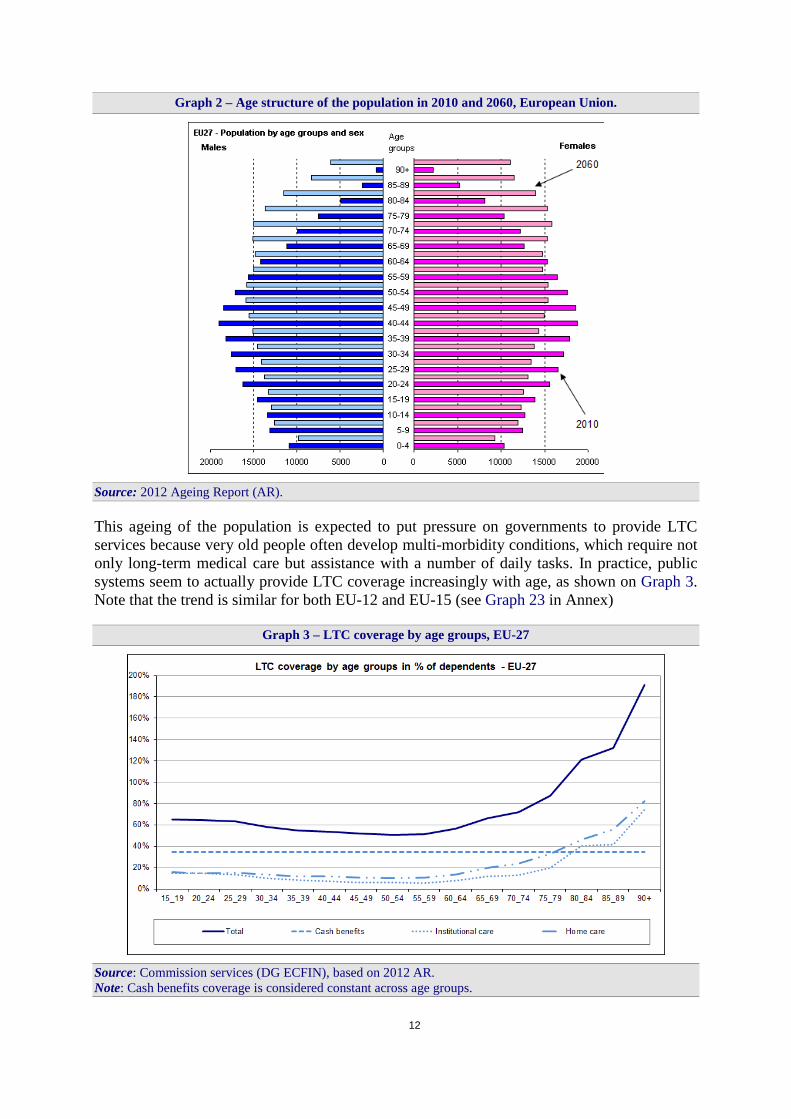
Graph 2 – Age structure of the population in 2010 and 2060, European Union.
Source: 2012 Ageing Report (AR).
This ageing of the population is expected to put pressure on governments to provide LTC services because very old people often develop multi-morbidity conditions, which require not only long-term medical care but assistance with a number of daily tasks. In practice, public systems seem to actually provide LTC coverage increasingly with age, as shown on Graph 3. Note that the trend is similar for both EU-12 and EU-15 (see Graph 23 in Annex)
Graph 3 – LTC coverage by age groups, EU-27
Source: Commission services (DG ECFIN), based on 2012 AR. Note: Cash benefits coverage is considered constant across age groups.

13
Hence, one can expect an upward pressure on public expenditure and on the ratio of LTC expenditure to GDP. This makes the issue of public spending on long-term care a significant part of the debate on the long-term sustainability of public finances.
In point of fact, rough data give a picture of a slow but quite steady growth in the recent years, as depicted on Table 2 below for countries with available trend data. Only long-term nursing care and are considered here.8 Of course, the recent trend shows developments of public choices as well as break in data series. For instance, the Netherlands show a big increase in 2003, following their LTC reform, while the sharp increase in Swedish expenditure in 2001 is due to the reporting of social services of long-term care only starting in that year.
Table 2 – Public expenditure on in-kind LTC, as % of GDP; recent trend
Source: Commission services (DG ECFIN), based on SHA data (Eurostat/OECD/WHO). Note: "LTC public expenditure" = (HC.3+HC.R.6.1) categories of SHA (see Annex I).
1.3.1 Public and private expenditure
To get a better insight into the actual provision of long-term care, it is also interesting to look at the relation between public and private9 LTC expenditure. Graph 4 displays the 2008 public 8 They correspond to the two SHA items relating to LTC services (in-kind), i.e. long-term nursing care (HC.3) and social services of long-term care (HC.R.6.1). More details on data can be found in Annex I. 9 Private LTC expenditure: co-payments and direct out-of-pocket payments.
14
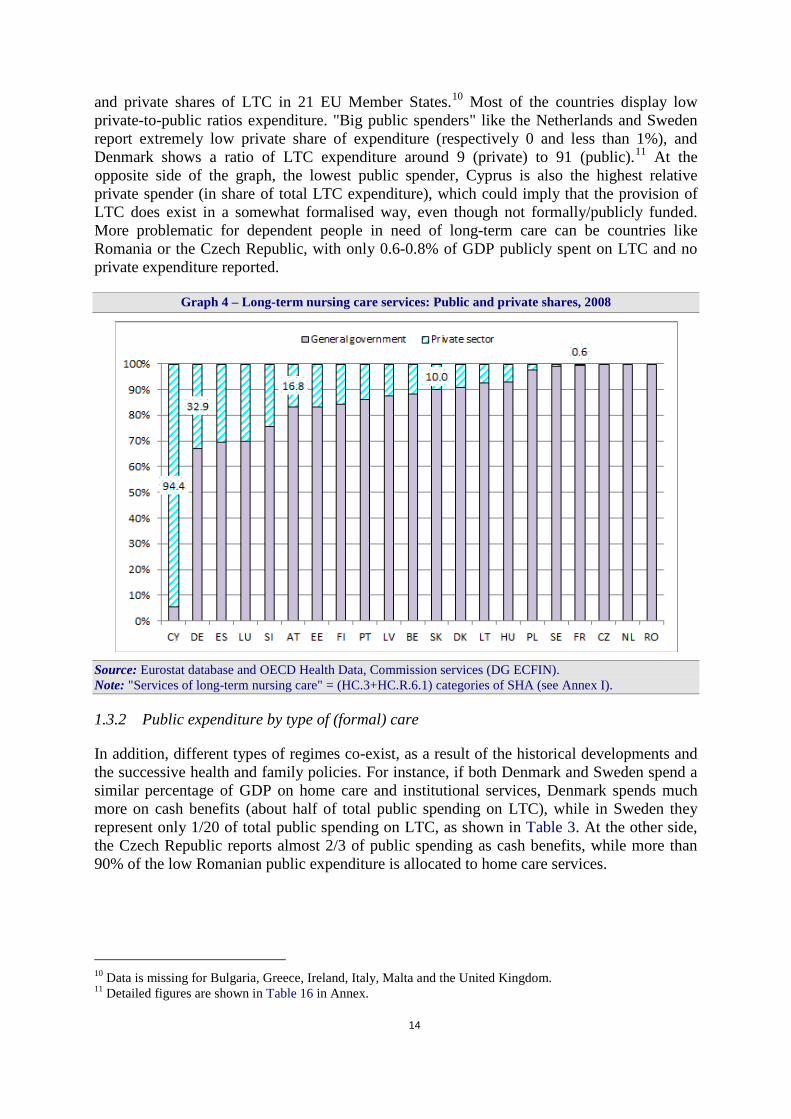
and private shares of LTC in 21 EU Member States.10 Most of the countries display low private-to-public ratios expenditure. "Big public spenders" like the Netherlands and Sweden report extremely low private share of expenditure (respectively 0 and less than 1%), and Denmark shows a ratio of LTC expenditure around 9 (private) to 91 (public).11 At the opposite side of the graph, the lowest public spender, Cyprus is also the highest relative private spender (in share of total LTC expenditure), which could imply that the provision of LTC does exist in a somewhat formalised way, even though not formally/publicly funded. More problematic for dependent people in need of long-term care can be countries like Romania or the Czech Republic, with only 0.6-0.8% of GDP publicly spent on LTC and no private expenditure reported.
Graph 4 – Long-term nursing care services: Public and private shares, 2008
Source: Eurostat database and OECD Health Data, Commission services (DG ECFIN). Note: "Services of long-term nursing care" = (HC.3+HC.R.6.1) categories of SHA (see Annex I).
1.3.2 Public expenditure by type of (formal) care
In addition, different types of regimes co-exist, as a result of the historical developments and the successive health and family policies. For instance, if both Denmark and Sweden spend a similar percentage of GDP on home care and institutional services, Denmark spends much more on cash benefits (about half of total public spending on LTC), while in Sweden they represent only 1/20 of total public spending on LTC, as shown in Table 3. At the other side, the Czech Republic reports almost 2/3 of public spending as cash benefits, while more than 90% of the low Romanian public expenditure is allocated to home care services.
10 Data is missing for Bulgaria, Greece, Ireland, Italy, Malta and the United Kingdom. 11 Detailed figures are shown in Table 16 in Annex.

15
Table 3 – Public expenditure on LTC as % of GDP, by type of care, 2010
Source: Commission services (DG ECFIN), based on 2012 AR.
1.3.3 The balance between formal and informal care
Besides the standard share of expenditure by type of care, another indicator is the proportion of people who actually receive care, i.e. the calculated LTC coverage by source of care.12 First, we define as "dependent" on care those individuals who are reported as "severely disabled".13 On the basis of collected and adjusted data, the numbers of dependents (dependency rates times population, in each age-gender group) are then compared to the numbers of recipients for different types of coverage. The remaining, deducted from all formal types of care, is considered as dependents receiving only – not publicly funded – informal care (or no care at all). Note though that: 1) no differentiated dependency rates are available by type of care, and 2) the possible overlaps between two types of care (e.g. home care and cash benefits) cannot be taken into account due to the lack of data. In addition, two more possible data issues may give rise to some over- or under-estimations. First, as will be explained in detail in subsequent sections, dependency rates are an imperfect and subjective measure, though a standardized one. Second, the data on numbers of recipients of various types of care is also imperfect or not provided by some Member States, and therefore replaced by the relevant EU-15 or EU-12 average.
12 In-kind benefits – at home or in institution – or cash benefits. 13 For a complete definition of "dependency", see section 2.2.
16
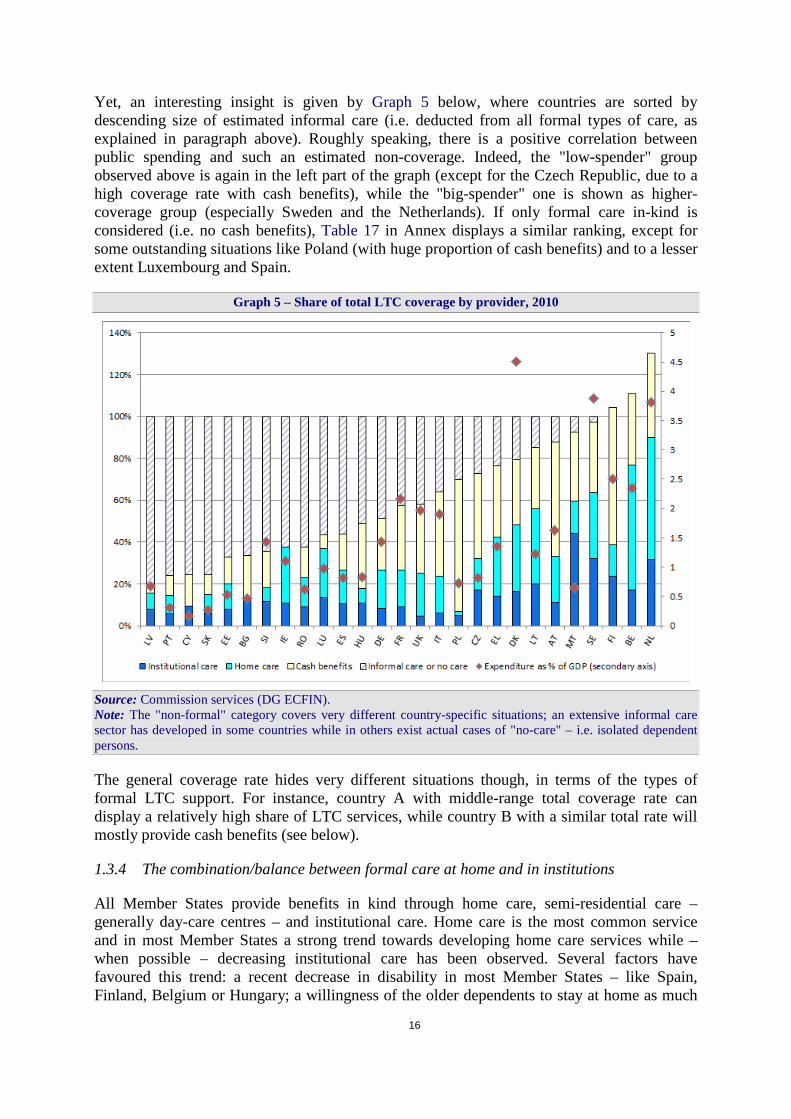
Yet, an interesting insight is given by Graph 5 below, where countries are sorted by descending size of estimated informal care (i.e. deducted from all formal types of care, as explained in paragraph above). Roughly speaking, there is a positive correlation between public spending and such an estimated non-coverage. Indeed, the "low-spender" group observed above is again in the left part of the graph (except for the Czech Republic, due to a high coverage rate with cash benefits), while the "big-spender" one is shown as higher-coverage group (especially Sweden and the Netherlands). If only formal care in-kind is considered (i.e. no cash benefits), Table 17 in Annex displays a similar ranking, except for some outstanding situations like Poland (with huge proportion of cash benefits) and to a lesser extent Luxembourg and Spain.
Graph 5 – Share of total LTC coverage by provider, 2010
Source: Commission services (DG ECFIN). Note: The "non-formal" category covers very different country-specific situations; an extensive informal care sector has developed in some countries while in others exist actual cases of "no-care" – i.e. isolated dependent persons.
The general coverage rate hides very different situations though, in terms of the types of formal LTC support. For instance, country A with middle-range total coverage rate can display a relatively high share of LTC services, while country B with a similar total rate will mostly provide cash benefits (see below).
1.3.4 The combination/balance between formal care at home and in institutions
All Member States provide benefits in kind through home care, semi-residential care – generally day-care centres – and institutional care. Home care is the most common service and in most Member States a strong trend towards developing home care services while – when possible – decreasing institutional care has been observed. Several factors have favoured this trend: a recent decrease in disability in most Member States – like Spain, Finland, Belgium or Hungary; a willingness of the older dependents to stay at home as much
17
as possible, along with higher incomes and better living standards than in the past; and various other factors such as technological innovation together with new and modern forms of service delivery organization (Tarricone and Tsouros, 2008).
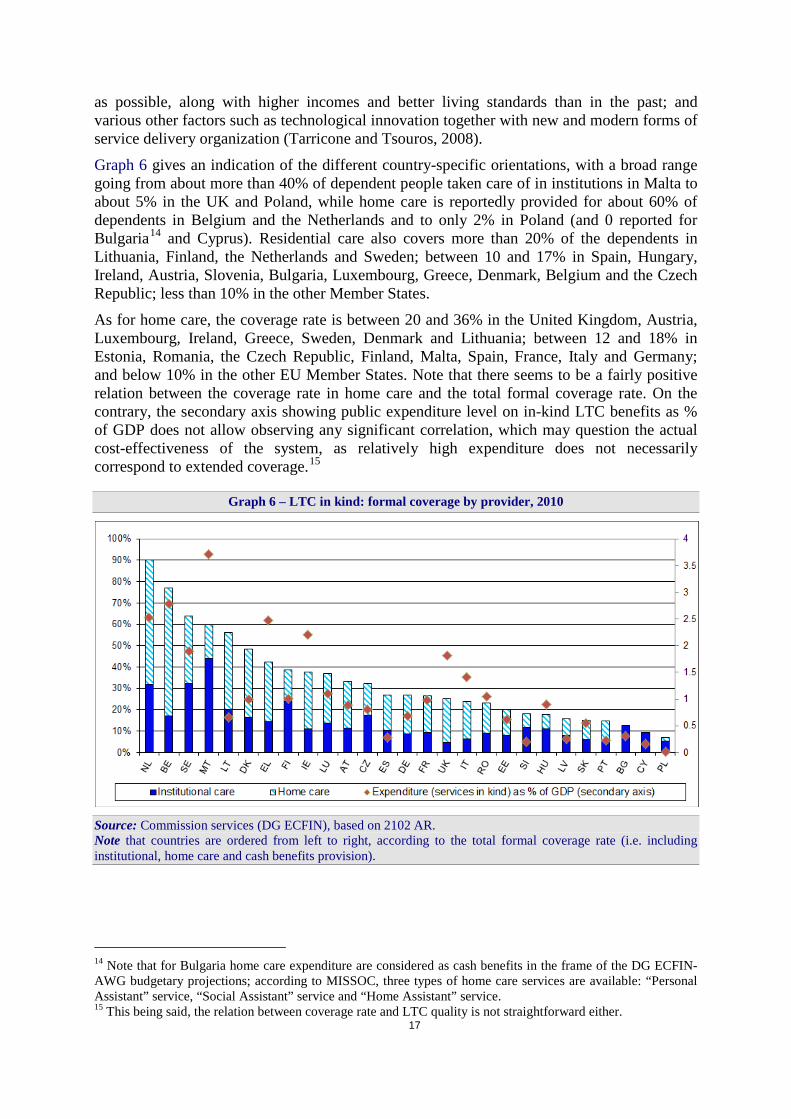
Graph 6 gives an indication of the different country-specific orientations, with a broad range going from about more than 40% of dependent people taken care of in institutions in Malta to about 5% in the UK and Poland, while home care is reportedly provided for about 60% of dependents in Belgium and the Netherlands and to only 2% in Poland (and 0 reported for Bulgaria14 and Cyprus). Residential care also covers more than 20% of the dependents in Lithuania, Finland, the Netherlands and Sweden; between 10 and 17% in Spain, Hungary, Ireland, Austria, Slovenia, Bulgaria, Luxembourg, Greece, Denmark, Belgium and the Czech Republic; less than 10% in the other Member States.
As for home care, the coverage rate is between 20 and 36% in the United Kingdom, Austria, Luxembourg, Ireland, Greece, Sweden, Denmark and Lithuania; between 12 and 18% in Estonia, Romania, the Czech Republic, Finland, Malta, Spain, France, Italy and Germany; and below 10% in the other EU Member States. Note that there seems to be a fairly positive relation between the coverage rate in home care and the total formal coverage rate. On the contrary, the secondary axis showing public expenditure level on in-kind LTC benefits as % of GDP does not allow observing any significant correlation, which may question the actual cost-effectiveness of the system, as relatively high expenditure does not necessarily correspond to extended coverage.15
Graph 6 – LTC in kind: formal coverage by provider, 2010
Source: Commission services (DG ECFIN), based on 2102 AR. Note that countries are ordered from left to right, according to the total formal coverage rate (i.e. including institutional, home care and cash benefits provision).
14 Note that for Bulgaria home care expenditure are considered as cash benefits in the frame of the DG ECFIN-AWG budgetary projections; according to MISSOC, three types of home care services are available: “Personal Assistant” service, “Social Assistant” service and “Home Assistant” service. 15 This being said, the relation between coverage rate and LTC quality is not straightforward either.
18
1.3.5 The balance between benefits in kind and in cash
As mentioned before, instead of or in combination with the benefits in kind, cash benefits are provided in almost all Member States16 to purchase formal care services at home or in an institution or to pay informal caregivers as income support. Table 18 in Annex details cash benefits patterns in each Member State. The amount granted generally depends on the physical dependence status albeit it can be a fixed amount as in Bulgaria, Luxembourg, Portugal and the United Kingdom. In Belgium, Germany, Spain, Ireland, Cyprus, Slovakia, Sweden and the United Kingdom, there is also a maximum income ceiling constraint to be eligible and in a few Member States (the Czech Republic, France, Ireland, Poland, Romania and Slovakia) the benefit amount that will be provided is means-tested. Many countries offer also additional targeted assistance for purchasing and repair of technical supportive devices.
In some Member States (Germany, Cyprus, Luxembourg, Malta, the Netherlands, Poland, Romania, Slovenia, Slovakia and Sweden), the beneficiaries can choose freely between receiving benefits in kind or cash benefits. The combination of both types of benefits is also possible in many Member States and informal caregivers are provided with paid benefits or risk coverage in most countries. Graph 5 above shows the relative proportions of the different categories of formal care in the 27 EU Member States, including cash benefits. A very large variety of different patterns can be observed, meaning possible implications and opportunities for policy makers.17 Here again, the proportion of cash benefits can be extremely high in countries like Finland and Poland (respectively around 66 and 63% of dependents receive such cash benefits), and much lower in Luxembourg and Latvia (resp. 6.6 and 4.5%). Note that the cash-benefits coverage cannot be linked to the relative level of total public expenditure on LTC (shown on the secondary axis).
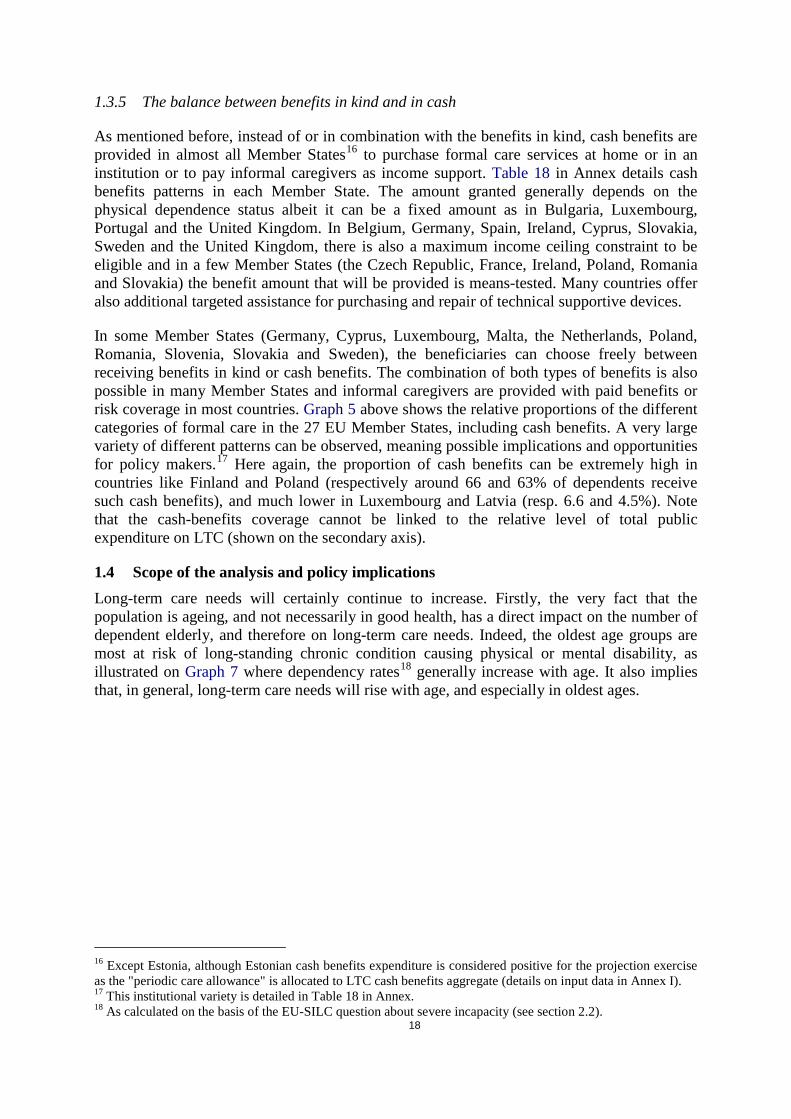
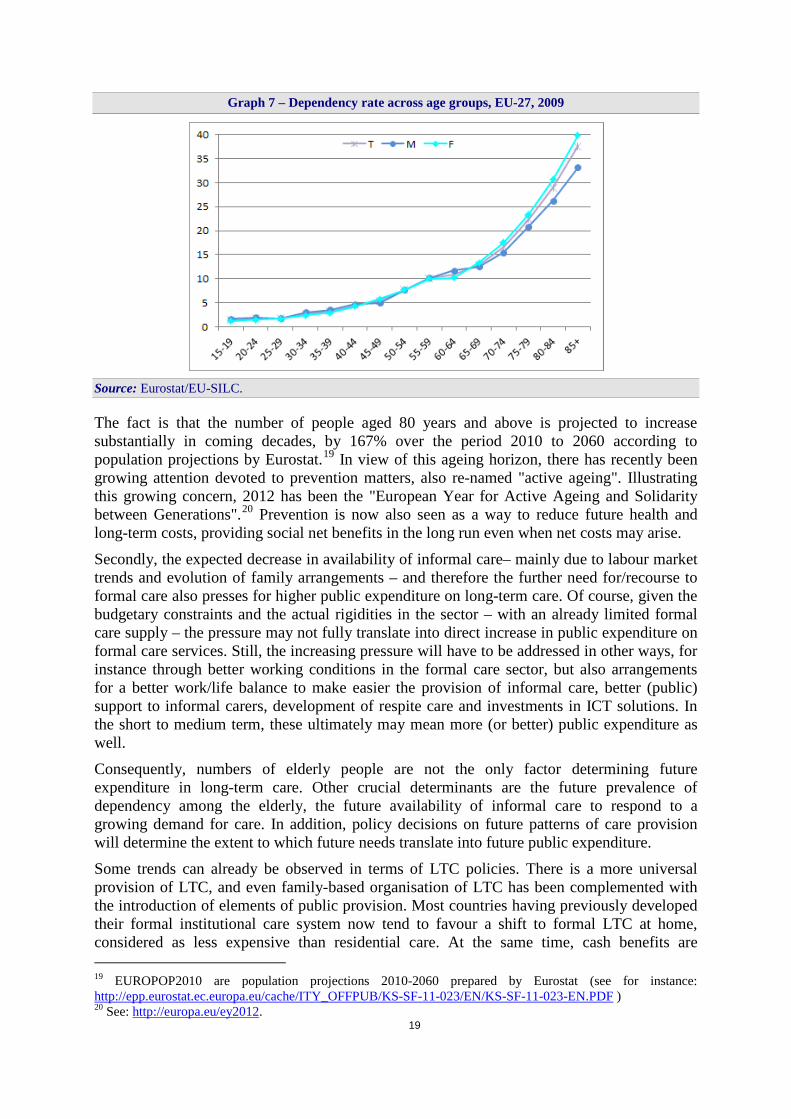
1.4 Scope of the analysis and policy implications Long-term care needs will certainly continue to increase. Firstly, the very fact that the population is ageing, and not necessarily in good health, has a direct impact on the number of dependent elderly, and therefore on long-term care needs. Indeed, the oldest age groups are most at risk of long-standing chronic condition causing physical or mental disability, as illustrated on Graph 7 where dependency rates18 generally increase with age. It also implies that, in general, long-term care needs will rise with age, and especially in oldest ages.
16 Except Estonia, although Estonian cash benefits expenditure is considered positive for the projection exercise as the "periodic care allowance" is allocated to LTC cash benefits aggregate (details on input data in Annex I). 17 This institutional variety is detailed in Table 18 in Annex. 18 As calculated on the basis of the EU-SILC question about severe incapacity (see section 2.2).
19
Graph 7 – Dependency rate across age groups, EU-27, 2009
Source: Eurostat/EU-SILC.
The fact is that the number of people aged 80 years and above is projected to increase substantially in coming decades, by 167% over the period 2010 to 2060 according to population projections by Eurostat.19 In view of this ageing horizon, there has recently been growing attention devoted to prevention matters, also re-named "active ageing". Illustrating this growing concern, 2012 has been the "European Year for Active Ageing and Solidarity between Generations".20 Prevention is now also seen as a way to reduce future health and long-term costs, providing social net benefits in the long run even when net costs may arise.
Secondly, the expected decrease in availability of informal care– mainly due to labour market trends and evolution of family arrangements – and therefore the further need for/recourse to formal care also presses for higher public expenditure on long-term care. Of course, given the budgetary constraints and the actual rigidities in the sector – with an already limited formal care supply – the pressure may not fully translate into direct increase in public expenditure on formal care services. Still, the increasing pressure will have to be addressed in other ways, for instance through better working conditions in the formal care sector, but also arrangements for a better work/life balance to make easier the provision of informal care, better (public) support to informal carers, development of respite care and investments in ICT solutions. In the short to medium term, these ultimately may mean more (or better) public expenditure as well.
Consequently, numbers of elderly people are not the only factor determining future expenditure in long-term care. Other crucial determinants are the future prevalence of dependency among the elderly, the future availability of informal care to respond to a growing demand for care. In addition, policy decisions on future patterns of care provision will determine the extent to which future needs translate into future public expenditure.
Some trends can already be observed in terms of LTC policies. There is a more universal provision of LTC, and even family-based organisation of LTC has been complemented with the introduction of elements of public provision. Most countries having previously developed their formal institutional care system now tend to favour a shift to formal LTC at home, considered as less expensive than residential care. At the same time, cash benefits are 19 EUROPOP2010 are population projections 2010-2060 prepared by Eurostat (see for instance: http://epp.eurostat.ec.europa.eu/cache/ITY_OFFPUB/KS-SF-11-023/EN/KS-SF-11-023-EN.PDF ) 20 See: http://europa.eu/ey2012.
20
becoming more and more frequent, and informal care is increasingly – although still too little – supported by developing respite care and/or fiscal measures. To what extent are these policies sustainable?
Indeed, concerns about future expenditure on long-term care are similar to those about future expenditure on pensions or health care: how will future expenditure affect the sustainability of public finances? In view of current and expected economic developments, governments will have to make – sometimes tough – allocation choices between different kinds of public demand. Time for unconstrained social security developments is gone. Further, European countries may have different preferences in terms of formal care. Some will favour the freedom of cash benefits while others will prefer the convenience and supposed egalitarianism of direct services. This variety should not hamper the ability of European citizens to move across Europe, and should not lead to unequal treatment cases. In other words, all caution must be exercised in order to allow for free movement of citizens, while keeping advantage of LTC support.
The rest of the paper elaborates on findings from the projections of future long-term care public expenditure, based on the report prepared by the European Commission in co-operation with Member States delegates in the Ageing Working Group of the Economic Policy Committee.21 The annex describes the models and the data used.
2 DETERMINANTS OF LONG-TERM CARE EXPENDITURE: DEMAND AND SUPPLY – NEEDS AND PROVISION
Public expenditure on long-term care is determined by the demand and supply of long-term care services, which are affected by a number of various factors. The present section identifies those factors, which will serve the impact analysis of possible future changes. The socio-demographic developments and the health status of the population – i.e. the dependency trend – are the main demand-side factors. On the supply side, the factors include the patterns of long-term care provision (organisation and financing of the system), essentially the extent to which Member States rely on the different types of formal, paid care and/or on informal care. They also include the availability of human resources, be it for formal or informal care supply. The way these factors may impact on public expenditure on long-term care is described below.
Economic growth and technological progress may also play a role (although to a lesser extent than in the case of "acute" health care). Indeed, technology is often seen as a promising development in long-term care. Many solutions – including mainly IT devices such as tele-assistance, self-assessed and monitored checks – are still to be created and/or their use to be further developed in order to facilitate daily life for the disabled and dependent people, especially the older ones. They are often expected to alleviate somewhat the announced increase in long-term care demand.22 This factor could not be explored in the current paper though, as data is very poor on that matter.
21 European Commission and Economic Policy Committee (2012), "The 2012 Ageing Report: Economic and budgetary projections for the 27 EU Member States (2010-2060)", European Economy. 2/2012, Brussels. See: http://ec.europa.eu/economy_finance/publications/european_economy/2012/2012-ageing-report_en.htm. 22 See Fujisawa & Colombo (2009).

21
2.1 Demography A key element of the projections of public expenditure on long-term care is the estimation of the future population's size that will require long-term care, i.e. the potential number of beneficiaries. The rise in the numbers of older people expected in the coming decades is seen as a major determinant of increased need and therefore demand for long-term care services. Indeed, the increase in life expectancy may translate in an increase in the number of years during which long-term care services are provided and therefore costs accumulate.23
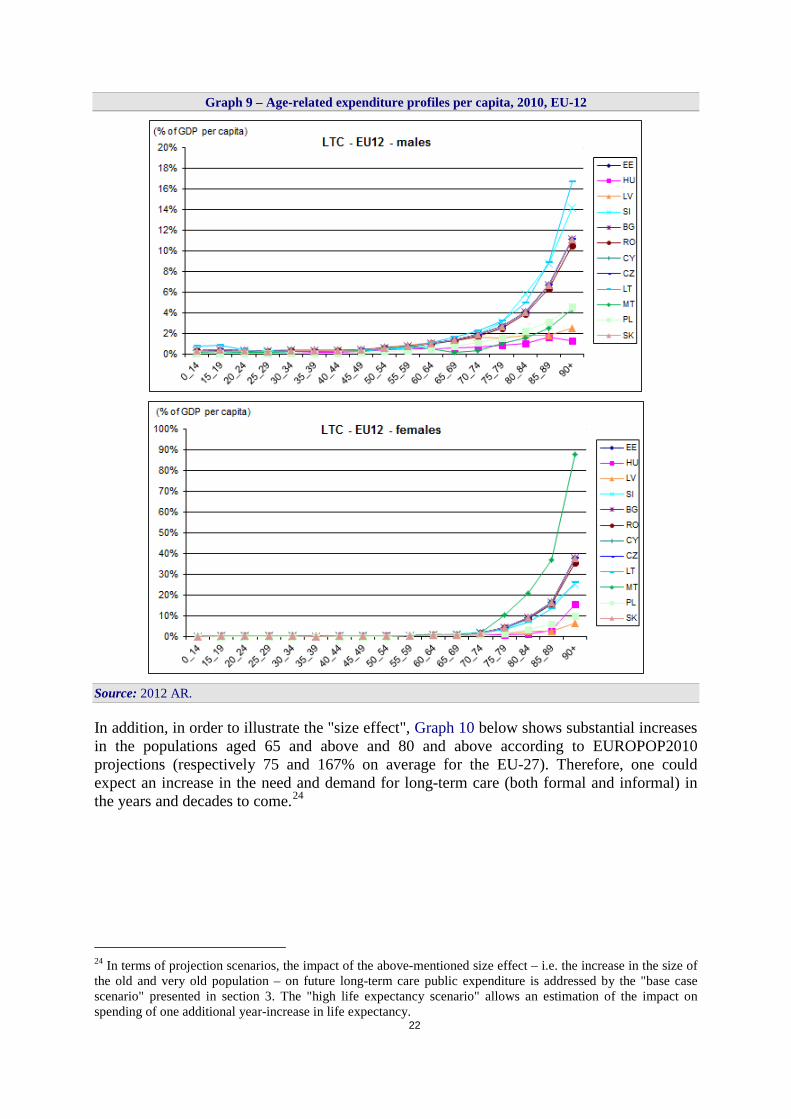
The need for long-term care is determined by the overall health status of the population, which is highly correlated with the share of elderly people in the overall population. Indeed, the risk of living with physical or mental disability leading to a dependency situation tends to increase with age, especially with very old age (80+). This relationship between the age of an individual and his/her demand for long-term care is well illustrated by the so-called "age-related expenditure profiles per capita" shown in Graph 8 and Graph 9. The graphs plot average public per capita spending on long-term care (as percentage of GDP per capita) against the age of individuals, for EU-15 and EU-12. As can be seen, per capita expenditure increases substantially from the age of 65 onwards.
Graph 8 – Age-related expenditure profiles per capita, 2010, EU-15
Source: 2012 AR. 23 Which is further developed in section 2.2 on dependency levels.
22
Graph 9 – Age-related expenditure profiles per capita, 2010, EU-12
Source: 2012 AR.
In addition, in order to illustrate the "size effect", Graph 10 below shows substantial increases in the populations aged 65 and above and 80 and above according to EUROPOP2010 projections (respectively 75 and 167% on average for the EU-27). Therefore, one could expect an increase in the need and demand for long-term care (both formal and informal) in the years and decades to come.24
24 In terms of projection scenarios, the impact of the above-mentioned size effect – i.e. the increase in the size of the old and very old population – on future long-term care public expenditure is addressed by the "base case scenario" presented in section 3. The "high life expectancy scenario" allows an estimation of the impact on spending of one additional year-increase in life expectancy.
23
Graph 10 – Projected change of older population groups (in % change, over the period 2010-2060)
Source: 2012 AR.
Yet the rise in the number of the old and very old people is by no means the only factor of pressure on LTC expenditure. The need for long-term care is not arising from ageing itself; it is a consequence of frailty, causing dependency on others.
2.2 Dependency levels - developments in health status The previous point puts forward that increased longevity (i.e. increased life expectancy) can contribute to increase future long-term care spending. The increase in life expectancy may translate in an increase in the number of years during which long-term care services are provided and thus costs accumulate. This is the case when longevity is not accompanied by corresponding improvement in the "quality" of life.
Therefore, the need for long-term care is not arising from ageing per se; it is a consequence of frailty, and then disability, causing individuals to be dependent on others; and dependency itself often – but not necessarily – comes with age. There is an ongoing debate on the future developments of disability and dependency, defined as some form of functional impairment of the individual. In the LTC sector, dependency generally refers to the inability to perform daily personal care tasks. It is often referred to as "ADL-dependency" i.e. difficulties in performing at least one Activity of Daily Living25 (ADL).
Starting at the beginning, what determines the demand – in economic terms – for long-term care and the consequent expenditure is not only disability, but also the extent to which this disability transfers into dependency, and therefore requires some type of long-term care provision.
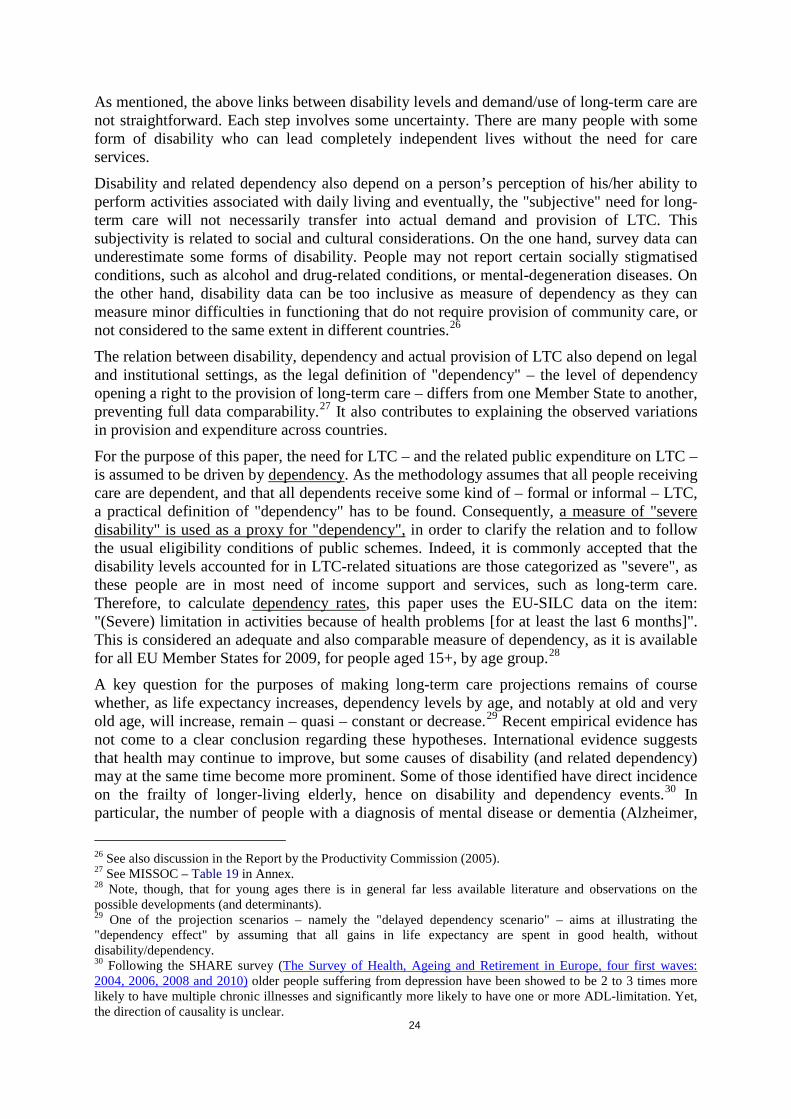
Therefore, one could illustrate the causality on the demand side as follows:
25 Such as eating, bathing, dressing, getting in and out of bed or using the toilet.
Disability Dependency Need for LTC Demand for LTC
24
As mentioned, the above links between disability levels and demand/use of long-term care are not straightforward. Each step involves some uncertainty. There are many people with some form of disability who can lead completely independent lives without the need for care services.
Disability and related dependency also depend on a person’s perception of his/her ability to perform activities associated with daily living and eventually, the "subjective" need for long-term care will not necessarily transfer into actual demand and provision of LTC. This subjectivity is related to social and cultural considerations. On the one hand, survey data can underestimate some forms of disability. People may not report certain socially stigmatised conditions, such as alcohol and drug-related conditions, or mental-degeneration diseases. On the other hand, disability data can be too inclusive as measure of dependency as they can measure minor difficulties in functioning that do not require provision of community care, or not considered to the same extent in different countries.26
The relation between disability, dependency and actual provision of LTC also depend on legal and institutional settings, as the legal definition of "dependency" – the level of dependency opening a right to the provision of long-term care – differs from one Member State to another, preventing full data comparability.27 It also contributes to explaining the observed variations in provision and expenditure across countries.
For the purpose of this paper, the need for LTC – and the related public expenditure on LTC – is assumed to be driven by dependency. As the methodology assumes that all people receiving care are dependent, and that all dependents receive some kind of – formal or informal – LTC, a practical definition of "dependency" has to be found. Consequently, a measure of "severe disability" is used as a proxy for "dependency", in order to clarify the relation and to follow the usual eligibility conditions of public schemes. Indeed, it is commonly accepted that the disability levels accounted for in LTC-related situations are those categorized as "severe", as these people are in most need of income support and services, such as long-term care. Therefore, to calculate dependency rates, this paper uses the EU-SILC data on the item: "(Severe) limitation in activities because of health problems [for at least the last 6 months]". This is considered an adequate and also comparable measure of dependency, as it is available for all EU Member States for 2009, for people aged 15+, by age group.28
A key question for the purposes of making long-term care projections remains of course whether, as life expectancy increases, dependency levels by age, and notably at old and very old age, will increase, remain – quasi – constant or decrease.29 Recent empirical evidence has not come to a clear conclusion regarding these hypotheses. International evidence suggests that health may continue to improve, but some causes of disability (and related dependency) may at the same time become more prominent. Some of those identified have direct incidence on the frailty of longer-living elderly, hence on disability and dependency events.30 In particular, the number of people with a diagnosis of mental disease or dementia (Alzheimer,
26 See also discussion in the Report by the Productivity Commission (2005). 27 See MISSOC – Table 19 in Annex. 28 Note, though, that for young ages there is in general far less available literature and observations on the possible developments (and determinants). 29 One of the projection scenarios – namely the "delayed dependency scenario" – aims at illustrating the "dependency effect" by assuming that all gains in life expectancy are spent in good health, without disability/dependency. 30 Following the SHARE survey (The Survey of Health, Ageing and Retirement in Europe, four first waves: 2004, 2006, 2008 and 2010) older people suffering from depression have been showed to be 2 to 3 times more likely to have multiple chronic illnesses and significantly more likely to have one or more ADL-limitation. Yet, the direction of causality is unclear.

25
Parkinson) could increase.31 On the other hand, certain studies have noted that as life expectancy increases the incidence of severe disability is postponed, leading to a reduction in the prevalence of severe disability (and thereby, of dependency) for some age-groups. When the topic is severe disability – as it is in this paper – there seems to be stronger evidence in recent papers for a dependency development which would be similar to the mortality one, suggesting that people are not only living longer, but also longer with less disability and fewer functional limitations.32
To sum up, the projected future numbers of dependent people is a key element in the projected expenditure developments. For the projection exercise in this paper, a common definition of dependency is used for all countries – based on the EU-SILC – adjusted for each country to the number of recipients (by age groups) when it is provided.33 Table 4 below gives an overview of the dependency rates for the 65-year old and more, for 2006 and 2009, showing various recent trends among countries and among age groups.34
Table 4 – Disability rates in 2006 and 2009
Source: Commission services (DG ECFIN), based on the EU-SILC data. 31 Even this trend is unclear, though. The current numbers of people with dementia are considered as huge. For instance, the SHARE survey shows that almost one third of the people aged 50 and over have symptoms of depression, especially older women aged 75 and over – almost 45% - even though there is significant variation between Member States. On the basis of Wimo et al. (2010), OECD (2011) shows that the average percentage of population aged 60+ living with dementia is 5.6% for the 21 recorded EU Member States, while Ballard et al. (2011) state figures of 5.4 % for Western Europe in 2005, for a total of 24 million people worldwide having dementia. As for the recent trend, Ikejima et al. (2011) for instance conclude to an upward trend of dementia prevalence in Japan. On the other hand, some other Alzheimer's- or broader dementia-related studies (Langa et al., 2008, for the USA; Qiu et al., 2011 for Sweden) are quite optimistic, arguing for observed stability or even starting improvement – compression of cognitive morbidity – over the recent years. 32 See for instance Christensen et al. (2009). 33 For age groups below 65, see complete Table 14 in Annex. 34 Given that the standard surveys, including EU-SILC, do not interview institutionalised people, hasty interpretations could be misleading. For instance, an upward disability trend of the oldest group (85+) between 2006 and 2009 could as well be due to increased empowerment in order for this group of disabled people to stay at home while they would have relied before on institutionalisation.
26
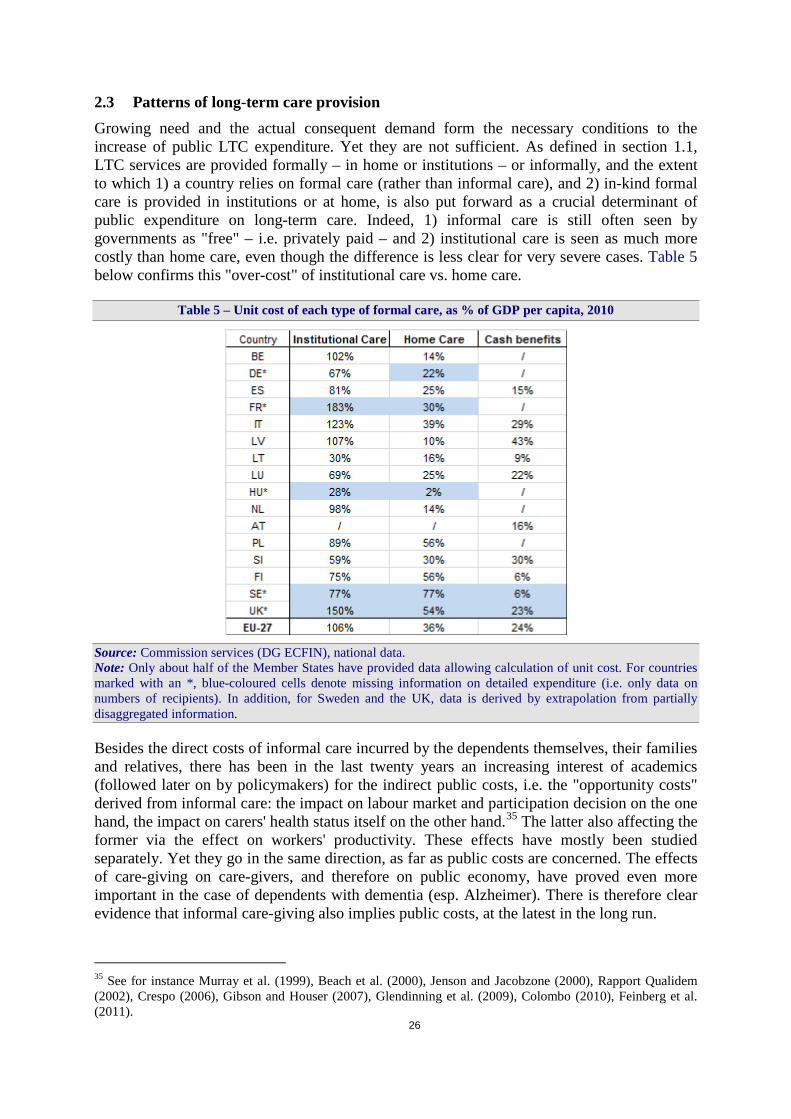
2.3 Patterns of long-term care provision Growing need and the actual consequent demand form the necessary conditions to the increase of public LTC expenditure. Yet they are not sufficient. As defined in section 1.1, LTC services are provided formally – in home or institutions – or informally, and the extent to which 1) a country relies on formal care (rather than informal care), and 2) in-kind formal care is provided in institutions or at home, is also put forward as a crucial determinant of public expenditure on long-term care. Indeed, 1) informal care is still often seen by governments as "free" – i.e. privately paid – and 2) institutional care is seen as much more costly than home care, even though the difference is less clear for very severe cases. Table 5 below confirms this "over-cost" of institutional care vs. home care.
Table 5 – Unit cost of each type of formal care, as % of GDP per capita, 2010
Source: Commission services (DG ECFIN), national data. Note: Only about half of the Member States have provided data allowing calculation of unit cost. For countries marked with an *, blue-coloured cells denote missing information on detailed expenditure (i.e. only data on numbers of recipients). In addition, for Sweden and the UK, data is derived by extrapolation from partially disaggregated information.
Besides the direct costs of informal care incurred by the dependents themselves, their families and relatives, there has been in the last twenty years an increasing interest of academics (followed later on by policymakers) for the indirect public costs, i.e. the "opportunity costs" derived from informal care: the impact on labour market and participation decision on the one hand, the impact on carers' health status itself on the other hand.35 The latter also affecting the former via the effect on workers' productivity. These effects have mostly been studied separately. Yet they go in the same direction, as far as public costs are concerned. The effects of care-giving on care-givers, and therefore on public economy, have proved even more important in the case of dependents with dementia (esp. Alzheimer). There is therefore clear evidence that informal care-giving also implies public costs, at the latest in the long run.
35 See for instance Murray et al. (1999), Beach et al. (2000), Jenson and Jacobzone (2000), Rapport Qualidem (2002), Crespo (2006), Gibson and Houser (2007), Glendinning et al. (2009), Colombo (2010), Feinberg et al. (2011).

27
As detailed in chapter 1, long-term care is delivered informally by families and friends – mainly spouses, daughters and step-daughters – and formally by care assistants who are paid under some form of employment contract. The governments of most EU Member States are involved in either the provision or financing of long-term care services, or often both. Yet, the extent and nature of their involvement differs widely across countries. Some Member States rely heavily on the informal provision of long-term care and their expenditure on formal care is accordingly small, while other Member States provide extensive public coverage to the dependent – in particular, the elderly population – and devote a significant share of GDP to fund their policies.
First, pressure for increased public provision and financing of long-term care may grow substantially in coming decades, especially in Member States where the bulk of long-term care is currently provided informally. Second, the challenge within the formal care sector itself is to define the most appropriate balance between the different types of formal care (in institutions, at home, in cash), and to provide the necessary supporting measures and policies to achieve this balance. Note also that the private market for LTC is still under-developed in most Member States and is most often not a real alternative yet.36
Some scenarios are proposed in chapter 3 to analyse the impact of changes in the relative size of the different components, such as a shift from informal (or cash) to formal care services, or an extension of the formal coverage in any form (institutional, home care or cash benefits). The possible impact of such pressure for increased public provision and financing on the average cost of care per person can also be envisaged.
2.4 Care supply – availability of human resources A growing pressure for increased public provision is expected in coming decades. In addition, the governments will have to continue struggling to determine and sustainably establish the most appropriate balance between the various forms of LTC. Therefore, it implies a new or changing demand for LTC, and the issue is whether the LTC market will be able to answer this demand. The simulation model presented in chapter 3 implicitly assumes that all those receiving home care, institutional care or cash benefits are dependent, and that all persons deemed dependent either receive informal care, cash benefits, home care or institutional care. However, one should be aware that the provision of LTC is not as flexible as usually assumed, be it for formal or for informal care. Further, the substitution effects between formal and informal care are not as straightforward.
2.4.1 Formal care
Typically, LTC workers a) are women, b) have lower qualifications (than health workers), although requirements are higher for institutional care than for home care and c) earn lower wages than the average wage in the economy, even though their wage levels are often higher than the average wage of many low-skilled professions.37
In some countries, the vacancy rates in the formal care sector are already high.38 There is a high turnover in the LTC workforce, partly due to low status associated with low pay, and – therefore – education, training and retention difficulties. Fujisawa and Colombo (2009) show that, according to the OECD Pilot data collection on long-term care workforce of 2008, the
36 On LTC - market failures and the respective roles of state, family and market, see for instance Cremer & Pestieau (2009). 37 See for instance Colombo et al. (2011)', Fujisawa and Colombo (2009). 38 See country-specific studies reviewed in Fujisawa and Colombo (2009).
28
number of formal LTC workers per 1 000 over 65-year old elderly ranges between 16 in France and 213 in the Netherlands – a high variation which is in part explained by limits to data comparability,39 differences in country arrangements and in the prevalence of part-time arrangements.
In the projected future, there will be fewer people of working age, more women at work, and a decline in the size of the low-skilled workforce, which is especially relevant for home-care services. Given the above-listed characteristics of the LTC workforce, this implies an expected shortage of LTC staff. It is also noteworthy that in some EU and OECD countries, migrants are already a significant and increasing share of formal LTC workforce.40.
A potential – possible – pressure on formal provision of LTC may also have an impact on wages in the sector, at least in the short run. Indeed, the cost of long-term care is dominated by labour costs, and changes in wage rates of nurses and other LTC workers (due to relative labour shortages for example) are likely to influence future costs of care. In Australia for instance, Hogan (2004) found that the LTC workforce would have needed to increase by 35 per cent over the next decade compared with an 8 per cent increase in the entire Australian workforce.41 As a result, some increase in LTC workers' wages is expected, at least in the short term. However, as stated in the same Report (Productivity Commission, 2005), there are minimal barriers to entry in the LTC sector, and it is unlikely that LTC wages will exceed general wage rises over a long period.
2.4.2 Informal care: availability and propensity to provide care
While some people receive informal care from friends and relatives42, most informal care is provided by either partners, or children and children-in-law (the so-called "intergenerational care"). The provision of care increases with age and generally reaches a peak in the "pivot-age" population, i.e. the age cohorts 45-64.43,44 In order to apprehend the future trend and related impact of informal care, two dimensions are to be taken into account: the future availability of potential informal carers and their future propensity to provide care.
2.4.2.1 Absolute and relative availability of carers: dependency ratios
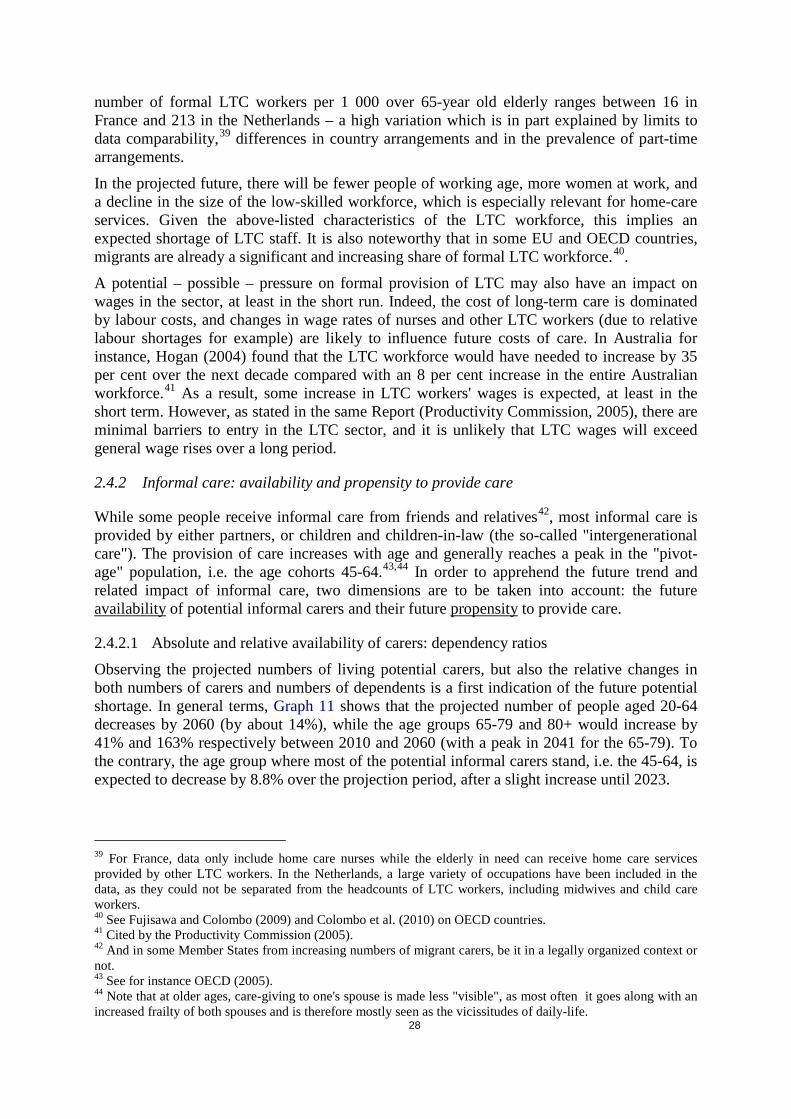
Observing the projected numbers of living potential carers, but also the relative changes in both numbers of carers and numbers of dependents is a first indication of the future potential shortage. In general terms, Graph 11 shows that the projected number of people aged 20-64 decreases by 2060 (by about 14%), while the age groups 65-79 and 80+ would increase by 41% and 163% respectively between 2010 and 2060 (with a peak in 2041 for the 65-79). To the contrary, the age group where most of the potential informal carers stand, i.e. the 45-64, is expected to decrease by 8.8% over the projection period, after a slight increase until 2023.
39 For France, data only include home care nurses while the elderly in need can receive home care services provided by other LTC workers. In the Netherlands, a large variety of occupations have been included in the data, as they could not be separated from the headcounts of LTC workers, including midwives and child care workers. 40 See Fujisawa and Colombo (2009) and Colombo et al. (2010) on OECD countries. 41 Cited by the Productivity Commission (2005). 42 And in some Member States from increasing numbers of migrant carers, be it in a legally organized context or not. 43 See for instance OECD (2005). 44 Note that at older ages, care-giving to one's spouse is made less "visible", as most often it goes along with an increased frailty of both spouses and is therefore mostly seen as the vicissitudes of daily-life.

29
Graph 11 – Projection of population by main age groups, EU-27 (in millions)
Source: Commission services (DG ECFIN), Eurostat, EUROPOP2010.
In addition, some "dependency ratios"45 can be helpful in illustrating the impact of the relative changes in the size of different age groups. The standard dependency ratio usually addresses "economic dependency". It is a measure of the pressure on productive population46, calculated as an age-population ratio of the so-called "dependent", i.e. those typically not in the labour force (the age groups 0-19 and 65+ in this paper), and the "productive", i.e. those typically in the labour force (here the age group 20-45).
As observed in Graph 12, the projected trend of the different economic dependency ratios also shows shrinkage of the future potential workforce. Three types of economic dependency ratios are shown here: a) a "total dependency ratio", showing the numbers of persons in the age groups 0-19 and 65 and older related to the number of 20-64, b) an "old-age dependency ratio" concerning only ratio of the 65+ to the 20-64, and c) a "dependency ratio of the oldest old", i.e. the numbers of 80+ to the numbers of 20-64. Simplifying slightly, it can be shown that the total ratio increases by half between 2010 and 2060, while the second ratio (old age) doubles and the third one (80+) even triples in the EU-27 over the projection horizon, from 7.7 in 2010 to 23.6 in 2060.47
45 Not to confuse with "dependency rates" also used in the paper, relating to the actual population's health status. 46 Alternatively the "contributory population", as the topics addressed by these ratios generally relate to social security matters. 47 Detailed graphs for all EU-27 countries can be found in the statistical annex of the Ageing Report 2012 (European Commission – DG ECFIN and Economic Policy Committee – AWG, 2012).

30
Graph 12 – Economic dependency ratios, EU-27 (in millions)
Source: Commission services (DG ECFIN), Eurostat, on the basis of EUROPOP2010.
Given that the actual issue is the future availability of carers, and that a peak in the provision of caring time is generally observed in the age group 45-64, another type of dependency ratio would be interesting to calculate, that could be named "caring dependency ratio". As shown in Graph 13, the projected ratio of the 65 years old and over to the 45-64 years old almost doubles by 2060, while the ratio of the 80+ to the 45-64 increases from 17.8 in 2010 to 51.3 in 2060, i.e. a bit less than tripling. In other words, in 2060 one potential carer (i.e. a person aged 45-64) is expected for 51 persons of 80 years old or more. This hints at the potential gap between supply and demand of LTC.
Graph 13 – Caring dependency ratios, EU-27 (in millions)
Source: Commission services (DG ECFIN), Eurostat, on the basis of EUROPOP2010.
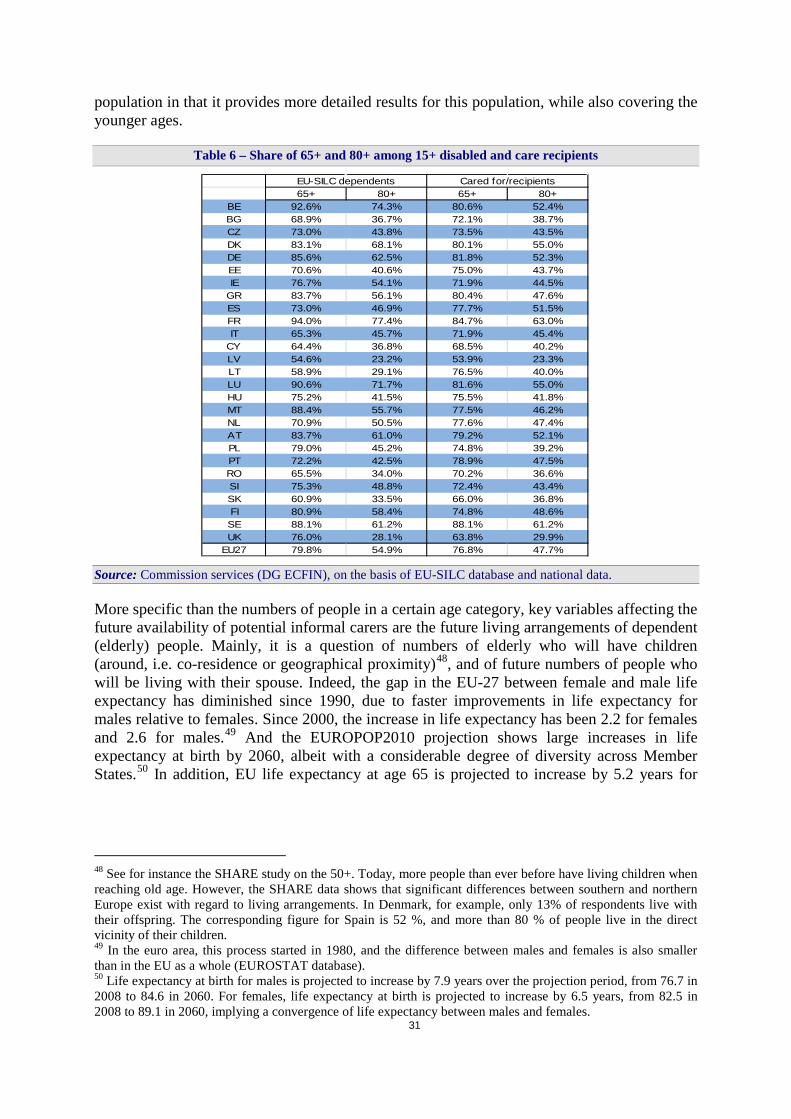
Of course, not all older people are dependent, and not all dependents are 65 years old or more. Yet, as depicted in Table 6, the major part of the dependent population is 65 years old or more, though with very different shares across the EU-27. Furthermore, the bulk of the available literature addressing LTC issues has been developed with a strong focus on the elderly population. Therefore, the present paper is more – but not only – focused on the older
31
population in that it provides more detailed results for this population, while also covering the younger ages.
Table 6 – Share of 65+ and 80+ among 15+ disabled and care recipients
Source: Commission services (DG ECFIN), on the basis of EU-SILC database and national data.
More specific than the numbers of people in a certain age category, key variables affecting the future availability of potential informal carers are the future living arrangements of dependent (elderly) people. Mainly, it is a question of numbers of elderly who will have children (around, i.e. co-residence or geographical proximity)48, and of future numbers of people who will be living with their spouse. Indeed, the gap in the EU-27 between female and male life expectancy has diminished since 1990, due to faster improvements in life expectancy for males relative to females. Since 2000, the increase in life expectancy has been 2.2 for females and 2.6 for males.49 And the EUROPOP2010 projection shows large increases in life expectancy at birth by 2060, albeit with a considerable degree of diversity across Member States.50 In addition, EU life expectancy at age 65 is projected to increase by 5.2 years for
48 See for instance the SHARE study on the 50+. Today, more people than ever before have living children when reaching old age. However, the SHARE data shows that significant differences between southern and northern Europe exist with regard to living arrangements. In Denmark, for example, only 13% of respondents live with their offspring. The corresponding figure for Spain is 52 %, and more than 80 % of people live in the direct vicinity of their children. 49 In the euro area, this process started in 1980, and the difference between males and females is also smaller than in the EU as a whole (EUROSTAT database). 50 Life expectancy at birth for males is projected to increase by 7.9 years over the projection period, from 76.7 in 2008 to 84.6 in 2060. For females, life expectancy at birth is projected to increase by 6.5 years, from 82.5 in 2008 to 89.1 in 2060, implying a convergence of life expectancy between males and females.
65+ 80+ 65+ 80+BE 92.6% 74.3% 80.6% 52.4%BG 68.9% 36.7% 72.1% 38.7%CZ 73.0% 43.8% 73.5% 43.5%DK 83.1% 68.1% 80.1% 55.0%DE 85.6% 62.5% 81.8% 52.3%EE 70.6% 40.6% 75.0% 43.7%IE 76.7% 54.1% 71.9% 44.5%
GR 83.7% 56.1% 80.4% 47.6%ES 73.0% 46.9% 77.7% 51.5%FR 94.0% 77.4% 84.7% 63.0%IT 65.3% 45.7% 71.9% 45.4%
CY 64.4% 36.8% 68.5% 40.2%LV 54.6% 23.2% 53.9% 23.3%LT 58.9% 29.1% 76.5% 40.0%LU 90.6% 71.7% 81.6% 55.0%HU 75.2% 41.5% 75.5% 41.8%MT 88.4% 55.7% 77.5% 46.2%NL 70.9% 50.5% 77.6% 47.4%AT 83.7% 61.0% 79.2% 52.1%PL 79.0% 45.2% 74.8% 39.2%PT 72.2% 42.5% 78.9% 47.5%RO 65.5% 34.0% 70.2% 36.6%SI 75.3% 48.8% 72.4% 43.4%SK 60.9% 33.5% 66.0% 36.8%FI 80.9% 58.4% 74.8% 48.6%SE 88.1% 61.2% 88.1% 61.2%UK 76.0% 28.1% 63.8% 29.9%
EU27 79.8% 54.9% 76.8% 47.7%
EU-SILC dependents Cared for/recipients

32
males and by 4.9 years for females over the projection period, reducing further the gender gap as shown in Graph 14.51
Graph 14 – Life expectancy at birth and at age 65: narrowing gender gap
Source: Commission services (DG ECFIN), Eurostat, on the basis of EUROPOP2010. Note: "LE_2008" = life expectancy at birth in 2008; "LE65_2060" = projected life expectancy at age 65 in 2060.
Therefore, as the gender gap in life expectancy has been narrowing and is expected to continue to decrease, one could expect that, ceteris paribus, couples will live together later in their life, therefore being more able to take care of each other. On the other hand, the number of isolated individuals has been growing, and it is difficult to guess which effect will take over, though some studies have already observed a stabilising or decreasing trend of single-living, indicating a possible reversal of the trend.52
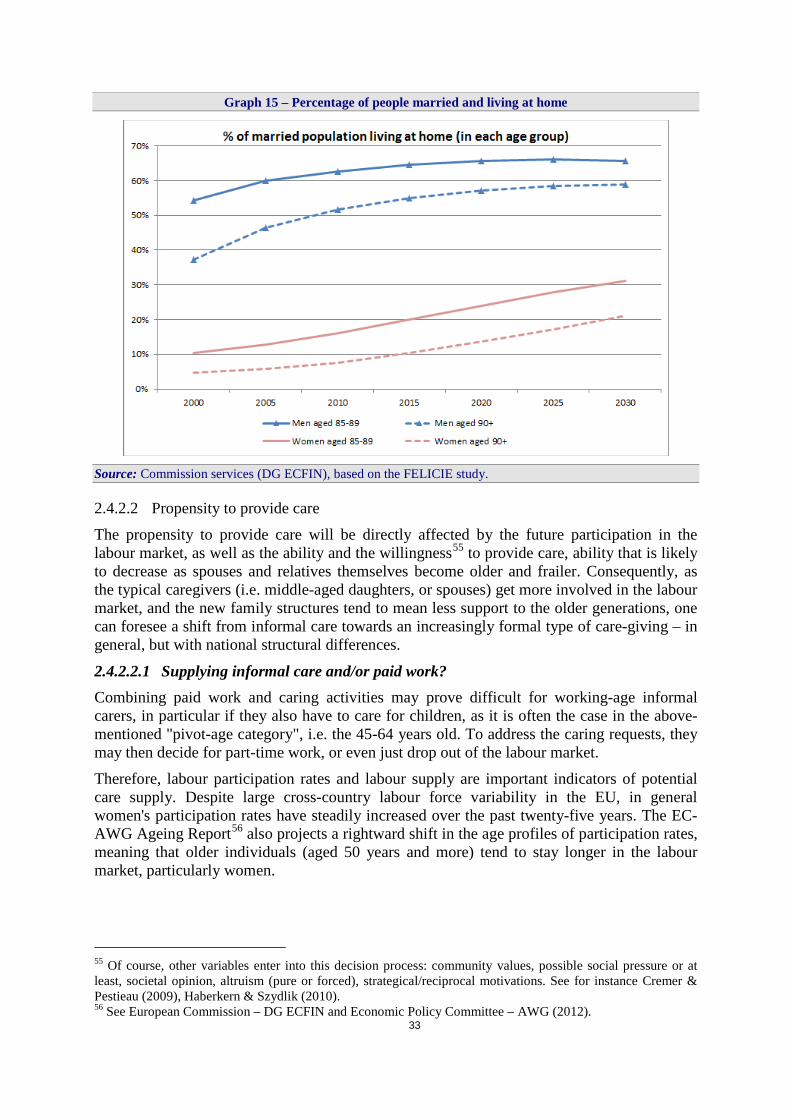
Unfortunately, figures on projected living arrangements are not available on an EU-27-wide basis, nor provided by the individual Member States. FELICIE projections53, only covering the period 2000-2030 showed an increase in the "raw" availability of informal caregivers – here, only partners – by 2030. The 85 years-old and more, both males and females, are thus expected to live more frequently with a partner in 2030 than in 2000, as illustrated on Graph 15. The risk to be without any surviving child would also drop.54
51 In 2060, life expectancy at age 65 will reach 22.4 years for males and 25.6 for females and the projected difference (3.2 years) is smaller than the 4.5-year difference in life expectancy at birth. 52 See for instance Tomassini et al. (2004). 53 FELICIE or "Future of Elderly Living Conditions in Europe": The goal of this project was to forecast the living arrangements of people aged 75+ in the then-next thirty years (2000-2030), with the aim to estimate their needs, through an evaluation of the future demand for nursing homes and for informal and formal care. 54 See Gaymu et al. (2008).
33
Graph 15 – Percentage of people married and living at home
Source: Commission services (DG ECFIN), based on the FELICIE study.
2.4.2.2 Propensity to provide care
The propensity to provide care will be directly affected by the future participation in the labour market, as well as the ability and the willingness55 to provide care, ability that is likely to decrease as spouses and relatives themselves become older and frailer. Consequently, as the typical caregivers (i.e. middle-aged daughters, or spouses) get more involved in the labour market, and the new family structures tend to mean less support to the older generations, one can foresee a shift from informal care towards an increasingly formal type of care-giving – in general, but with national structural differences.
2.4.2.2.1 Supplying informal care and/or paid work? Combining paid work and caring activities may prove difficult for working-age informal carers, in particular if they also have to care for children, as it is often the case in the above-mentioned "pivot-age category", i.e. the 45-64 years old. To address the caring requests, they may then decide for part-time work, or even just drop out of the labour market.
Therefore, labour participation rates and labour supply are important indicators of potential care supply. Despite large cross-country labour force variability in the EU, in general women's participation rates have steadily increased over the past twenty-five years. The EC-AWG Ageing Report56 also projects a rightward shift in the age profiles of participation rates, meaning that older individuals (aged 50 years and more) tend to stay longer in the labour market, particularly women.
55 Of course, other variables enter into this decision process: community values, possible social pressure or at least, societal opinion, altruism (pure or forced), strategical/reciprocal motivations. See for instance Cremer & Pestieau (2009), Haberkern & Szydlik (2010). 56 See European Commission – DG ECFIN and Economic Policy Committee – AWG (2012).
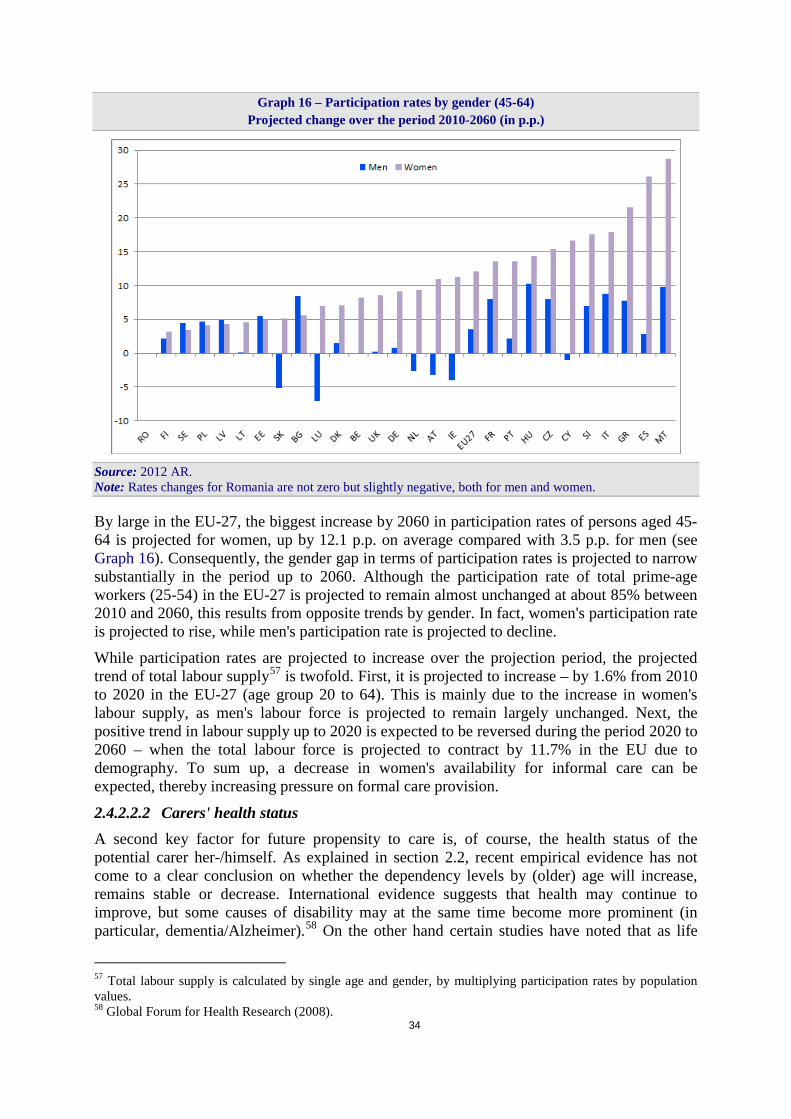
34
Graph 16 – Participation rates by gender (45-64) Projected change over the period 2010-2060 (in p.p.)
Source: 2012 AR. Note: Rates changes for Romania are not zero but slightly negative, both for men and women.
By large in the EU-27, the biggest increase by 2060 in participation rates of persons aged 45-64 is projected for women, up by 12.1 p.p. on average compared with 3.5 p.p. for men (see Graph 16). Consequently, the gender gap in terms of participation rates is projected to narrow substantially in the period up to 2060. Although the participation rate of total prime-age workers (25-54) in the EU-27 is projected to remain almost unchanged at about 85% between 2010 and 2060, this results from opposite trends by gender. In fact, women's participation rate is projected to rise, while men's participation rate is projected to decline.
While participation rates are projected to increase over the projection period, the projected trend of total labour supply57 is twofold. First, it is projected to increase – by 1.6% from 2010 to 2020 in the EU-27 (age group 20 to 64). This is mainly due to the increase in women's labour supply, as men's labour force is projected to remain largely unchanged. Next, the positive trend in labour supply up to 2020 is expected to be reversed during the period 2020 to 2060 – when the total labour force is projected to contract by 11.7% in the EU due to demography. To sum up, a decrease in women's availability for informal care can be expected, thereby increasing pressure on formal care provision.
2.4.2.2.2 Carers' health status A second key factor for future propensity to care is, of course, the health status of the potential carer her-/himself. As explained in section 2.2, recent empirical evidence has not come to a clear conclusion on whether the dependency levels by (older) age will increase, remains stable or decrease. International evidence suggests that health may continue to improve, but some causes of disability may at the same time become more prominent (in particular, dementia/Alzheimer).58 On the other hand certain studies have noted that as life
57 Total labour supply is calculated by single age and gender, by multiplying participation rates by population values. 58 Global Forum for Health Research (2008).
35
expectancy increases the incidence of severe disability is postponed, leading to a reduction in the prevalence of severe disability for some age-groups, but it does not mean a decrease in numbers.59
Further, as already explained in section 2.3, it goes the other way round as well: in case of intensive caring, there may be consequences on the carers' (mental and physical) health status, reducing their ability to care. And it may also reduce labour market participation, especially of women and older workers (see also Colombo, 2010).
2.4.3 Expected substitution effects
Pressure for increased public provision – and consequent financing – of long-term care services may grow substantially in coming decades, especially in Member States where the bulk of long-term care is currently provided informally. On the one hand, the current institutional arrangements for the provision and financing of long-term care by the public sector may be under strong pressure in the future, as the availability of informal carers and their propensity to provide care could diminish, due to changes in family structure and the growing participation of women in the labour market. On the other hand, the increase in life expectancy could also bring about a higher potential supply of informal care by elderly partners and retired children. In any case, informal care supply does not mean "free" care for public budgets. It has been increasingly commented that all possibilities to make the provision of informal care easier should also be envisaged (arrangements for a better work-life balance, better (public) support to informal carers…), which do not come at no-public cost.
All in all, informal care availability is rather expected to decrease, as it has been argued in section 2.4.2. Therefore, the further need for/recourse to formal care also presses for higher public expenditure on long-term care. At the same time, better working conditions in the formal care sector should ideally be provided. Besides, given the rigidities in the sector – with a sometimes already constrained formal care supply and tight budget constraints in the years to come – the pressure may not fully translate into direct increase in public expenditure on formal care services. This could mean more dependent people left with insufficient or no care at all, thereby possibly aggravating their health status.
Moreover, the relation between formal care and informal care use is far from clear.60 For instance, the relative shortage of informal carers could have two opposing effects on the long-term demand for formal home care from the elderly. If formal care is complementary to informal care, the demand for formal home care could decline (with an increase in the demand for residential care). In particular, people with high levels of dependency are more commonly able to remain in their homes if they have a primary carer.
When, on the contrary, formal care substitutes for informal care, a shortage of informal carers could translate into an increase in demand for formal care from the elderly.61 Still, in the absence of informal support, formal home care could cost about the same as low-level institutional care. Although often favoured in current public policies, formal home care proves here its limits as a cost-saving solution – as compared to institutional care. This would tend to reduce the scope for this form of care to expand indefinitely, unless solutions are found to
59 See for instance Lafortune et al. (2007). 60 See for instance Van Houtven & Norton (2004) for a review on the topic, and Bonsang (2009). 61 According to Bonsang (2009), 2004 SHARE data confirm that informal care decreases low-skilled home care use (paid domestic help), while it is a complement to high-skilled home care (nursing/personal care). Further, the substitution effect is shown to vanish for elderly suffering from heavy disability.
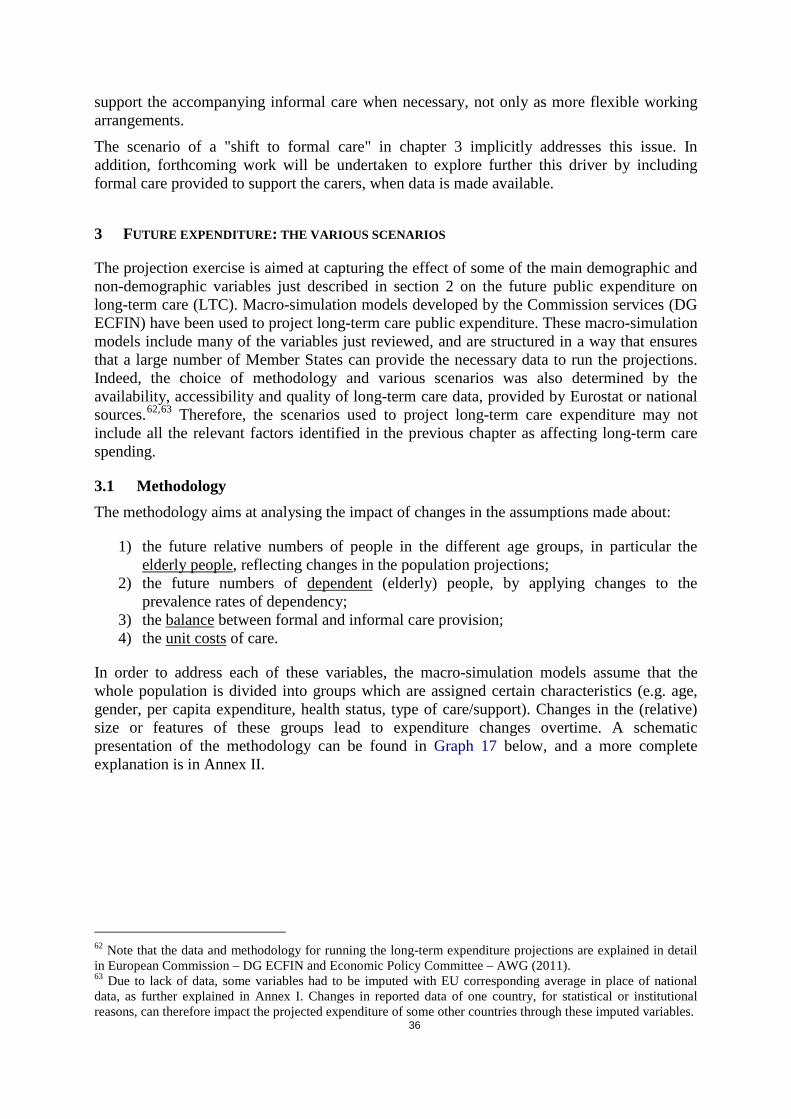
36
support the accompanying informal care when necessary, not only as more flexible working arrangements.
The scenario of a "shift to formal care" in chapter 3 implicitly addresses this issue. In addition, forthcoming work will be undertaken to explore further this driver by including formal care provided to support the carers, when data is made available.
3 FUTURE EXPENDITURE: THE VARIOUS SCENARIOS
The projection exercise is aimed at capturing the effect of some of the main demographic and non-demographic variables just described in section 2 on the future public expenditure on long-term care (LTC). Macro-simulation models developed by the Commission services (DG ECFIN) have been used to project long-term care public expenditure. These macro-simulation models include many of the variables just reviewed, and are structured in a way that ensures that a large number of Member States can provide the necessary data to run the projections. Indeed, the choice of methodology and various scenarios was also determined by the availability, accessibility and quality of long-term care data, provided by Eurostat or national sources.62,63 Therefore, the scenarios used to project long-term care expenditure may not include all the relevant factors identified in the previous chapter as affecting long-term care spending.
3.1 Methodology The methodology aims at analysing the impact of changes in the assumptions made about:
1) the future relative numbers of people in the different age groups, in particular the elderly people, reflecting changes in the population projections;
2) the future numbers of dependent (elderly) people, by applying changes to the prevalence rates of dependency;
3) the balance between formal and informal care provision; 4) the unit costs of care.
In order to address each of these variables, the macro-simulation models assume that the whole population is divided into groups which are assigned certain characteristics (e.g. age, gender, per capita expenditure, health status, type of care/support). Changes in the (relative) size or features of these groups lead to expenditure changes overtime. A schematic presentation of the methodology can be found in Graph 17 below, and a more complete explanation is in Annex II.
62 Note that the data and methodology for running the long-term expenditure projections are explained in detail in European Commission – DG ECFIN and Economic Policy Committee – AWG (2011). 63 Due to lack of data, some variables had to be imputed with EU corresponding average in place of national data, as further explained in Annex I. Changes in reported data of one country, for statistical or institutional reasons, can therefore impact the projected expenditure of some other countries through these imputed variables.
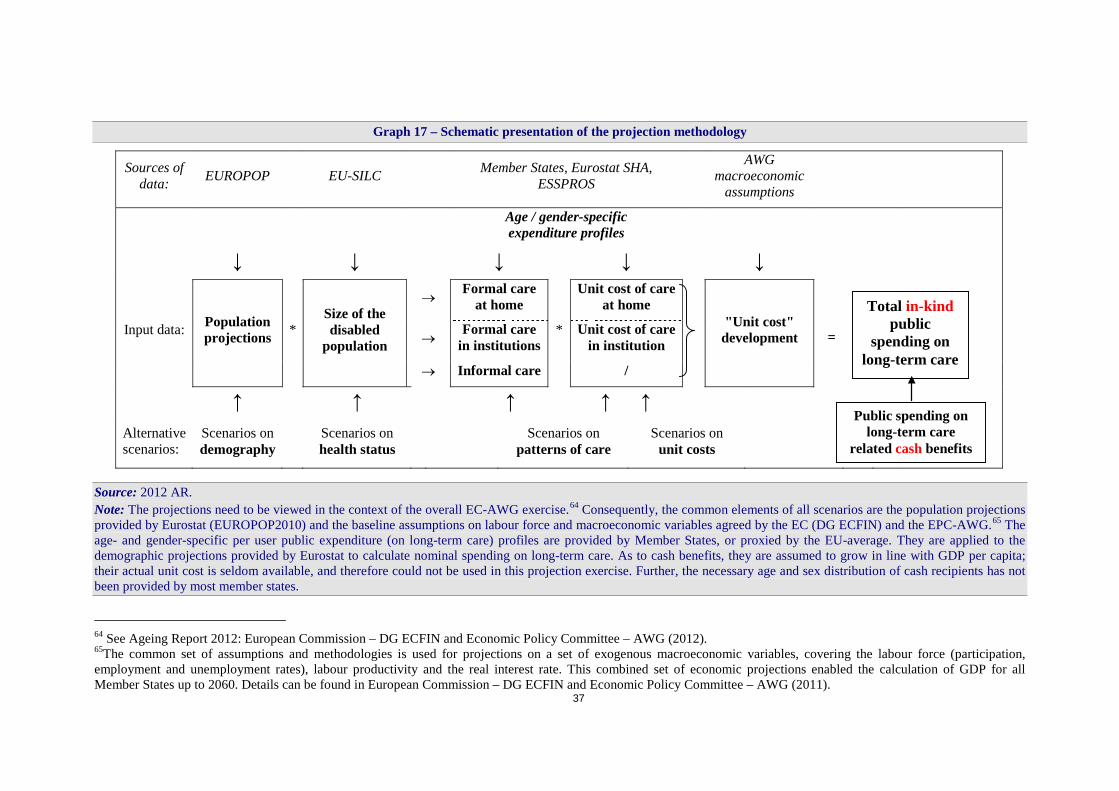
37
Graph 17 – Schematic presentation of the projection methodology
Source: 2012 AR. Note: The projections need to be viewed in the context of the overall EC-AWG exercise.64 Consequently, the common elements of all scenarios are the population projections provided by Eurostat (EUROPOP2010) and the baseline assumptions on labour force and macroeconomic variables agreed by the EC (DG ECFIN) and the EPC-AWG.65 The age- and gender-specific per user public expenditure (on long-term care) profiles are provided by Member States, or proxied by the EU-average. They are applied to the demographic projections provided by Eurostat to calculate nominal spending on long-term care. As to cash benefits, they are assumed to grow in line with GDP per capita; their actual unit cost is seldom available, and therefore could not be used in this projection exercise. Further, the necessary age and sex distribution of cash recipients has not been provided by most member states.
64 See Ageing Report 2012: European Commission – DG ECFIN and Economic Policy Committee – AWG (2012). 65The common set of assumptions and methodologies is used for projections on a set of exogenous macroeconomic variables, covering the labour force (participation, employment and unemployment rates), labour productivity and the real interest rate. This combined set of economic projections enabled the calculation of GDP for all Member States up to 2060. Details can be found in European Commission – DG ECFIN and Economic Policy Committee – AWG (2011).
Sources of data: EUROPOP EU-SILC Member States, Eurostat SHA,
ESSPROS AWG
macroeconomic assumptions
Age / gender-specific expenditure profiles
↓ ↓ ↓ ↓ ↓
Input data: Population projections *
Size of the disabled
population
→ Formal care at home
*
Unit cost of care at home
"Unit cost" development
→ Formal care in institutions
Unit cost of care in institution
→ Informal care /
↑ ↑ ↑ ↑ ↑ Alternative scenarios:
Scenarios on demography Scenarios on
health status Scenarios on patterns of care
Scenarios on unit costs
Public spending on long-term care
related cash benefits
Total in-kind public
spending on long-term care
=
38
3.2 The various scenarios The scenarios carried out in the projection exercise illustrate the future budgetary impact (expressed as % of GDP, over the period 2010-2060) of changes in (i) demography, (ii) disability, (iii) policy setting, (iv) unit costs. The projection exercise is twofold. A first set of scenarios assumes that base-case long-term budgetary projections should illustrate the policy-neutral situation. This is the situation where changes in government policy are not considered. More specifically, it is implicitly assumed that the eligibility requirements do not change. Therefore, the LTC supply will follow any related changes in demand. A second set of scenarios are "policy-change scenarios", in order to reflect some potential future institutional or legal changes to the financing and organisation of long-term care systems and to illustrate the impact of possible future policy changes on that matter, such as Member States deciding to provide more formal care services to the elderly.
The next sub-sections present the scenarios envisaged to approach a range of possible – or even plausible – outcomes of the long-term projections of public expenditure on LTC.
3.2.1 The impact of future demographic change
3.2.1.1 "Base case scenario"
The "base case scenario" is a scenario which examines the impact on the public expenditure of long-term care of the change in the future numbers of elderly people, i.e. the "size effect" described in subsection 2.1. It is a 1) no policy-change and 2) demographic scenario as:
1) It assumes that the shares of the dependent population who receive either informal care, formal care at home or institutional care are kept constant over the projection period. In other words, there is no change in the policy on the formal coverage of LTC. Therefore, this scenario is called a "no policy-change scenario";
2) It is a demographic scenario, inasmuch as the only relevant variable is demography, through the projected population changes. Indeed, since the prevalence of dependency is kept constant over the projection horizon, the observed dependent population evolves in line with the total (elderly) population. This also implies the assumption that all gains in life expectancy are spent in bad health/with disability. Therefore, this scenario assumes that average lifetime consumption of LTC services will increase over time. In addition, as mentioned above, the coverage shares applied to the dependent population are also kept constant (at the 2010 – base year – level) and then applied to the projected changes in the (dependent) population.
As for the "indexation" rules, it is assumed that the unit cost of in-kind types of LTC provision (i.e. home- and institution-services), illustrated by LTC (in-kind) age-gender expenditure profiles, evolve in line with wages in the entire economy.66 Indeed, given the currently predominant deficit of formal care provision and its high labour-intensive character, public expenditure seems supply- rather than demand-driven. For that reason, wages are seen as the main driver of unit costs, which is assumed to reflect changes in the labour productivity.67 As for the LTC-related cash benefits, they are assumed to evolve in line with GDP per capita growth, as cash benefits are more related to a form of income support. This twofold assumption is similar for all scenarios.
66 In the EC-EPC Ageing Report 2012, wages are projected to evolve in line with productivity (measured as GDP per hours worked). 67 Which is assumed to proxy the wage evolution in the care sector.

39
3.2.1.2 "High life expectancy scenario"
The "high life expectancy scenario" presents the budgetary effects of an alternative demographic scenario which assumes life expectancy at birth to be one year higher than in the baseline demographic scenario. This scenario has to be seen as a sensitivity test, to check how robust the results are in the base case to under/over estimation of future changes in longevity. It is well-known that in the past there has been a systematic underestimation of increases in life expectancy. In terms of methodology, the scenario does not differ from the "base case scenario", apart from the fact that the baseline demographic projections – i.e. the structure of the population evolving over the projection period as well as the consequent evolution in the macroeconomic assumptions – used as input data are replaced with the alternative, high life expectancy, variant.
As any extra year of increase in life expectancy (at birth) would imply an increased number of dependent persons, public expenditure are expected to increase above the projected expenditure in the "base case scenario", especially in countries with higher coverage rates.
3.2.2 The impact of future changes in the prevalence of disability: the "delayed dependency scenario"
The impact of ageing on the future of public expenditure on long-term care could be further deepened or, to the contrary, alleviated by the impact of other variables described in section 2. Notably, improvements in the disability status of people – in particular, the elderly – might mitigate the rise in the demand for long-term care services, and hence the associated public expenditure. The narrowing of the gap between female and male life expectancy, assuming both men and women live in good health and free of disability, could also bring a higher potential supply of informal care by old spouses.
In this view, the so-called "delayed dependency scenario" reflects an alternative assumption about trends in age-gender specific dependency rates. It assumes that all gains in life expectancy are spent in good health, without disability. The line of reasoning is inspired by the so-called "dynamic equilibrium" hypothesis, one of the main hypotheses put forward to predict possible future interaction between the evolution in life expectancy and changes in the prevalence of disability and bad health, and widely referred to in the epidemiology and health economics domains. The dynamic equilibrium hypothesis (Manton, 1982) suggests counterbalancing effects of two phenomena: decreasing prevalence/incidence of chronic diseases on the one hand, and decreasing fatality rates of diseases leading to longer prevalence of disability on the other.
Accordingly, the age-gender specific dependency rates are shifted in line with changes in life expectancy. In other words, if life expectancy for a 50-year old person has increased by 2 years in year 2030, then the dependency rate of a 50-year old person in 2030 is assumed to be that of a 48-year old person in 2010/base year) – therefore the terms "delayed dependency". This results in a gradual decrease over time in disability/dependency prevalence for each age cohort.
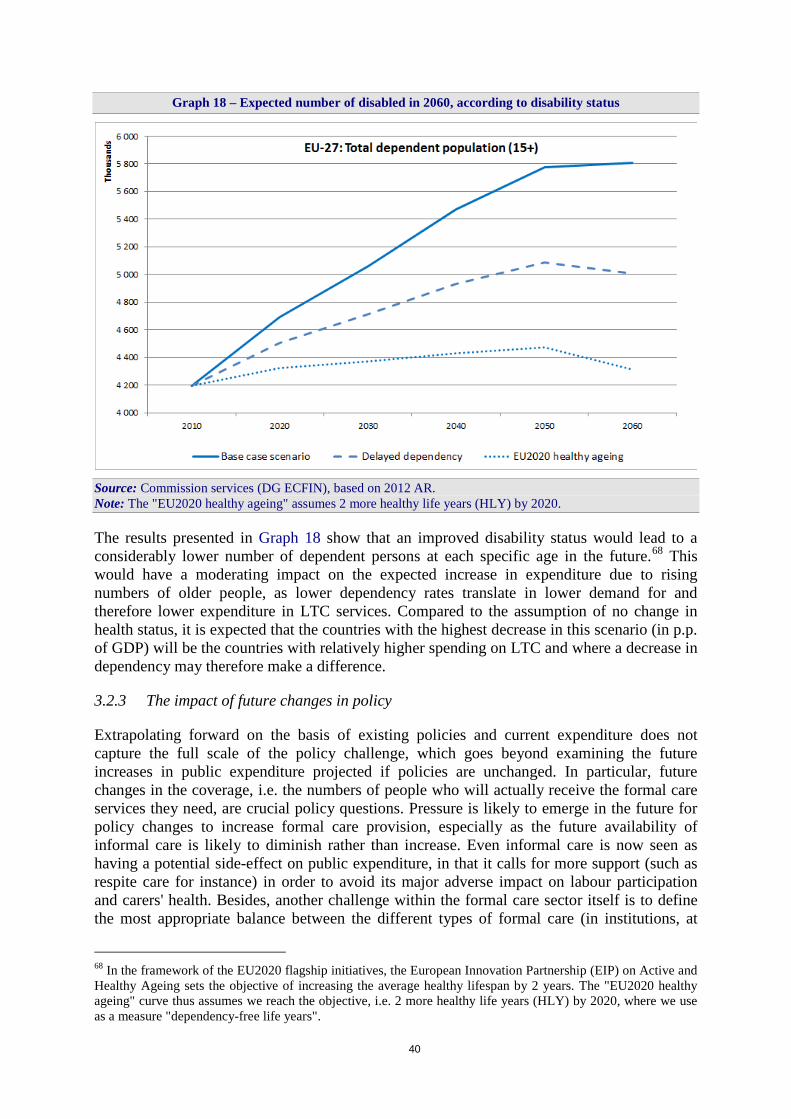
40
Graph 18 – Expected number of disabled in 2060, according to disability status
Source: Commission services (DG ECFIN), based on 2012 AR. Note: The "EU2020 healthy ageing" assumes 2 more healthy life years (HLY) by 2020.
The results presented in Graph 18 show that an improved disability status would lead to a considerably lower number of dependent persons at each specific age in the future.68 This would have a moderating impact on the expected increase in expenditure due to rising numbers of older people, as lower dependency rates translate in lower demand for and therefore lower expenditure in LTC services. Compared to the assumption of no change in health status, it is expected that the countries with the highest decrease in this scenario (in p.p. of GDP) will be the countries with relatively higher spending on LTC and where a decrease in dependency may therefore make a difference.
3.2.3 The impact of future changes in policy
Extrapolating forward on the basis of existing policies and current expenditure does not capture the full scale of the policy challenge, which goes beyond examining the future increases in public expenditure projected if policies are unchanged. In particular, future changes in the coverage, i.e. the numbers of people who will actually receive the formal care services they need, are crucial policy questions. Pressure is likely to emerge in the future for policy changes to increase formal care provision, especially as the future availability of informal care is likely to diminish rather than increase. Even informal care is now seen as having a potential side-effect on public expenditure, in that it calls for more support (such as respite care for instance) in order to avoid its major adverse impact on labour participation and carers' health. Besides, another challenge within the formal care sector itself is to define the most appropriate balance between the different types of formal care (in institutions, at
68 In the framework of the EU2020 flagship initiatives, the European Innovation Partnership (EIP) on Active and Healthy Ageing sets the objective of increasing the average healthy lifespan by 2 years. The "EU2020 healthy ageing" curve thus assumes we reach the objective, i.e. 2 more healthy life years (HLY) by 2020, where we use as a measure "dependency-free life years".
41
home, in cash), and to provide the necessary supporting measures and policies to achieve this balance. Even more since the private market for LTC is still under-developed in most Member States and is most often not a real alternative yet.
Currently, in some countries like Denmark, the Netherlands and Sweden, public expenditure in percentage of GDP is among the highest in the EU – more than twice the EU-27 average, but the long-term care needs of the population are fully covered within the formal system and are expected to remain fully covered in the future. In contrast, in many other Member States large numbers of people do not receive formal care services and rely exclusively on informal care; considerably increased political pressure for people relying on formal care is therefore to be expected in the future.
Under no policy change, a growing gap may occur between the number of (elderly) citizens with disability who are in need of care and the actual supply of formal care services and benefits. Trying to address the policy challenges that may arise in the (near) future, two scenarios illustrate how policy changes can affect future public expenditure on LTC: the "shift to formal care scenario", assessing the effect of a shift from informal or cash to formal care services and the "coverage convergence scenario", assessing the impact of a convergence to the EU-27 formal coverage rate. It is important to note that these are only scenarios, not forecasts. Each of them tries to capture the single effect of a specific assumption, leaving aside the effect of other variables and their potential interaction.
3.2.3.1 "Shift to formal care"
The "shift to formal care scenario" attempts to assess the impact of growing pressure to increase public finance/ provision of LTC services. Indeed, especially in Member States where the bulk of LTC services are currently provided informally, the pressure to provide formal care may grow substantially in the coming decades. This scenario is run to assess the effect of a demand-driven increase in public funding/ provision of formal care in-kind which replaces or supports informal care. In particular, this scenario examines the budgetary impact of a progressive shift into the formal in-kind sector of a 1% per year of the dependent population who have so far received only informal care or cash benefits. This extra shift takes place during the first ten years of the projection period only; therefore it sums up to about 9.6% shift to formal care. It is further assumed that 50% of these "new" beneficiaries are considered to move into institutional care (the most expensive care), while the other 50% are assumed to receive formal care at home.
Given the increased coverage of dependents assumed by the scenario, this will result in a projected increase in LTC expenditure for all countries, and especially for those which currently display relatively low formal coverage rates.
3.2.3.2 "Coverage convergence scenario"
The "coverage convergence scenario" assumes that the combined effect of the exchange of good practices across Europe and growing expectations of the populations will result in an expansion of publicly-financed formal care provision (be it in-kind or in cash) into groups of population that so far have not been covered by public programmes. The remaining number of people considered as dependent is assumed to receive informal care (or no care).
Similarly to the scenario assessing the effect of a shift to formal care, this scenario should also be considered as a policy-change scenario, as it assumes a shift in the current LTC provision policy, while aiming to take into account the high diversity of the country-specific current
42
care-mix. It assumes that, by 2060, there is a coverage convergence to the EU-27 average displayed in 2010. In other words, the Member States where the formal coverage rate for total formal care (in-kind and cash) is below the EU-27 average in the starting year are assumed to converge to this average by 2060. For better clarity, it is important to note here that: 1) the convergence is calculated for each age group; 2) the relative proportions of each type of formal care are kept constant.
A caveat can already be made for this scenario. Indeed, the number of assumptions gives room for misleading results, and one has to refrain from hasty conclusions. The convergence process is based on an initial comparison between 1) the number of dependents, proxied by the so-called "severely disabled" as surveyed by EU-SILC and 2) the number of recipients of formal care. Both give scope for over- or under-estimation: 1) EU-SILC gives a self-perception of disability, which may differ considerably between countries, due to survey particularities and cultural characteristics69, while 2) numbers of recipients are sometimes provided by the Member State only from a very partial source, or even not provided at all, and therefore replaced by the corresponding EU-12 or EU-15 average.
As in the "shift to formal scenario", the projected expenditure is expected to increase vis-à-vis the "base case" scenario as a result of an increased coverage of dependent individuals, especially in countries where the coverage of the dependent population is currently low compared to the EU average.
3.2.4 The impact of future changes in unit cost: the "cost convergence scenario"
For those Member States with high levels of informal care, and relatively low average costs for LTC, the increase in population expectations for more formal care may result in an increase in the average cost of LTC, for example towards the EU average.70 In this view, the "cost convergence scenario" is meant to capture the possible effect of a convergence in real living standards on LTC spending. In terms of methodology, it assumes an upward convergence of the relative age-gender specific per-beneficiary expenditure profiles (as percentage of GDP per capita) of all countries that are below the corresponding EU-27 average in 2010 to the EU-27 average. Note that the convergence is calculated for each age group, on the basis of the cost gap for all types of formal care (services in kind and cash benefits).
Under this scenario, projected public expenditure on LTC is expected to increase further compared to the "base case scenario", with the impact of an increased cost per user of LTC services assumed to be the result of economic convergence and higher user expectations. This should be the case in particular for countries with broad coverage and therefore relatively low average cost profile in the base year 2010, as opposed to countries with relatively low coverage and relatively high starting average cost profile.
69 In other words, people in one country may consider themselves as "disabled", when people in another country with the same health status would not do so. 70 Note that the starting point only reflects the average cost. For instance, if a country displaying a relatively low coverage in 2010 concentrates on the most severe cases, it implies a relatively high average cost in the starting year and therefore no additional projected expenditure in that scenario.
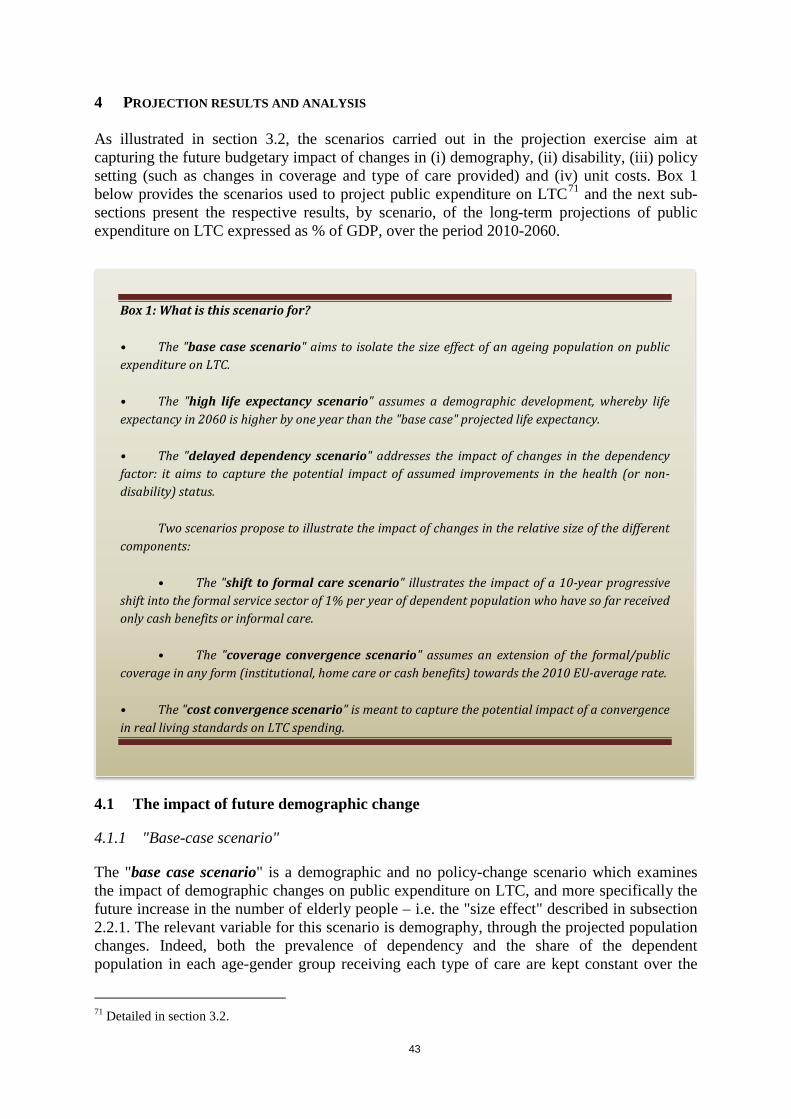
43
4 PROJECTION RESULTS AND ANALYSIS
As illustrated in section 3.2, the scenarios carried out in the projection exercise aim at capturing the future budgetary impact of changes in (i) demography, (ii) disability, (iii) policy setting (such as changes in coverage and type of care provided) and (iv) unit costs. Box 1 below provides the scenarios used to project public expenditure on LTC71 and the next sub-sections present the respective results, by scenario, of the long-term projections of public expenditure on LTC expressed as % of GDP, over the period 2010-2060.
4.1 The impact of future demographic change
4.1.1 "Base-case scenario"
The "base case scenario" is a demographic and no policy-change scenario which examines the impact of demographic changes on public expenditure on LTC, and more specifically the future increase in the number of elderly people – i.e. the "size effect" described in subsection 2.2.1. The relevant variable for this scenario is demography, through the projected population changes. Indeed, both the prevalence of dependency and the share of the dependent population in each age-gender group receiving each type of care are kept constant over the
71 Detailed in section 3.2.
Box 1: What is this scenario for?
• The "base case scenario" aims to isolate the size effect of an ageing population on public expenditure on LTC.
• The "high life expectancy scenario" assumes a demographic development, whereby life expectancy in 2060 is higher by one year than the "base case" projected life expectancy.
• The "delayed dependency scenario" addresses the impact of changes in the dependency factor: it aims to capture the potential impact of assumed improvements in the health (or non-disability) status.
Two scenarios propose to illustrate the impact of changes in the relative size of the different components:
• The "shift to formal care scenario" illustrates the impact of a 10-year progressive shift into the formal service sector of 1% per year of dependent population who have so far received only cash benefits or informal care.
• The "coverage convergence scenario" assumes an extension of the formal/public coverage in any form (institutional, home care or cash benefits) towards the 2010 EU-average rate.
• The "cost convergence scenario" is meant to capture the potential impact of a convergence in real living standards on LTC spending.
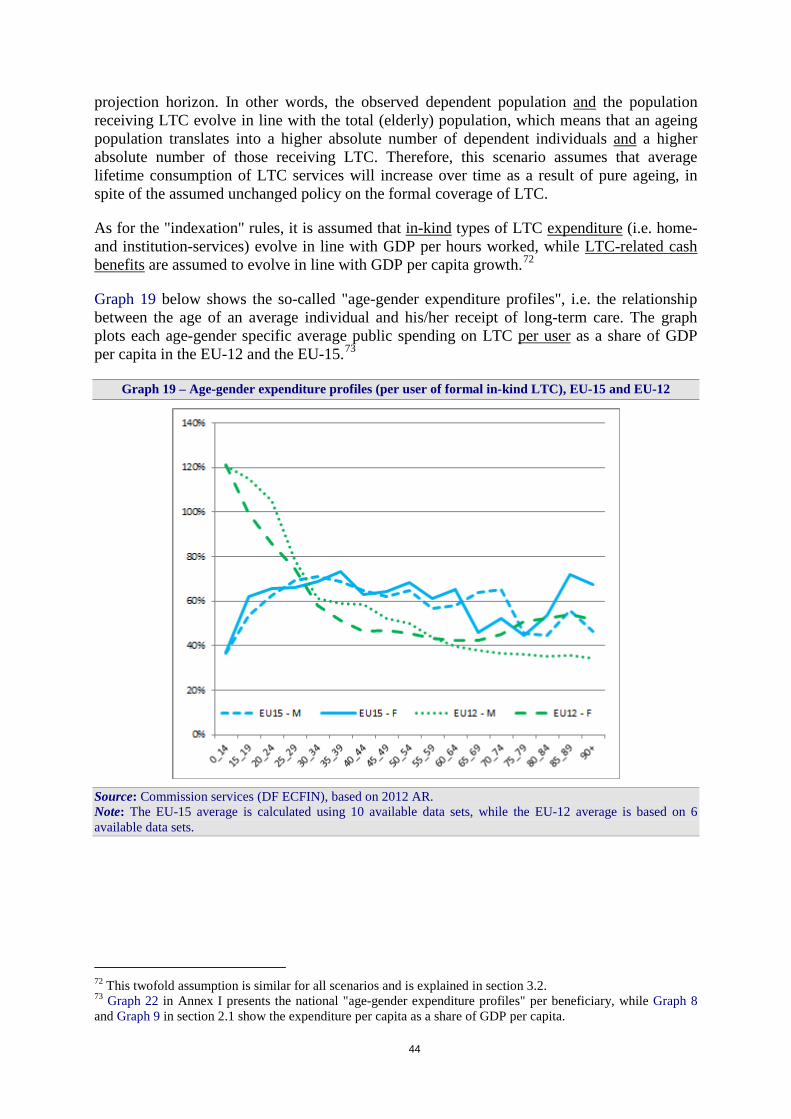
44
projection horizon. In other words, the observed dependent population and the population receiving LTC evolve in line with the total (elderly) population, which means that an ageing population translates into a higher absolute number of dependent individuals and a higher absolute number of those receiving LTC. Therefore, this scenario assumes that average lifetime consumption of LTC services will increase over time as a result of pure ageing, in spite of the assumed unchanged policy on the formal coverage of LTC.
As for the "indexation" rules, it is assumed that in-kind types of LTC expenditure (i.e. home- and institution-services) evolve in line with GDP per hours worked, while LTC-related cash benefits are assumed to evolve in line with GDP per capita growth.72
Graph 19 below shows the so-called "age-gender expenditure profiles", i.e. the relationship between the age of an average individual and his/her receipt of long-term care. The graph plots each age-gender specific average public spending on LTC per user as a share of GDP per capita in the EU-12 and the EU-15.73
Graph 19 – Age-gender expenditure profiles (per user of formal in-kind LTC), EU-15 and EU-12
Source: Commission services (DF ECFIN), based on 2012 AR. Note: The EU-15 average is calculated using 10 available data sets, while the EU-12 average is based on 6 available data sets.
72 This twofold assumption is similar for all scenarios and is explained in section 3.2. 73 Graph 22 in Annex I presents the national "age-gender expenditure profiles" per beneficiary, while Graph 8 and Graph 9 in section 2.1 show the expenditure per capita as a share of GDP per capita.

45
It can be seen that for EU-15 countries the average age-gender specific expenditure profile is fairly stable across age-groups though showing an upward slope for women after the age of 80. For women from the age of 30-34 in EU-12 countries, the average age-gender specific expenditure profile is fairly stable across age-groups again showing a slow upward slope for females after the age of 70 (earlier than in EU-15). For men in EU-12 countries, the age-gender specific expenditure profile appears to have a downward slope. For both men and women age-gender specific in-kind expenditure profile is very high at young age groups, the average being mostly driven by the Polish, Lithuanian and, to a lesser extent, Latvian profiles.74
The combined effect of an ageing society and the shape of the LTC expenditure profile results in a projected increase in public expenditure on LTC from 2010 to 2060. The increase is especially visible for the EU-15 countries with a fast ageing population, higher coverage rate and higher or increasing age profile for older age groups. Graph 20 shows the projected increase in public expenditure on long-term care from 2010 to 2060, while Table 7 details the projected figures for every ten years.
Graph 20 – Base case scenario: Public spending on LTC as % of GDP; 2010-2060
Source: Commission services (DG ECFIN), based on 2012 AR. Note: Cyprus reports a public share of only 6% of total in-kind LTC expenditure in 2008.
74 One reason can be found in official assessment procedures whereby benefit systems can differ according to the age of the potential recipient. In the above-mentioned cases, there would be a bias towards more support to younger dependents, on average, thereby reflecting the will to take into account the differentiated ability to work, training capacities and opportunities and possible (re)integration in society. Another explanation relies on the patterns of LTC provision; on average, the recourse to (more costly) institutionalisation may be stronger at younger ages.
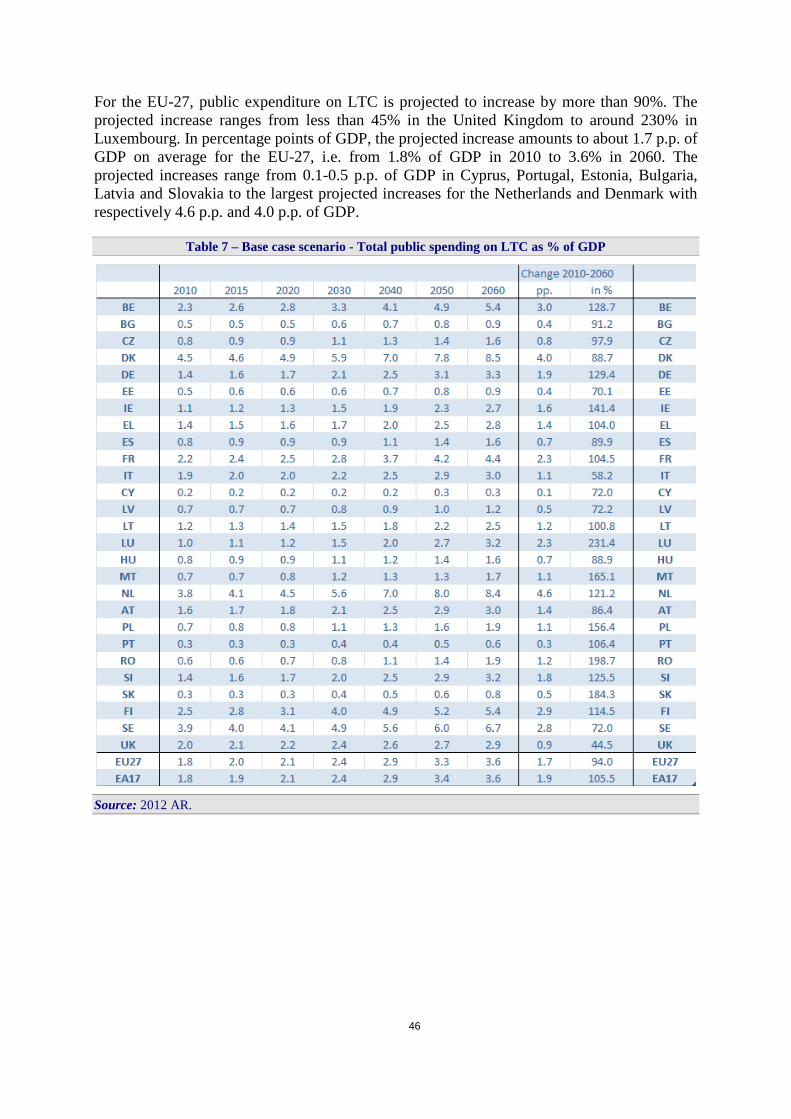
46
For the EU-27, public expenditure on LTC is projected to increase by more than 90%. The projected increase ranges from less than 45% in the United Kingdom to around 230% in Luxembourg. In percentage points of GDP, the projected increase amounts to about 1.7 p.p. of GDP on average for the EU-27, i.e. from 1.8% of GDP in 2010 to 3.6% in 2060. The projected increases range from 0.1-0.5 p.p. of GDP in Cyprus, Portugal, Estonia, Bulgaria, Latvia and Slovakia to the largest projected increases for the Netherlands and Denmark with respectively 4.6 p.p. and 4.0 p.p. of GDP.
Table 7 – Base case scenario - Total public spending on LTC as % of GDP
Source: 2012 AR.

47
75
4.1.2 "High life expectancy scenario"
The "high life expectancy scenario" presents the budgetary effects of an alternative demographic scenario which assumes life expectancy at birth to be one year higher than in the baseline scenario. This scenario, as the base case scenario, assumes no change in dependency rates. Nevertheless, any extra year of increase in life expectancy (at birth) would imply an increased number of dependent persons, hence in absolute terms. In turn, public expenditure is expected to increase above the projected expenditure in the "base case scenario", especially in countries with higher coverage rates, faster ageing population or higher age-gender expenditure profiles at older ages. The higher is the combination of these three elements, the higher the increase.
Indeed, the results presented in Table 8 show that, for the EU as a whole, public expenditure would increase by 0.2 p.p. of GDP above the "base case scenario" for each extra year of gain in life expectancy. As expected, countries with a rather high coverage – and/or ageing 75 Over the 50 years of the projection horizon, indexation to prices becomes less of a realistic assumption. In the LTC sector in particular, wage costs are the relevant component, which should evolve in line with productivity in the long run. If this happens, the assumption of an increase in line with prices would imply a progressive drop in coverage.
Box 2: Taking account of existing policy settings in the Member States
Indexation to prices: Germany and France
In the projection, unit costs are indexed to GDP per hours worked or GDP per capita. Under current rules in Germany, all long-term care benefits are indexed to prices. The difference between the amounts financed by the State and the costs of long term care are either recovered by private insurance or are paid by the beneficiaries themselves. To better reflect the current German legislation, an alternative projection has been run where unit costs of long-term care benefits remain constant in real terms.75 This would mean that the amounts financed by the State are adjusted in line with prices. The same partly holds true for France, where one part of the long-term care benefits is also indexed to prices. For people over 60 years old, the benefits are calculated according to the needs up to a ceiling which is indexed to prices; while for people under 60, the indexation is decided each year by the ministry in charge of the disability matters.
Assuming constant unit costs in real terms, the long-term care public expenditure in Germany is projected to reach 1.6% of GDP in 2060, as compared to 3.3% of GDP when assuming unit costs evolve in line with GDP per hours worked ("base case scenario"). The results illustrate the difference between what the State is projected to spend under these two assumptions.
If the same evolution is assumed for both age groups in France, i.e. both indexed to prices, the long-term care expenditure is then projected to amount only to 2.1% of GDP in 2060, as compared to an increase from 2.2% of GDP to 4.4% in the "base case scenario".
Germany - Base case scenario 2010 2015 2020 2030 2040 2050 2060 2010-2060Unit costs evolve in line w ith GDP per hours w orked 1.43 1.57 1.72 2.10 2.52 3.10 3.28 1.85Unit costs constant in real terms 1.43 1.44 1.48 1.57 1.64 1.73 1.57 0.14
France - Base case scenario 2010 2015 2020 2030 2040 2050 2060 2010-2060Unit costs evolve in line w ith GDP per hours w orked 2.16 2.42 2.55 2.84 3.69 4.16 4.42 2.26Unit costs constant in real terms 2.16 2.20 2.17 2.09 2.34 2.26 2.06 -0.10

48
population and/or high expenditure profiles – display the largest increases in absolute terms, such as Belgium, Denmark and the Netherlands, followed by Finland and Sweden.
Table 8 – High life expectancy scenario (+ 1 year) - Total public spending on LTC as % of GDP
Source: 2012 AR.
4.2 The impact of future changes in the prevalence of disability/dependency Improvements in the dependency status of elderly people might mitigate the expected rise in the demand for long-term care services, and hence the associated increase in public expenditure. The narrowing of the gap between female and male life expectancy, assuming both men and women live in good health and free of disability, could also bring a higher potential supply of informal care by old spouses. This would also contribute to reducing the demand for formal LTC services.
Aiming to capture such developments, the "delayed dependency scenario" assumes that all gains in life expectancy are spent in good health, without severe disability/dependency. The age-gender specific dependency rates are therefore shifted in line with changes in life expectancy (e.g. if life expectancy for a 50-year old person increases by 2 years between 2010 and 2030, then the dependency rate of a 50-year old man in 2030 is that of a 48-year old man in year 2010). This results in a gradual decrease over time in the prevalence of dependency for each age cohort.
As expected, the results presented in Table 9 show that an improved dependency status moderates the expected increase in expenditure which would be due to rising numbers of older (and dependent) people, as projected in the "base case scenario". When dependency is
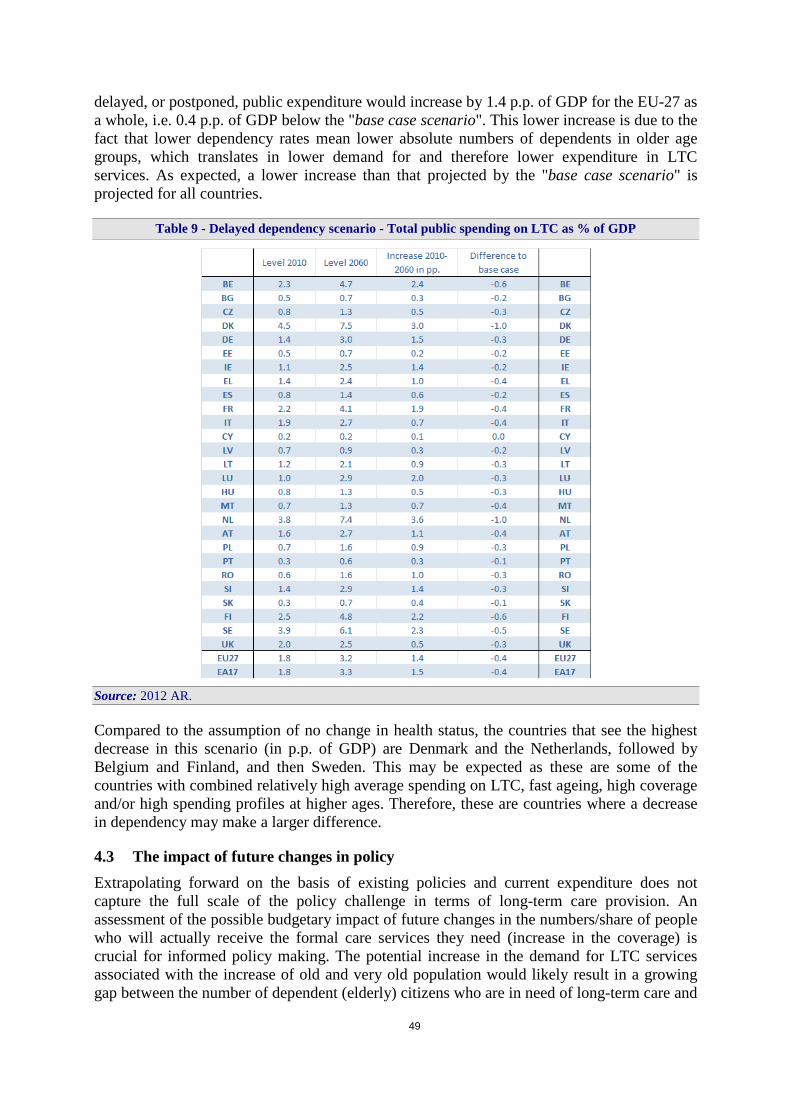
49
delayed, or postponed, public expenditure would increase by 1.4 p.p. of GDP for the EU-27 as a whole, i.e. 0.4 p.p. of GDP below the "base case scenario". This lower increase is due to the fact that lower dependency rates mean lower absolute numbers of dependents in older age groups, which translates in lower demand for and therefore lower expenditure in LTC services. As expected, a lower increase than that projected by the "base case scenario" is projected for all countries.
Table 9 - Delayed dependency scenario - Total public spending on LTC as % of GDP
Source: 2012 AR.
Compared to the assumption of no change in health status, the countries that see the highest decrease in this scenario (in p.p. of GDP) are Denmark and the Netherlands, followed by Belgium and Finland, and then Sweden. This may be expected as these are some of the countries with combined relatively high average spending on LTC, fast ageing, high coverage and/or high spending profiles at higher ages. Therefore, these are countries where a decrease in dependency may make a larger difference.
4.3 The impact of future changes in policy Extrapolating forward on the basis of existing policies and current expenditure does not capture the full scale of the policy challenge in terms of long-term care provision. An assessment of the possible budgetary impact of future changes in the numbers/share of people who will actually receive the formal care services they need (increase in the coverage) is crucial for informed policy making. The potential increase in the demand for LTC services associated with the increase of old and very old population would likely result in a growing gap between the number of dependent (elderly) citizens who are in need of long-term care and

50
the actual supply of formal care services and benefits. In addition, changes in family structures, mobility and living arrangements may reduce the provision of (informal) support by the family more than other factors could increase it – e.g. the narrowing gender gap in life expectancy. Consequently, pressure is likely to emerge for policy changes that increase formal LTC provision in the future, especially if the future availability of informal care is likely to diminish rather than increase.
Two scenarios illustrate how policy changes can affect future public expenditure on LTC: the "shift to formal care scenario", assessing the effect of a shift from informal or cash to formal care services and the "coverage convergence scenario", assessing the impact of a convergence to the EU-27 formal coverage rate.
4.3.1 "Shift to formal care"
The "shift to formal care scenario" attempts to assess the effect of a demand-driven increase in public funding/ provision of formal LTC in-kind which replaces or supports informal care. In particular, this scenario examines the budgetary impact of a progressive annual shift into the formal in-kind sector of 1% of the dependent population who have so far received only informal care or cash benefits. This extra shift is assumed to take place during the first ten years of the projection period only. It sums up to a shift of about 9.6% of former beneficiaries of informal care or cash benefits only into beneficiaries of formal LTC in-kind. It is further assumed that 50% of these "new" formal beneficiaries are considered to move into institutional care, while the other 50% are assumed to receive formal care at home.
Table 10 below shows the projected public expenditure on LTC from 2010 to 2060 for this scenario. As expected, public expenditure on LTC is projected to increase much more (2.6 p.p. of GDP for the EU-27 from 2010 up until 2060, compared to the 1.7 p.p. of GDP under the "base case scenario").
The increased coverage of dependents assumed by the scenario results in a projected increase in LTC expenditure for all countries. The largest increases – more than 3 p.p. of GDP – are registered for The Netherlands, Denmark, Finland, Sweden, Belgium and France. In the EU-12, important increases are also observed for Slovenia and Poland. The largest projected increases vis-à-vis the "base case scenario" are observed for France (+1.2 p.p. of GDP), Poland, Sweden and the United Kingdom (+1 p.p. of GDP). Interestingly, even countries where the expenditure level and the coverage rate are already relatively high (such as Denmark or Finland) show a projected absolute increase that is almost 1 p.p. of GDP higher than in the "base case scenario", although less marked in relative terms.
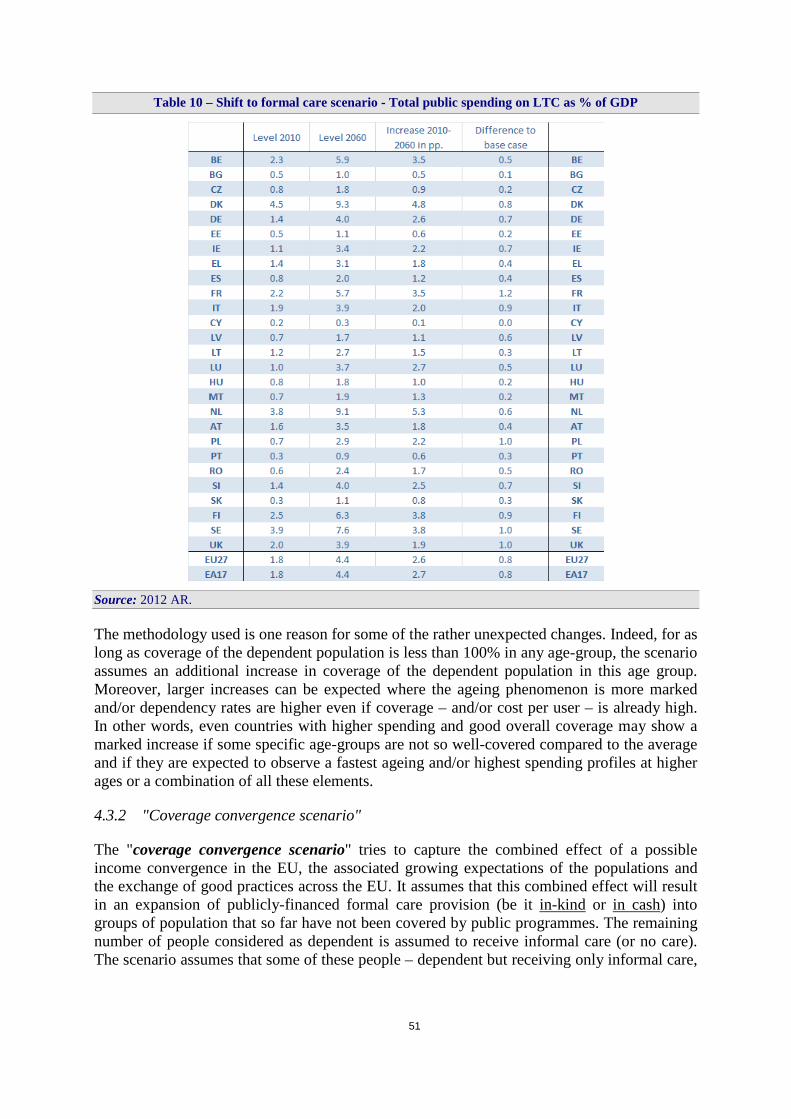
51
Table 10 – Shift to formal care scenario - Total public spending on LTC as % of GDP
Source: 2012 AR.
The methodology used is one reason for some of the rather unexpected changes. Indeed, for as long as coverage of the dependent population is less than 100% in any age-group, the scenario assumes an additional increase in coverage of the dependent population in this age group. Moreover, larger increases can be expected where the ageing phenomenon is more marked and/or dependency rates are higher even if coverage – and/or cost per user – is already high. In other words, even countries with higher spending and good overall coverage may show a marked increase if some specific age-groups are not so well-covered compared to the average and if they are expected to observe a fastest ageing and/or highest spending profiles at higher ages or a combination of all these elements.
4.3.2 "Coverage convergence scenario"
The "coverage convergence scenario" tries to capture the combined effect of a possible income convergence in the EU, the associated growing expectations of the populations and the exchange of good practices across the EU. It assumes that this combined effect will result in an expansion of publicly-financed formal care provision (be it in-kind or in cash) into groups of population that so far have not been covered by public programmes. The remaining number of people considered as dependent is assumed to receive informal care (or no care). The scenario assumes that some of these people – dependent but receiving only informal care,

52
or no care – will receive formal LTC.76 Essentially, it assumes that by 2060 there is a coverage convergence to the EU-27 average calculated in 2010. In other words, the Member States where the formal coverage rate for total formal care (in-kind and cash) is below the EU-27 average in any age-gender group in the starting year are assumed to converge to this average by 2060.
This scenario calls for a caveat. Indeed, the assumed convergence process is based on a base-year comparison between 1) the number of dependents, proxied by the so-called "severely disabled" as surveyed by EU-SILC and 2) the number of recipients of formal care. The way these two variables are provided for the base year may give scope for over- or under-estimation. Indeed, 1) EU-SILC gives a self-perception of severe disability – our proxy for dependency – which may differ considerably between countries77, while 2) the numbers of LTC recipients are sometimes provided by the Member State only from a very partial source, or not provided at all, and therefore replaced by the corresponding EU-12 or EU-15 average.
Table 11 shows the projection results under the "coverage convergence scenario". For the EU-27, public expenditure on LTC is projected to increase by 3.2 p.p. of GDP over the period 2010 to 2060, i.e. 1.5 p.p. of GDP higher than the "base case scenario". As in the "shift to formal care scenario", this higher but expected increase vis-à-vis the "base case scenario" is the result of an increased coverage of dependent individuals, especially in countries where the coverage of the dependent population is currently low compared to the EU average.
Larger projected increases vis-à-vis the "base case scenario" are observed for Latvia (+3.2 p.p.), Germany (+2.6 p.p.), France (+2.5 p.p.) and Slovenia (+2.4 p.p.). For these four countries, the calculated coverage rate in 2010 is relatively low (see Annex I). When compared to the initial coverage rates as shown in Table 15 in Annex, the results are generally quite consistent. The projected increase is higher than in the "base case scenario" for all countries except for Lithuania, the Netherlands or Belgium, which show a coverage rate above the average for 2010. Yet, some countries which have higher than average expenditure level and coverage ratios in 2010 present some puzzling results. This may be due to several reasons, as noted above. First, the fact that, for as long as coverage of dependent population is less than 100% of the EU average in any age groups, the scenario assumes an additional increase in the coverage of the dependent population. Second, larger increases can be expected where the ageing phenomenon is more marked and/or dependency rates are higher even if coverage is high, but also if the most costly type of formal care (usually institutional care) represents a larger share of the public provision. Third, results may also reflect a lack of data availability or accuracy.
76 The scenario also keeps constant the relative shares of formal care in total coverage (institutional, home, cash benefits). 77 As shown in Table 14 (Annex I) age-specific dependency rates vary markedly across EU Member States; in some countries they are three times higher than in others. Hence, the comparability of dependency rates and thus coverage rates based on the EU-SILC data concerning self-perceived disability is limited. This is especially true for countries with well-developed long-term care systems, where the scenario may considerably overestimate the increase of public expenditure, although severe disability is less prone to subjectivity than low or medium disability, and is usually more strongly correlated with objective variables.
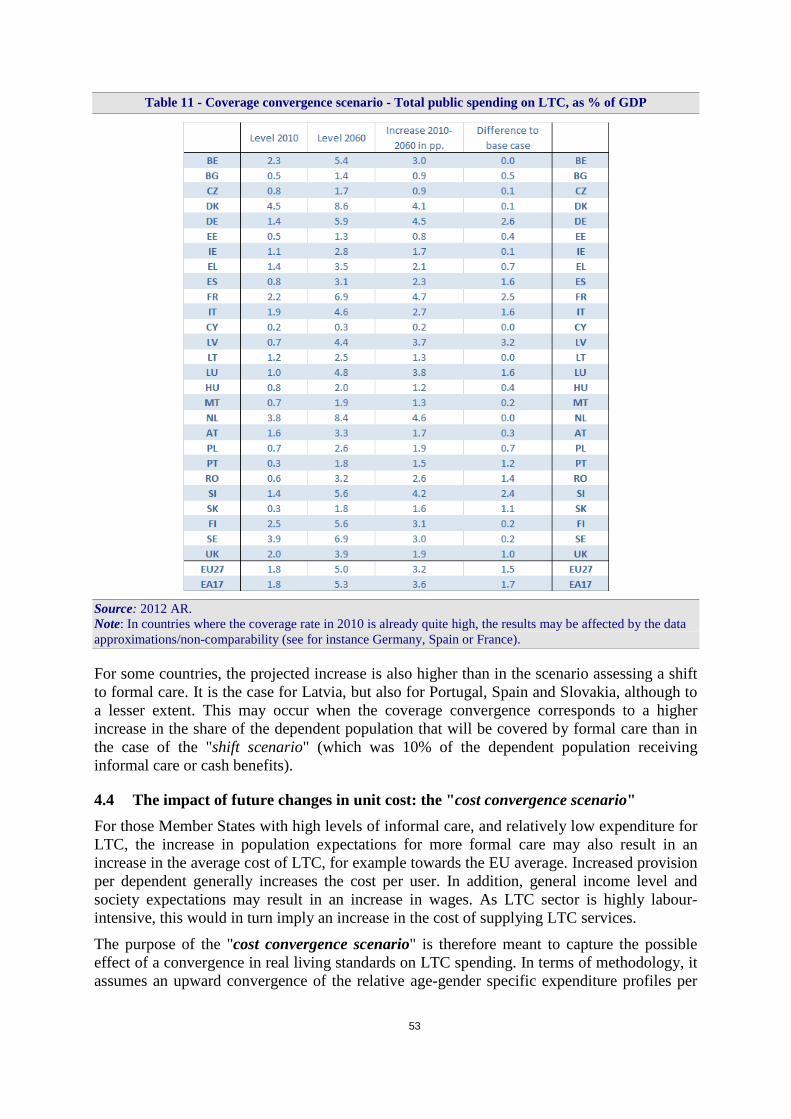
53
Table 11 - Coverage convergence scenario - Total public spending on LTC, as % of GDP
Source: 2012 AR. Note: In countries where the coverage rate in 2010 is already quite high, the results may be affected by the data approximations/non-comparability (see for instance Germany, Spain or France).
For some countries, the projected increase is also higher than in the scenario assessing a shift to formal care. It is the case for Latvia, but also for Portugal, Spain and Slovakia, although to a lesser extent. This may occur when the coverage convergence corresponds to a higher increase in the share of the dependent population that will be covered by formal care than in the case of the "shift scenario" (which was 10% of the dependent population receiving informal care or cash benefits).
4.4 The impact of future changes in unit cost: the "cost convergence scenario" For those Member States with high levels of informal care, and relatively low expenditure for LTC, the increase in population expectations for more formal care may also result in an increase in the average cost of LTC, for example towards the EU average. Increased provision per dependent generally increases the cost per user. In addition, general income level and society expectations may result in an increase in wages. As LTC sector is highly labour-intensive, this would in turn imply an increase in the cost of supplying LTC services.
The purpose of the "cost convergence scenario" is therefore meant to capture the possible effect of a convergence in real living standards on LTC spending. In terms of methodology, it assumes an upward convergence of the relative age-gender specific expenditure profiles per
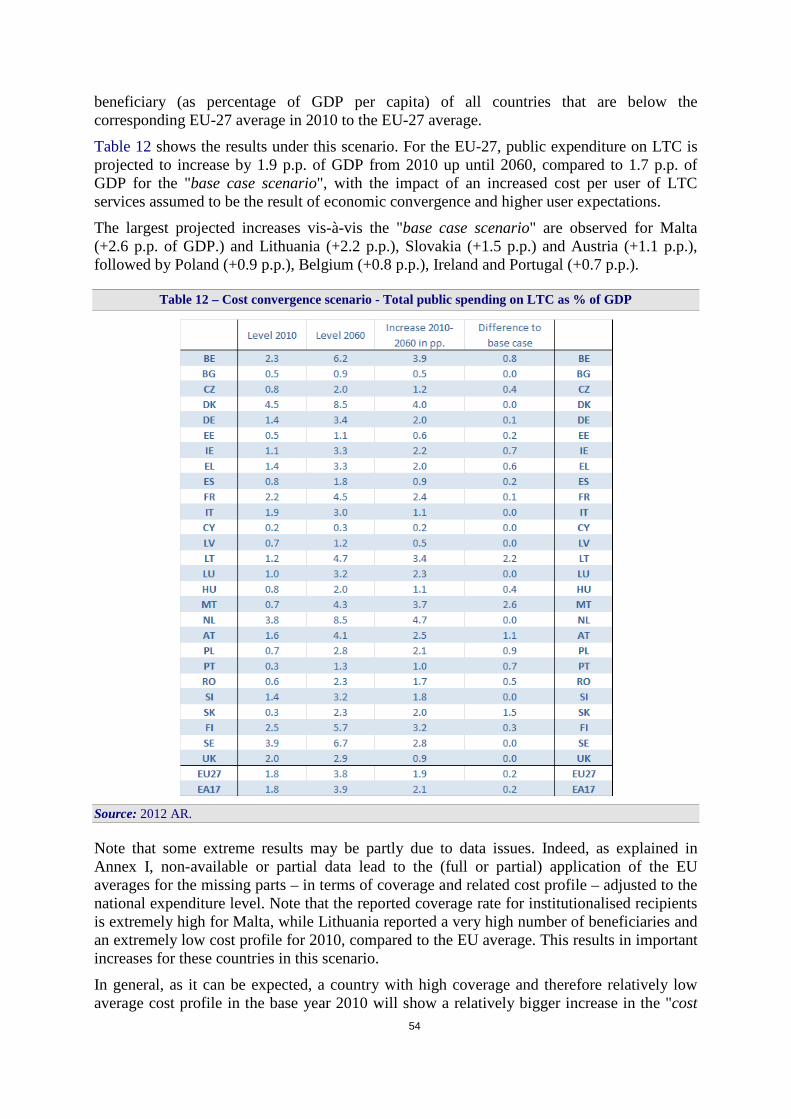
54
beneficiary (as percentage of GDP per capita) of all countries that are below the corresponding EU-27 average in 2010 to the EU-27 average.
Table 12 shows the results under this scenario. For the EU-27, public expenditure on LTC is projected to increase by 1.9 p.p. of GDP from 2010 up until 2060, compared to 1.7 p.p. of GDP for the "base case scenario", with the impact of an increased cost per user of LTC services assumed to be the result of economic convergence and higher user expectations.
The largest projected increases vis-à-vis the "base case scenario" are observed for Malta (+2.6 p.p. of GDP.) and Lithuania (+2.2 p.p.), Slovakia (+1.5 p.p.) and Austria (+1.1 p.p.), followed by Poland (+0.9 p.p.), Belgium (+0.8 p.p.), Ireland and Portugal (+0.7 p.p.).
Table 12 – Cost convergence scenario - Total public spending on LTC as % of GDP
Source: 2012 AR.
Note that some extreme results may be partly due to data issues. Indeed, as explained in Annex I, non-available or partial data lead to the (full or partial) application of the EU averages for the missing parts – in terms of coverage and related cost profile – adjusted to the national expenditure level. Note that the reported coverage rate for institutionalised recipients is extremely high for Malta, while Lithuania reported a very high number of beneficiaries and an extremely low cost profile for 2010, compared to the EU average. This results in important increases for these countries in this scenario.
In general, as it can be expected, a country with high coverage and therefore relatively low average cost profile in the base year 2010 will show a relatively bigger increase in the "cost
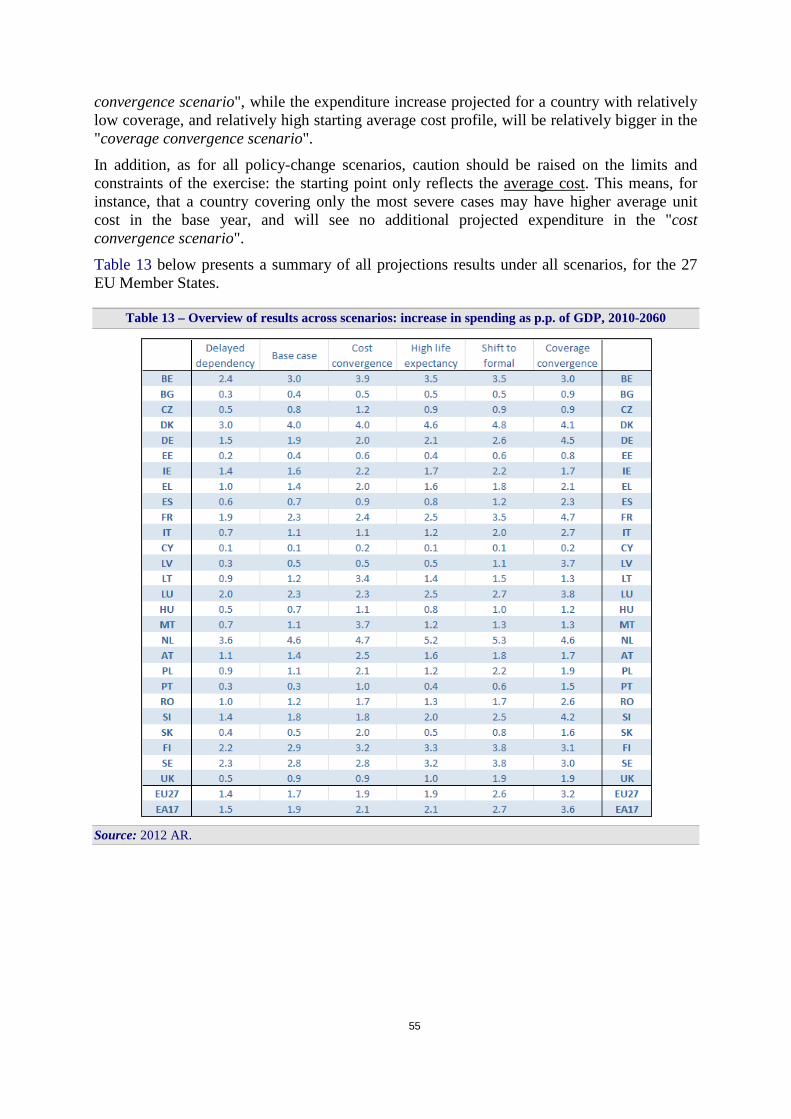
55
convergence scenario", while the expenditure increase projected for a country with relatively low coverage, and relatively high starting average cost profile, will be relatively bigger in the "coverage convergence scenario".
In addition, as for all policy-change scenarios, caution should be raised on the limits and constraints of the exercise: the starting point only reflects the average cost. This means, for instance, that a country covering only the most severe cases may have higher average unit cost in the base year, and will see no additional projected expenditure in the "cost convergence scenario".
Table 13 below presents a summary of all projections results under all scenarios, for the 27 EU Member States.
Table 13 – Overview of results across scenarios: increase in spending as p.p. of GDP, 2010-2060
Source: 2012 AR.
56
5 CONCLUSIONS AND POLICY IMPLICATIONS
The projection results presented above show that – first and most important – population ageing results in a projected increase in public expenditure on LTC (i.e. an additional 1.7 p.p. of GDP for the EU-27 as a whole). This is because ageing, i.e. a higher number of older persons, brings along a higher (absolute) number of individuals with severe disability / dependency / need for LTC services. The increase is higher, the faster the ageing process, but also the higher the cost profile for older age-groups.
Second, the future actual amount of public expenditure on LTC will not only depend on the mere fact that the population is ageing, but also on the (health) quality of the additional years an individual can expect to live. Indeed, a reduction in severe disability and therefore in the dependency status – notably of elderly people – can reduce the expected rise in the need / assumed demand for long-term care services and hence the increase in LTC public expenditure. A postponement of dependency in line with the increase in life expectancy, implying that additional years of life are spent without dependency, would reduce the increase in public expenditure by 0.3-0.4 p.p. of GDP on average for the EU-27.
Third, policy decisions regarding changes in the provision of LTC may substantially impact the future evolution of public expenditure on LTC. Changes in the demographic structure of the population and high population expectations may result in further pressure to increase the provision of formal LTC services in the future. As said, population ageing is associated with an absolute increase in dependency in the old and very old population and therefore an increase in the demand for LTC services. At the same time, expected socio-economic trends are also associated with changes in family structures, living arrangements (smaller families, more isolated persons) and mobility (living farther apart) which reduce the possibility for the dependent persons to receive the necessary support from the family (reduction in the supply of informal care). These, combined with growing population expectations for a more extensive provision of formal and high-quality LTC services that can help increase the quality of life of individuals living with a dependency, may lead to increasing public expenditure on LTC.
Projections show that a small shift from informal to formal LTC services in-kind (at home or institutions) contributes to an additional 1 p.p. of GDP of public expenditure on LTC for the EU-27 as a whole. Further, a projected convergence in the coverage rates of dependent population – assumed to come along as a result of ageing combined with growing expectations, notably in those countries where coverage rates are relatively lower – increases public expenditure on LTC by an additional 1.5 p.p. of GDP.
Finally, future public expenditure on LTC may depend not only on increased LTC demand and increased provision (overall and per dependent) but also on an increase in the costs of provision, such as an increase in wages in such a labour-intensive sector as is the LTC sector. Convergence in costs around the EU, especially in countries where both provision and the average cost of providing services are currently low, will further increase projected public expenditure on LTC.
The range of results is pictured in Graph 21, showing that even taking into account only the demographic impact of an ageing population (the "base case scenario"), public expenditure would, on average, almost double over the projection period (+1.7 p.p. of GDP increase).78
78 In Table 13 above, the scenarios' results are ordered in more details according to increasing changes in spending over 2010-2060 for the EU-27.
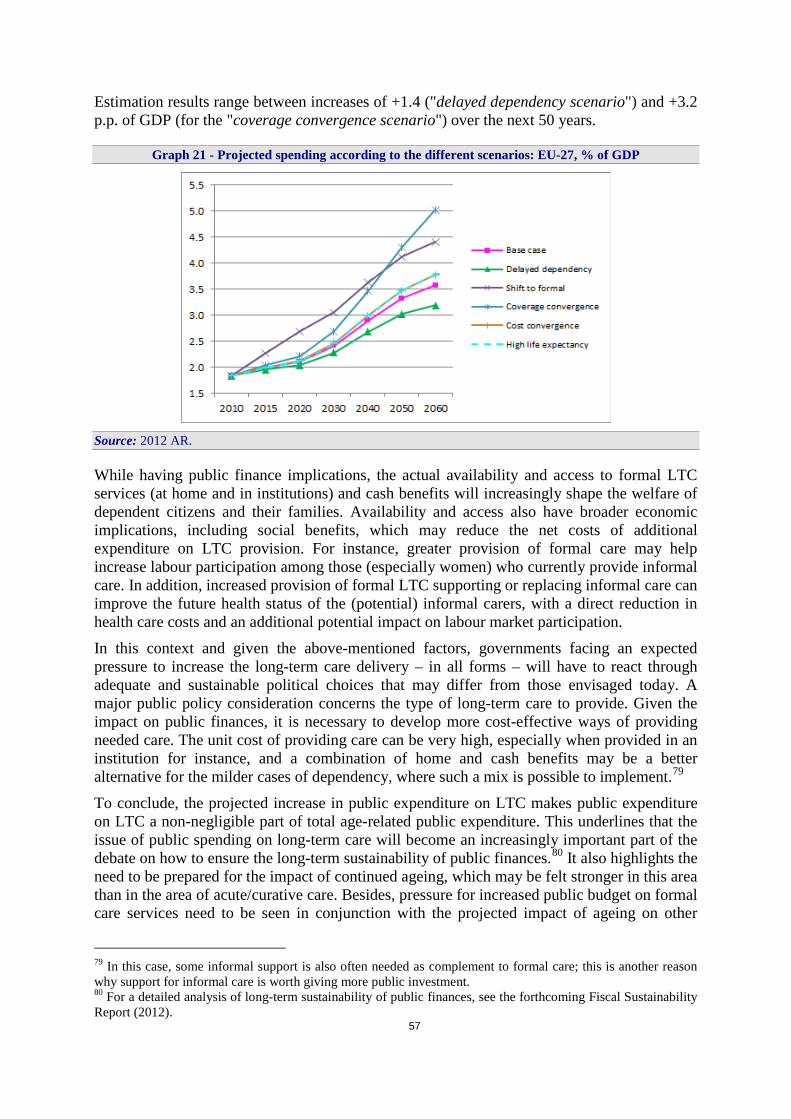
57
Estimation results range between increases of +1.4 ("delayed dependency scenario") and +3.2 p.p. of GDP (for the "coverage convergence scenario") over the next 50 years.
Graph 21 - Projected spending according to the different scenarios: EU-27, % of GDP
Source: 2012 AR.
While having public finance implications, the actual availability and access to formal LTC services (at home and in institutions) and cash benefits will increasingly shape the welfare of dependent citizens and their families. Availability and access also have broader economic implications, including social benefits, which may reduce the net costs of additional expenditure on LTC provision. For instance, greater provision of formal care may help increase labour participation among those (especially women) who currently provide informal care. In addition, increased provision of formal LTC supporting or replacing informal care can improve the future health status of the (potential) informal carers, with a direct reduction in health care costs and an additional potential impact on labour market participation.
In this context and given the above-mentioned factors, governments facing an expected pressure to increase the long-term care delivery – in all forms – will have to react through adequate and sustainable political choices that may differ from those envisaged today. A major public policy consideration concerns the type of long-term care to provide. Given the impact on public finances, it is necessary to develop more cost-effective ways of providing needed care. The unit cost of providing care can be very high, especially when provided in an institution for instance, and a combination of home and cash benefits may be a better alternative for the milder cases of dependency, where such a mix is possible to implement.79
To conclude, the projected increase in public expenditure on LTC makes public expenditure on LTC a non-negligible part of total age-related public expenditure. This underlines that the issue of public spending on long-term care will become an increasingly important part of the debate on how to ensure the long-term sustainability of public finances.80 It also highlights the need to be prepared for the impact of continued ageing, which may be felt stronger in this area than in the area of acute/curative care. Besides, pressure for increased public budget on formal care services need to be seen in conjunction with the projected impact of ageing on other
79 In this case, some informal support is also often needed as complement to formal care; this is another reason why support for informal care is worth giving more public investment. 80 For a detailed analysis of long-term sustainability of public finances, see the forthcoming Fiscal Sustainability Report (2012).
58
expenditure items, notably pensions and health care. In particular, it is worth exploring the possible impact of investing in LTC on the future level of health care expenditure, as better prevention and better follow-up (including rehabilitation and general long-term care) can avoid the recourse to more acute (often more expensive) types of care.81
81 In particular, there seems to be no strong evidence yet that any specific intervention on particular types of cognitive stimulation can reduce incident dementia. As Ballard et al. (2011) states: "…the most promising approach to reducing the prevalence of the disease is probably a more general intervention to promote healthy living, with a strong emphasis on exercise as an important component." In the same line, Busch et al. (2009) underlines that better physical function can be associated with a reduction in depressive symptoms in older adults, which reinforces the expected benefit from "healthy-living prevention".
59
6 LIST OF REFERENCES
Ballard, C., Gauthier, S., Corbett, A., Brayne, C., Aarsland D. and E. Jones (2011), "Alzheimer's disease", The Lancet, Vol. 377, pp. 1019-1031.
Beach, S. R., Schulz, R., Yee, J. L. and S. Jackson (2000), "Negative and positive health effects of caring for a disabled spouse: Longitudinal findings from the Caregiver Health Effects Study", Psychology and Aging, Vol. 15(2), Jun 2000, pp. 259-271.
Bonsang, E. (2009), "Does informal care from children to their elderly parents substitute for formal care in Europe?", Journal of Health Economics, Vol. 28 (2009), pp. 143-154.
Bulletin luxembourgeois des questions sociales (2005), "Long-term care for older persons", Conference organised by the Luxembourg Presidency with the Social Protection Committee of the European Union, Vol. 19, May 2005.
Busch, M., Welke, J., Neuner, B., Fuchs, J. and C. Scheidt-Nave (2009), "Physical functioning and depressive symptoms among older Europeans - Longitudinal results from the Survey of Health, Ageing and Retirement in Europe (SHARE)", 42rd annual meeting of the Society for Epidemiologic Research, American Journal of Epidemiology, Vol. 169 (Supplement), p. 68.
Christensen, K., Doblhammer, G., Rau, R. and J.W. Vaupel (2009), "Ageing populations: the challenges ahead", The Lancet, Vol. 374(9696), pp. 1196-1208.
Colombo, F., Llena-Nozal, A., Mercier, J. and F. Tjadens (2011), "Help Wanted? Providing and Paying for Long-Term Care", OECD Health Policy Studies, OECD Publishing.
Colombo, F., Llena-Nozal, A., Mercier, J., Tjadens, F. and L. Wei (2010), "Long-term care workforce in OECD countries", presentation of the OECD LTC project.
Comas-Herrera, A., Wittenberg, R. and L. Pickard (2005): "Making projections of public expenditure on long-term care for the European member states: Methodological proposal for discussion", paper presented at the Commission- AWG-OECD workshop on 21-22 February 2005.
Cremer, H. and P. Pestieau (2009), "Securing long-term care in the EU: some key issues", CREPP Working Paper No. 2009/05.
Crespo, L. (2006), "Caring for parents and employment status of European mid-life women", CEMFI Working Paper No. 0615.
Diez Guardia, N., Przywara, B. and E. Sail (2010), "Future long-term care needs and expenditure in the EU", draft, European Commission – Directorate General for Economic and Financial Affairs (DG ECFIN), Brussels.
60
Economic Policy Committee and European Commission (EPC/EC) (2009), "The 2009 Ageing Report: economic and budgetary projections for the EU-27 Member States (2008-2060)", European Economy, No. 2, Directorate General Economic and Financial Affairs, European Commission 2009. Available at: http://ec.europa.eu/economy_finance/publications/publication14992_en.pdf.
European Commission – Directorate General for Economic and Financial Affairs (2012), "Fiscal Sustainability Report 2012", European Economy, No. 8, Brussels (forthcoming).
European Commission – Directorate General for Economic and Financial Affairs and Economic Policy Committee – Ageing Working Group (2012), "The 2012 Ageing Report: Economic and budgetary projections for the 27 EU Member States (2010-2060)", European Economy, No. 2, Brussels. See: http://ec.europa.eu/economy_finance/publications/european_economy/2012/2012-ageing-report_en.htm.
European Commission – Directorate General for Economic and Financial Affairs and Economic Policy Committee – Ageing Working Group (2011), "The 2012 Ageing Report: Underlying assumptions and projection methodologies", European Economy, No. 4, Brussels. See: http://ec.europa.eu/economy_finance/publications/european_economy/2011/ee4_en.htm.
European Commission – Directorate General for Employment, Social Affairs and Inclusion (2008), "Long-term Care in the European Union". Available at: http://ec.europa.eu/social/main.jsp?catId=792&langId=en.
Feinberg, L., Reinhard, S.C., Houser, A. and R. Choula (2011), " Valuing the Invaluable: 2011 Update. The Growing Contributions and Costs of Family Caregiving", AARP Public Policy Institute.
Fujisawa, R. and F. Colombo (2009), "The long-term care workforce: overview and strategies to adapt supply to a growing demand", OECD Health Working Papers No. 44, OECD Publishing.
Gaymu, J. and the FELICIE team (2008), "What family support will dependent elders have in 2030?", Population & Societies No. 444, April 2008.
Gibson, M.J. and A. Houser (2007), "Valuing the Invaluable: A New Look at the Economic Value of Family Caregiving", AARP Public Policy Institute.
Glendinning, C., Arksey, H. and F. Tadjens (2009), "Care Provision within Families and its Socio-Economic Impact on Care Providers", Social Policy Research Unit, WP No. BRF2350.
Global Forum for Health Research (2008), "Monitoring Financial Flows for Health Research 2008: Prioritizing research for health equity".
61
Haberkern, K. and M. Szydlik (2010), "State care provision, societal opinion and children's care of older parents in 11 European countries", Ageing & Society, Vol. 30, pp. 299-323.
IHAT (International Health Accounts Team) (2011), A System of Health Accounts – Version 2.0, Chapters 1 to 15, Pre-edited Version March 2011.
Ikejima, C., Hisanaga, A., Ymada, T., Nakajima, K., Yamada, S., Kakuma, T., Mizukami, K. and T. Asada (2011), "Trends in the prevalence of dementia in Japan: a preliminary report", Alzheimer's & Dementia, Vol. 7, Supplement, p. S596.
Jenson, J. and S. Jacobzone (2000), "Care Allowances for the Frail Elderly and Their Impact on Women Care-Givers", OECD Labour Market and Social Policy Occasional Papers, No. 41, OECD Publishing.
Lafortune, G., Balestat, G. and the Disability Study Expert Group Members (2007), "Trends in severe disability among elderly people: assessing the evidence in 12 OECD countries and the future implications", OECD Health Working Papers No. 26, OECD Publishing.
Langa, K., Larson, E., Karlawish, J., Cutler, D., Kabeto, M., Kim, S. and A. Rosen (2008), "Trends in the prevalence and mortality of cognitive impairment in the United States: Is there evidence of a compression of cognitive morbidity?", Alzheimer's & Dementia, Vol. 4, pp. 134-144.
Lundsgaard J (2005), "Consumer direction and choice in long-term care for older persons, including payments for informal care: How can it help to improve care outcomes, employment and fiscal sustainability?", OECD Health Working Paper No. 20, OECD Publishing.
MISSOC database – Mutual Information System on Social Protection, The 2011 release, see: http://ec.europa.eu/employment_social/missoc/db/public/compareTables.do
Murray J, Schneider J, Banerjee S, and A. Mann (1999), "EUROCARE: a cross-national study of co-resident spouse carers for people with Alzheimer's disease: II--A qualitative analysis of the experience of caregiving", International Journal of Geriatric Psychiatry, Vol. 14(8), pp. 662-7.
OECD (2011), "Health at a Glance 2011: OECD Indicators", OECD Publishing.OECD (2005), "Long-term care for older people", The OECD Health Project, OECD Publishing."
OECD, Eurostat, WHO (2011), "A System of Health Accounts", OECD Publishing.
Productivity Commission (2005), "Economic Implications of an Ageing Australia", Research Report, Canberra.
Rapport Qualidem I 1999-2002 (2002), Chapter 11: "Analyse des coûts et de leur financement", Université de Liège and Katholieke Universiteit Leuven, 2002.

62
Qiu, C., von Strauss, E., Garmén, A., Bäckman, L. and L. Fratiglioni (2011), "Trends in dementia occurrence in a 15-year period in central Stockholm, Sweden", Alzheimer’s & Dementia Vol. 7, Supplement, pp. S361-S362.
SHARE survey – Survey of Health, Ageing and Retirement in Europe: http://www.share-project.org/
Tarricone, R. and D. Tsouros (2008), "Home care in Europe. The Solid facts", World Health Organization, Europe, c2008 viii.
Tomassini, C., Glaser, K., Wolf, D., Broese van Groenou, M. and E. Grundy (2004), "Living arrangements among older people: An overview of trends in Europe and the USA", Population Trends, Vol. 115, pp. 24-34.
Van Houtven, C. and E. Norton (2004), "Informal care and health care use of older adults", Journal of Health Economics, Vol. 23 (2004), pp. 1159-1180.
Wimo, A., Winblad, B. and L. Jonsson (2010), “The Worldwide Societal Costs of Dementia: Estimates for 2009”, Alzheimer’s & Dementia, Vol. 6, pp. 98-103.
63
7 GLOSSARY
Abbreviations and symbols used
Member States
BE Belgium BG Bulgaria CZ the Czech Republic DK Denmark DE Germany EE Estonia EI Ireland EL Greece ES Spain FR France IT Italy CY Cyprus LV Latvia LT Lithuania LU Luxembourg HU Hungary MT Malta NL the Netherlands AT Austria PL Poland PT Portugal RO Romania SI Slovenia SK Slovakia FI Finland SE Sweden UK the United Kingdom EA-17 Euro area, 17 Member States EU European Union EU-27 European Union, 27 Member States EU-15 European Union, 15 Member States, before 1 May 2004 EU-12 European Union, 12 Member States that joined the EU on and after 1 May
2004 (BG, CZ, EE, CY, LV, LH, HU, MT, PL, RO, SI, SK)
Others
2012 AR the 2012 Ageing Report (see at: http://ec.europa.eu/economy_finance/publications/european_economy/2012/2012-ageing-report_en.htm)
ADL Activities of Daily Living, such as eating, bathing, dressing, getting in and out of bed or using the toilet.
AWG Ageing Working Group (under the Economic Policy Committee): http://europa.eu/epc/working_groups/ageing_en.htm

64
COFOG Classification of the functions of government (see http://epp.eurostat.ec.europa.eu/statistics_explained/index.php/Glossary:Classification_of_the_functions_of_government_(COFOG))
DG ECFIN Directorate-General Economic and Financial Affairs (European Commission): http://ec.europa.eu/dgs/economy_finance/index_en.htm
DG EMPL Directorate General for Employment, Social Affairs and Inclusion (European Commission): http://ec.europa.eu/social/home.jsp?langId=en
ECOFIN Economic and Financial Council
EPC Economic Policy Committee
ESSPROS European System of Integrated Social Protection Statistics: common framework developed (in the late 1970's) by Eurostat and the European Union Member States, providing a coherent comparison between European countries of social benefits to households and their financing (see at: http://epp.eurostat.ec.europa.eu/statistics_explained/index.php/Glossary:ESSPROS)
ESTAT Eurostat: the statistical office of the European Union. Its task is to provide the European Union with statistics at European level that enable comparisons between countries and regions (see: http://epp.eurostat.ec.europa.eu/portal/page/portal/eurostat/home)
EUR Euro
EUROPOP2010 Demographic projections 2010-2060, by Eurostat (see: http://epp.eurostat.ec.europa.eu/portal/page/portal/population/data/main_tables)
EU-SILC European Union Statistics on Income and Living Conditions; see: http://epp.eurostat.ec.europa.eu/portal/page/portal/microdata/eu_silc
GDP Gross domestic product
HC Health care
IADL Instrumental Activities of Daily Living, such as preparing meals, shopping and housework
ICT Information and communications technology
LTC Long-term care
MS Member State(s)
OECD Organisation of Economic Co-operation and Development (http://www.oecd.org)
p.p. Percentage points
WHO World Health Organization (http://www.who.int/en)

65
SHA The System of Health Accounts, provides for health accounting in the European Union Member States, an economic framework, and accounting rules which are methodologically compatible with the System of national accounts. It sets the basis for the "joint health accounts data collection" an initiative by the OECD, Eurostat and the WHO to cooperate on gathering statistics on health expenditure. SHA has been developed since 2000 (SHA 1.0) and an updated version has been issued recently: SHA 2011 (see OECD, Eurostat, WHO, 2011).
SHARE The Survey of Health, Ageing and Retirement in Europe; SHARE is a multidisciplinary and cross-national panel database of micro data on health, socio-economic status and social and family networks of more than 55,000 individuals from 20 European countries, aged 50 or over. Four successive waves have already been worked out: 2004, 2006, 2008 and 2010: http://www.share-project.org
MISSOC EU's Mutual Information System on Social Protection: http://ec.europa.eu/employment_social/missoc/db/public/compareTables.do

66
67
8 ANNEXES
8.1 ANNEX I: Input data used to project long-term care expenditure
8.1.1 Types of care, data sources and categories
The projections rely on the OECD/EUROSTAT System of Health Accounts (SHA) database as the primary data source supplemented, when necessary, with data from the European System of integrated Social PROtection Statistics (ESSPROS) database. Only if no data was available from both sources, the EU Member States were asked to provide the missing figures. In addition, dependency levels are measured with the EU-SILC data, available for the 27 Member States.
8.1.1.1 Public expenditure on long-term care
The notion of long-term health care services usually refers to services delivered over a sustained period of time, sometimes defined as lasting at least six months.82 Public expenditure on long-term care is defined, according to the System of Health Accounts classification83, as the sum of the following publicly financed items:
• services of long-term nursing care (HC.3) (which is also called "the medical component of long-term care" or "long-term health care", and includes both nursing care and personal care services), and
• social services of long-term care (HC.R.6.1), which is the "assistance services" part, relating primarily to assistance with IADL (instrumental activities of daily living) tasks.
These components mainly represent the in-kind benefits allocated to dependent people. In addition, projections on long-term care also cover public spending on cash benefits. The cash benefits include social programmes offering care allowances, addressed to persons with long-term care needs who live in their own homes. However, the design of these programmes varies widely across countries, which reduces the comparability between them. Illustrating this variety of systems, it is noteworthy that some countries account for nursing allowances in the HC.3 category. Yet, while the total public expenditure on long-term care comprises both in-kind and cash benefits, public expenditure on cash benefits is projected separately from expenditure on long-term care services provided "in kind" – at home or in the institutions.
As agreed, and detailed in European Commission (2011), the data from the two databases (SHA and ESSPROS) have been combined as follows84:
1) In-kind public expenditure on long-term care 82 For more details, see: OECD (2006), Costs of Care for Elderly Populations. Guidelines for estimating long-term care expenditure, DELSA/HEA/DIS (2006)4, 14 February 2006, pp. 9-11. 83 Note that an updated version of the SHA – the so-called SHA 2011 – is planned to be ready by end of 2012 and circulated for the 2013 data collection process, though a transition period (up to 2015) is expected. Specifically, HC.3 will be disaggregated into four categories (inpatient, day care, outpatient and home-based). The new reporting item HC.R.1 will be devoted to "long-term care (social)", with two subcategories on in-kind and cash benefits; see IHAT (2011) and OECD, Eurostat, WHO (2011). 84 On the basis of European Commission – Directorate General for Economic and Financial Affairs and Economic Policy Committee (2011), "The 2012 Ageing Report: Underlying assumptions and projection methodologies", European Economy, No. 4.
68
For the 23 EU Member States using SHA joint questionnaire data, public expenditure on LTC is computed as the sum of the above-mentioned SHA categories: long-term nursing care (HC.3) and related social services in kind (HC.R.6.1). Data by category are available on both the OECD Health Data and Eurostat Cronos. Most recent data by category refers to 2009. For those countries not using the SHA joint questionnaire or not reporting HC.R.6, proxies have been calculated on the basis of ESSPROS data.85
2) Long-term care related cash benefits
Long-term care related cash benefits are reported within two ESSPROS functions86: "Disability" and "Old Age". Thus, both periodic and lump-sum parts of care allowances and economic integration in the Disability function, as well as periodic care allowance in the Old Age function are generally added, as cash benefits, to the HC.3+HC.R.6.1 sum or to the correspondent ESSPROS sum as calculated above.
Moreover, the SHA joint questionnaire data by sub-categories of long-term nursing care (HC.3) – i.e. inpatient, day cases, and home care – and ESSPROS data by type of benefits in kind are used to identify the two components of total public expenditure: home care and institutional care. We then proceed to calculate the part of HC.R.6.1 which constitutes home care and the part which constitutes institutional care, through proxies calculated on the basis of the ESSPROS data.
8.1.1.2 Disabled and recipients
When available, data on numbers of recipients have been provided by Member States, while disability rates are available for all Member States in the 2009 EU-SILC database, for people aged 15+, by age group. 85 The categories concerned are: a) Sickness/Health Care function – "other benefits in kind"; b) Disability function – "benefits in kind" ("accommodation" + "rehabilitation" + "home help/assistance in carrying out daily tasks" + "other benefits in kind"); c) Old Age function – "benefits in kind" ("accommodation" + "home help/assistance in carrying out daily tasks" + "other benefits in kind"). 86 The HC.R.7 SHA category (health-related cash benefits) cannot be used for our purpose, as it does not allow for a clear differentiation between health care related and long-term care related cash benefits. Moreover, the relevant data is missing for many countries.
Box 3: Taking account of existing policy settings in the Member States
Impact of reforms on public wages
Seven Member States (CY, ES, IE, LV, PT, RO and SI) have implemented reforms implying wage changes in the years 2010-2015 (see 2012 AR). These reforms usually apply to the whole public sector or to the health and long-term care sector only. For these seven Member States, reforms have been taken into account for both types of in-kind formal care, relatively to the share of wages in the total amount – approximated by their share in the health sector. For most countries, the impact of these reforms on LTC public expenditure is negligible (less than or equal to -0.01 p.p. of GDP difference over the period 2010-2060) or at most very small (-0.02, -0.03, and -0.05 p.p. for Latvia, Spain and Portugal, respectively). The impact is a bit higher for Romania and Ireland, with respectively -0.2 and -0.3 p.p. of GDP by 2060.
69
On the one hand, the legal definition of "dependent/recipient", or "entitled to long-term care", can differ widely from one Member State to another, preventing full data comparability. In other words, the level of dependency opening a right to the provision of long-term care may vary a lot across countries. On the other hand, what we consider is the proportion of recipients (by age groups) with respect to the number of disabled (according to the EU-SILC definition).
8.1.2 Input data
Only a few countries provided the full set of data necessary to run the 2012 EC-AWG projection exercise. Missing data were replaced in a number of ways. In particular:
1. when the number of users of institutional and home care and the number of cash beneficiaries were not available for each age and sex group but only with partial or different disaggregation, the distribution was adjusted by age and sex on the basis of the share of dependents (EU-SILC dependency rates) by respective age and sex group (e.g. NO, UK);
2. when a country provided the needed age- and gender-disaggregation of the total number of users only for one type of LTC services (home or institutional) and the total number of users of the other type, or only the total numbers for both types, by age group, the "slope", i.e. the allocation of care users was assumed to be the same for both types of care (e.g. HU, SE);
3. when no data on the numbers of recipients were available (e.g. CY, RO, SK, EE), the coverage rates of each type of formal care was proxied by the coverage profile of a similar Member State (both in terms of GDP per capita and relative expenditure profile);
4. missing LTC age-gender specific profiles were replaced by the average of individual countries' LTC age-gender specific expenditure profiles expressed as % of GDP per capita; the average was calculated using all available data, either for EU-12 or EU-15;
5. public spending in home and institutional care was proxied by the average share of those two items in total public LTC spending.
The average LTC age-gender specific expenditure profile (as calculated in point 4 just above) was also used when a country provided aggregate expenditure but 1) no information on recipients of institutional and home care, 2) no information on age-gender expenditure profile per user and 3) only age-gender specific expenditure per capita (total public expenditure on long-term care for each age-gender cohort divided by the number of people in a given age-gender cohort). Using per capita rather than per user creates a pattern of age-gender profiles which is not coherent with the pattern of age-gender profiles of the countries providing data per user. Indeed, the per capita profiles show a strongly increasing (exponential) shape. The methodology for running these projections requires expenditure per user (also called beneficiary or recipient).
Moreover, the age-gender expenditure profiles were adjusted to the total public expenditure in-kind provided according to SHA/ESSPROS. This is the same procedure as that followed in the case of health care projections. When the profile was explicitly calculated for the HC.3 part only, the HC.R.6.1 part was assumed to grow in line with GDP, not with the age profile.

70
8.1.2.1 Age-related expenditure profiles per beneficiary and per capita
Graph 22 displays the age-related expenditure profiles (as % of GDP per beneficiary) which have been used in the projection of long-term care expenditure. Graph 8 and Graph 9 in section 2.1 present the per capita profiles, for information.
Graph 22 – Age-gender expenditure profiles (per beneficiary), in EU-15 and EU-12
Source: 2012 AR. Note: The EU-27 average is a simple average, based upon the provided data sets only.
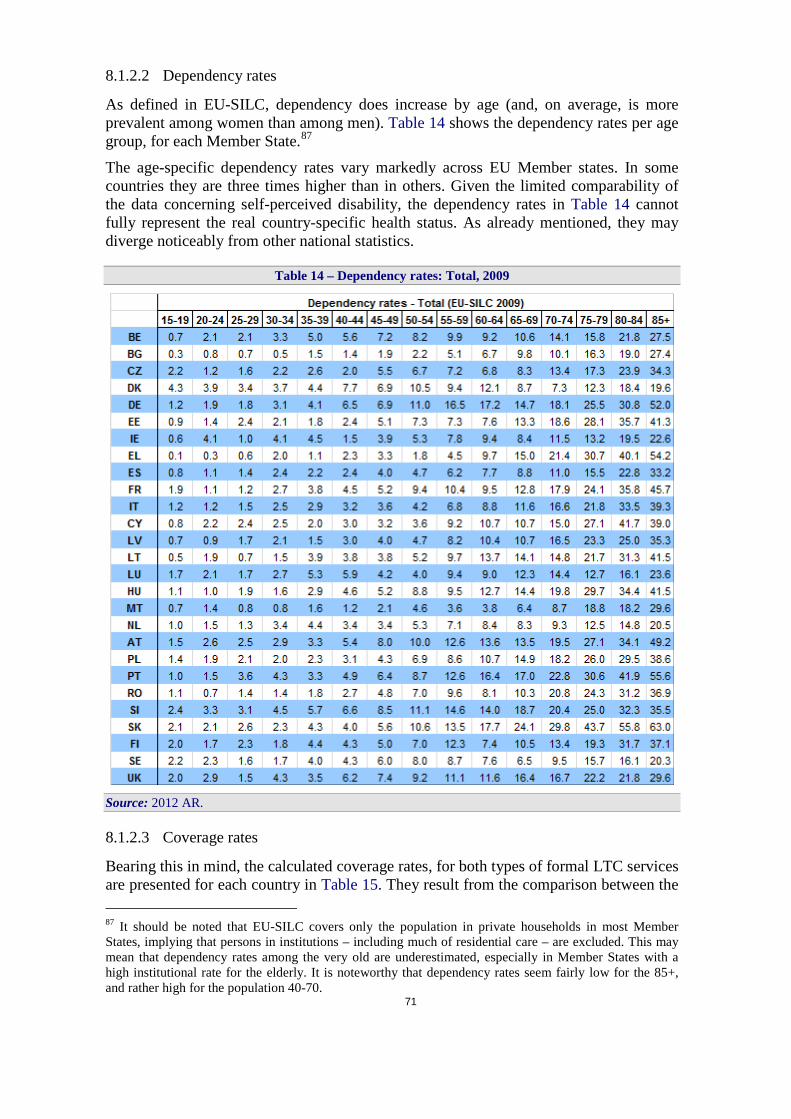
71
8.1.2.2 Dependency rates
As defined in EU-SILC, dependency does increase by age (and, on average, is more prevalent among women than among men). Table 14 shows the dependency rates per age group, for each Member State.87
The age-specific dependency rates vary markedly across EU Member states. In some countries they are three times higher than in others. Given the limited comparability of the data concerning self-perceived disability, the dependency rates in Table 14 cannot fully represent the real country-specific health status. As already mentioned, they may diverge noticeably from other national statistics.
Table 14 – Dependency rates: Total, 2009
Source: 2012 AR.
8.1.2.3 Coverage rates
Bearing this in mind, the calculated coverage rates, for both types of formal LTC services are presented for each country in Table 15. They result from the comparison between the 87 It should be noted that EU-SILC covers only the population in private households in most Member States, implying that persons in institutions – including much of residential care – are excluded. This may mean that dependency rates among the very old are underestimated, especially in Member States with a high institutional rate for the elderly. It is noteworthy that dependency rates seem fairly low for the 85+, and rather high for the population 40-70.
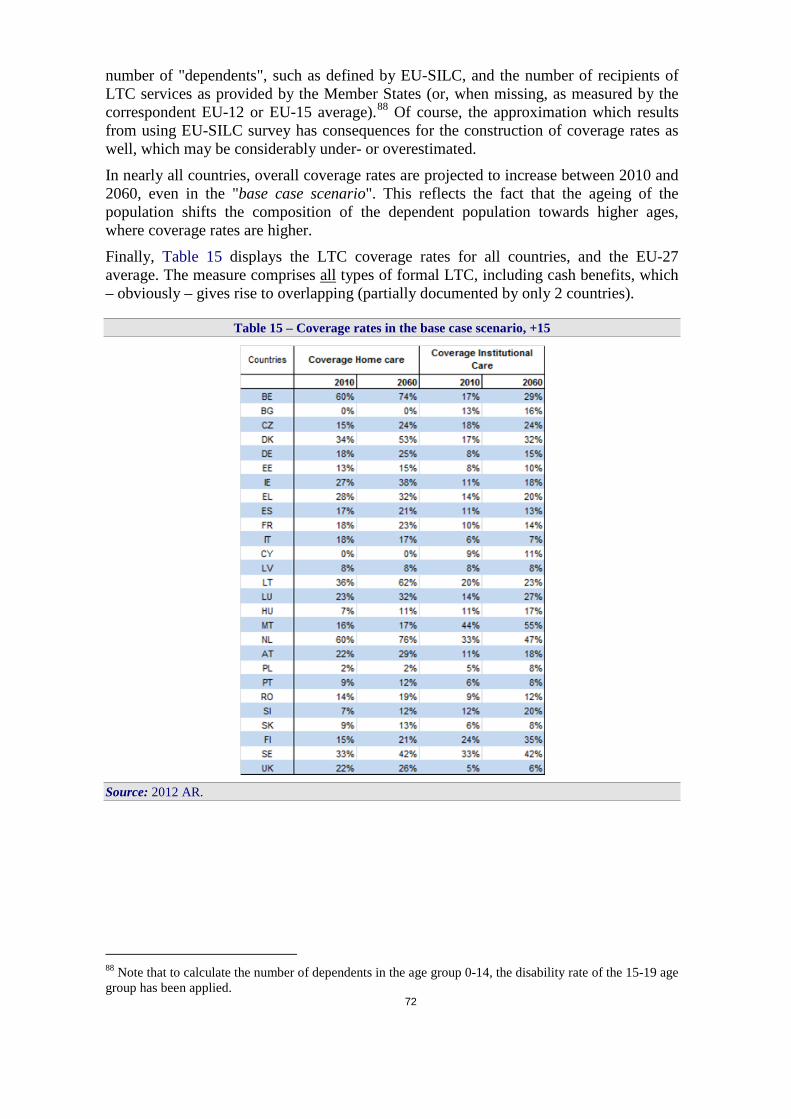
72
number of "dependents", such as defined by EU-SILC, and the number of recipients of LTC services as provided by the Member States (or, when missing, as measured by the correspondent EU-12 or EU-15 average).88 Of course, the approximation which results from using EU-SILC survey has consequences for the construction of coverage rates as well, which may be considerably under- or overestimated.
In nearly all countries, overall coverage rates are projected to increase between 2010 and 2060, even in the "base case scenario". This reflects the fact that the ageing of the population shifts the composition of the dependent population towards higher ages, where coverage rates are higher.
Finally, Table 15 displays the LTC coverage rates for all countries, and the EU-27 average. The measure comprises all types of formal LTC, including cash benefits, which – obviously – gives rise to overlapping (partially documented by only 2 countries).
Table 15 – Coverage rates in the base case scenario, +15
Source: 2012 AR.
88 Note that to calculate the number of dependents in the age group 0-14, the disability rate of the 15-19 age group has been applied.

Graph 23 – LTC coverage by age groups, EU-15 and EU-12
Source: Commission services (DG ECFIN), based on 2012 AR.

74
Graph 24 – LTC coverage (in-kind and cash benefits), 15+
Source: 2012 AR. Note: The EU-27 average is a simple average, based upon the provided data sets only.
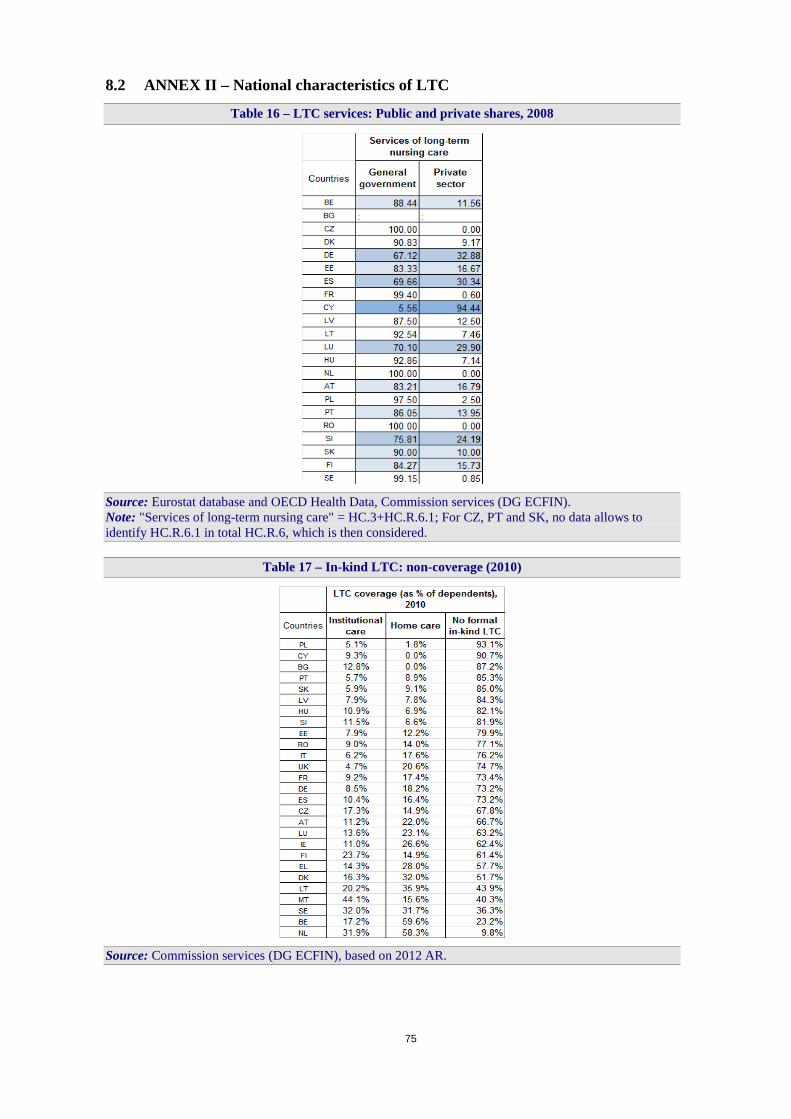
75
8.2 ANNEX II – National characteristics of LTC
Table 16 – LTC services: Public and private shares, 2008
Source: Eurostat database and OECD Health Data, Commission services (DG ECFIN). Note: "Services of long-term nursing care" = HC.3+HC.R.6.1; For CZ, PT and SK, no data allows to identify HC.R.6.1 in total HC.R.6, which is then considered.
Table 17 – In-kind LTC: non-coverage (2010)
Source: Commission services (DG ECFIN), based on 2012 AR.

Table 18 – Long-term care cash benefits in the EU Member States
Source: MISSOC database.

77
Table 19 – Requirements for being legally considered as "dependent", i.e. potential beneficiary of LTC services
Source: MISSOC database.
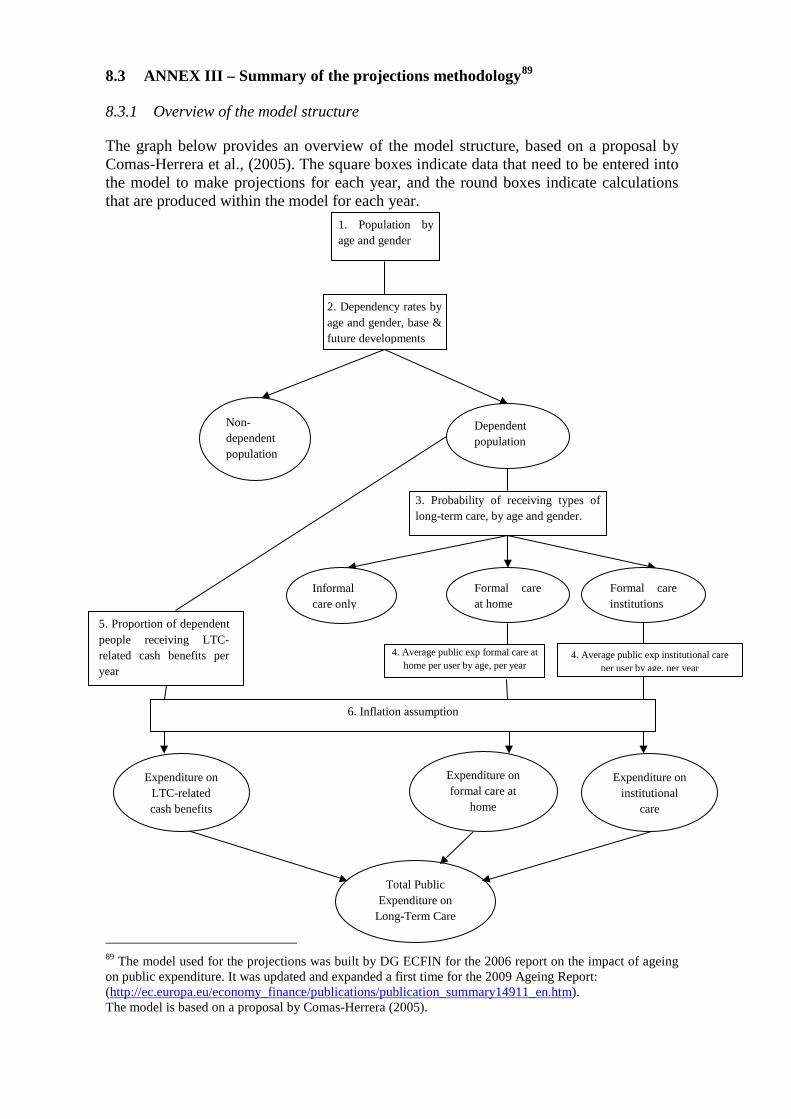
8.3 ANNEX III – Summary of the projections methodology89
8.3.1 Overview of the model structure
The graph below provides an overview of the model structure, based on a proposal by Comas-Herrera et al., (2005). The square boxes indicate data that need to be entered into the model to make projections for each year, and the round boxes indicate calculations that are produced within the model for each year.
89 The model used for the projections was built by DG ECFIN for the 2006 report on the impact of ageing on public expenditure. It was updated and expanded a first time for the 2009 Ageing Report: (http://ec.europa.eu/economy_finance/publications/publication_summary14911_en.htm). The model is based on a proposal by Comas-Herrera (2005).
1. Population by age and gender
2. Dependency rates by age and gender, base & future developments
Non-dependent population
Dependent population
3. Probability of receiving types of long-term care, by age and gender.
Informal care only
Formal care at home
Formal care institutions
4. Average public exp formal care at home per user by age, per year
4. Average public exp institutional care per user by age, per year
Expenditure on formal care at
home
Expenditure on institutional
care
Total Public Expenditure on
Long-Term Care
5. Proportion of dependent people receiving LTC-related cash benefits per year
6. Inflation assumption
Expenditure on LTC-related cash benefits

79
Step 1: taking the baseline population projection (by age and gender), a projection is made of the dependent population, who are assumed to need some form of long-term care service, and the non-dependent population who are assumed not to be in need of long-term care services. This is made by extrapolating age and gender-specific dependency ratios of a base year (estimated using existing indicators of disability from comparable sources) to the baseline population projection. More specifically, it refers to the concept of ADL-dependency which refers to difficulties in performing at least one Activity of Daily Living (ADL) (Katz et al., 1963).
Step 2 is to split, by age and gender, the dependent elderly population into three groups depending on the type of care they receive, namely (i) informal care, which is assumed to have no impact on public spending, (ii) formal care at home and (iii) formal care in institutions (both of which impact on public spending but their unit costs may differ). The model implicitly assumes that all those receiving home care or institutional care have difficulties with one or more ADLs, and that all persons deemed ADL-dependent either receive informal care, home care or institutional care. The split by type of care received is made by calculating the “probability of receiving different types of long-term care by age and gender”. This is calculated for a base year using data on the numbers of people with dependency (projected in step 1), and the numbers of people receiving formal care at home and in institutions (provided by Member States). It is assumed that the difference between the total number of dependent people and the total number of people receiving formal care (at home or in institutions) is the number of people who rely exclusively on informal care.
Step 3 involves the calculation of public spending for the two types of formal long-term care services, by multiplying the number of people receiving formal care (at home and in institutions) by the average age-specific public expenditure (respectively at home and in institutions) per year and per user. Average expenditure is calculated for a base year using data on total public expenditure in home care and institutional care and the numbers of people receiving formal care at home and in long-term care institutions (provided by Member States). Two assumptions are required:
1. it is implicitly assumed that current expenditure in services divided by the number of users equals the long-run unit costs of services;
2. it is assumed that average expenditure per user increases with the age of the user.90
Step 4: by adding up the expenditure on formal care at home and in institutions, total public expenditure on long-term care services ("in-kind benefits") is obtained. Public expenditure on cash benefits for people with ADL-dependency is then added to the expenditure on services, in order to obtain total public expenditure on long-term care. Note that expenditure on cash benefits is assumed to grow in line with the numbers of people with dependency (under the assumption of constant average cash benefit per beneficiary).
Overall, given the availability of a numerical measure of disability, the projection methodology described above is more precise than that used for health care expenditure
90 In practice, average expenditure (aged 65 and above), for each type of service, is decomposed into average expenditure by age groups, by assuming the same rate of increase in spending by age as in the age-related expenditure profile. It is important to note that the age-related expenditure profile provides information on spending in formal care by age, without distinction between care provided at home and in institutions. The model uses average public expenditure in formal care and in institutional care to project future expenditure in both types of services.
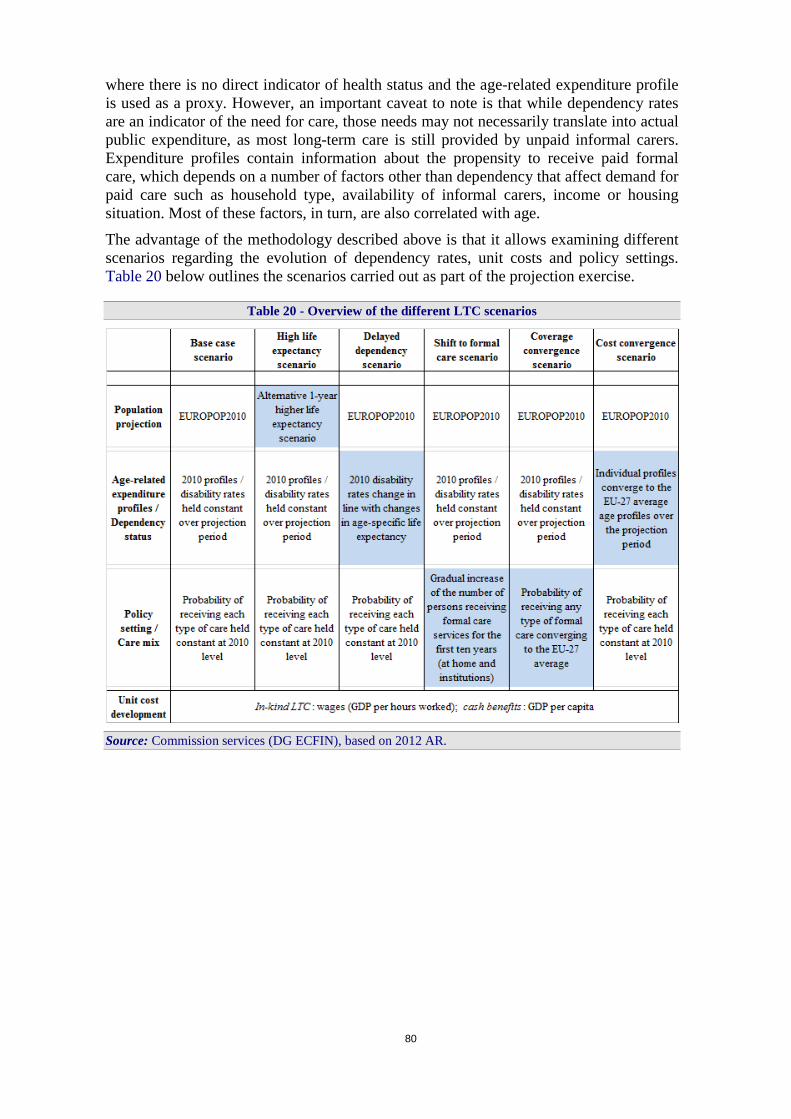
80
where there is no direct indicator of health status and the age-related expenditure profile is used as a proxy. However, an important caveat to note is that while dependency rates are an indicator of the need for care, those needs may not necessarily translate into actual public expenditure, as most long-term care is still provided by unpaid informal carers. Expenditure profiles contain information about the propensity to receive paid formal care, which depends on a number of factors other than dependency that affect demand for paid care such as household type, availability of informal carers, income or housing situation. Most of these factors, in turn, are also correlated with age.
The advantage of the methodology described above is that it allows examining different scenarios regarding the evolution of dependency rates, unit costs and policy settings. Table 20 below outlines the scenarios carried out as part of the projection exercise.
Table 20 - Overview of the different LTC scenarios
Source: Commission services (DG ECFIN), based on 2012 AR.
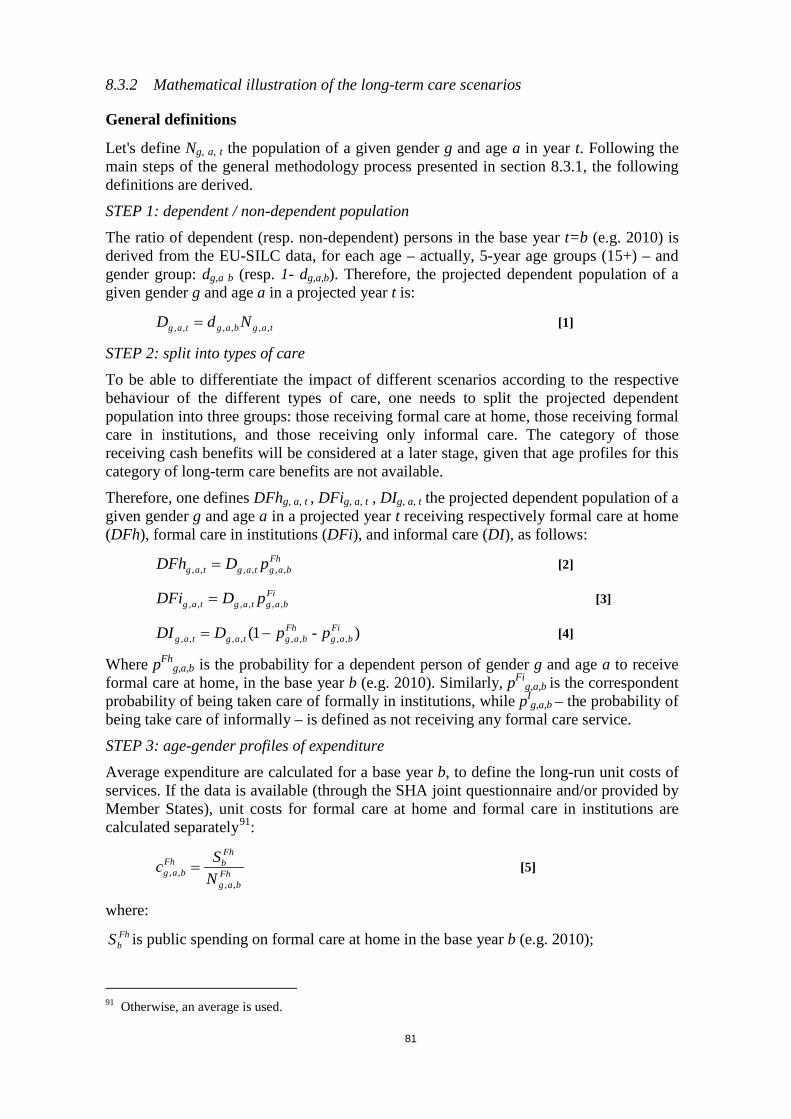
81
8.3.2 Mathematical illustration of the long-term care scenarios
General definitions
Let's define Ng, a, t the population of a given gender g and age a in year t. Following the main steps of the general methodology process presented in section 8.3.1, the following definitions are derived.
STEP 1: dependent / non-dependent population The ratio of dependent (resp. non-dependent) persons in the base year t=b (e.g. 2010) is derived from the EU-SILC data, for each age – actually, 5-year age groups (15+) – and gender group: dg,a b (resp. 1- dg,a,b). Therefore, the projected dependent population of a given gender g and age a in a projected year t is:
,,,,,, tagbagtag NdD = [1]
STEP 2: split into types of care To be able to differentiate the impact of different scenarios according to the respective behaviour of the different types of care, one needs to split the projected dependent population into three groups: those receiving formal care at home, those receiving formal care in institutions, and those receiving only informal care. The category of those receiving cash benefits will be considered at a later stage, given that age profiles for this category of long-term care benefits are not available.
Therefore, one defines DFhg, a, t , DFig, a, t , DIg, a, t the projected dependent population of a given gender g and age a in a projected year t receiving respectively formal care at home (DFh), formal care in institutions (DFi), and informal care (DI), as follows:
,,,,,,Fh
bagtagtag pDDFh = [2]
,,,,,,Fi
bagtagtag pDDFi = [3]
)- 1( ,,,,,,,,Fi
bagFh
bagtagtag ppDDI −= [4]
Where pFhg,a,b is the probability for a dependent person of gender g and age a to receive
formal care at home, in the base year b (e.g. 2010). Similarly, pFig,a,b is the correspondent
probability of being taken care of formally in institutions, while pIg,a,b – the probability of
being take care of informally – is defined as not receiving any formal care service.
STEP 3: age-gender profiles of expenditure Average expenditure are calculated for a base year b, to define the long-run unit costs of services. If the data is available (through the SHA joint questionnaire and/or provided by Member States), unit costs for formal care at home and formal care in institutions are calculated separately91:
,,
,, Fhbag
FhbFh
bag NSc = [5]
where: FhbS is public spending on formal care at home in the base year b (e.g. 2010);
91 Otherwise, an average is used.
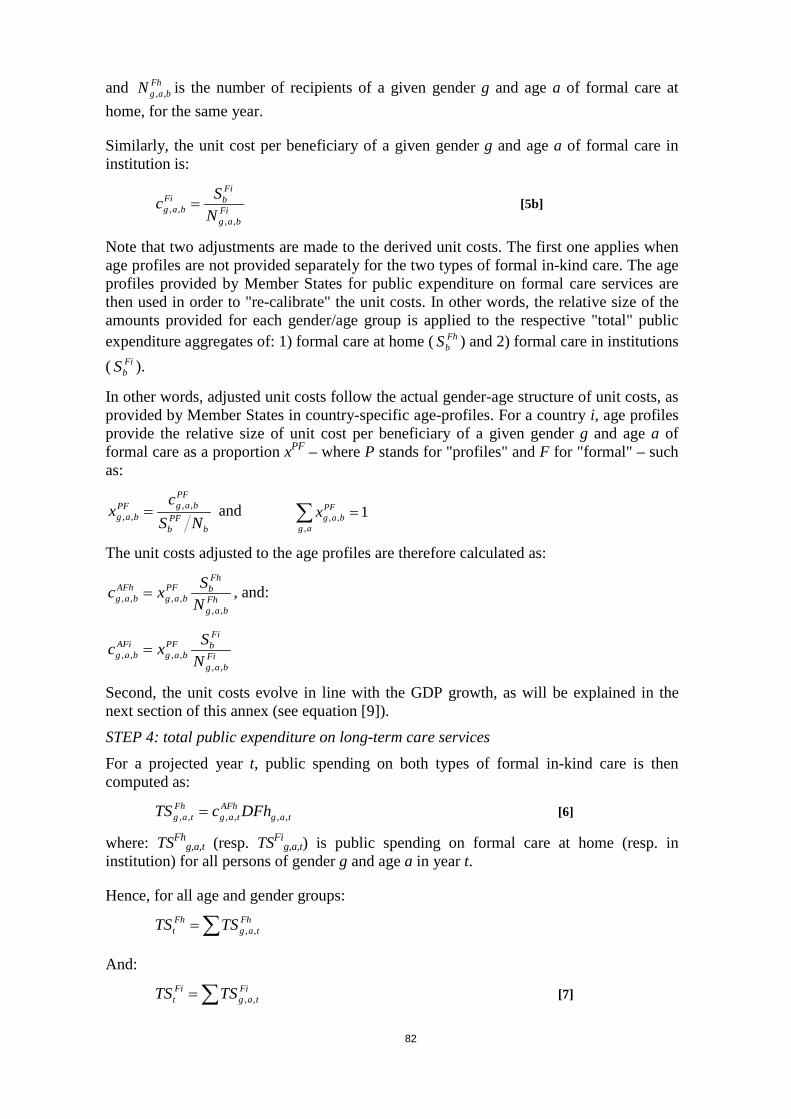
82
and FhbagN ,, is the number of recipients of a given gender g and age a of formal care at
home, for the same year.
Similarly, the unit cost per beneficiary of a given gender g and age a of formal care in institution is:
,,
,, Fibag
FibFi
bag NSc = [5b]
Note that two adjustments are made to the derived unit costs. The first one applies when age profiles are not provided separately for the two types of formal in-kind care. The age profiles provided by Member States for public expenditure on formal care services are then used in order to "re-calibrate" the unit costs. In other words, the relative size of the amounts provided for each gender/age group is applied to the respective "total" public expenditure aggregates of: 1) formal care at home ( Fh
bS ) and 2) formal care in institutions ( Fi
bS ).
In other words, adjusted unit costs follow the actual gender-age structure of unit costs, as provided by Member States in country-specific age-profiles. For a country i, age profiles provide the relative size of unit cost per beneficiary of a given gender g and age a of formal care as a proportion xPF – where P stands for "profiles" and F for "formal" – such as:
,,,,
bPFb
PFbagPF
bag NSc
x = and 1,
,, =∑ag
PFbagx
The unit costs adjusted to the age profiles are therefore calculated as:
Fhbag
FhbPF
bagAFh
bag NSxc
,,,,,, = , and:
Fibag
FibPF
bagAFi
bag NSxc
,,,,,, =
Second, the unit costs evolve in line with the GDP growth, as will be explained in the next section of this annex (see equation [9]). STEP 4: total public expenditure on long-term care services For a projected year t, public spending on both types of formal in-kind care is then computed as:
,,,,,, tagAFh
tagFh
tag DFhcTS = [6]
where: TSFhg,a,t (resp. TSFi
g,a,t) is public spending on formal care at home (resp. in institution) for all persons of gender g and age a in year t.
Hence, for all age and gender groups:
,,∑= Fhtag
Fht TSTS
And:
,,∑= Fitag
Fit TSTS [7]
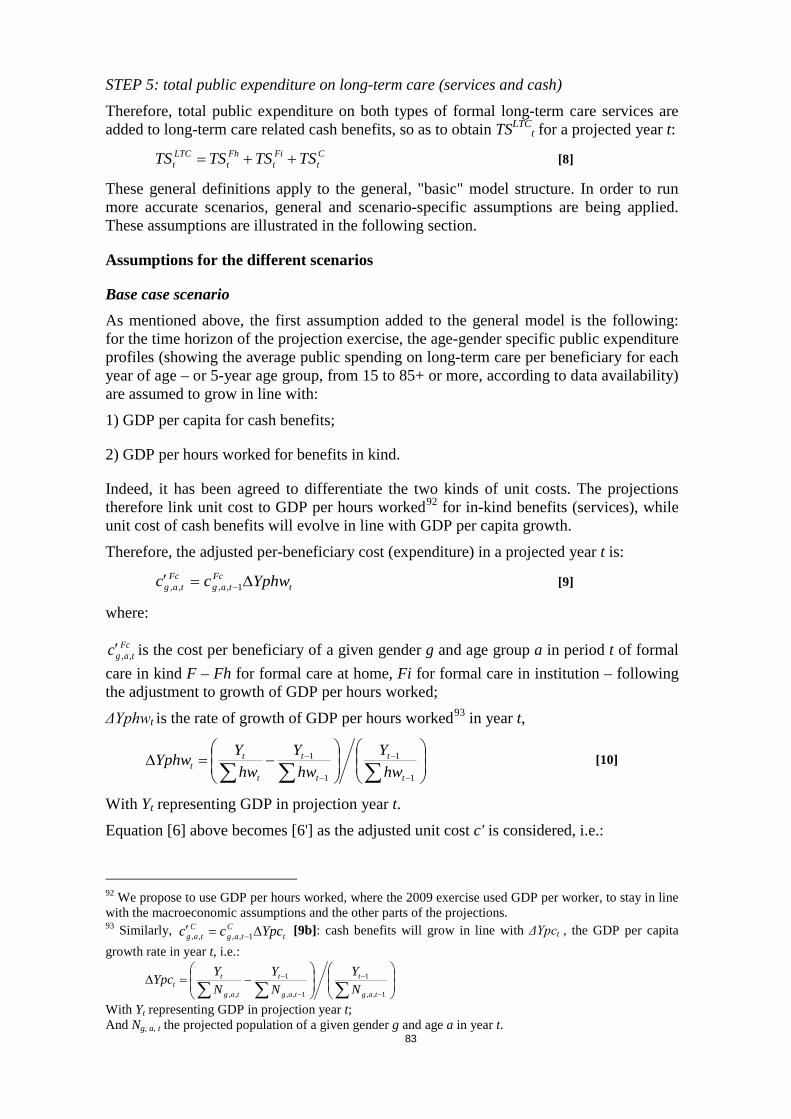
83
STEP 5: total public expenditure on long-term care (services and cash) Therefore, total public expenditure on both types of formal long-term care services are added to long-term care related cash benefits, so as to obtain TSLTC
t for a projected year t: Ct
Fit
Fht
LTCt TSTSTSTS ++= [8]
These general definitions apply to the general, "basic" model structure. In order to run more accurate scenarios, general and scenario-specific assumptions are being applied. These assumptions are illustrated in the following section.
Assumptions for the different scenarios
Base case scenario As mentioned above, the first assumption added to the general model is the following: for the time horizon of the projection exercise, the age-gender specific public expenditure profiles (showing the average public spending on long-term care per beneficiary for each year of age – or 5-year age group, from 15 to 85+ or more, according to data availability) are assumed to grow in line with:
1) GDP per capita for cash benefits;
2) GDP per hours worked for benefits in kind.
Indeed, it has been agreed to differentiate the two kinds of unit costs. The projections therefore link unit cost to GDP per hours worked92 for in-kind benefits (services), while unit cost of cash benefits will evolve in line with GDP per capita growth.
Therefore, the adjusted per-beneficiary cost (expenditure) in a projected year t is:
tFc
tagFc
tag Yphwcc ∆=′ −1,,,, [9]
where:
Fctagc ,,′ is the cost per beneficiary of a given gender g and age group a in period t of formal
care in kind F – Fh for formal care at home, Fi for formal care in institution – following the adjustment to growth of GDP per hours worked;
ΔYphwt is the rate of growth of GDP per hours worked93 in year t,
−=∆
∑∑∑ −
−
−
−
1
1
1
1
t
t
t
t
t
tt hw
Yhw
Yhw
YYphw [10]
With Yt representing GDP in projection year t. Equation [6] above becomes [6'] as the adjusted unit cost c' is considered, i.e.:
92 We propose to use GDP per hours worked, where the 2009 exercise used GDP per worker, to stay in line with the macroeconomic assumptions and the other parts of the projections. 93 Similarly, t
Ctag
Ctag Ypccc ∆=′ −1,,,, [9b]: cash benefits will grow in line with ΔYpct , the GDP per capita
growth rate in year t, i.e.:
−=∆
∑∑∑ −
−
−
−
1,,
1
1,,
1
,, tag
t
tag
t
tag
tt N
YNY
NYYpc
With Yt representing GDP in projection year t; And Ng, a, t the projected population of a given gender g and age a in year t.
84
,,,,,, tagFh
tagFh
tag DFhcST ′=′ [6']
And of course, for formal care in institution:
,,,,,, tagFi
tagFi
tag DFicST ′=′ [6b']
Similarly for cash benefits, total public spending becomes CtST ′ . Equations [6'] and [6'b]
are then used and coupled with CtST ′ to calculate total age/gender group expenditure and
total public expenditure on long term care in each projection year. An adapted equation [8] gives adjusted total public spending on long-term care, i.e.:
Ct
Fit
Fht
LTCt TSTSTSTS ' ''' ++= [8']
High life expectancy scenario The "high life expectancy scenario" presents the budgetary effects of an alternative demographic scenario which assumes life expectancy to be higher for all ages than in the base case scenario. In terms of methodology, the scenario does not differ from the "base case scenario", apart from the fact that the baseline demographic projections used as input data are replaced with the alternative, high life expectancy, variant (the same used to assess the sensitivity of pension spending). Therefore, the mathematical illustration of the previous scenario only changes in Ng, a, t, i.e. the number of individuals in each age/gender group up to 2060 (replaced by the new population assumptions in equation [1] and in GDP per capita growth rate).
Delayed dependency scenario This scenario reflects an alternative assumption about trends in age-specific ADL-dependency rates. The profile of age-specific disability rates shifts in line with changes in life expectancy (disability rate in the future is equal to that of a younger - by the same number of years as the change in age-specific life expectancy - age cohort today), resulting in a gradual decrease over time in disability prevalence for each age cohort, i.e. affecting the variable Dg, a, t. It starts by calculating, for each projection year, the change in life expectancy in relation to the base year. For example, life expectancy for a 50-year-old man is expected to increase by, say, 4 years: from 30 years in year t to 34 years in year t+20 in a specific Member State. Then, the scenario assumes that in t+20, in that same Member State, a 50-year-old man will have a disability prevalence of a (50-4) = 46-year old man in year t. Hence, the change in life expectancy of a person of gender g and age a in relation to the base year b (say, 2010) is first calculated for each year of the projections, using the Eurostat population projections (EUROPOP2010)94:
bagtagbtag LELELE ,,,,,,, −=∆
where:
94 In the "constant disability scenario" the total number of years spent with disability during a person’s life time is assumed to remain the same while life expectancy increases. Thus, if between time t and t+1, total life expectancy increases by n years for a cohort of age a, "disability-free" life expectancy for that very same age cohort must also increase by n years in order for the dynamic equilibrium hypothesis to be valid. If "disability-free" life expectancy increases by n years, then the disability prevalence of this cohort of age a at time t+1 will be the same as the disability prevalence of cohort of age a-n at time t.
85
ΔLEg,a,t,b is the additional life expectancy of a person of gender g and age a in year t compared to a person of gender g and age a in the base year b,
LEg,a,t is the life expectancy of a person of gender g and age a in year t and
LEg,a,b is life expectancy of an average person of gender g and age a in the base year b. For year t of the projections, the "adjusted" disability prevalence for the cohort of gender g and age a is then based on equation [1] adjusted such as:
,,,,, ,,, tagLEagtag NdDbtag∆−=′ [1']
And the adjusted projected dependent population D'g, a, t will therefore replace former Dg,
a, t in the subsequent equations [2] to [4], and then [9] and [8'], to follow the subsequent steps of the "base case scenario".
Scenario assessing the effect of a shift from informal to formal care Building on the "base case scenario", this policy-change scenario is a sensitivity test that examines the budgetary impact of a progressive shift into the formal sector of care of 1% per year of disabled elderly who have so far received only informal care. This extra shift takes place during the first ten years of the projection period, thus it sums up to about 9.6% shift from informal to formal care. It is further assumed that 50% of the "new" beneficiaries will be considered to move into institutional care, while the other 50% will be assumed to receive formal care at home. The variables DFhg, a, t , DFig, a, t , and DIg, a, t will be adjusted to the new assumptions.
The projected dependent population of a given gender g and age a in a projected year t receiving respectively formal care at home (DFh), formal care in institutions (DFi), and informal care (DI), calculated in equations [2] to [4], will be changed as follows. For t ∈ [b+1, b+10] – let's say, for the first ten years of the projection period, i.e. 2011-2020:
1,,1,,1,,,, 9.01.0 −−− ×=×−=′ tagtagtagtag DIDIDIID
1.05.0 1,,1,,,, −− ××+=′ tagtagtag DIDFhhDF
1.05.0 1,,1,,,, −− ××+=′ tagtagtag DIDFiiDF
These adapted projected numbers of dependents / recipients of formal care are then injected in equations [6'], [6b'] and [8'] to calculate the total public spending on long-term care, as it was done in the "base case scenario". For the rest of the projection period – 2021-2060 – the baseline equations are used as above.
Coverage convergence scenario This policy-change scenario assumes an expansion of publicly-financed formal care provision into the groups of population that have not been covered by the public programmes so far. "Formal coverage" covers any of the three types of formal long-term care: institutional care, formal home care, and cash benefits. In order to illustrate this scenario, a "new" probability of being "formally taken care of" through cash benefits, i.e. pC
g,a,b , has to be introduced. Alternatively, the number of persons receiving long-term care related cash benefits is available.95 The assumption is that all recipients of long-term care are dependent. It means that the equations [2] to [4] become four equations, with probabilities now changing over time, i.e. depending on t, but also country-specific (for a
95 When provided by Member States. The issue of double counting is taken care of as much as possible given the availability of detailed data.
86
country i). Further, DIg, a, t, i the projected dependent population of a given gender g and age group a in a projected year t receiving informal care (DI) is simply "converted" into DNF
g, a, t, i:, i.e. the probability of not being covered by formal long-term care coverage.
,,,,,,,,,Fh
itagitagitag pDDFh = [11]
,,,,,,,,,Fi
itagitagitag pDDFi =
,,,,,,,,,C
itagitagitag pDDC =
)1( ,,,,,,,,,F
itagitagF
itag pDDN −=
where:
DCg,a,t,i is the projected dependent population of a given gender g and age group a in a projected year t receiving cash benefits;
Fitagp ,,, is the probability of receiving any type of formal care, defined as:
Citag
Fiitag
Fhitag
Fitag pppp ,,,,,,,,,,,, ++=
The scenario envisaged is a coverage convergence to the EU-27 average. It is meant to take into account the high diversity of country-specific current care-mix. The Member States where the formal coverage rate is below the EU-27 average in the starting year are assumed to converge to this average by 2060.
The "base case scenario" steps are used for the countries whose formal coverage (i.e. pF
g,a,t,i ) is the same or greater than the EU-27 average FEUagp 27,2010,, in the base year b
(2010). For those countries whose formal coverage is below the EU-27 average, pFg,a,t,i is
assumed to converge to FEUagp 27,2060,, . It therefore implies that each type of formal care
converges at a different pace, making up for the respective relative gaps to the EU-27 average. This scenario allows a country to grow faster the relatively less-developed type of formal care.
Cost convergence to EU-27 average scenario This new scenario is run in parallel with the analogous scenario on health care expenditure projections. The "cost convergence scenario" is meant to capture the possible effect of a convergence in real living standards on long-term care spending. It assumes an upward convergence of the relative age-gender specific per beneficiary expenditure profiles (as percent of GDP per capita) of all countries below the corresponding EU-27 average to the EU-27 average. This is done for each type of formal care coverage (i.e. formal care in institutions, formal care at home, cash benefits).
The scenario builds on the methodology used for the "base case scenario". For those countries whose per beneficiary costs are equal to or above the EU-27 average the steps illustrated above are followed.
For those countries below the EU-27 average per-beneficiary cost in the baseline year b (2010) a further change in the way cost per beneficiary is evolving over the projection period is assumed, so as to reach the EU-27 average of per-beneficiary cost. Building on the equations [9b] – for cash benefits – and [9] – for in-kind benefits – the real convergence to EU-27 average is assumed to follow the adjusted equations:
( )ititC
itagC
itag gYpccc ,,,1,,,,, +∆=′ − [alt.9b]

87
( )ititAF
itagF
itag gYphwcc ,,,1,,,,, +∆=′′ − [alt.9]
where:
Fitagc ,,,′′ is the country i-specific cost of in-kind benefits per beneficiary of a given gender g
and age a in period t – Fh for formal care at home, Fi for formal care in institution – adjusted to the GDP per hours worked growth and a catch-up effect if country i is below the EU-27 average;
ΔYphwt,i is GDP per hours worked growth rate in year t, for country i and
gt,i is a hypothetical rate of growth of per-beneficiary cost. It is higher than zero for countries whose per-beneficiary cost is below the EU-27 average and equal to zero for those countries whose per-beneficiary cost is equal or above the EU-27 average. If the base year b is 2010, it evolves according to the following mechanism96:
120102060
1
2010,,,
2010,27,,, −
=
−
iag
EUagit rc
rcg [12]
where:
2010,27,, EUagrc is the weighted EU-27 average relative cost per beneficiary of gender g and age a calculated in the baseline year of 2010 and
2010,,, iagrc is the relative cost per beneficiary of gender g and age a for country i (if below the EU-27 average cost per beneficiary) calculated in the baseline year of 2010 defined as:
′′=
2010,,,
2010,,,2010,,,
iag
iagiag Yphw
crc
and
=
2010,27,,
2010,27,,2010,27,,
EUag
EUagEUag
Yphwcrc
where:
2010,27,, EUagc is the weighted EU-27 average cost per beneficiary of gender g and age a calculated in the baseline year (2010); and
2010,27,, EUagYphw is the average GDP per hours worked in the EU-27 calculated in the baseline year (2010).
The same type of reasoning can be run with the corresponding equations for cash benefits, adjusted to GDP per capita growth instead of GDP per hours worked growth.
The after country-specific per beneficiary cost has been calculated, subsequent corresponding equations are used to obtain total age-gender group expenditure and then total public expenditure on long-term care in each projection year, as in equation [8'].
------------------------ 96 Assumptions for different convergence paths according to the initial country-specific situation – comparing to the EU-27 average age profile – could be explored further when data is made available.

KC-AI-12-469-EN-N