Embed Size (px)
Citation preview

Dmitri Romanov and Yury Gubman
Israeli Central Bureau of Statistics

Introduction
We study measurement error in labor income reported in the
Israeli Social Survey with the administrative records obtained
from the National Tax Authority.
We analyze factors that may explain the disparities between the
two sources in reported income, by distinguishing wage-
earners and the self-employed persons.

Outline
Measurement error in income data
Estimation of measurement error
Data
Estimation results
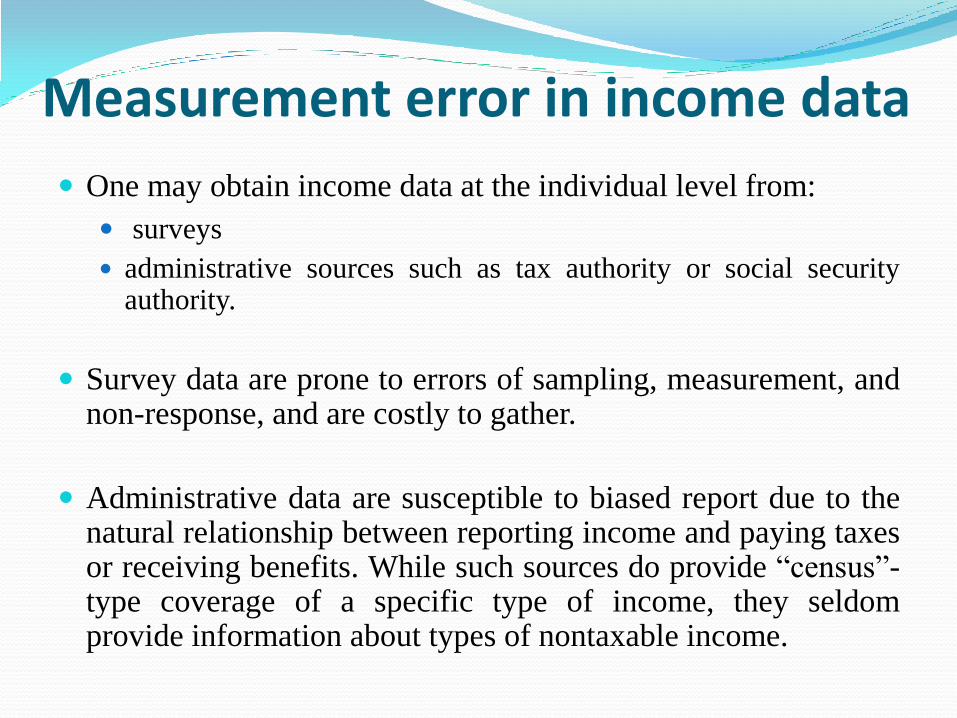
Measurement error in income data
One may obtain income data at the individual level from:
surveys
administrative sources such as tax authority or social security authority.
Survey data are prone to errors of sampling, measurement, and non-response, and are costly to gather.
Administrative data are susceptible to biased report due to the natural relationship between reporting income and paying taxes or receiving benefits. While such sources do provide “census”-type coverage of a specific type of income, they seldom provide information about types of nontaxable income.
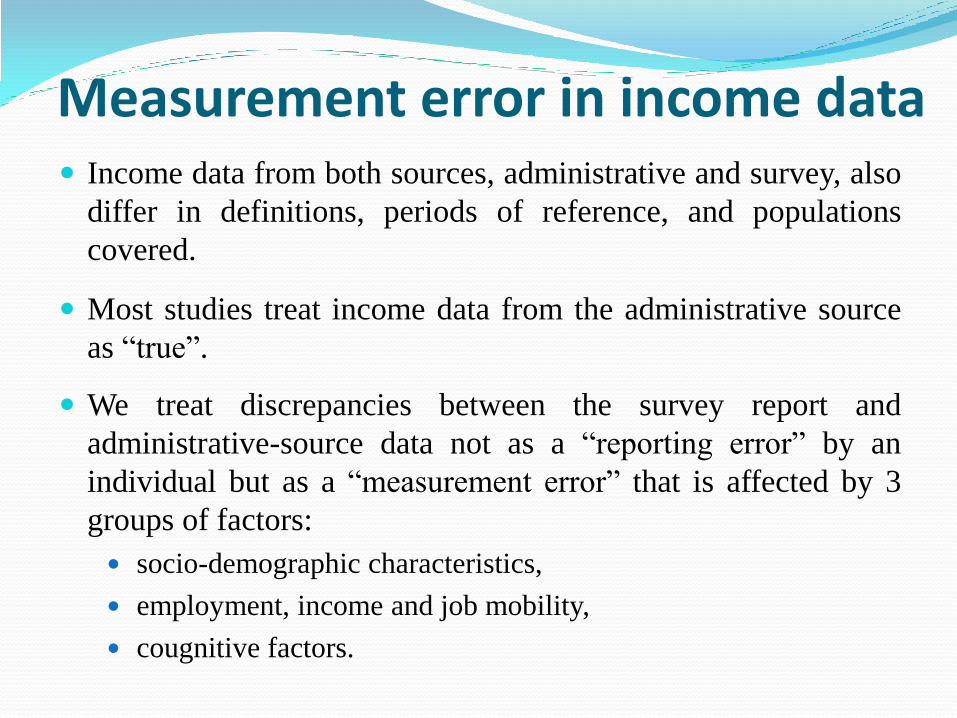
Measurement error in income data Income data from both sources, administrative and survey, also
differ in definitions, periods of reference, and populations
covered.
Most studies treat income data from the administrative source
as “true”.
We treat discrepancies between the survey report and
administrative-source data not as a “reporting error” by an
individual but as a “measurement error” that is affected by 3
groups of factors:
socio-demographic characteristics,
employment, income and job mobility,
cougnitive factors.

Administrative and survey data: "Regression to the mean"
The orange line is the mean of the responses in the survey that were given by the same
individuals who were placed within this band in accordance with their income as
shown in the administrative source.
The blue line denotes income from the administrative source within the survey
categories.

Estimation of measurement error Let F represent the distribution of income from the administrative
source (as a continuous variable) across the population of survey
respondents.
For each labor-income category specified in the survey, an
estimator of the expected income from the administrative file that
would been reported (without error) in the same band according to
distribution F, will be:
- the predicted value of gross administrative income of
individual i from all jobs, calculated on the basis of estimated
distribution in income category Gk as defined in the survey,
nk- the number of individuals in group k.
kGi
ik
F
k ynˆ 1
iy
F

Estimation of measurement error
To find an estimator for distribution F, we fitted several known
parametric distributions to the continuous administrative data
of the survey respondents’ gross income (using maximum
likelihood method). The best fit was obtained for the skew-t
distribution (Azzalini and Capitanio, 2003).
Under the assumption , we may calculate the
measurement error of individual i (in %):
Fyiˆ~
100*)Gi(I*)ˆ
yˆ(e kF
k
i
F
k
i

Data – Social Survey The study is based on data from the Social Survey (2008),
performed each year in Israel by the Central Bureau of
Statistics. In 2008, the topic of job mobility was examined at
length in the survey.
The survey participants were asked about their history in the
labor market, the components of their wages, their fringe
benefits, and their attitudes toward and expectations about their
present and future status as employees/self-employed.
Survey non-response rate was 18%, item nonresponse for the gross income question was 8.3%.

Data – Income question
The gross income question was asked after employment was
investigated and labor status was defined. The question related
to the gross income from all places of work in the last month.
To answer the gross income question, the respondent was asked
by the interviewer to avail him/herself of a card on which 10
bands. As a result, categorical income variable was obtained
("1" – up to 2,000 NIS, "10" – more then 21,000 NIS).
The gross income question was immediately followed by one
about net income. The question was added to the survey in
2007 as a tool with which respondents could control the
distinction between gross income and net income by
themselves.

Measurement error in gross income data
Respondent
group
Pct. of
negative
errors
Pct. of no
error
Pct. of
positive
errors
Mean of
negative
errors
Mean of
positive
errors
Full sample 42.1 39.6 18.3 -64.3 38.6
Employees 44.6 40.4 15.0 -61.6 33.7
Self-employed 24.0 33.8 42.2 -101.8 51.2
The final database comprised records of 408 self-employed (12%) and 3,009 employees (88%).
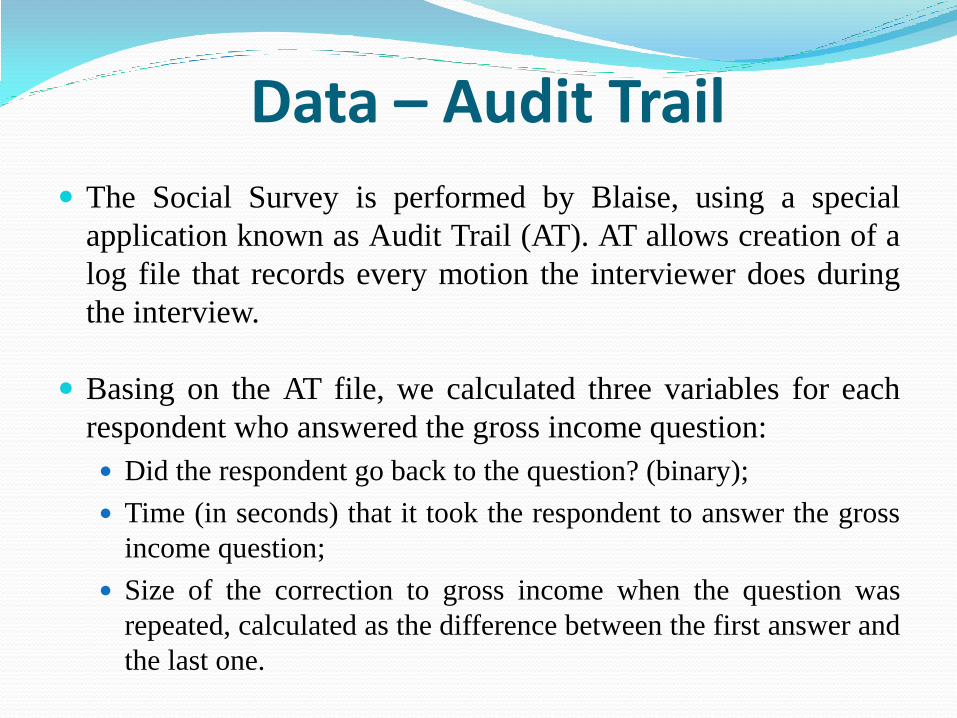
Data – Audit Trail
The Social Survey is performed by Blaise, using a special
application known as Audit Trail (AT). AT allows creation of a
log file that records every motion the interviewer does during
the interview.
Basing on the AT file, we calculated three variables for each
respondent who answered the gross income question:
Did the respondent go back to the question? (binary);
Time (in seconds) that it took the respondent to answer the gross
income question;
Size of the correction to gross income when the question was
repeated, calculated as the difference between the first answer and
the last one.

Response to Gross Income Question - Audit Trail Variables
Variable
Employees Self-employed
Mean Standard
Deviation
Mean Standard
Deviation
Time spent responding to
item (seconds) 21.8 17.6 27.7 22.3
Frequency of going back
to correct gross income
after net income question
0.23 0.42 0.22 0.42
Size of correction to
response among
respondents who made
such correction (number
of income bands)
0.50 1.69 0.49 2.27

Econometric Model To identify the contribution of the factors that affect the measurement
errors and estimate the intensity of their effect, we estimate the following
model:
e - measurement error;
X - set of individual’s background variables ;
L - set of variables representing the individual’s employment and wage terms and variables of h/her subjective assessment of job mobility;
AT - set of Audit Trail variables, constructed in the manner described above;
WB - well-being variables associated with the individual’s economic situation: satisfaction with work, with income, and with household’s economic situation;
ε - vector of residuals.
The model was estimated using Weighted OLS with the final weights of
the 2008 Social Survey.
We present the effects that was found to be significant in at least one of
the models for given sub-population are not presented.
WBATLXe

Estimation Results for Employees All observations Positive error Negative error
Intercept -21.94(9.97)*** 185.04(10.51)*** 232.90(46.58)*** (Ln of) income from administrative file -6.20(0.75)*** -21.03(1.21)*** -46.48(6.02)*** Correction of response about gross income
during interview -10.15(3.49)*** -0.99(1.97) -20.91(6.36)*** Size of response correction 2.36(0.87)*** 0.63(0.49) 5.75(1.58)***
⁞ Part-time main job 13.87(6.35)** -2.27(3.67) 27.97(10.77)*** Worked more hours 0.23(2.98) 3.62(1.72)** -1.83(5.27) Worked fewer hours 8.79(4.79)* -0.64(2.92) 10.12(8.57) Received a wage raise 6.54(2.93)** -2.22(1.66) 10.78(5.19)** Received a wage cut -12.31(6.29)** -2.65(3.79) -10.86(10.54) Has not been promoted -42.96(9.49)*** -10.52(5.52)* -67.96(15.60)*** Receives full pay for sick days 0.15(2.91) 3.40(1.64)** 2.76(5.21) Employer participates in pension insurance -2.68(3.78) -2.42(1.79) 21.05(7.54)*** Employer participates in advanced-training fund -16.56(3.20)*** 6.43(1.92)*** -2.67(5.84) Participates in profit-sharing with employer -3.27(4.16) 6.81(2.84)** -6.59(7.48) Has company car -0.35(3.88) 7.62(2.48)*** -0.27(7.56) Receives reimbursement of transportation
expenses 2.96(3.47) 5.42(2.32)** 11.10(6.22)* N 2403 344 1107 Adjusted R-square 0.07 0.57 0.09
Significance level: ***<0.01, **<0.05, *<0.10.
Standard deviations are presented in brackets

Estimation Results for Self-Employed
Significance level: ***<0.01, **<0.05, *<0.10.
Standard deviations are presented in brackets
All observations Positive error Negative error
Intercept -6.21(30.10) 144.04(15.08)*** -20.82(320.65)
(Ln of) income from
administrative file -4.20(1.82)** -13.62(1.71)*** -12.03(33.66)
Academic education, B.A. 16.87(13.62) 8.12(3.67)** 59.93(49.80)
Satisfied with job -7.75(7.93) 7.29(2.19)*** -32.07(26.82)
Satisfied with labor income 23.78(7.80)*** 1.53(2.20) 50.25(26.99)***
Household’s standard of living
has fallen 10.39(16.63) 8.51(4.74)* -17.61(53.64)
Expects business turnover to
increase -0.37(13.25) -10.60(3.70)*** 10.41(44.45)
Expects business to make
progress -5.97(11.37) -8.97(3.04)*** -8.00 (41.12)
N 369 156 86
Adjusted R-square 0.02 0.34 0.02

Conclusions
1. Regression to the mean occurs in the income reported in the
survey as against that obtained from the administrative
source. Positive measurement errors were more common
among low-income respondents and negative measurement
errors were more common among those of high income.
2. Consequently, the indicators of inequality based on income
reported in the survey were lower than when measured on the
basis of the same individuals’ income in the administrative
file: Gini index values of 0.4267 as against 0.4746.

Conclusions (cont.)
3. Analyzing the response process using Audit Trail variables,
we found 22% of the respondents went back and checked
the accuracy of their responses to the gross income question,
mostly due to the following net income question. Generally,
this self-correction reduced the error in the final answer.
4. The response time to the gross income question was longer
among the self-employed than among employees.
5. Employees and self-employed should not be pooled into one
model due to differences in the conceptual definition of
income and how income is measured and reported.


![HMIs and Industrial PCs [PDF, 3.67 MB]](https://img.pdfslide.us/doc/110x75/586b6ade1a28abb7768bd293/hmis-and-industrial-pcs-pdf-367-mb.jpg)