Embed Size (px)
Citation preview
STATE OF ISRAEL MINISTRY OF FINANCE
International Affairs Department
ECONOMIC HIGHLIGHTS July 2011, 2nd Quarter 2011
Click to start
Contents
Economic Figures
Balances
International Comparisons
Israel and the OECD
International Agreements
Relevant Sites
Note:
You can return to the beginning
of each chapter by clicking the
emblem of Israel on the top of
each slide.
Contact Us
Economic Figures
GDP and Business GDP
Major GDP Components
Growth: Israel compared to the World
Exports of Goods and Services
Foreign Investments
Unemployment & Participation Rates
Inflation Rate
Growth of Main GDP Components 2008
Main Economic Indicators
Main Trading Partners
Inflation Rate Worldwide
BACK TO CONTENTS
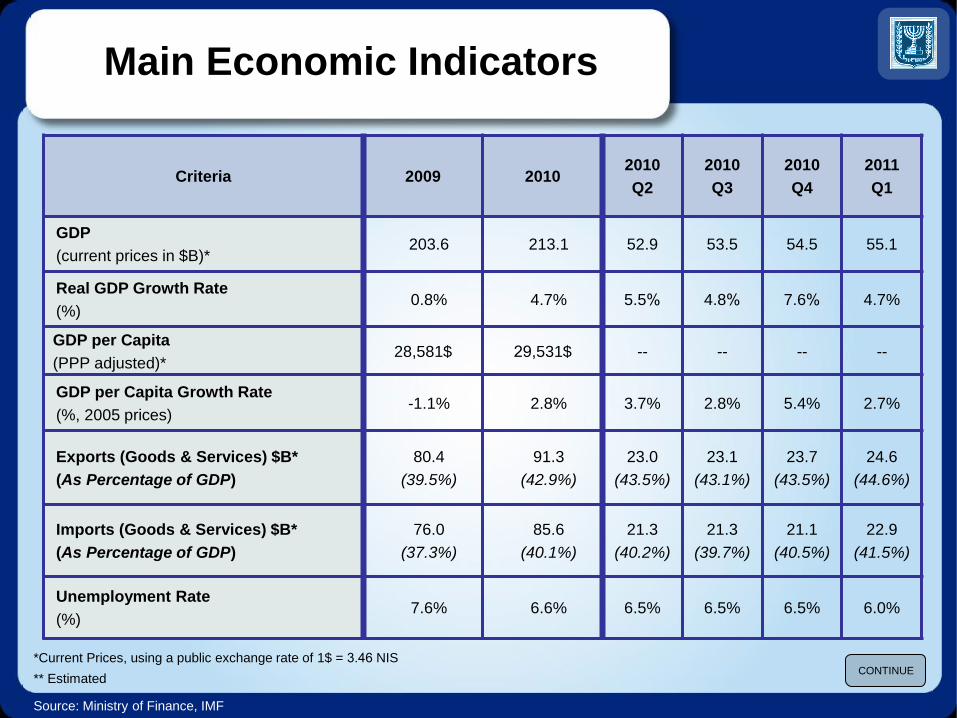
*Current Prices, using a public exchange rate of 1$ = 3.46 NIS
** Estimated
Main Economic Indicators
2011
Q1
2010
Q4
2010
Q3
2010
Q2 2010 2009 Criteria
55.1 54.5 53.5 52.9 213.1 203.6 GDP
(current prices in $B)*
4.7% 7.6% 4.8% 5.5% 4.7% 0.8% Real GDP Growth Rate
(%)
-- -- -- -- 29,531$ 28,581$ GDP per Capita
(PPP adjusted)*
2.7% 5.4% 2.8% 3.7% 2.8% -1.1% GDP per Capita Growth Rate
(%, 2005 prices)
24.6
(44.6%)
23.7
(43.5%)
23.1
(43.1%)
23.0
(43.5%)
91.3
(42.9%)
80.4
(39.5%)
Exports (Goods & Services) $B*
(As Percentage of GDP)
22.9
(41.5%)
21.1
(40.5%)
21.3
(39.7%)
21.3
(40.2%)
85.6
(40.1%)
76.0
(37.3%)
Imports (Goods & Services) $B*
(As Percentage of GDP)
6.0% 6.5% 6.5% 6.5% 6.6% 7.6% Unemployment Rate
(%)
Source: Ministry of Finance, IMF
CONTINUE
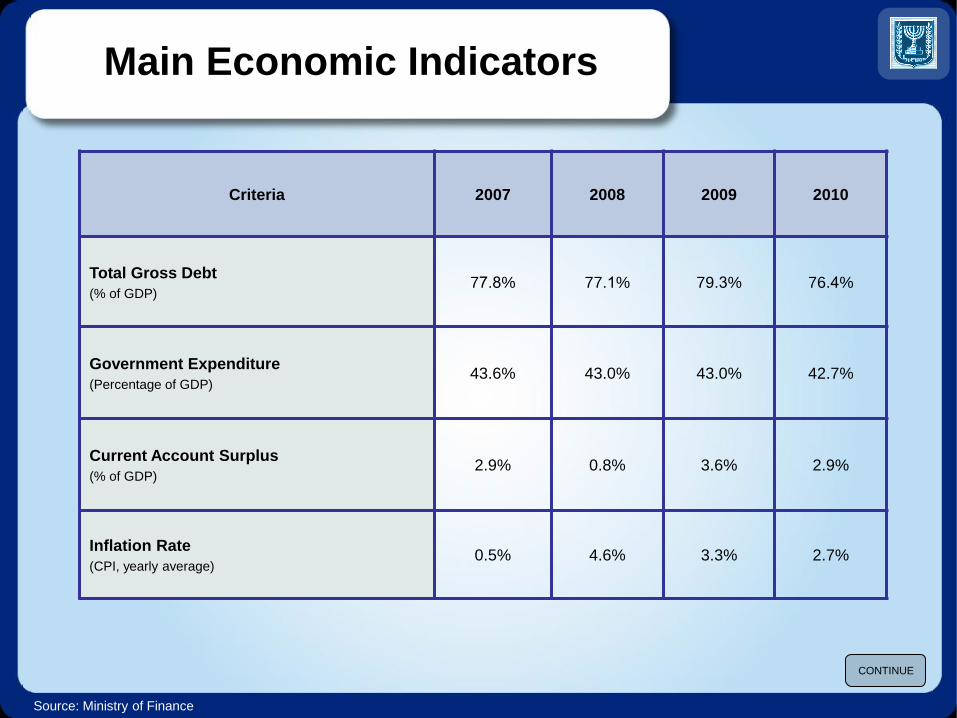
Source: Ministry of Finance
2010 2009 2008 2007 Criteria
76.4% 79.3% 77.1% 77.8% Total Gross Debt
(% of GDP)
42.7% 43.0% 43.0% 43.6% Government Expenditure
(Percentage of GDP)
2.9% 3.6% 0.8% 2.9% Current Account Surplus
(% of GDP)
2.7% 3.3% 4.6% 0.5% Inflation Rate
(CPI, yearly average)
CONTINUE
Main Economic Indicators
Source: Ministry of Finance
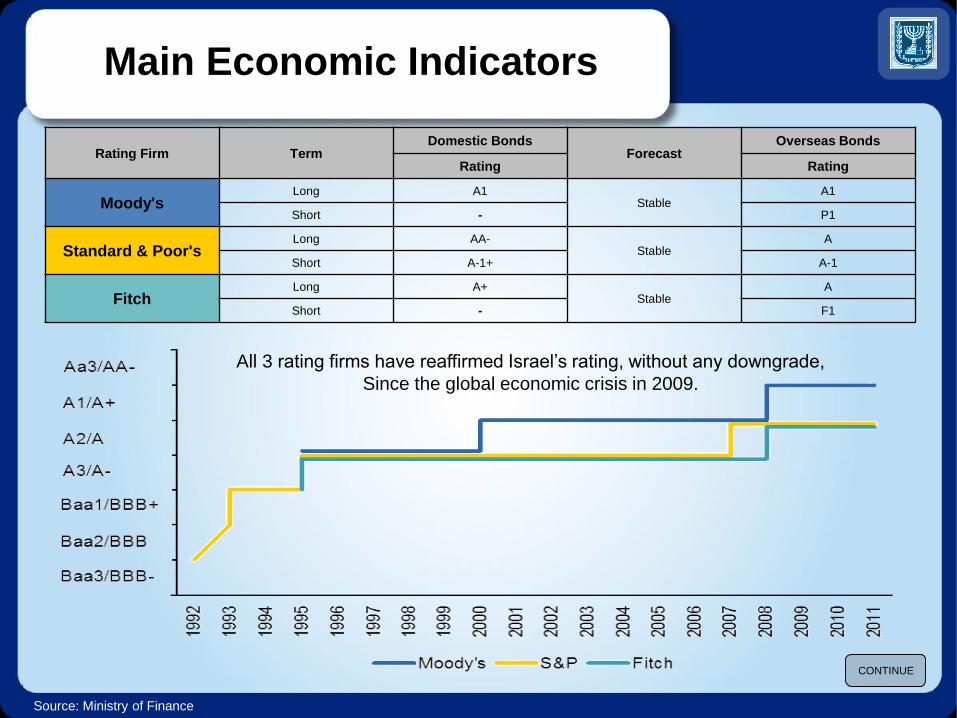
Overseas Bonds Forecast
Domestic Bonds Term Rating Firm
Rating Rating
A1 Stable
A1 Long Moody's
P1 - Short
A Stable
AA- Long Standard & Poor's
A-1 A-1+ Short
A Stable
A+ Long Fitch
F1 - Short
Main Economic Indicators
CONTINUE
All 3 rating firms have reaffirmed Israel’s rating, without any downgrade,
Since the global economic crisis in 2009.
4.7%
7.6%
4.8%5.5%
5.7%5.4%
4.2%
0.8%
4.6%
5.8%
8.7%
6.7%
5.1%5.4%
0.2%
4.7%
6.0%
7.0%
-2%
-1%
0%
1%
2%
3%
4%
5%
6%
7%
8%
9%
10%
2006 2007 2008 2009 2010 2010 Q2 2010 Q3 2010 Q4 2011 Q1
GDP Business GDP
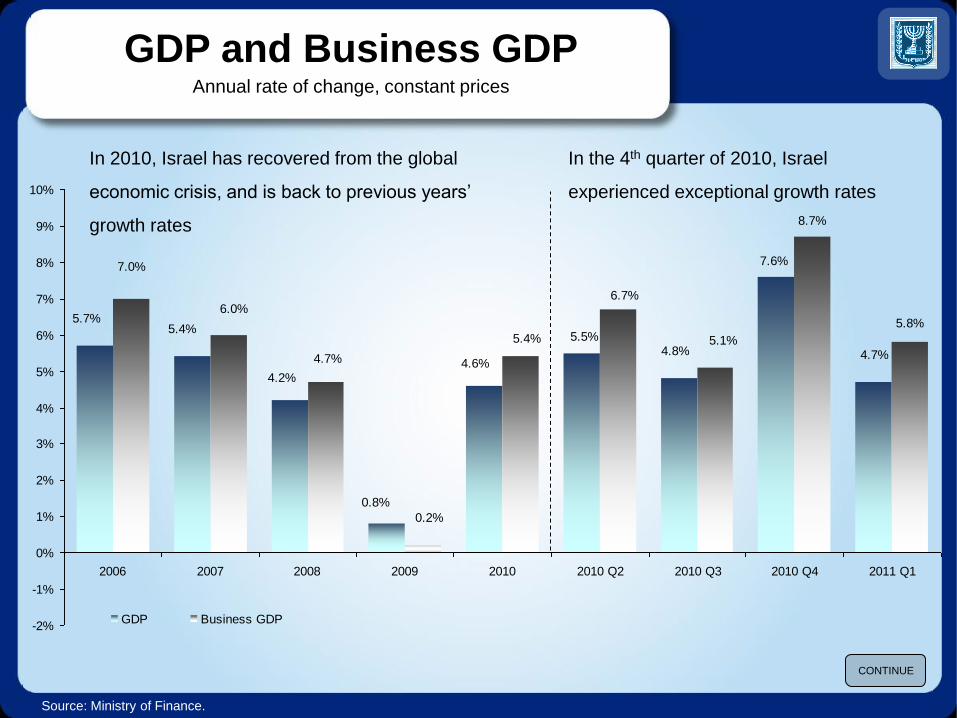
GDP and Business GDP
Annual rate of change, constant prices
In 2010, Israel has recovered from the global In the 4th quarter of 2010, Israel
economic crisis, and is back to previous years’ experienced exceptional growth rates
growth rates
Source: Ministry of Finance.
CONTINUE
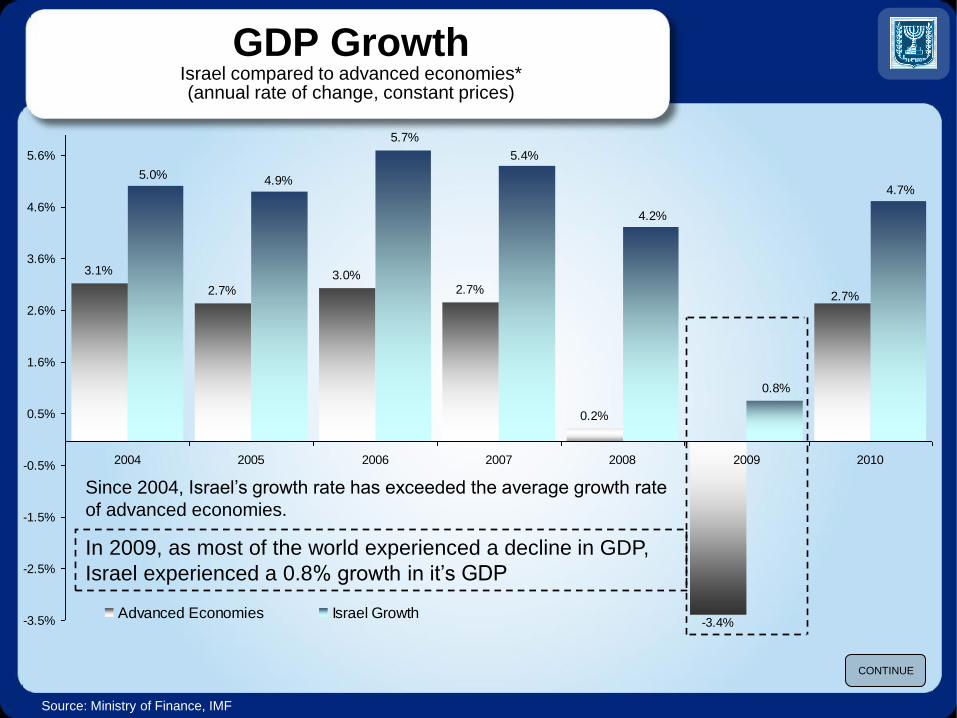
GDP Growth Israel compared to advanced economies* (annual rate of change, constant prices)
3.1%
2.7%
3.0%2.7%
0.2%
-3.4%
2.7%
0.8%
4.7%
4.2%
5.4%
5.7%
4.9%5.0%
-3.5%
-2.5%
-1.5%
-0.5%
0.5%
1.6%
2.6%
3.6%
4.6%
5.6%
2004 2005 2006 2007 2008 2009 2010
Advanced Economies Israel Growth
Source: Ministry of Finance, IMF
Since 2004, Israel’s growth rate has exceeded the average growth rate
of advanced economies.
CONTINUE
In 2009, as most of the world experienced a decline in GDP,
Israel experienced a 0.8% growth in it’s GDP
4.3%
6.3%
3.0%
1.4% 1.4%
3.1% 3.1%2.1% 2.2% 2.2%
13.6%14.6%
4.1%
-5.8%
12.6%
5.9%
9.3%
5.9%
-12.5%
13.6%
-15.0%
-10.0%
-5.0%
0.0%
5.0%
10.0%
15.0%
20.0%
2006 2007 2008 2009 2010
Private Consumption Government Consumption Investment in Fixed Assets Exports of Goods and Services
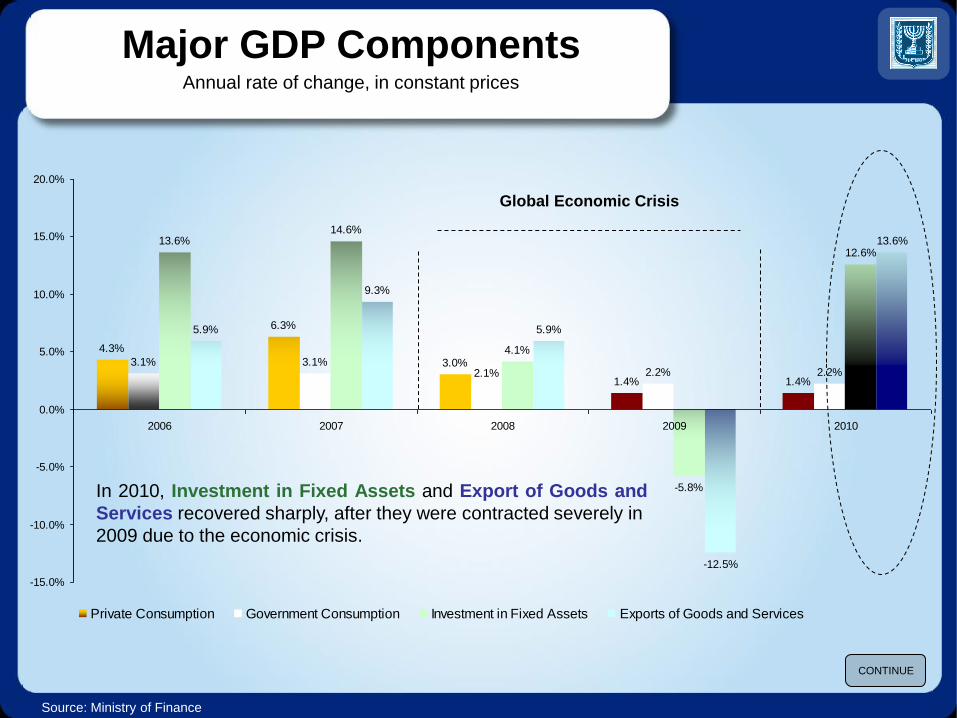
Major GDP Components
Annual rate of change, in constant prices
Source: Ministry of Finance
CONTINUE
In 2010, Investment in Fixed Assets and Export of Goods and
Services recovered sharply, after they were contracted severely in
2009 due to the economic crisis.
Global Economic Crisis
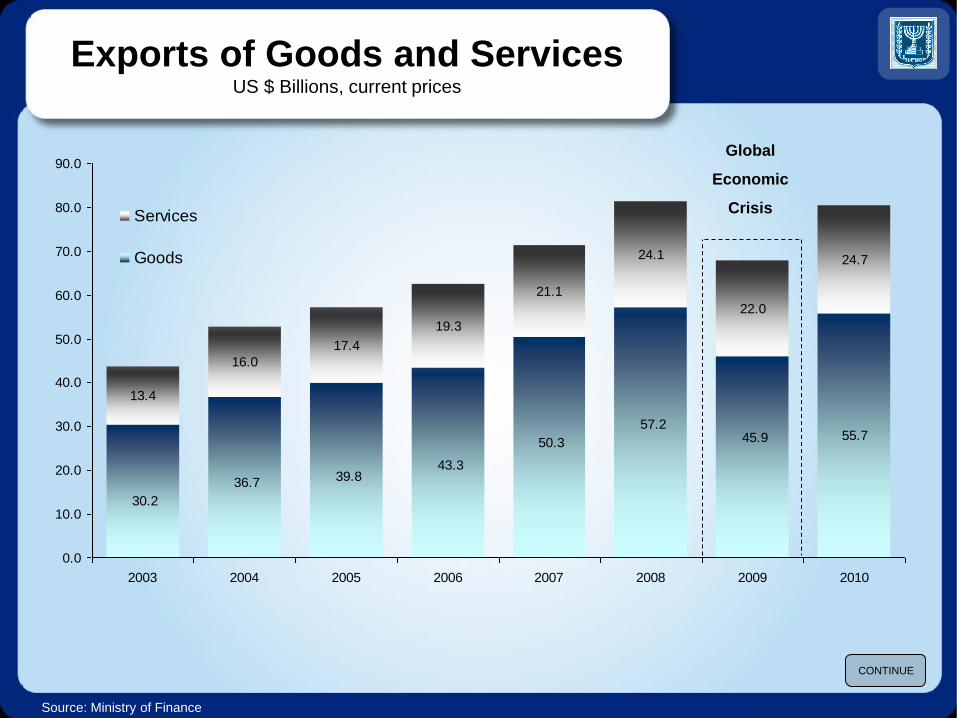
Source: Ministry of Finance
Exports of Goods and Services US $ Billions, current prices
55.7
13.4
16.0
17.4
19.3
21.1
24.1
22.0
24.7
45.957.2
36.7
30.2
39.843.3
50.3
0.0
10.0
20.0
30.0
40.0
50.0
60.0
70.0
80.0
90.0
2003 2004 2005 2006 2007 2008 2009 2010
Services
Goods
CONTINUE
Global
Economic
Crisis
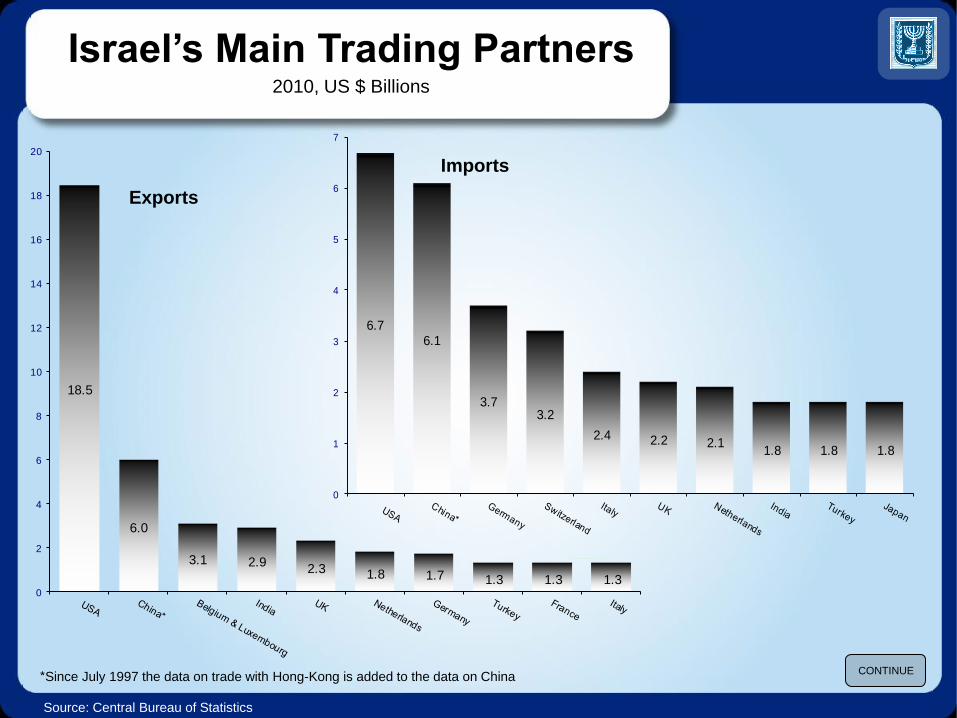
Israel’s Main Trading Partners
2010, US $ Billions
Source: Central Bureau of Statistics
18.5
6.0
3.1 2.92.3 1.8 1.7 1.3 1.3 1.3
0
2
4
6
8
10
12
14
16
18
20
Exports
CONTINUE *Since July 1997 the data on trade with Hong-Kong is added to the data on China
6.76.1
3.73.2
2.4 2.2 2.11.8 1.8 1.8
0
1
2
3
4
5
6
7
Imports
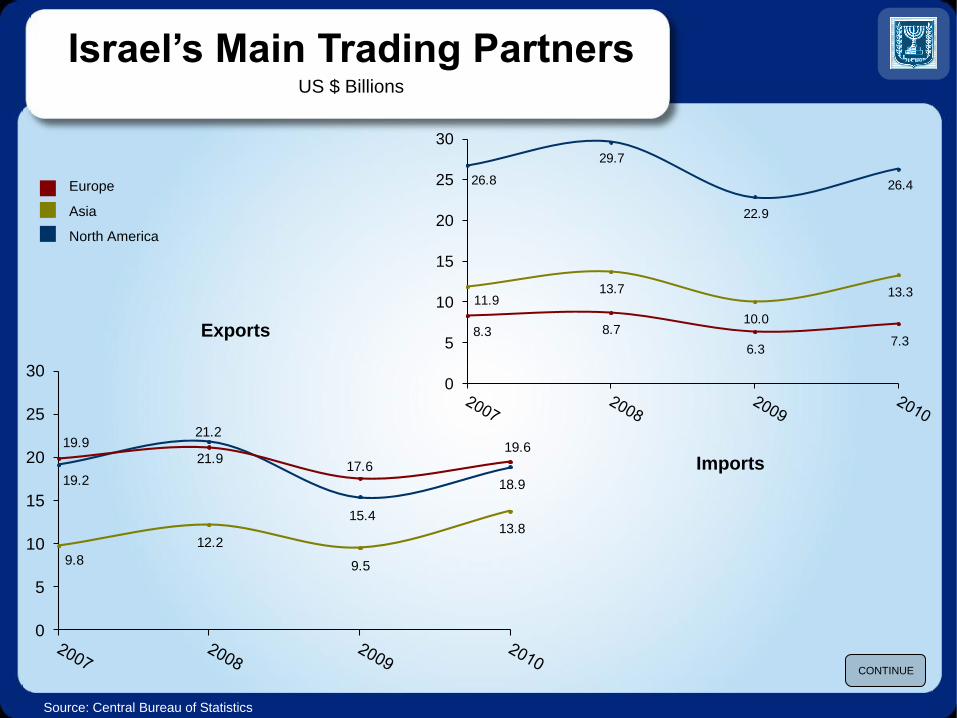
Israel’s Main Trading Partners
US $ Billions
Source: Central Bureau of Statistics
26.8
29.7
22.9
26.4
11.913.7
10.0
13.3
8.3 8.7
6.37.3
0
5
10
15
20
25
30
CONTINUE
Imports
Exports
19.2
21.9
15.4
18.9
9.8
12.2
9.5
13.8
19.921.2
17.6
19.6
0
5
10
15
20
25
30
Europe
Asia
North America
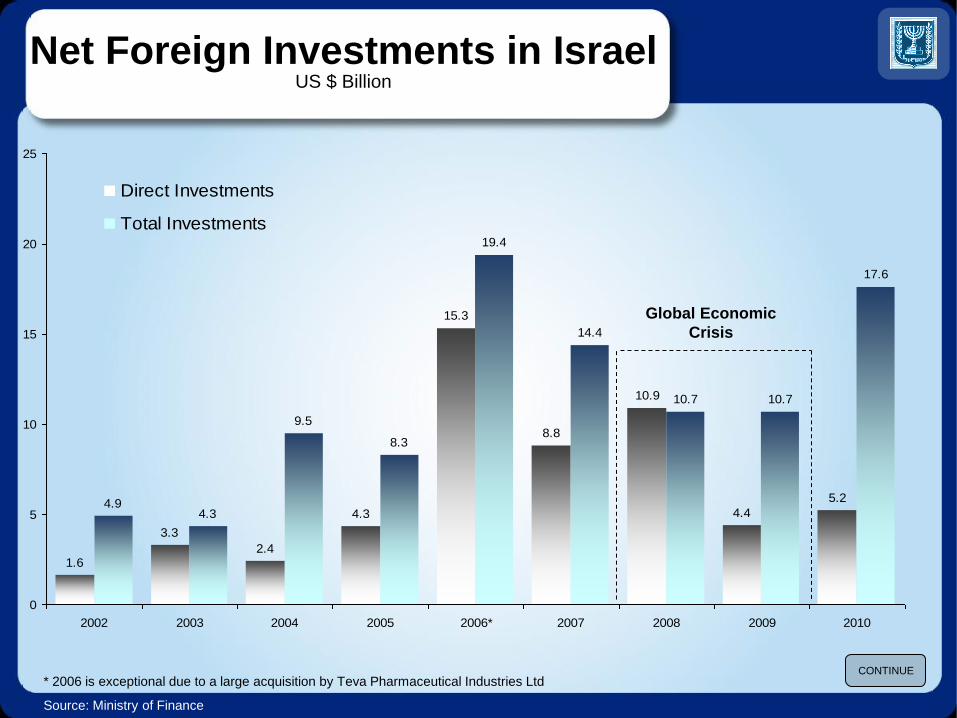
Net Foreign Investments in Israel US $ Billion
1.6
3.3
2.4
4.3
15.3
8.8
10.9
4.4
5.24.94.3
9.5
8.3
19.4
14.4
10.7 10.7
17.6
0
5
10
15
20
25
2002 2003 2004 2005 2006* 2007 2008 2009 2010
Direct Investments
Total Investments
* 2006 is exceptional due to a large acquisition by Teva Pharmaceutical Industries Ltd
Source: Ministry of Finance
CONTINUE
Global Economic
Crisis
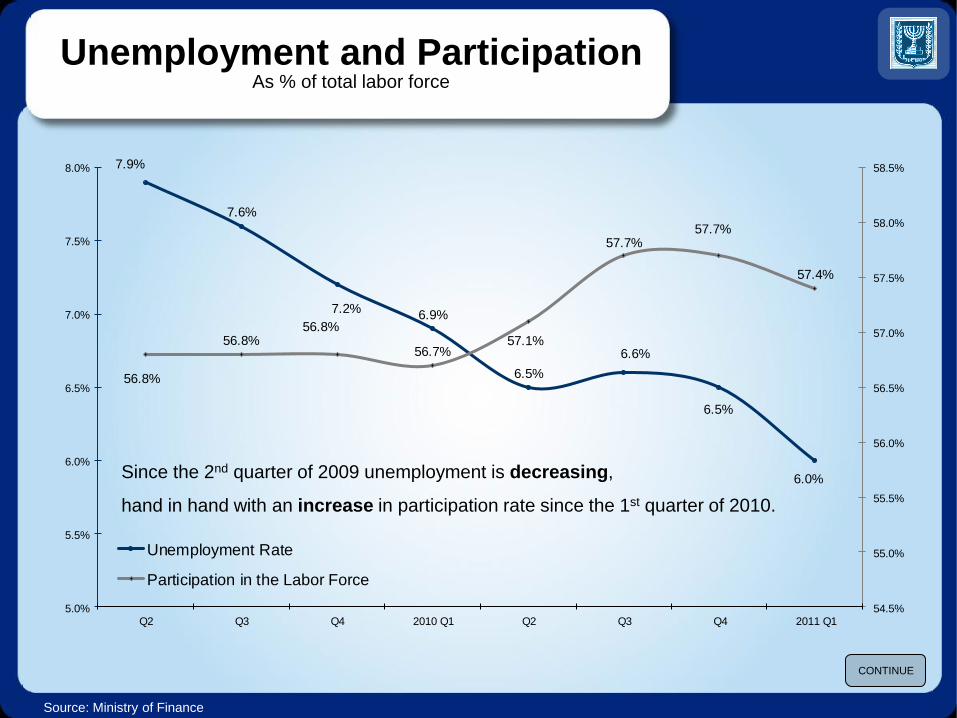
Unemployment and Participation As % of total labor force
7.9%
7.6%
7.2%6.9%
6.5%
6.6%
6.5%
6.0%
56.8%
56.8%56.8%
56.7%57.1%
57.7%57.7%
57.4%
54.5%
55.0%
55.5%
56.0%
56.5%
57.0%
57.5%
58.0%
58.5%
5.0%
5.5%
6.0%
6.5%
7.0%
7.5%
8.0%
Q2 Q3 Q4 2010 Q1 Q2 Q3 Q4 2011 Q1
Unemployment Rate
Participation in the Labor Force
Source: Ministry of Finance
CONTINUE
Since the 2nd quarter of 2009 unemployment is decreasing,
hand in hand with an increase in participation rate since the 1st quarter of 2010.
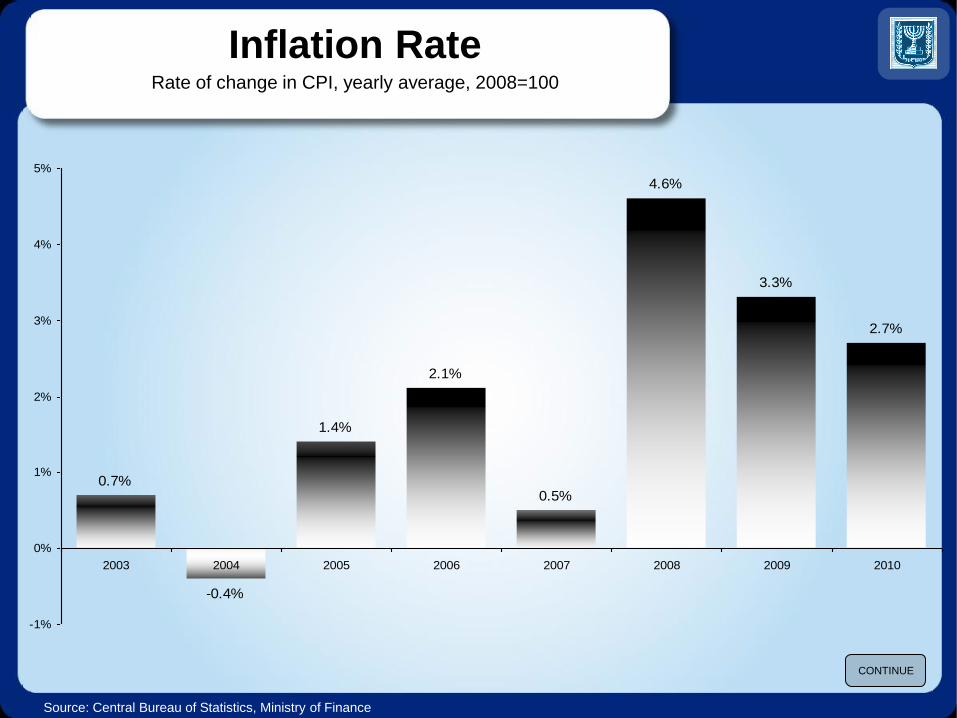
Inflation Rate
Rate of change in CPI, yearly average, 2008=100
Source: Central Bureau of Statistics, Ministry of Finance
0.7%
-0.4%
1.4%
2.1%
0.5%
4.6%
3.3%
2.7%
-1%
0%
1%
2%
3%
4%
5%
2003 2004 2005 2006 2007 2008 2009 2010
CONTINUE
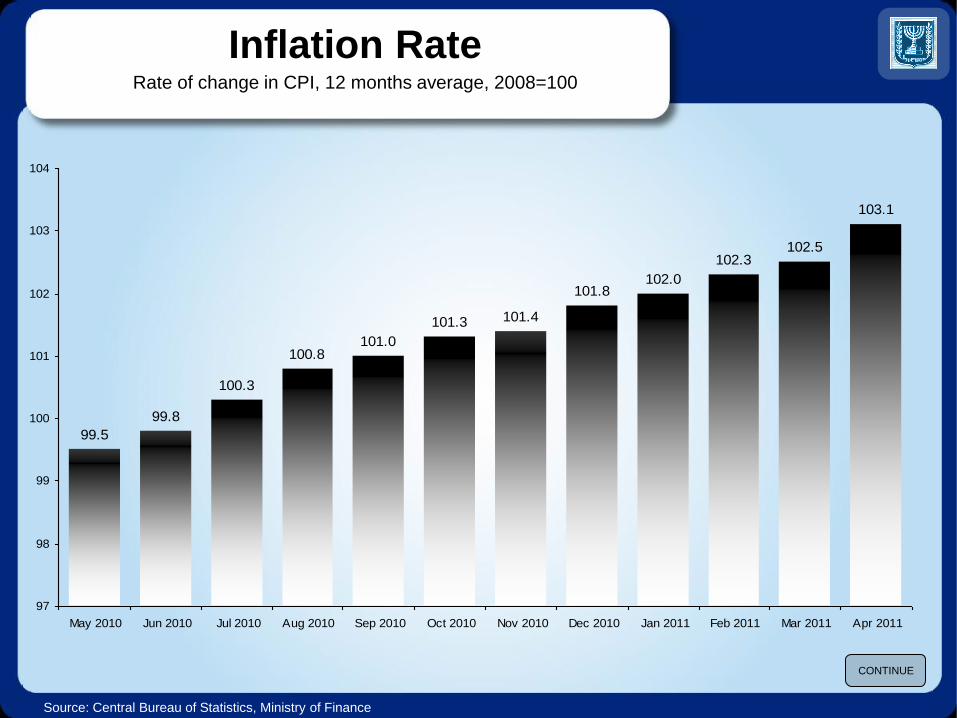
Inflation Rate
Rate of change in CPI, 12 months average, 2008=100
Source: Central Bureau of Statistics, Ministry of Finance
99.5
99.8
100.3
100.8101.0
101.3 101.4
101.8102.0
102.3102.5
103.1
97
98
99
100
101
102
103
104
May 2010 Jun 2010 Jul 2010 Aug 2010 Sep 2010 Oct 2010 Nov 2010 Dec 2010 Jan 2011 Feb 2011 Mar 2011 Apr 2011
CONTINUE
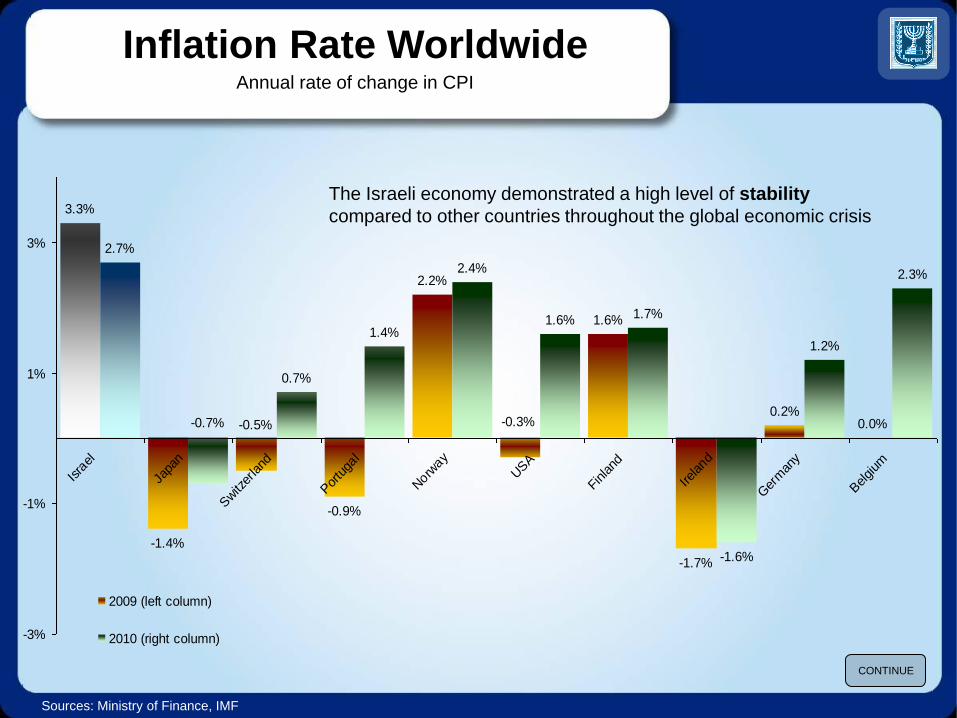
Inflation Rate Worldwide
Annual rate of change in CPI
Sources: Ministry of Finance, IMF
CONTINUE
3.3%
-1.4%
-0.9%
2.2%
1.6%
-1.7%
0.2%0.0%
2.7%
0.7%
1.4%
2.4%
1.6% 1.7%
-1.6%
1.2%
2.3%
-0.5% -0.3%-0.7%
-3%
-1%
1%
3%
Isra
el
Japa
n
Switz
erland
Por
tuga
l
Norw
ay
USA
Finland
Ireland
Ger
man
y
Belgium
2009 (left column)
2010 (right column)
The Israeli economy demonstrated a high level of stability
compared to other countries throughout the global economic crisis
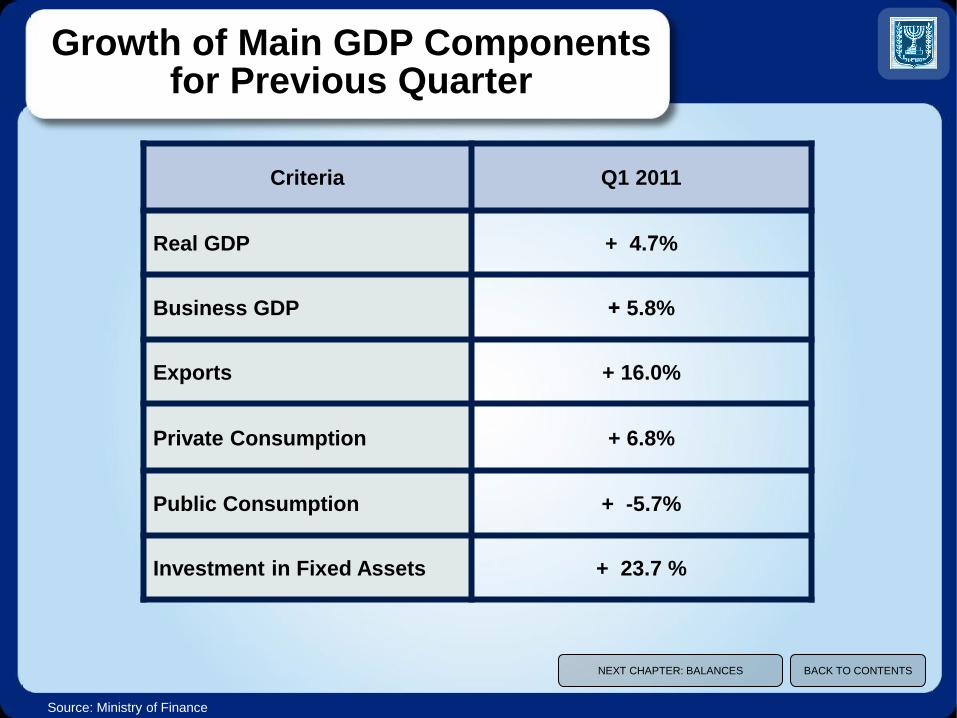
Q1 2011 Criteria
+ 4.7% Real GDP
+ 5.8% Business GDP
+ 16.0% Exports
+ 6.8% Private Consumption
+ -5.7% Public Consumption
+ 23.7 % Investment in Fixed Assets
Source: Ministry of Finance
Growth of Main GDP Components for Previous Quarter
NEXT CHAPTER: BALANCES BACK TO CONTENTS
Balances
Budget Deficit – Target and Execution
Gross Public Debt
BACK TO CONTENTS
Budget Deficit and General Government Expenditure
Gross Tax Burden
Current Account and Net Foreign Debt
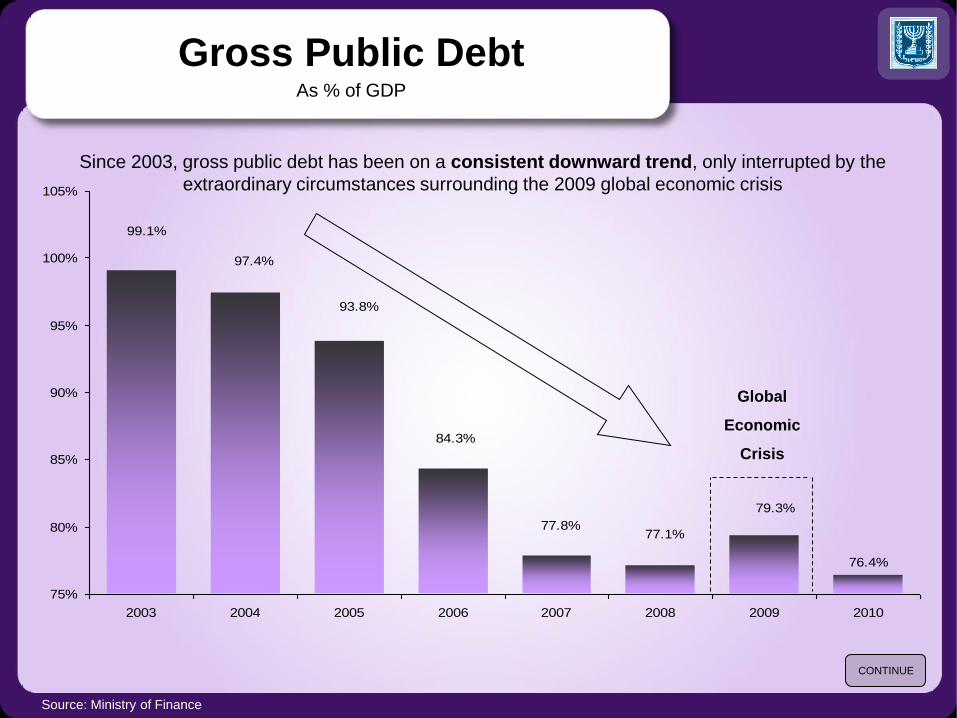
Gross Public Debt
As % of GDP
Source: Ministry of Finance
76.4%
79.3%
99.1%
97.4%
93.8%
84.3%
77.8%77.1%
75%
80%
85%
90%
95%
100%
105%
2003 2004 2005 2006 2007 2008 2009 2010
Since 2003, gross public debt has been on a consistent downward trend, only interrupted by the
extraordinary circumstances surrounding the 2009 global economic crisis
CONTINUE
Global
Economic
Crisis
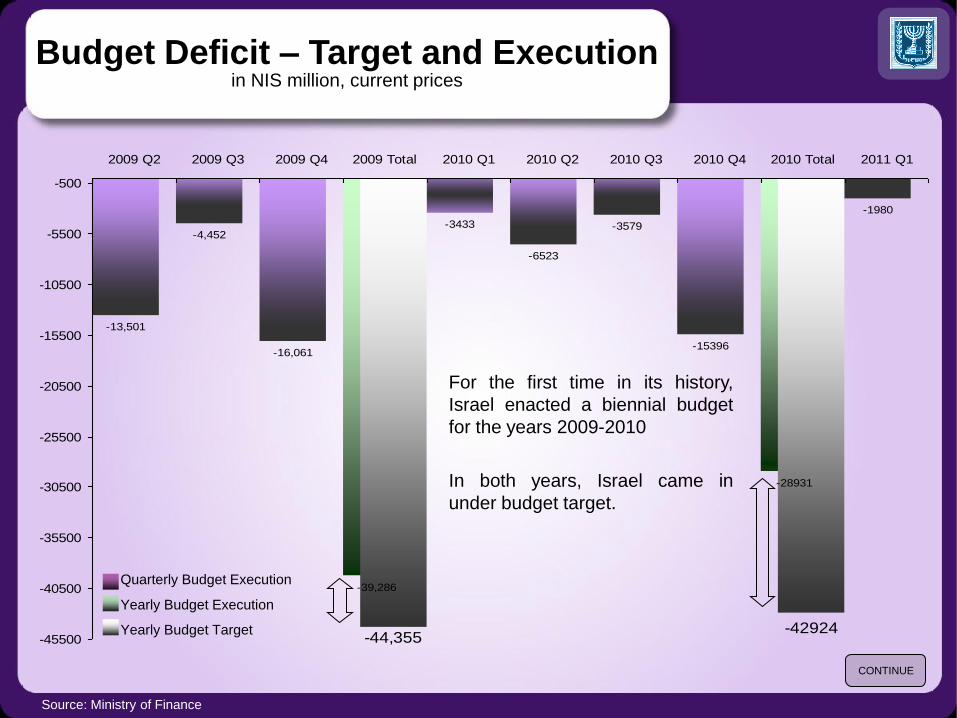
Budget Deficit – Target and Execution in NIS million, current prices
Source: Ministry of Finance
-13,501
-4,452
-16,061
-39,286
-3433
-6523
-3579
-15396
-28931
-1980
-44,355-42924
-45500
-40500
-35500
-30500
-25500
-20500
-15500
-10500
-5500
-500
2009 Q2 2009 Q3 2009 Q4 2009 Total 2010 Q1 2010 Q2 2010 Q3 2010 Q4 2010 Total 2011 Q1
CONTINUE
For the first time in its history,
Israel enacted a biennial budget
for the years 2009-2010
In both years, Israel came in
under budget target.
Quarterly Budget Execution
Yearly Budget Execution
Yearly Budget Target
Source: Ministry of Finance
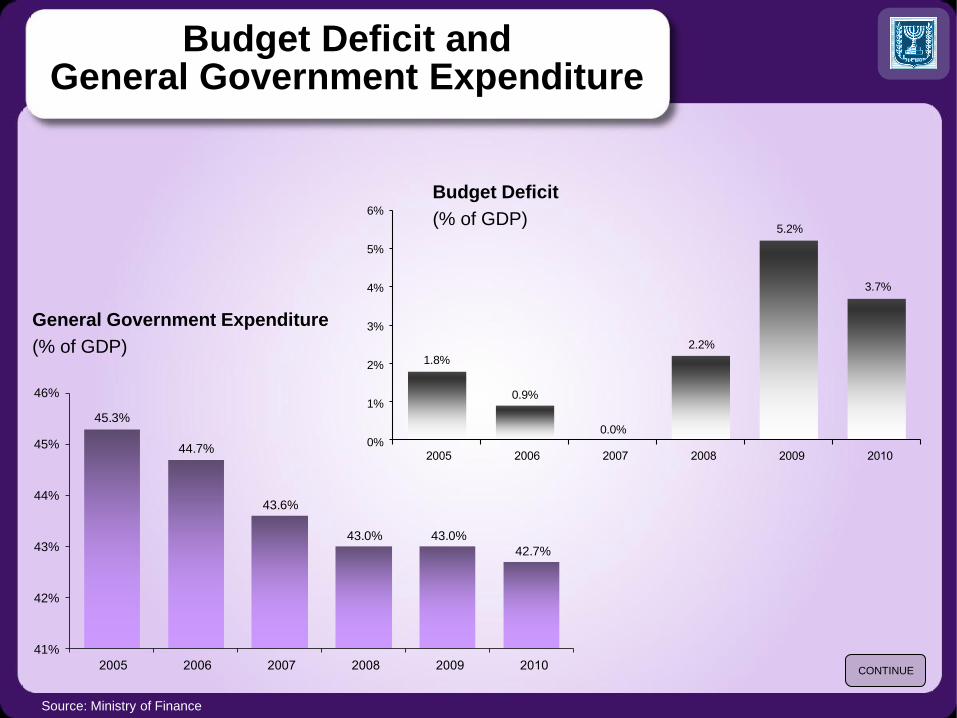
Budget Deficit and General Government Expenditure
45.3%
44.7%
43.6%
43.0% 43.0%
42.7%
41%
42%
43%
44%
45%
46%
2 5 2 6 2 7 2 8 2 9 2 1
General Government Expenditure
(% of GDP) 1.8%
0.9%
0.0%
2.2%
5.2%
3.7%
0%
1%
2%
3%
4%
5%
6%
2 5 2 6 2 7 2 8 2 9 2 1
CONTINUE
Budget Deficit
(% of GDP)
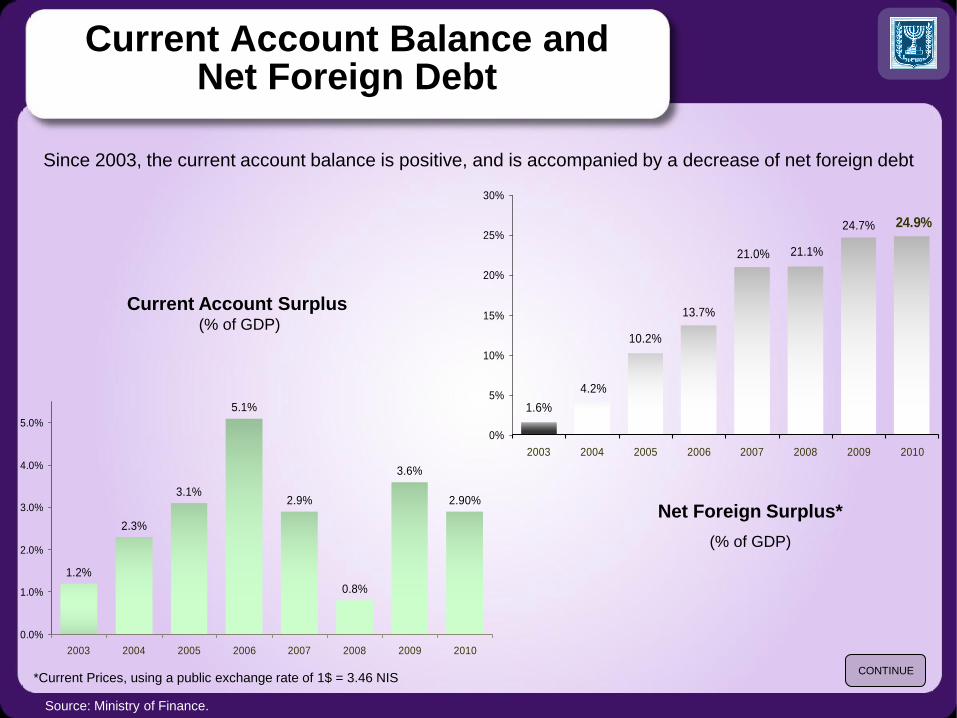
Current Account Balance and Net Foreign Debt
Source: Ministry of Finance.
1.2%
2.3%
3.1%
5.1%
2.9%
0.8%
3.6%
2.90%
0.0%
1.0%
2.0%
3.0%
4.0%
5.0%
2003 2004 2005 2006 2007 2008 2009 2010
Since 2003, the current account balance is positive, and is accompanied by a decrease of net foreign debt
Current Account Surplus (% of GDP)
Net Foreign Surplus*
(% of GDP)
1.6%
24.9%24.7%
21.1%21.0%
13.7%
10.2%
4.2%
0%
5%
10%
15%
20%
25%
30%
2003 2004 2005 2006 2007 2008 2009 2010
CONTINUE *Current Prices, using a public exchange rate of 1$ = 3.46 NIS
Source: Ministry of Finance, OECD
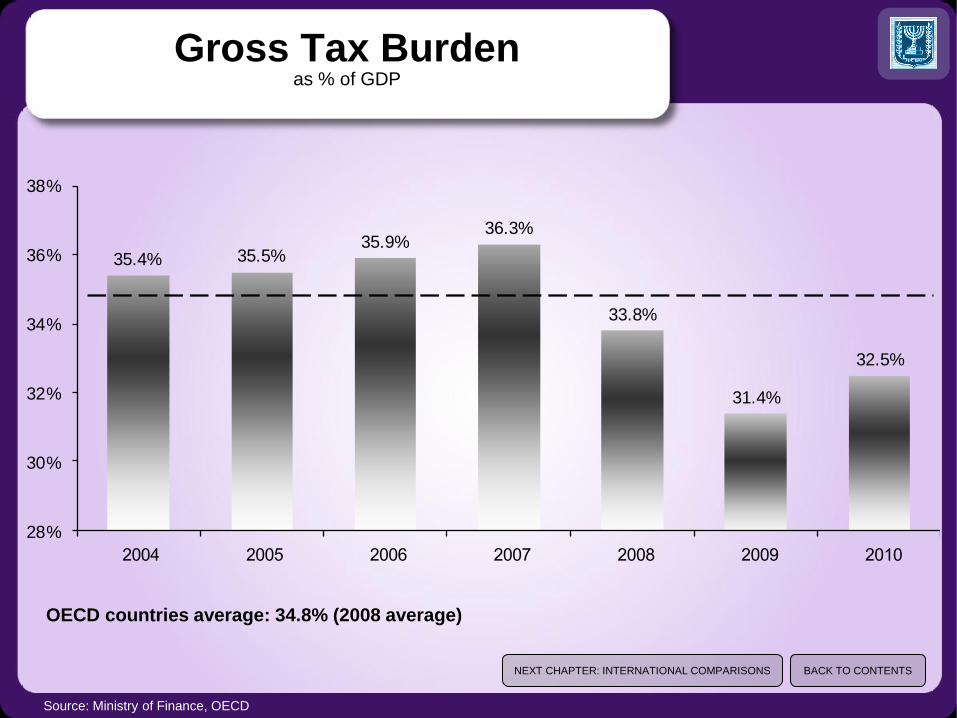
Gross Tax Burden as % of GDP
35.4% 35.5%35.9%
36.3%
33.8%
31.4%
32.5%
28%
30%
32%
34%
36%
38%
2 4 2 5 2 6 2 7 2 8 2 9 2 1
OECD countries average: 34.8% (2008 average)
NEXT CHAPTER: INTERNATIONAL COMPARISONS BACK TO CONTENTS
International Comparisons
NASDAQ and Tel-Aviv 100 (monthly average)
WEF Global Competitive Index
Central Bank Interest Rates: Israel and U.S.A
BACK TO CONTENTS
IMD World Competitiveness Yearbook
IMD World Competitiveness
Yearbook 2011
CONTINUE
Israel was also ranked 17th in IMD World Competitiveness
Yearbook 2011.
Read about it Here
Source: International Institute for Management and Development (IMD), World Competitiveness Yearbook 201
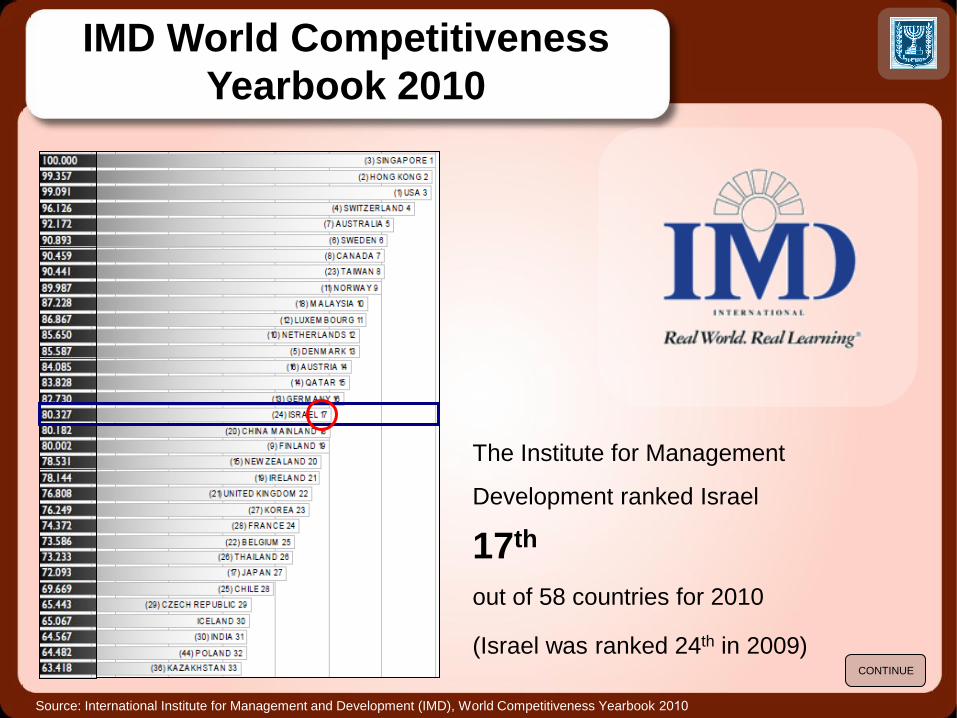
IMD World Competitiveness
Yearbook 2010
The Institute for Management
Development ranked Israel
17th
out of 58 countries for 2010 (Israel was ranked 24th in 2009)
CONTINUE
Source: International Institute for Management and Development (IMD), World Competitiveness Yearbook 201
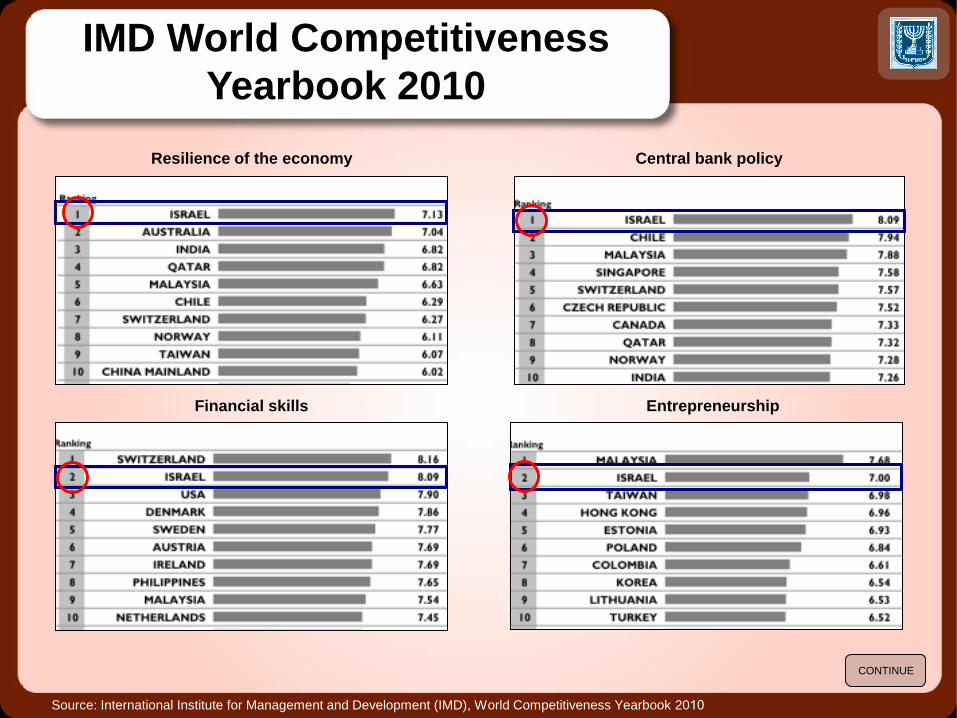
IMD World Competitiveness
Yearbook 2010
CONTINUE
Resilience of the economy Central bank policy
Entrepreneurship Financial skills
Source: International Institute for Management and Development (IMD), World Competitiveness Yearbook 201
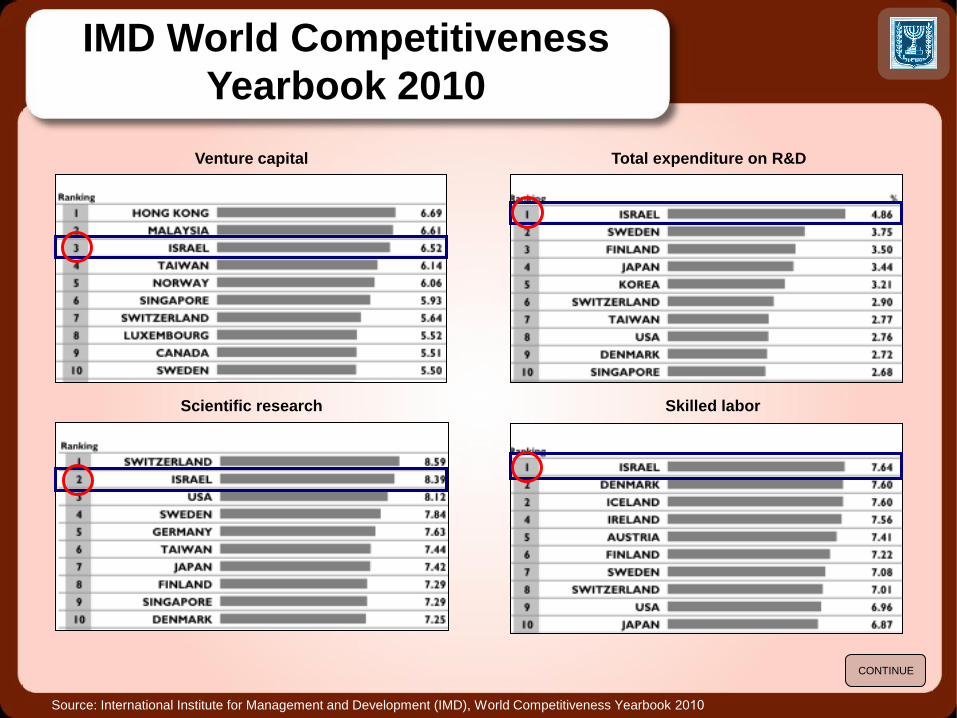
IMD World Competitiveness
Yearbook 2010
CONTINUE
Venture capital Total expenditure on R&D
Skilled labor Scientific research
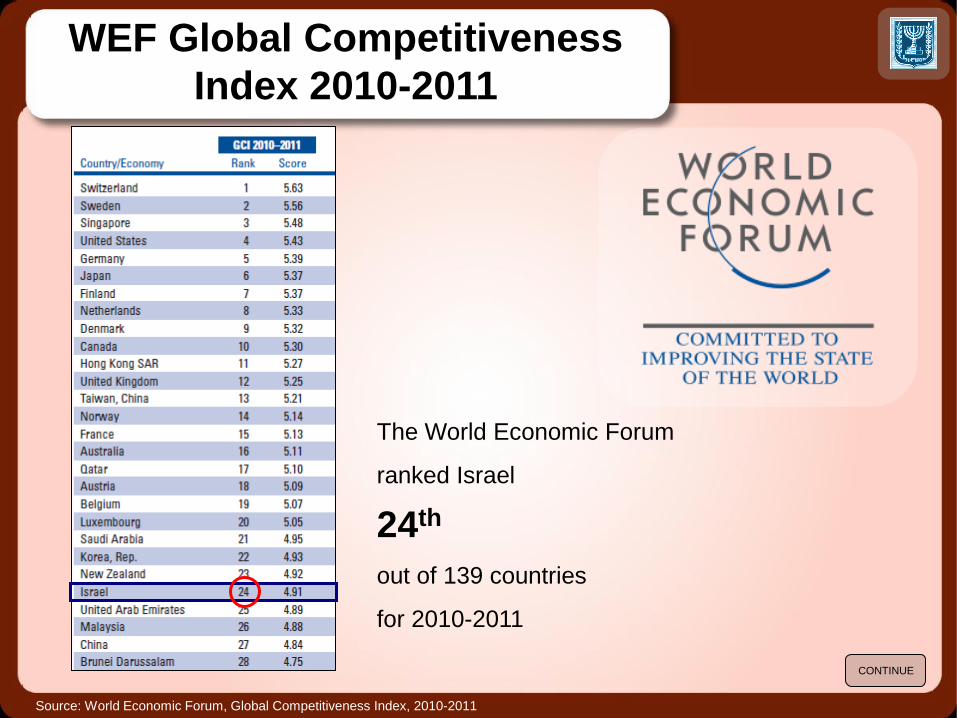
Source: World Economic Forum, Global Competitiveness Index, 2010-2011
The World Economic Forum
ranked Israel
24th
out of 139 countries
for 2010-2011
CONTINUE
WEF Global Competitiveness
Index 2010-2011
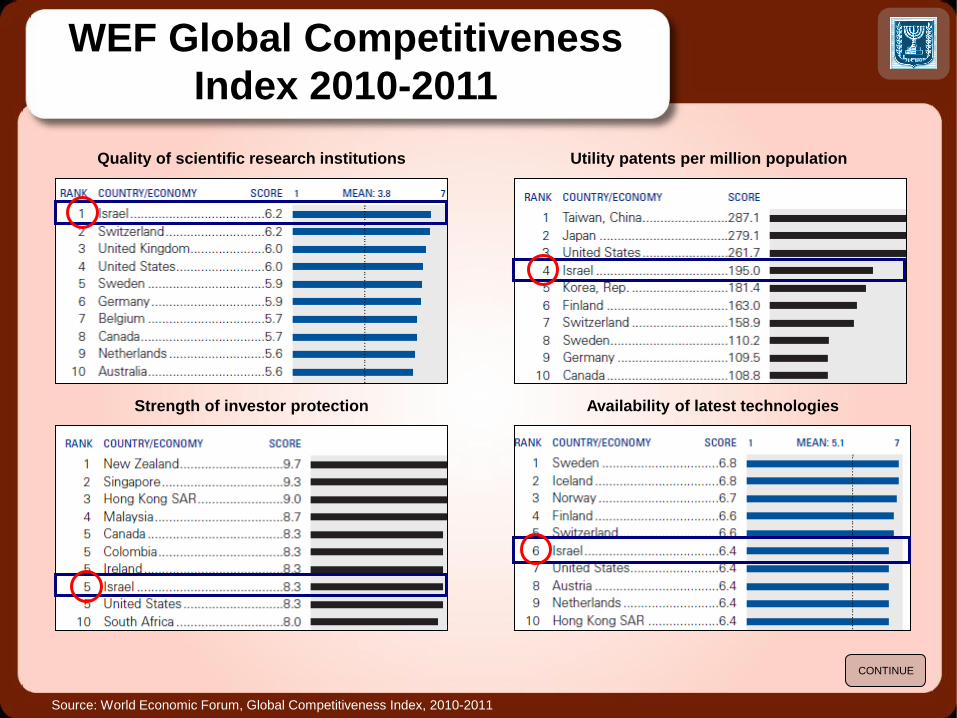
Source: World Economic Forum, Global Competitiveness Index, 2010-2011
CONTINUE
Quality of scientific research institutions Utility patents per million population
Availability of latest technologies Strength of investor protection
WEF Global Competitiveness
Index 2010-2011
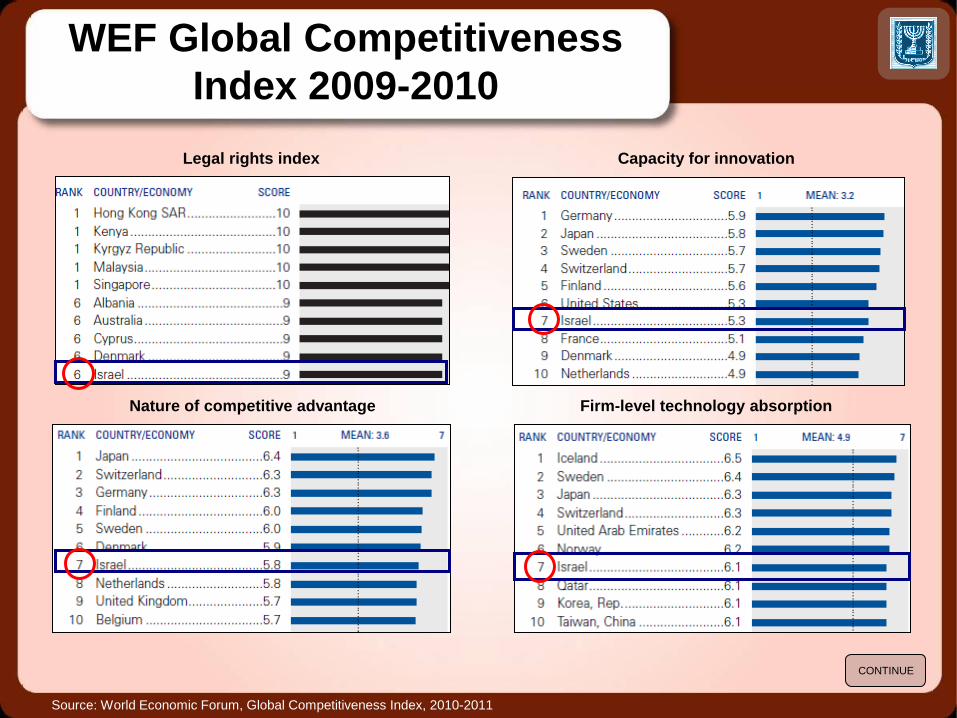
Source: World Economic Forum, Global Competitiveness Index, 2010-2011
Legal rights index Capacity for innovation
Firm-level technology absorption Nature of competitive advantage
CONTINUE
WEF Global Competitiveness
Index 2009-2010
1.00%
0.50%
0.75%
1.25%
1.50%
1.75%
2.00%
2.50%
3.00%
3.25%
0.0%
0.5%
1.0%
1.5%
2.0%
2.5%
3.0%
3.5%
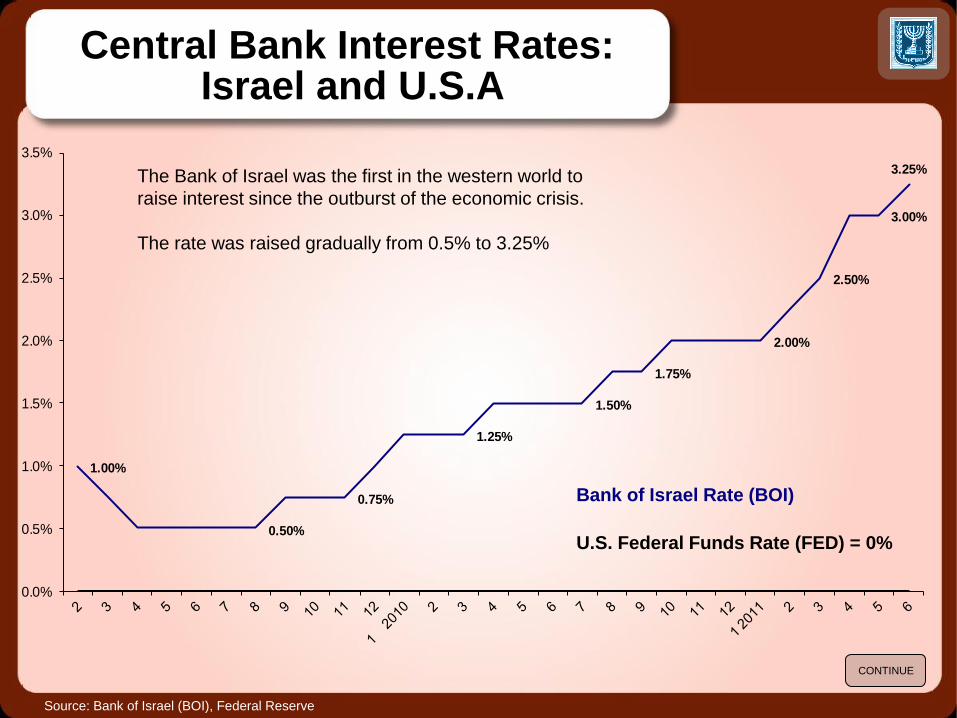
Central Bank Interest Rates: Israel and U.S.A
Source: Bank of Israel (BOI), Federal Reserve
Bank of Israel Rate (BOI)
U.S. Federal Funds Rate (FED) = 0%
CONTINUE
The Bank of Israel was the first in the western world to
raise interest since the outburst of the economic crisis.
The rate was raised gradually from 0.5% to 3.25%
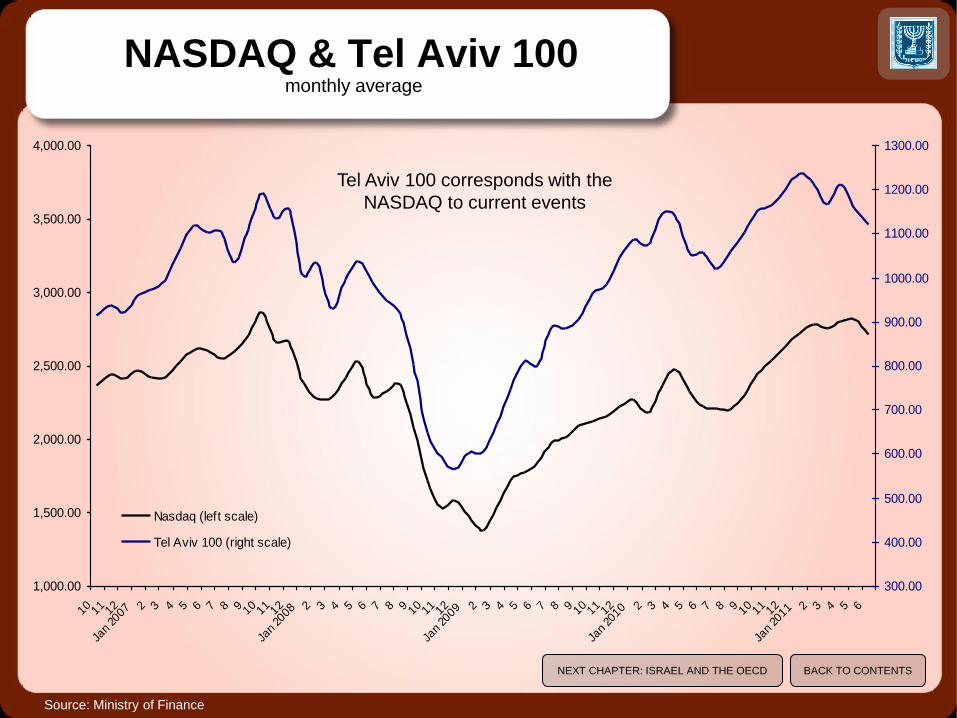
NASDAQ & Tel Aviv 100 monthly average
1,000.00
1,500.00
2,000.00
2,500.00
3,000.00
3,500.00
4,000.00
10 11 12
Jan 20
072 3 4 5 6 7 8 9 10 11 12
Jan 20
082 3 4 5 6 7 8 9 10 11 12
Jan 20
092 3 4 5 6 7 8 9 10 11 12
Jan 20
102 3 4 5 6 7 8 9 10 11 12
Jan 20
112 3 4 5 6
300.00
400.00
500.00
600.00
700.00
800.00
900.00
1000.00
1100.00
1200.00
1300.00
Nasdaq (left scale)
Tel Aviv 100 (right scale)
Source: Ministry of Finance
Tel Aviv 100 corresponds with the
NASDAQ to current events
NEXT CHAPTER: ISRAEL AND THE OECD BACK TO CONTENTS
Israel and the OECD
Unemployment
GDP per Capita
Real GDP Growth
Expenditure on R&D
Israel was invited as a full member in the OECD on May 10th, 2010, and officially
joined in September 10th, 2010.
BACK TO CONTENTS
Source: OECD
CONTINUE
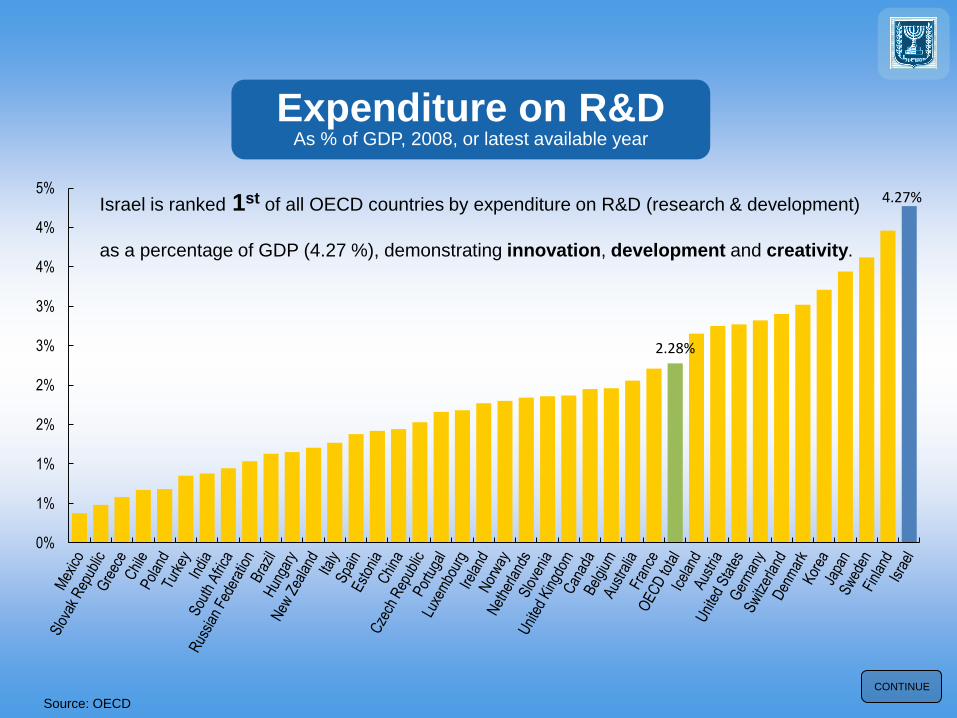
2.28%
4.27%
0%
1%
1%
2%
2%
3%
3%
4%
4%
5%Israel is ranked 1st of all OECD countries by expenditure on R&D (research & development)
as a percentage of GDP (4.27 %), demonstrating innovation, development and creativity.
Expenditure on R&D As % of GDP, 2008, or latest available year
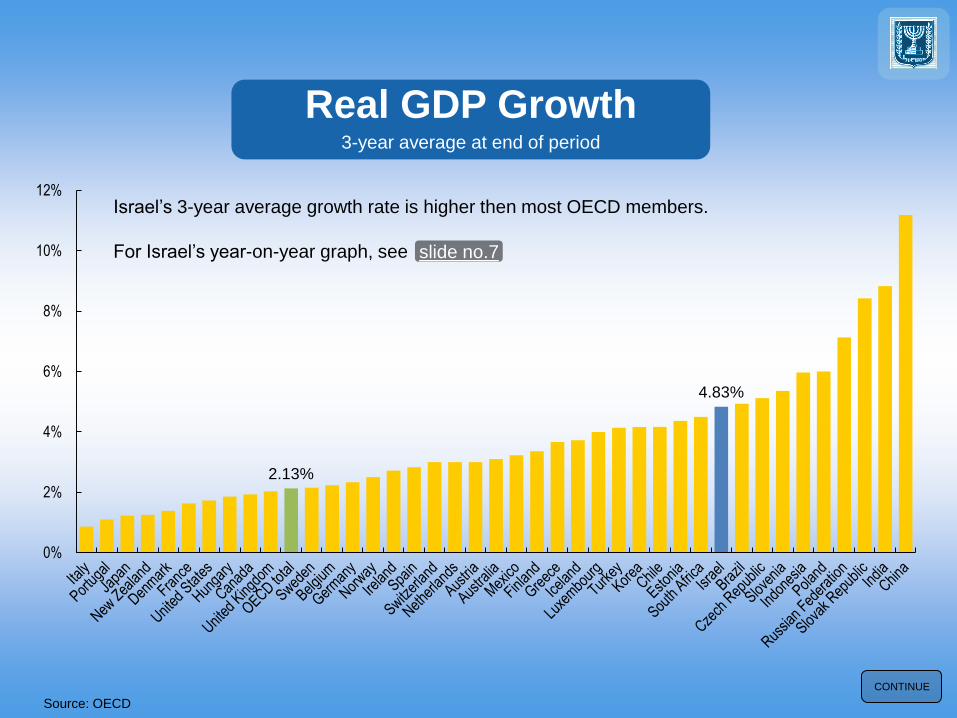
Real GDP Growth
3-year average at end of period
Source: OECD
CONTINUE
2.13%
4.83%
0%
2%
4%
6%
8%
10%
12%Israel’s 3-year average growth rate is higher then most OECD members.
For Israel’s year-on-year graph, see slide no.7
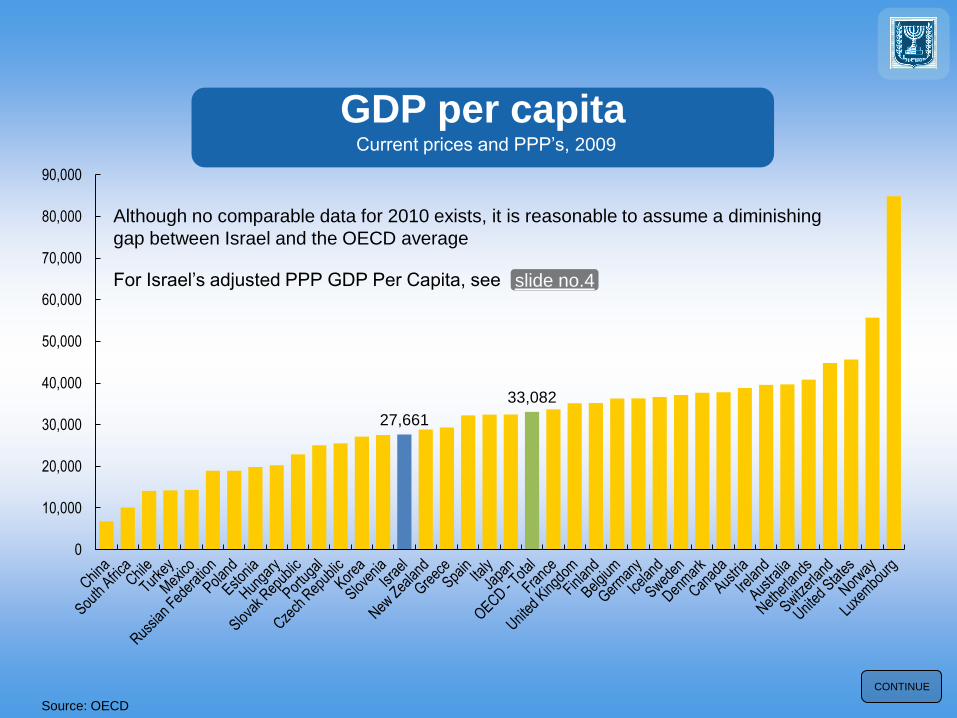
GDP per capita Current prices and PPP’s, 2009
Source: OECD
CONTINUE
27,661
33,082
0
10,000
20,000
30,000
40,000
50,000
60,000
70,000
80,000
90,000
For Israel’s adjusted PPP GDP Per Capita, see slide no.4
Although no comparable data for 2010 exists, it is reasonable to assume a diminishing
gap between Israel and the OECD average
Source: Ministry of Finance, OECD
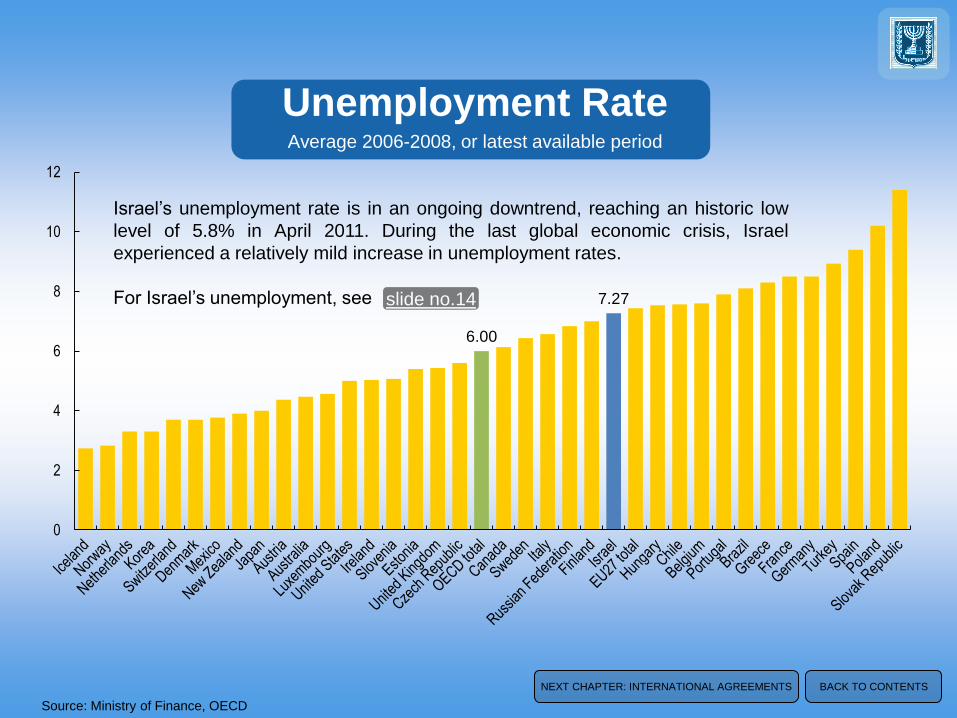
6.00
7.27
0
2
4
6
8
10
12
Israel’s unemployment rate is in an ongoing downtrend, reaching an historic low
level of 5.8% in April 2011. During the last global economic crisis, Israel
experienced a relatively mild increase in unemployment rates.
For Israel’s unemployment, see
NEXT CHAPTER: INTERNATIONAL AGREEMENTS BACK TO CONTENTS
Unemployment Rate
Average 2006-2008, or latest available period
slide no.14
International Agreements
Avoidance of Double Taxation Agreements
Bilateral Investment Treaties
Cooperation in Industrial R&D Agreements
International Organization Memberships
Israel’s Free Trade Agreements
BACK TO CONTENTS

QIZ Agreements
Egypt (2004)
Jordan (1998)
Israel’s Free Trade Agreements
1985
1992
1997
1997
1999
2000
2007
USA
EFTA
Turkey
Canada
Mexico
European Union (Association Agreement)
MERCOSUR (Argentina not yet in force)
CONTINUE
Source: Ministry of Finance
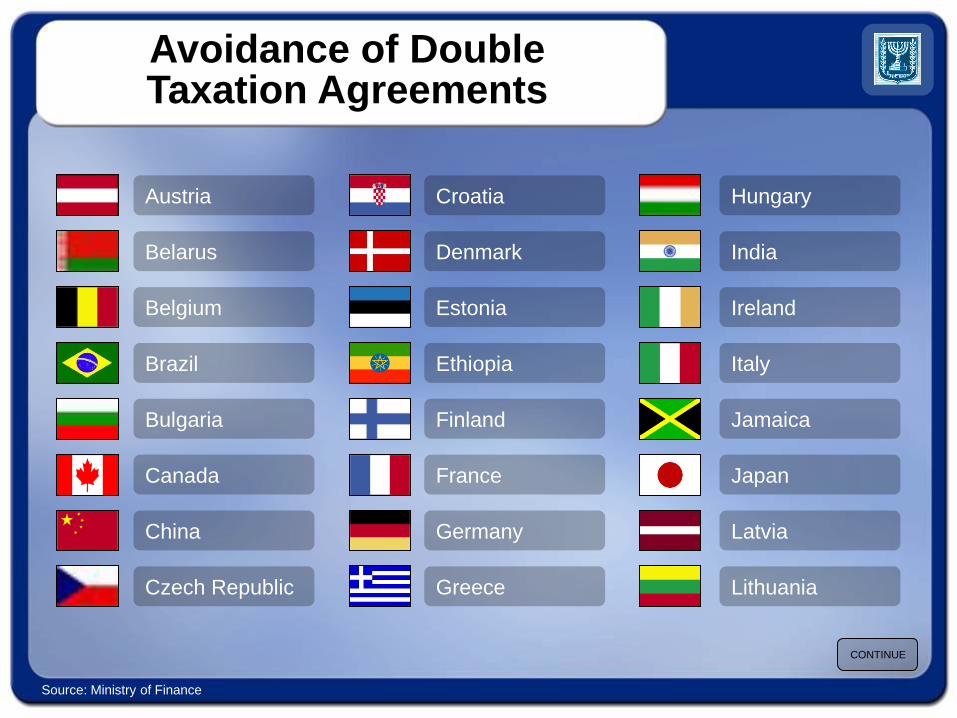
Avoidance of Double Taxation Agreements
Austria
Belarus
Belgium
Brazil
Bulgaria
Canada
China
Czech Republic
Croatia
Denmark
Estonia
Ethiopia
Finland
France
Germany
Greece
Hungary
India
Ireland
Italy
Jamaica
Japan
Latvia
Lithuania
CONTINUE
Source: Ministry of Finance
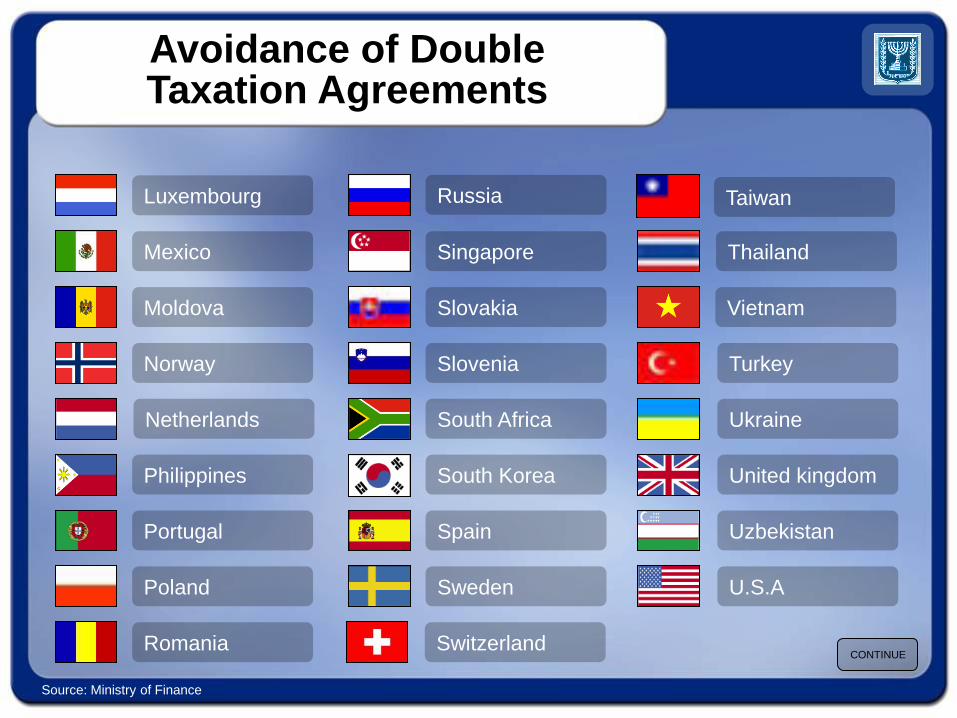
Avoidance of Double Taxation Agreements
CONTINUE
Source: Ministry of Finance
Luxembourg
Mexico
Moldova
Norway
Philippines
Portugal
Poland
Romania
Russia
Singapore
Slovakia
Slovenia
South Africa
South Korea
Spain
Sweden
Switzerland
Thailand
Netherlands
Turkey
Ukraine
United kingdom
Uzbekistan
U.S.A
Taiwan
Vietnam
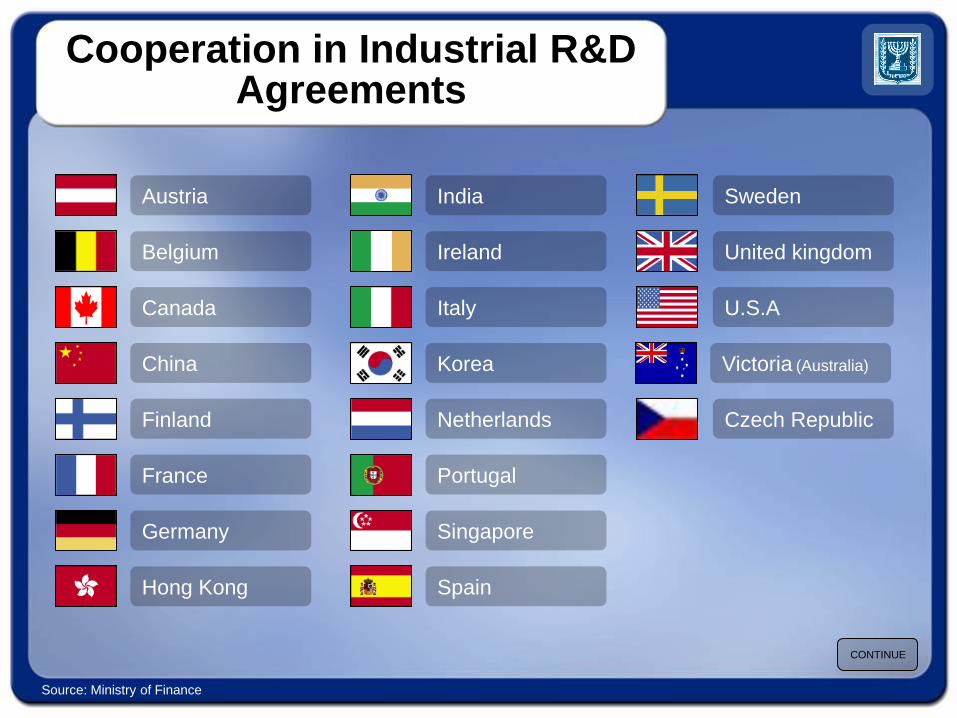
Cooperation in Industrial R&D Agreements
CONTINUE
Source: Ministry of Finance
Austria
Belgium
Canada
China
Finland
France
Germany
Hong Kong
Sweden
United kingdom
U.S.A
India
Ireland
Italy
Korea
Netherlands
Portugal
Singapore
Spain
Victoria (Australia)
Czech Republic
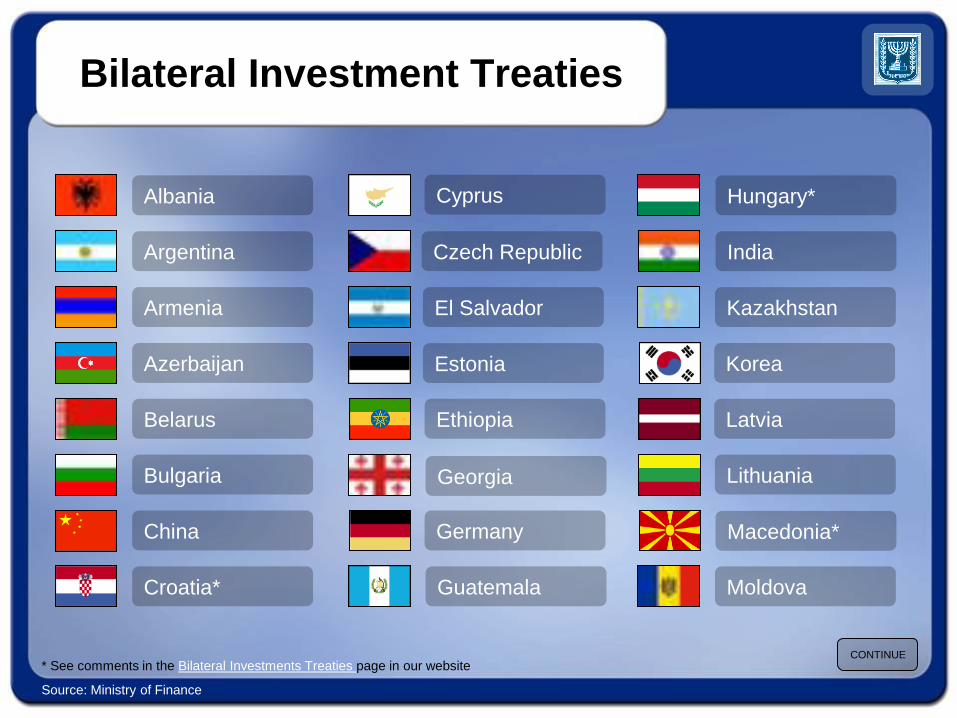
Bilateral Investment Treaties
CONTINUE
Source: Ministry of Finance
Albania
Argentina
Armenia
Azerbaijan
Belarus
Bulgaria
China
Croatia*
India
Kazakhstan
Latvia
Lithuania
Germany
Cyprus
Czech Republic
El Salvador
Estonia
Georgia
Guatemala
Ethiopia
Hungary*
Macedonia*
Korea
Moldova
* See comments in the Bilateral Investments Treaties page in our website
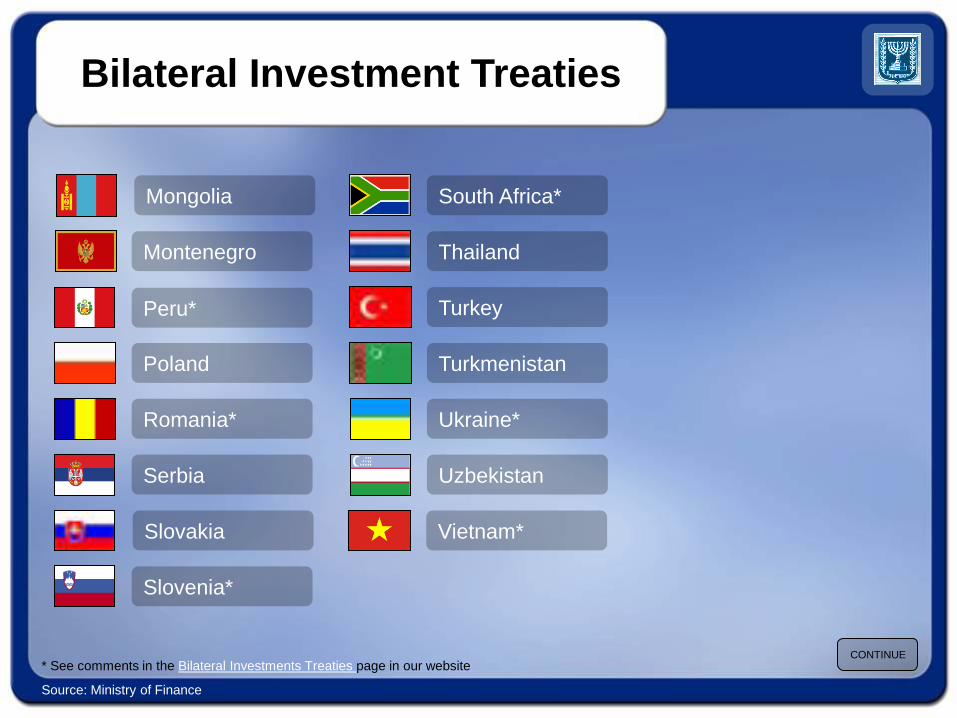
Bilateral Investment Treaties
CONTINUE
Source: Ministry of Finance
South Africa*
Thailand
Turkey
Turkmenistan
Ukraine*
Uzbekistan
Slovakia
Slovenia*
Serbia
Mongolia
Poland
Romania*
Montenegro
Peru*
Vietnam*
* See comments in the Bilateral Investments Treaties page in our website
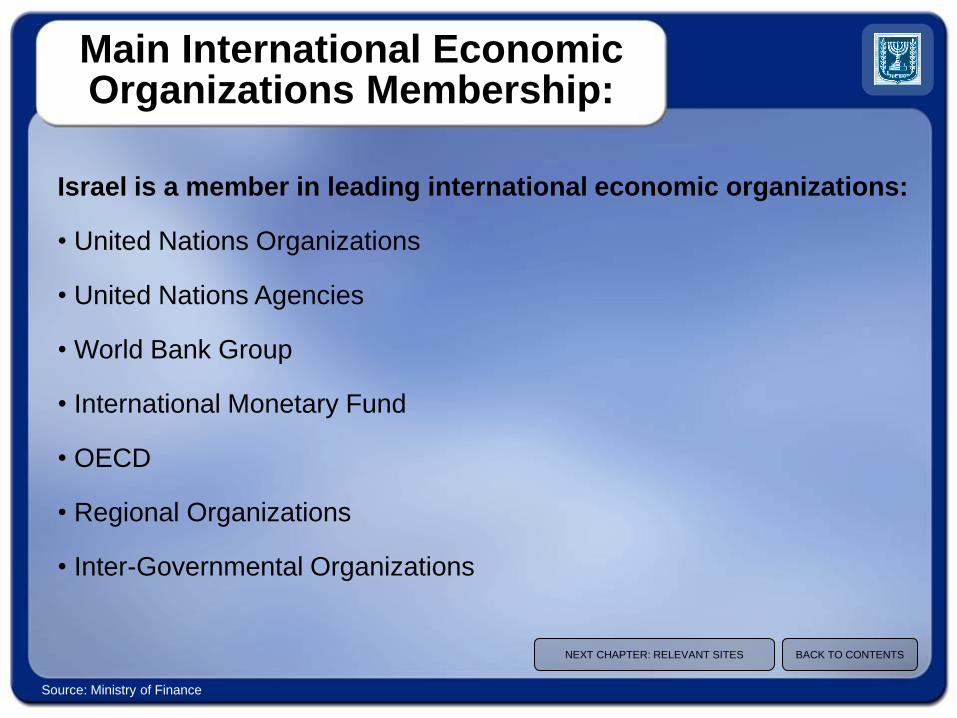
Main International Economic Organizations Membership:
Israel is a member in leading international economic organizations:
• United Nations Organizations
• United Nations Agencies
• World Bank Group
• International Monetary Fund
• OECD
• Regional Organizations
• Inter-Governmental Organizations
NEXT CHAPTER: RELEVANT SITES BACK TO CONTENTS
Source: Ministry of Finance
Relevant Sites
BACK TO CONTENTS
Ministry of Finance
Bank of Israel
Central Bureau of Statistics
Israeli Government Portal
Israel Securities Authority
Ministry of Industry, Trade and Labor
CONTACT US
Ministry of Foreign Affairs

WE WELCOME YOUR FEEDBACK Mr. Roni Hershkovitz
Director
Overseas Economic Information
International Affairs Department
Ministry of Finance
Jerusalem
Israel
Mr. Assaf Luxembourg
Overseas Economic Information
International Affairs Department
Ministry of Finance
Jerusalem
Israel
START OVER
Follow us on Twitter
Subscribe to our RSS Feeds
Subscribe to our Newsletters
Write us an Email
Visit our Website
Follow us on Linkedin