Embed Size (px)
Citation preview
©Designed by Igor Aronovich
April 19, 2023
Battery Storage as future Generation
Solution
Battery Storage as future Generation
SolutionIgor Aronovich
Senior Deputy Operations ManagerSystem Operation IEC
©Designed by Igor Aronovich
Main presentation subjects
Main presentation subjects
IEC electricity system in a Nutshell
RES and storage technologies
Energy Storage types - current solution survey
IEC Battery Storage Pilot
Pros and Cons
Questions
IEC electricity system in a Nutshell
RES and storage technologies
Energy Storage types - current solution survey
IEC Battery Storage Pilot
Pros and Cons
Questions
©Designed by Igor Aronovich
Annual Peak Demand
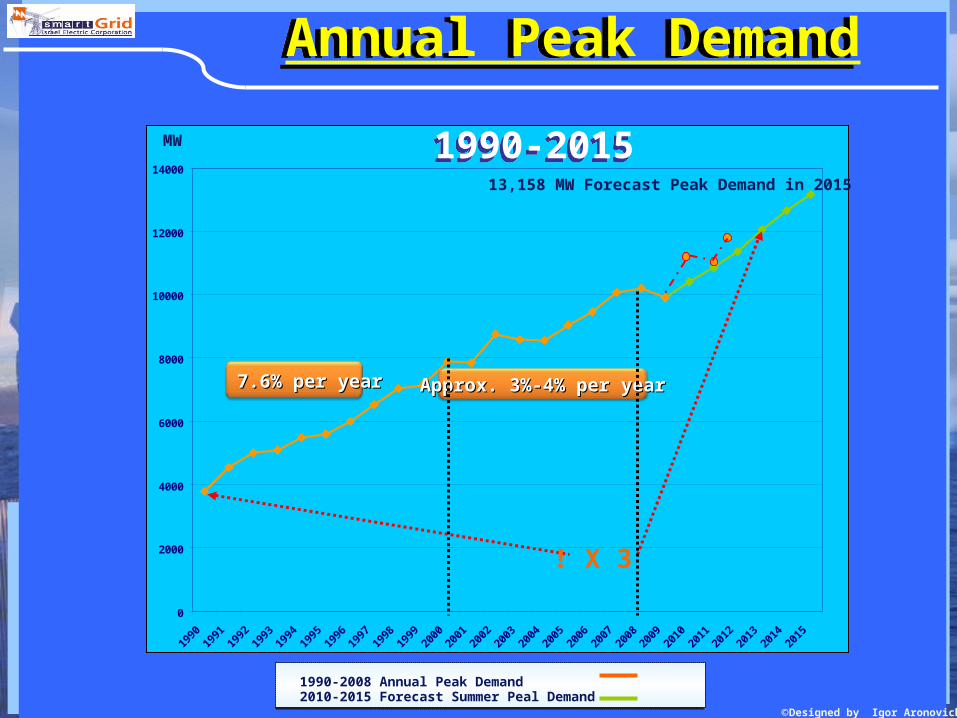
Annual Peak Demand
MW
0
2000
4000
6000
8000
10000
12000
14000
1990
1991
1992
1993
1994
1995
1996
1997
1998
1999
2000
2001
2002
2003
2004
2005
2006
2007
2008
2009
2010
2011
2012
2013
2014
2015
2010-2015 Forecast Summer Peal Demand
13,158 MW Forecast Peak Demand in 2015
3 X!
Approx. 3%-4% per yearApprox. 3%-4% per year7.6% per year7.6% per year
1990-2008 Annual Peak Demand
1990-20151990-2015
©Designed by Igor Aronovich
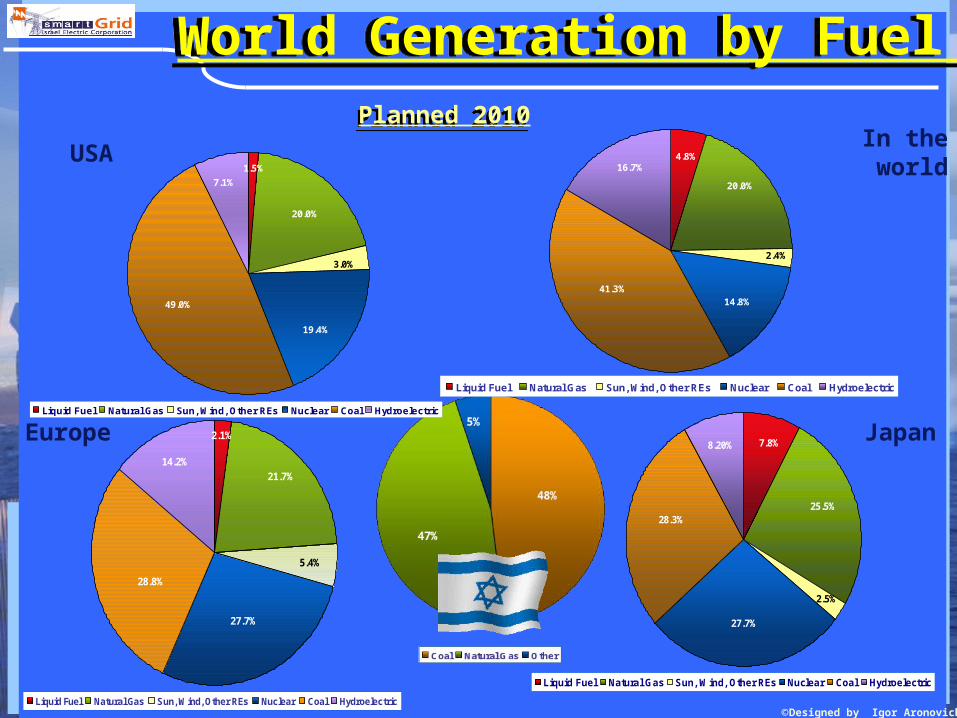
World Generation by Fuel World Generation by Fuel
USAIn the world
Europe Japan
27.7%
28.8%
14.2%
2.1%
21.7%
5.4%
Liquid Fuel Natural Gas Sun, Wind, Other REs Nuclear Coal Hydroelectric
2.4%
20.0%
4.8%16.7%
41.3%14.8%
Liquid Fuel Natural Gas Sun, Wind, Other REs Nuclear Coal Hydroelectric
49.0%
20.0%
1.5%
7.1%
3.0%
19.4%
Liquid Fuel Natural Gas Sun, Wind, Other REs Nuclear Coal Hydroelectric
7.8%
25.5%
2.5%
8.20%
28.3%
27.7%
Liquid Fuel Natural Gas Sun, Wind, Other REs Nuclear Coal Hydroelectric
Planned 2010Planned 2010
©Designed by Igor Aronovich
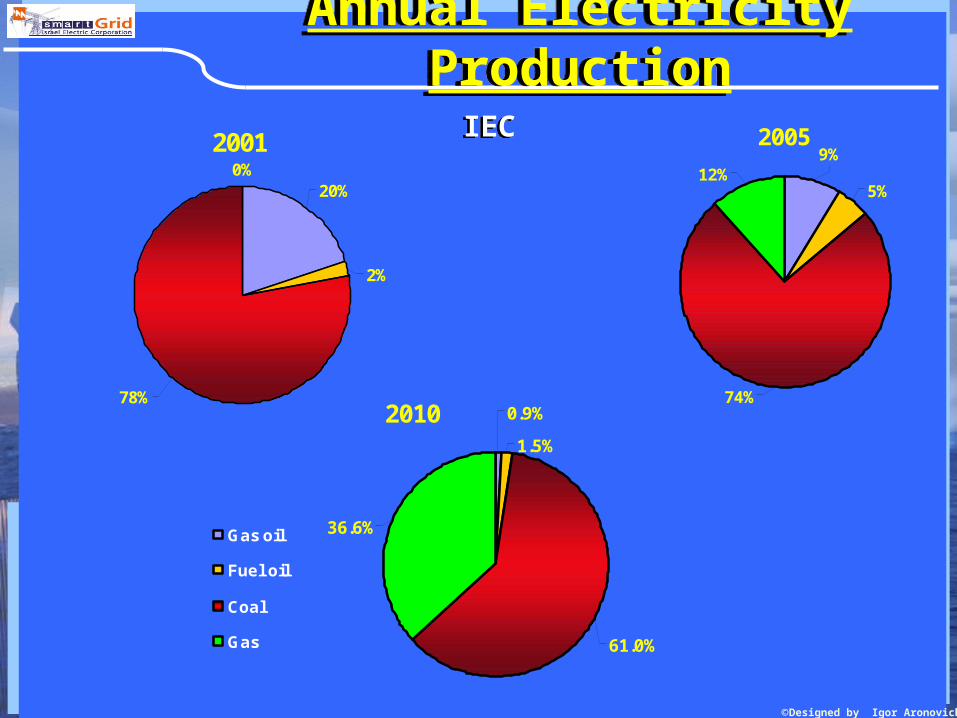
Annual Electricity ProductionAnnual Electricity Production
2010 0.9%
1.5%
36.6%
61.0%
Gas oil
Fuel oil
Coal
Gas
2005
74%
12%9%
5%
20010%
20%
2%
78%
IECIEC
©Designed by Igor Aronovich
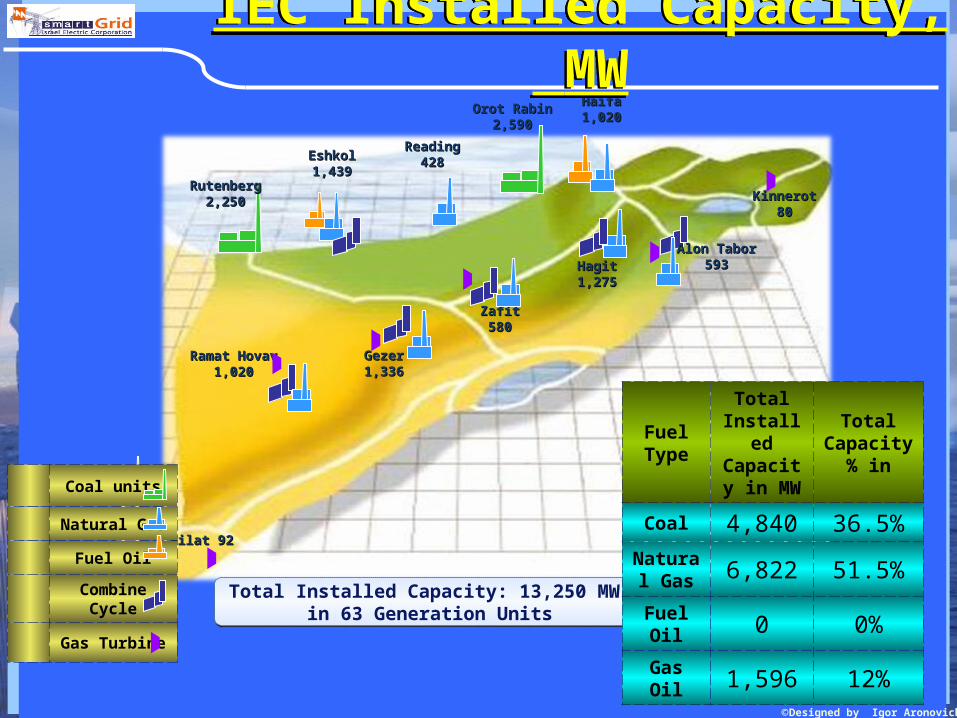
Orot RabinOrot Rabin2,5902,590
RutenbergRutenberg2,2502,250
HaifaHaifa1,0201,020
ReadingReading428428EshkolEshkol
1,4391,439
Alon TaborAlon Tabor593593
GezerGezer1,3361,336
ZafitZafit580580
HagitHagit1,2751,275
Ramat HovavRamat Hovav1,0201,020
Total Installed Capacity: 13,250 MW in 63 Generation Units
Total Installed Capacity: 13,250 MW in 63 Generation Units
Eilat 92Eilat 92
KinnerotKinnerot8080
IEC Installed Capacity, MW
,IEC Installed CapacityMW
Total Capacity
in%
Total Installed Capacity
in MW
Fuel Type
36.5%4,840Coal
51.5%6,822Natural Gas
0%0Fuel Oil
12%1,596Gas Oil
Coal units
Natural Gas
Fuel Oil
Combine Cycle
Gas Turbine
©Designed by Igor Aronovich
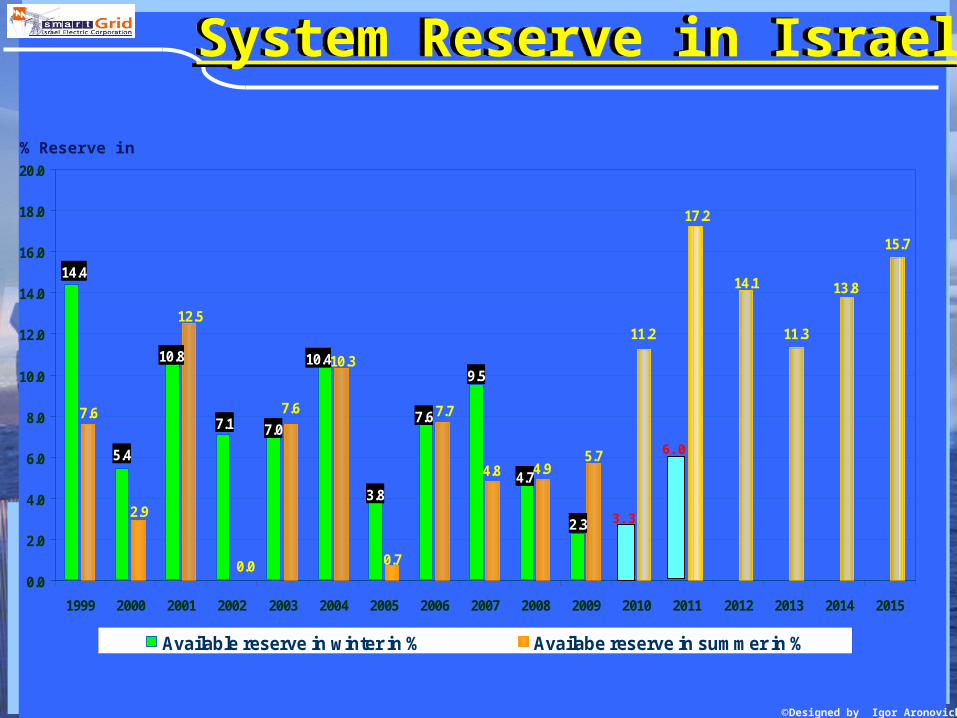
5.4
11.3
15.7
4.7
9.5
3.8
7.07.1
14.4
2.3
7.6
10.410.8
13.814.1
17.2
11.2
5.7
12.5
7.67.6
4.8
7.7
10.3
4.9
0.0 0.7
2.9
0.0
2.0
4.0
6.0
8.0
10.0
12.0
14.0
16.0
18.0
20.0
1999 2000 2001 2002 2003 2004 2005 2006 2007 2008 2009 2010 2011 2012 2013 2014 2015
Available reserve in winter in % Availabe reserve in summer in %
Reserve in%
3.3
6.0
System Reserve in IsraelSystem Reserve in Israel
©Designed by Igor Aronovich
6500
7000
7500
8000
8500
9000
9500
10000
10500
11000
11500
12000
12500
13000
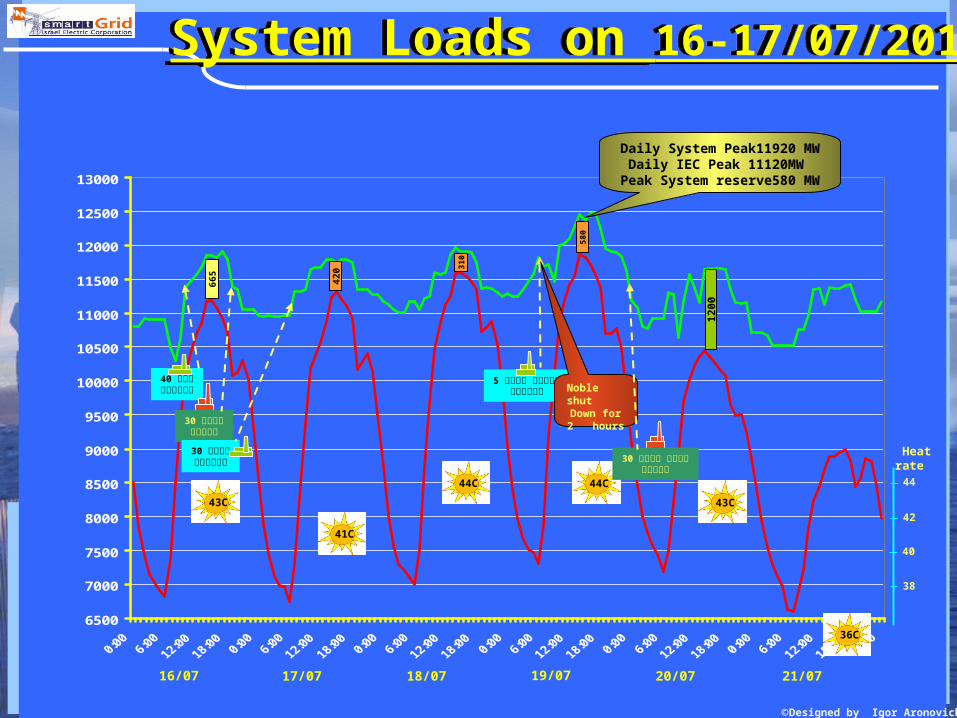
16/07 17/07 18/07 19/07 20/07 21/07
44C
41C
43C
36C
43C
44C
420 3
10
665
1200
580
5אורות רבין סנכרון
40גזר סנכרון
30חיפה נפסקה
Noble shutDown for2 hours
30אלון תבור הפסקה
Daily System Peak11920 MWDaily IEC Peak 11120MW
Peak System reserve580 MW
30חיפה סנכרון
Heat rate44
42
40
38
System Loads on 16-17/07/2012System Loads on 16-17/07/2012
©Designed by Igor Aronovich
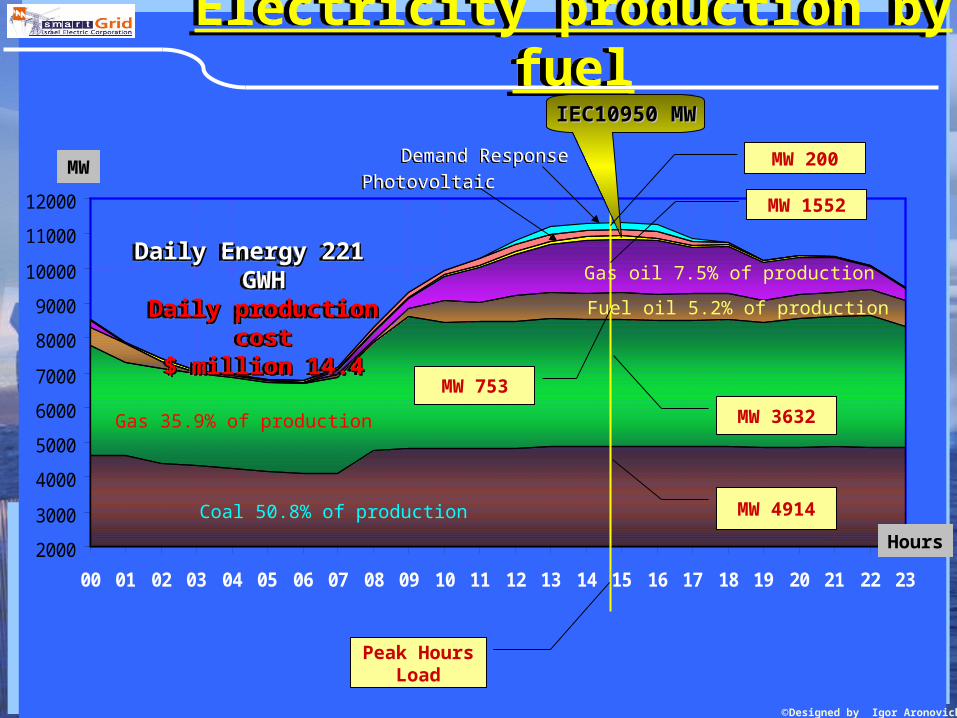
Electricity production by fuel
Electricity production by fuel
2000
3000
4000
5000
6000
7000
8000
9000
10000
11000
12000
00 01 02 03 04 05 06 07 08 09 10 11 12 13 14 15 16 17 18 19 20 21 22 23
4914 MW
3632 MW
753 MW
1552 MW
Peak Hours Load
IECIEC10950 10950 MWMW
Fuel oil 5.2% of production
Gas oil 7.5% of production
HoursHours
MWMW
Daily Energy 221 GWHDaily Energy 221 GWHDaily production costDaily production cost
14.414.4 millionmillion$ $
Daily Energy 221 GWHDaily Energy 221 GWHDaily production costDaily production cost
14.414.4 millionmillion$ $
Coal 50.8% of production
Gas 35.9% of production
200 MWDemand ResponseDemand Response
PhotovoltaicPhotovoltaic
©Designed by Igor Aronovich
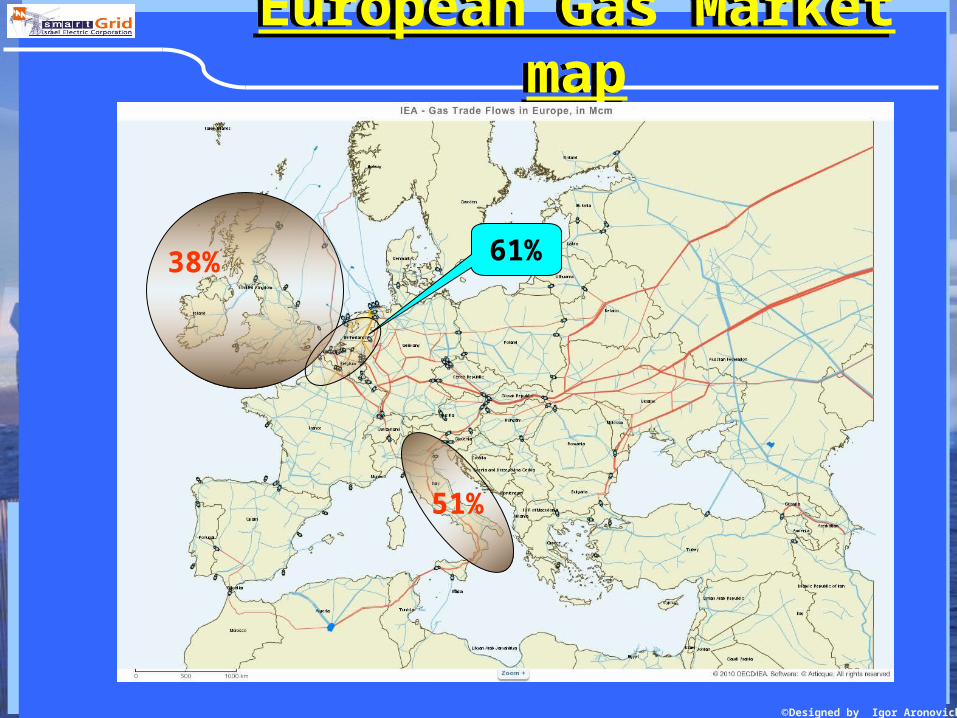
European Gas Market map
European Gas Market map
38%
51%
61%
©Designed by Igor Aronovich
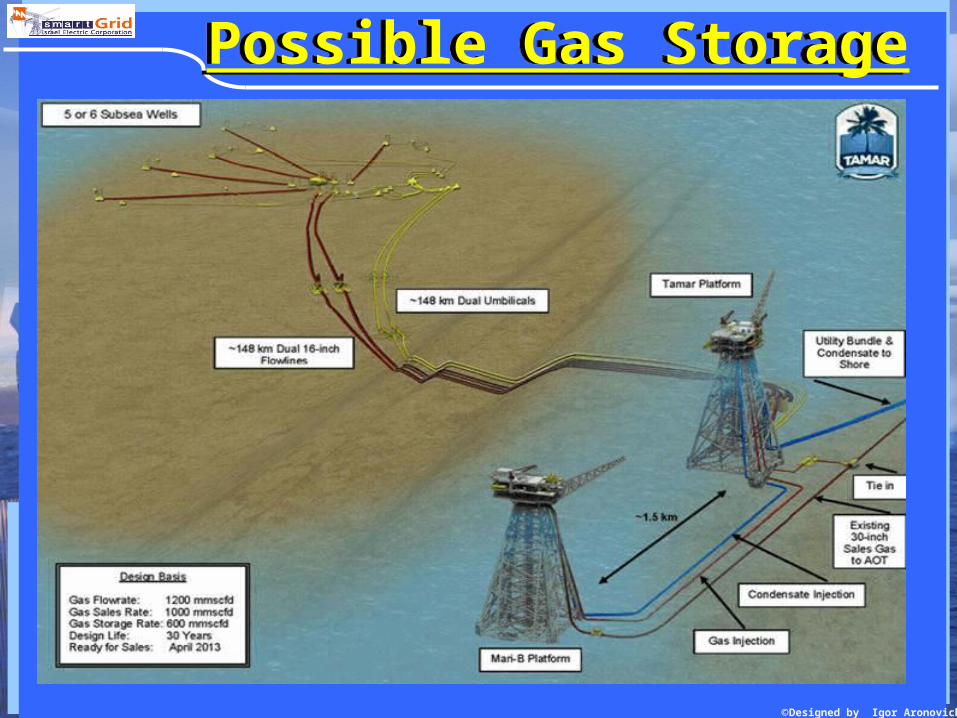
Possible Gas StoragePossible Gas Storage
©Designed by Igor Aronovich
58
60
62
64
66
68
70
72
74
6:00
8:00
10:0
0
12:0
0
14:0
0
16:0
0
18:0
0
20:0
0
22:0
0
0:00
2:00
4:00
6:00
8:00
10:0
0
MMBTU
0
5000
10000
15000
20000
25000MW
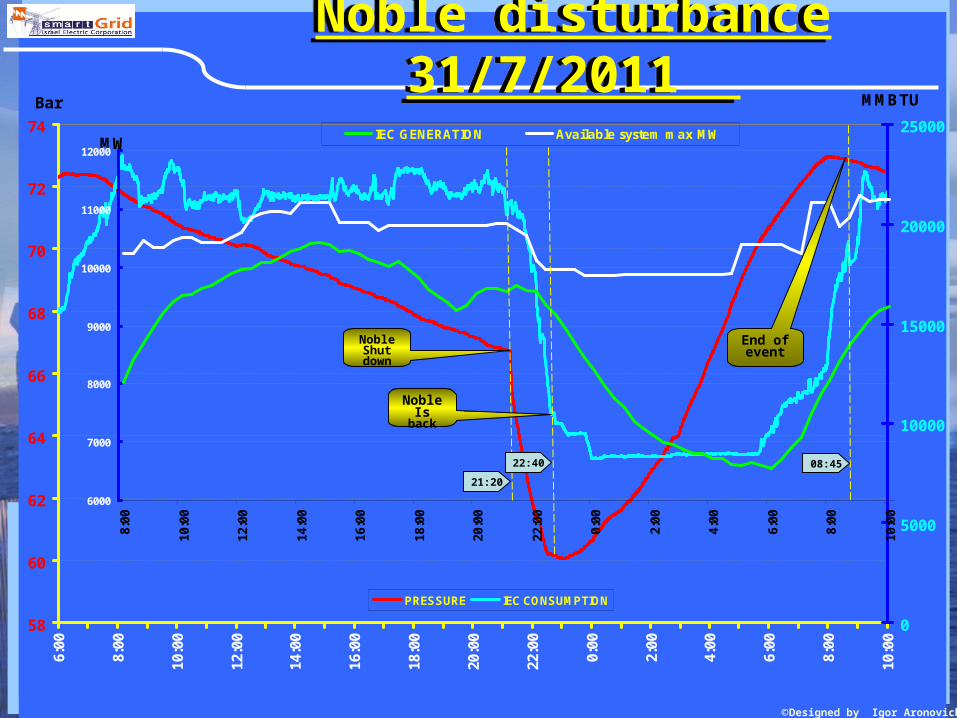
PRESSURE IEC CONSUMPTION
6000
7000
8000
9000
10000
11000
12000
8:00
10:0
0
12:0
0
14:0
0
16:0
0
18:0
0
20:0
0
22:0
0
0:00
2:00
4:00
6:00
8:00
10:0
0
IEC GENERATION Available system max MW
Bar
21:20
NobleShut down
08:45
End ofevent
22:40
NobleIs back
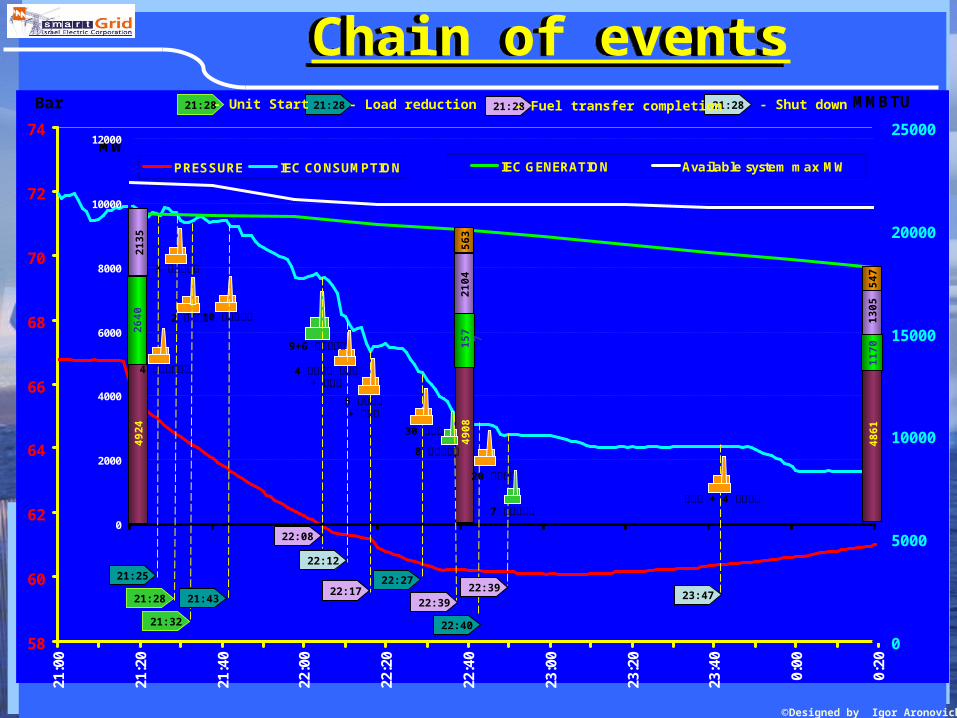
Noble disturbance 31/7/2011
Noble disturbance 31/7/2011
©Designed by Igor Aronovich
58
60
62
64
66
68
70
72
74
21:0
0
21:2
0
21:4
0
22:0
0
22:2
0
22:4
0
23:0
0
23:2
0
23:4
0
0:00
0:20
MMBTU
0
5000
10000
15000
20000
25000MW
PRESSURE IEC CONSUMPTION
0
2000
4000
6000
8000
10000
12000
IEC GENERATION Available system max MW
Bar
4924
2640
2135
4908
1577
2104
563
4861
1305
547
1170
21:28
3אשכול
2צפית
21:32
21:28 21:28 21:28 21:28- Unit Start - Load reduction
21:25
4רידינג
10אשכול
21:43
4רמת חובב דוד +
22:12
5חגית דוד +
22:1722:27
30גזר
20חגית
22:40
9+6אשכול
22:08
22:39
8אשכול
22:39
7אשכול + דוד4חגית
23:47
Chain of eventsChain of events- Fuel transfer completion - Shut down
©Designed by Igor Aronovich
6000
6500
7000
7500
8000
8500
9000
9500
10000
10500
0:00 12:00 0:00 12:00 0:00 12:00 0:00 12:00 0:00
MW
Hour
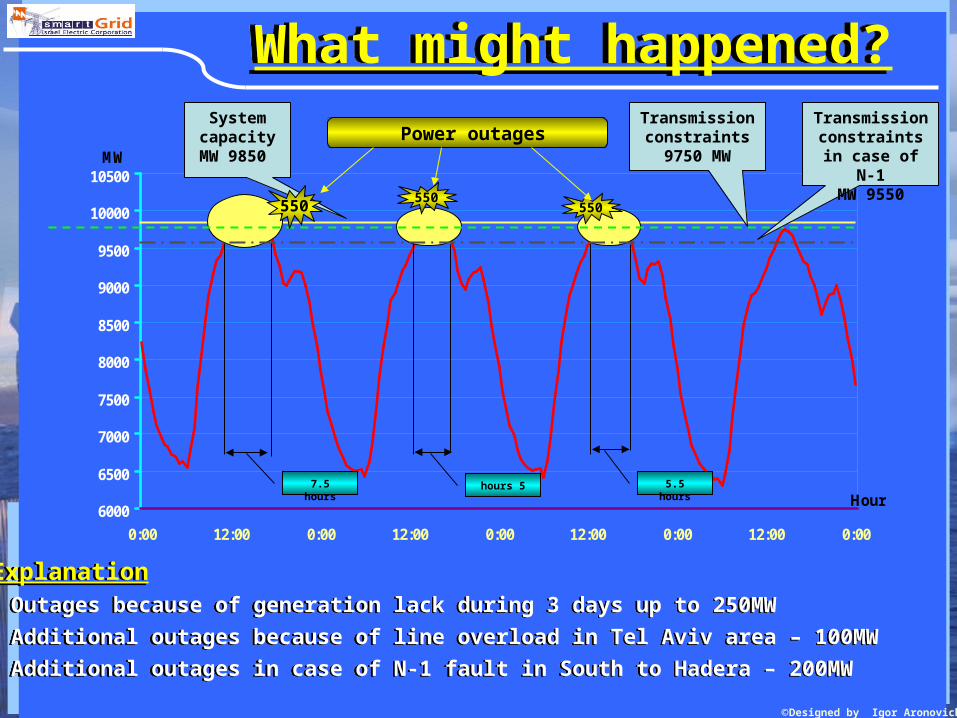
System capacity
9850 MW
7.5 hours 5 hours 5.5 hours
Transmission constraints
9750 MW
Transmission constraints in
case of N-19550 MW
What might happened?What might happened?
Explanation Outages because of generation lack during 3 days up to 250MW Additional outages because of line overload in Tel Aviv area – 100MW Additional outages in case of N-1 fault in South to Hadera – 200MW
Explanation Outages because of generation lack during 3 days up to 250MW Additional outages because of line overload in Tel Aviv area – 100MW Additional outages in case of N-1 fault in South to Hadera – 200MW
550550
550
Power outages
©Designed by Igor Aronovich
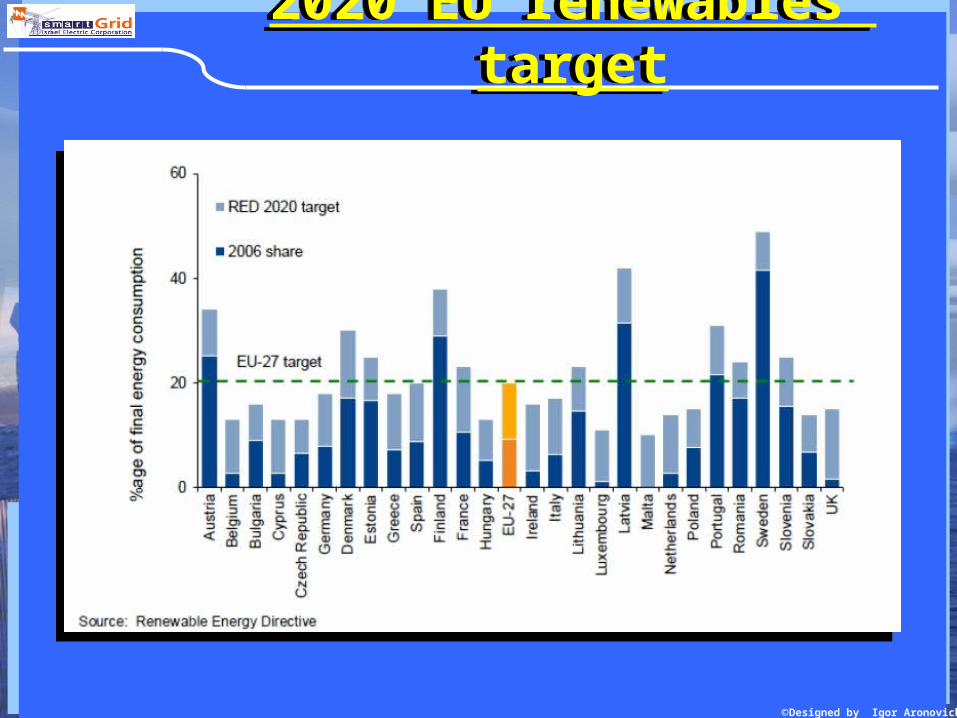
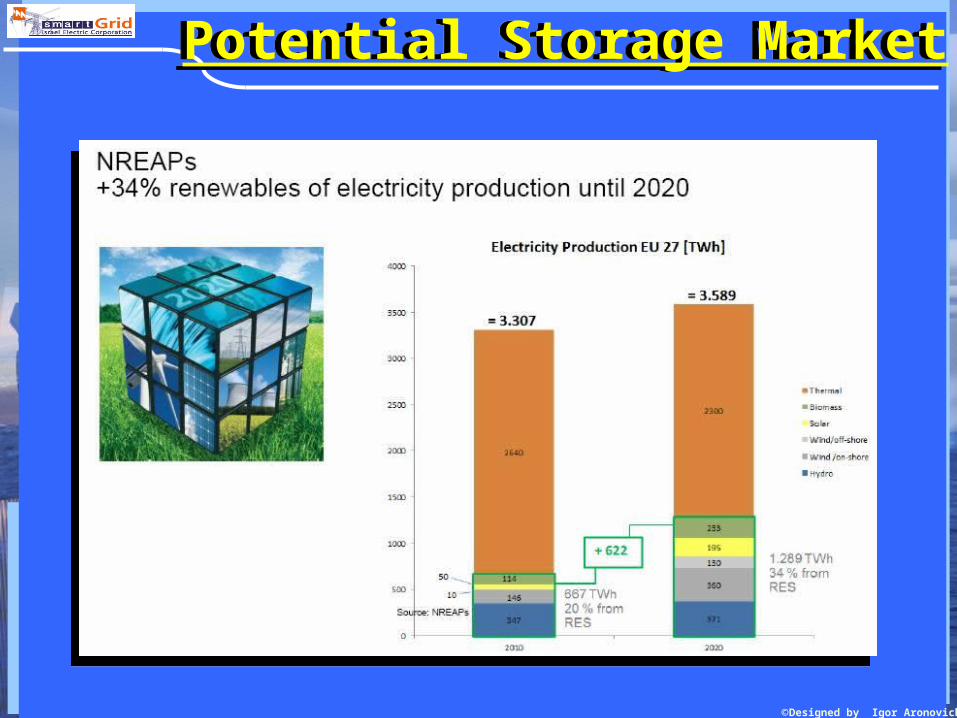
2020 EU renewables’ target
2020 EU renewables’ target
©Designed by Igor Aronovich
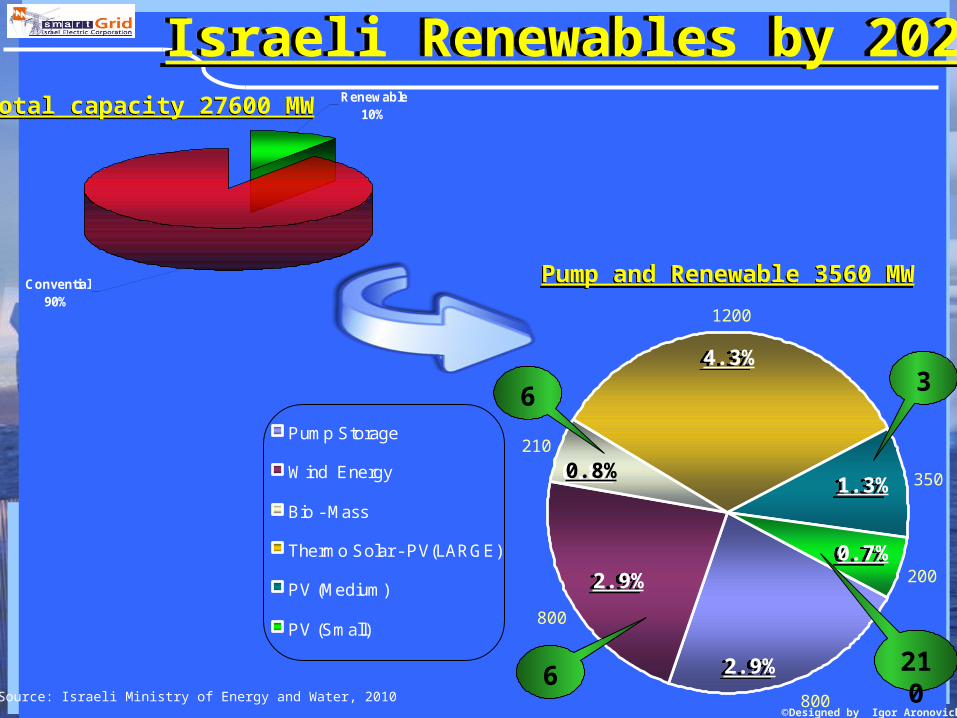
Israeli Renewables by 2020Israeli Renewables by 2020
800
800
210
1200
350
200
Pump Storage
Wind Energy
Bio - Mass
Thermo Solar - PV(LARGE)
PV (Medium)
PV (Small)
2.9%2.9%
2.9%2.9%
0.8%0.8%
0.7%0.7%
1.3%1.3%
4.3%4.3%
Convential90%
Renewable10%Total capacity 27600 MWTotal capacity 27600 MW
Pump and Renewable 3560 MWPump and Renewable 3560 MW
3
210Source: Israeli Ministry of Energy and Water, 2010
6
6
©Designed by Igor Aronovich
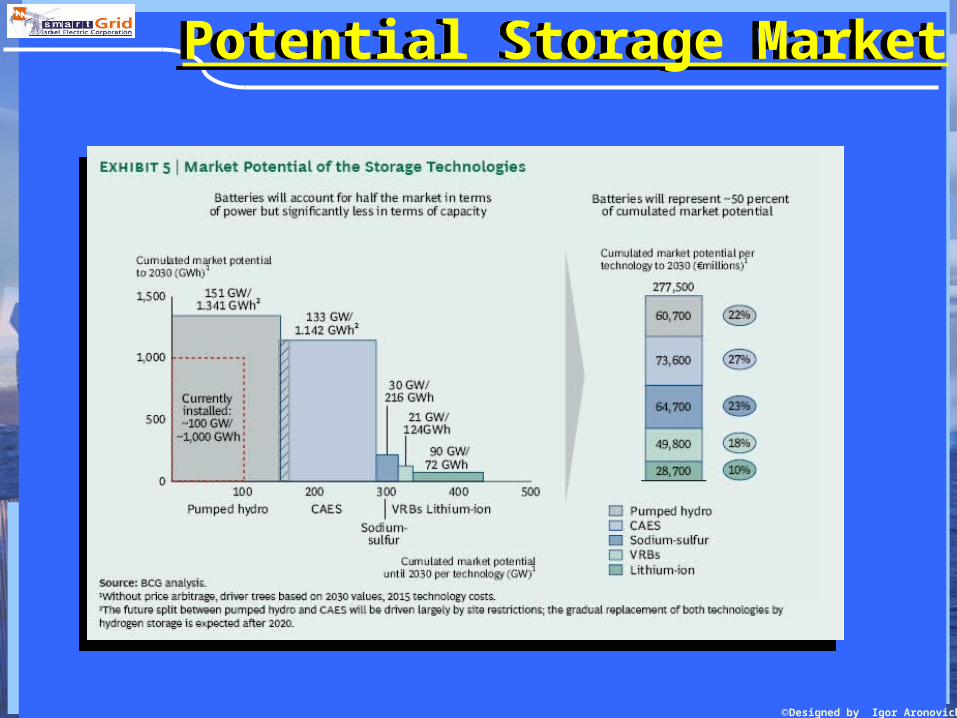
Potential Storage MarketPotential Storage Market
©Designed by Igor Aronovich
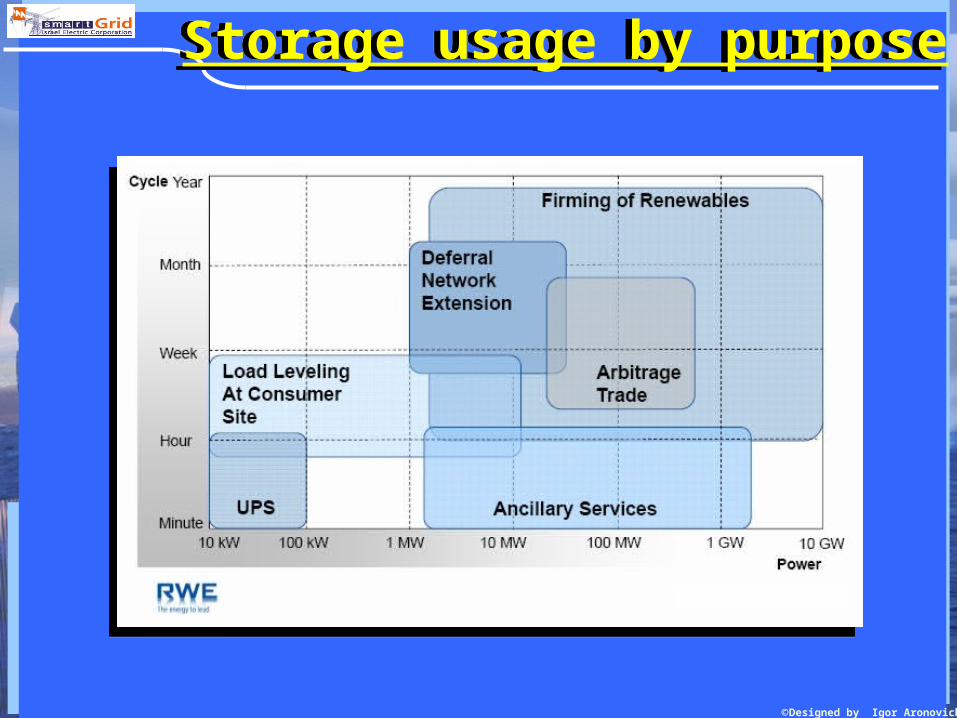
Storage usage by purposeStorage usage by purpose
©Designed by Igor Aronovich
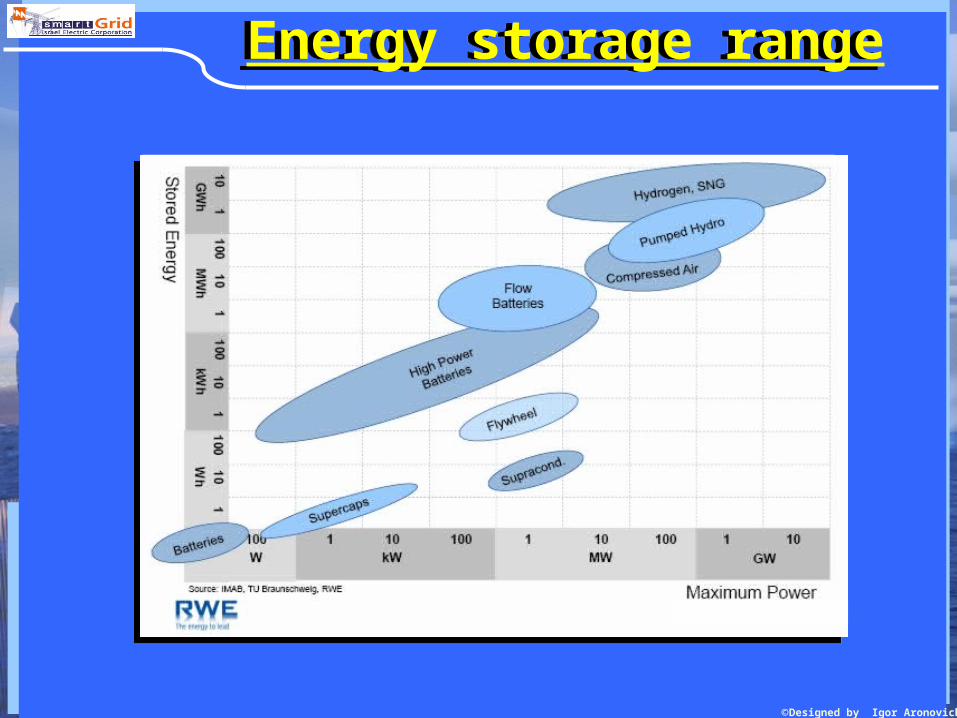
Energy storage rangeEnergy storage range
©Designed by Igor Aronovich
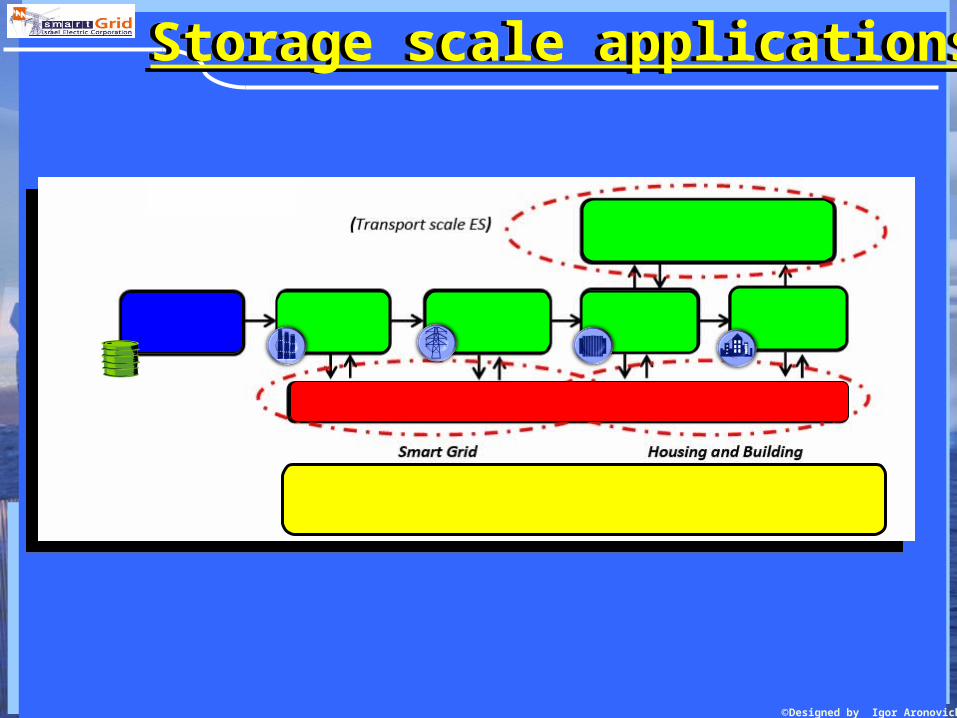
Storage scale applicationsStorage scale applications
©Designed by Igor Aronovich
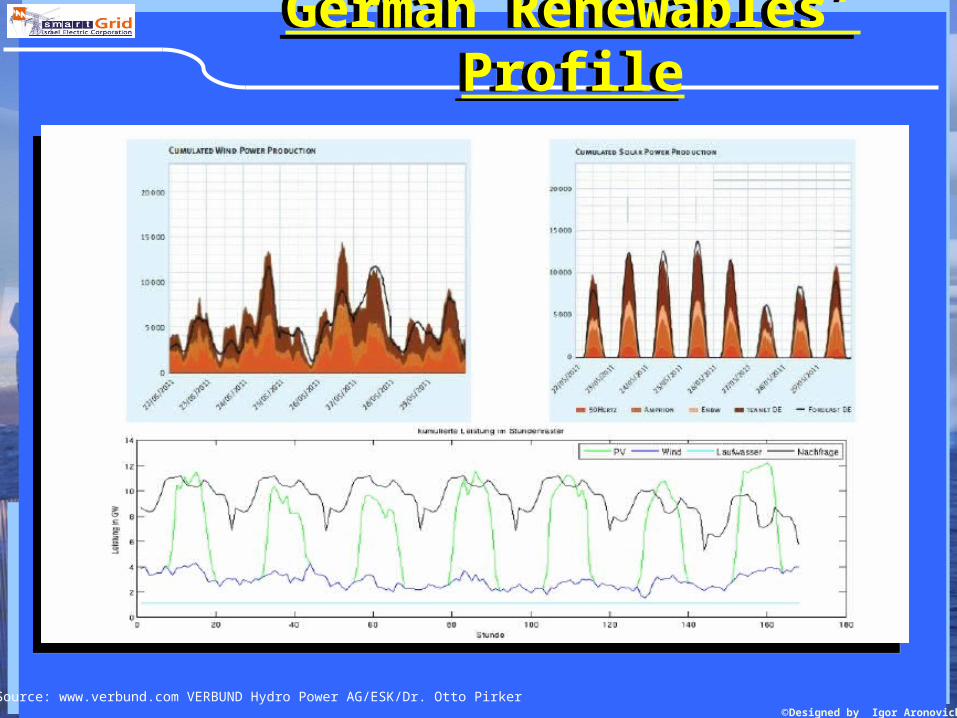
German Renewables’ Profile
German Renewables’ Profile
Source: www.verbund.com VERBUND Hydro Power AG/ESK/Dr. Otto Pirker
©Designed by Igor Aronovich
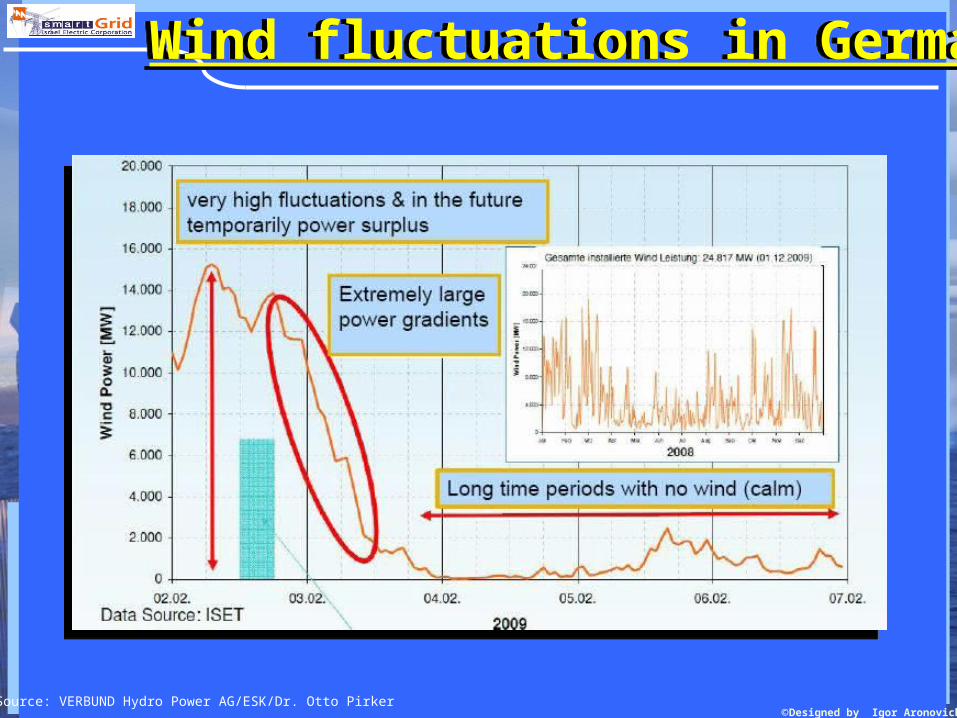
Wind fluctuations in GermanWind fluctuations in German
Source: VERBUND Hydro Power AG/ESK/Dr. Otto Pirker
©Designed by Igor Aronovich
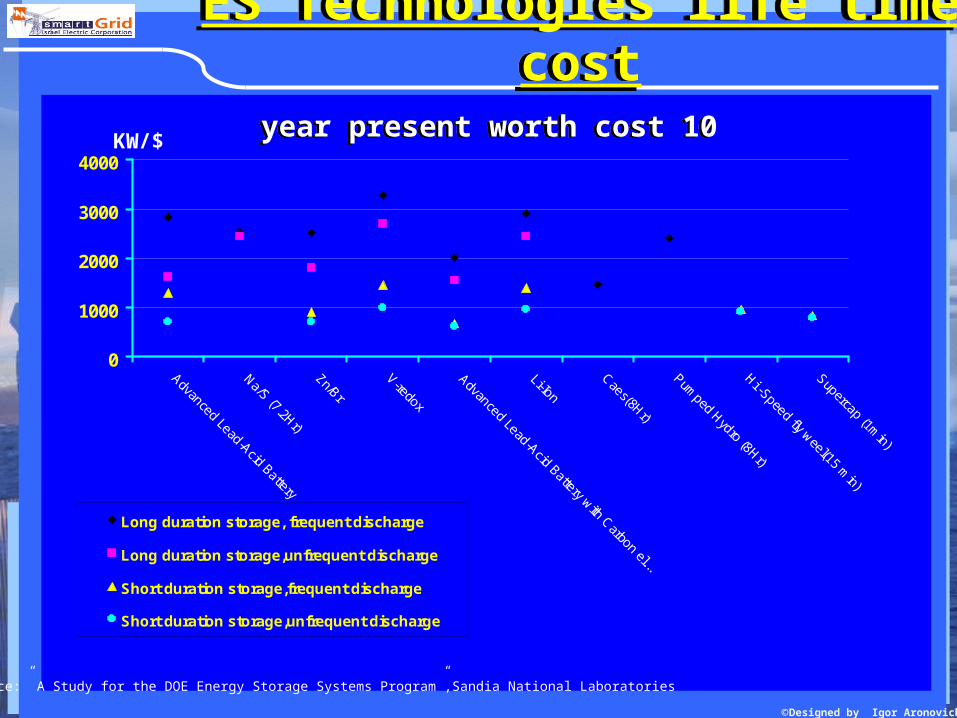
ES Technologies life time cost
ES Technologies life time cost
0
1000
2000
3000
4000
Advanced Lead-Acid Battery
Na/S (7.2Hr)
Zn/Br
V-redox
Advanced Lead-Acid Battery with Carbon el...
Li-Ion
Caes(8Hr)
Pumped Hydro (8Hr)
Hi -Speed fly weel(15 min)
Supercap (1min)
Long duration storage, frequent discharge
Long duration storage,unfrequent discharge
Short duration storage,frequent discharge
Short duration storage,unfrequent discharge
10 year present worth cost 10 year present worth cost/$KW
Source:” A Study for the DOE Energy Storage Systems Program”,Sandia National Laboratories
©Designed by Igor Aronovich
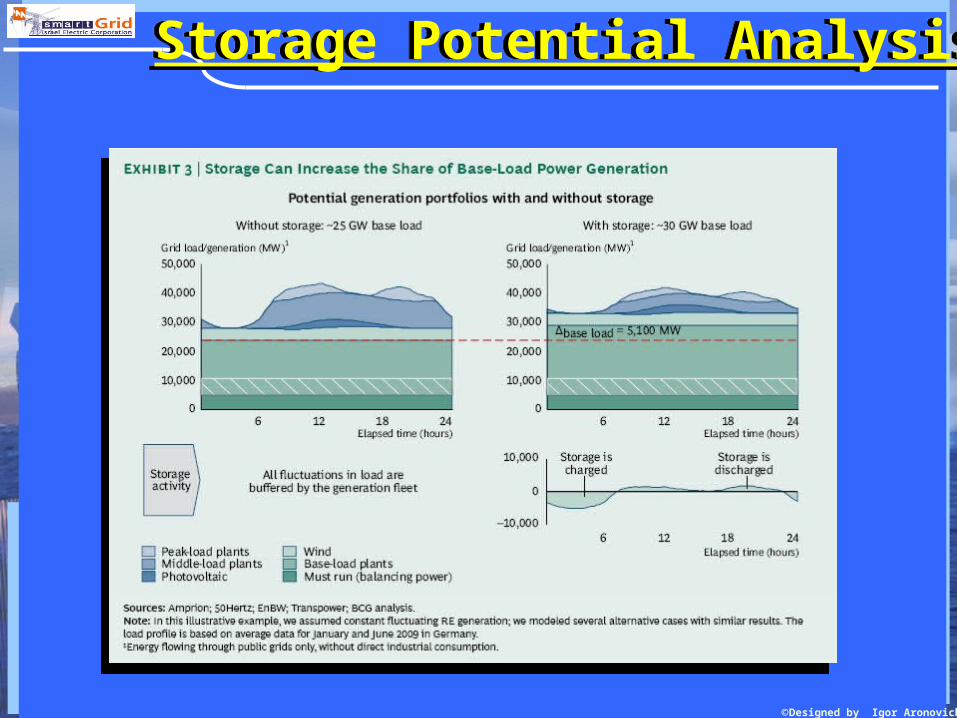
Storage Potential Analysis Storage Potential Analysis
©Designed by Igor Aronovich
Potential Storage MarketPotential Storage Market
©Designed by Igor Aronovich
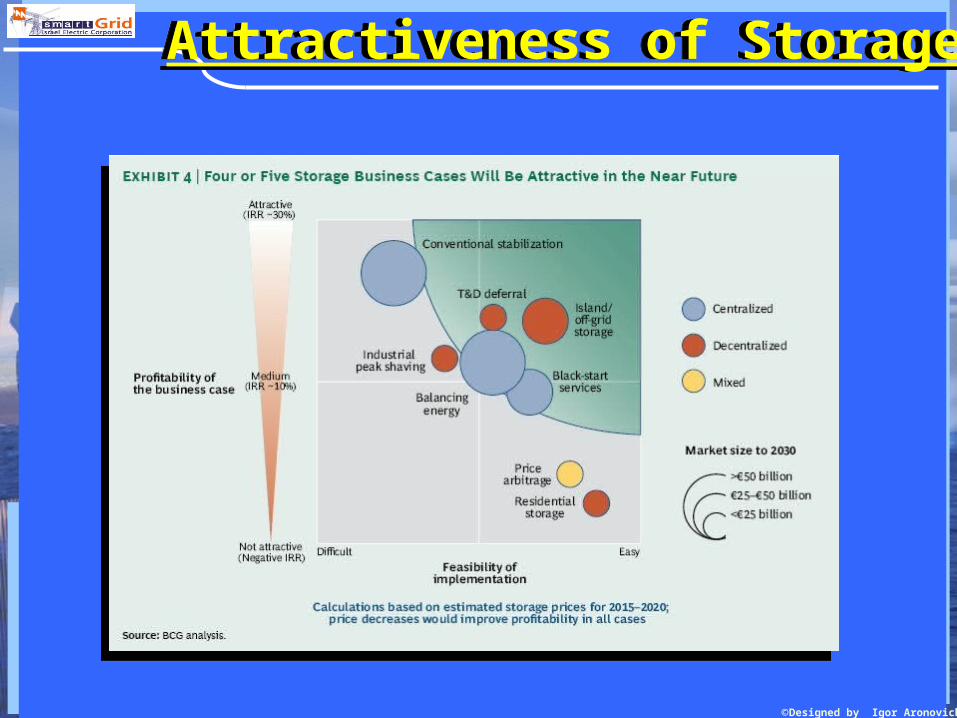
Attractiveness of StorageAttractiveness of Storage
©Designed by Igor Aronovich
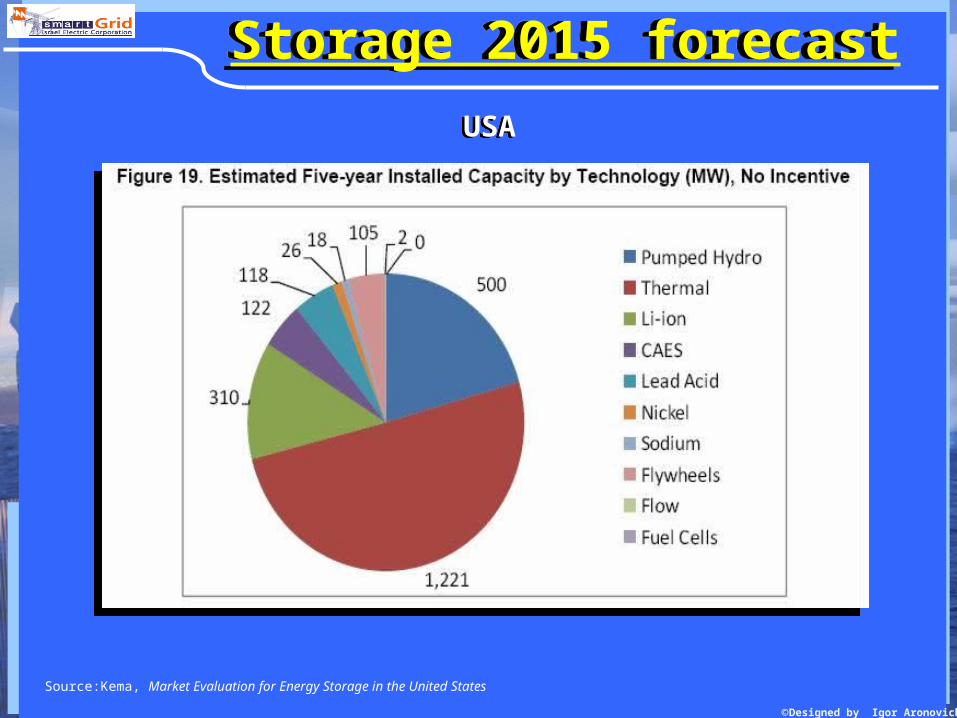
Storage 2015 forecastStorage 2015 forecast
Source:Kema, Market Evaluation for Energy Storage in the United States
USAUSA
©Designed by Igor Aronovich
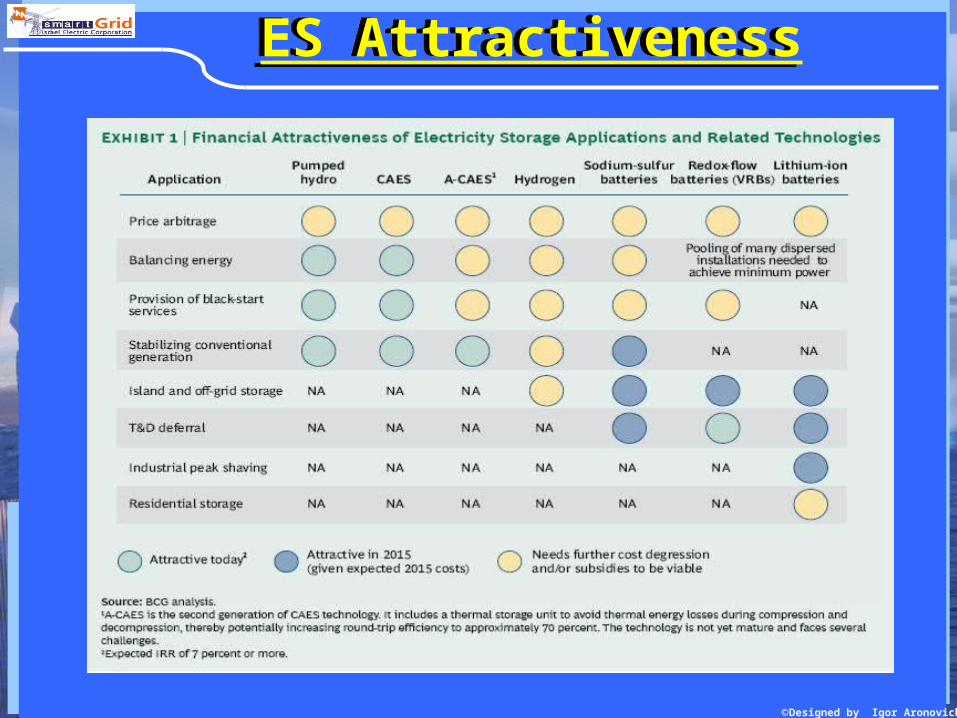
ES AttractivenessES Attractiveness
©Designed by Igor Aronovich
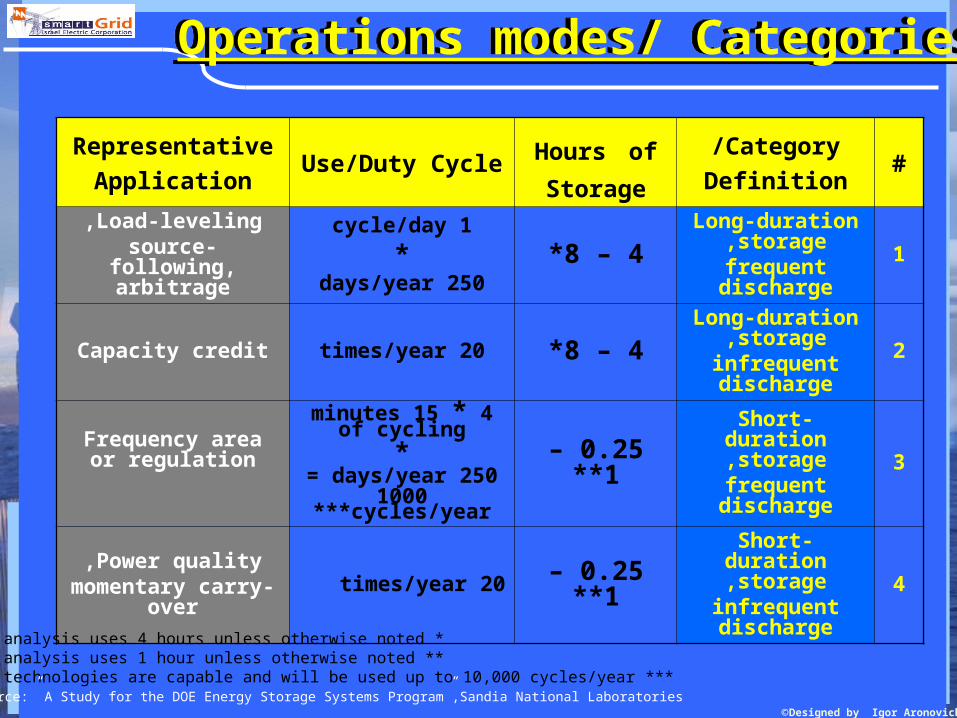
Operations modes/ CategoriesOperations modes/ Categories
#Category/
DefinitionHours of
StorageUse/Duty Cycle
Representative
Application
1
Long-duration storage,
frequent discharge
4 – 8*1 cycle/day
*250 days/year
Load-leveling,source-following,
arbitrage
2
Long-duration storage,
infrequent discharge
4 – 8*20 times/yearCapacity credit
3
Short-duration storage,
frequent discharge
0.25 – 1**
4 * 15 minutes of cycling
*250 days/year= 1000 cycles/year***
Frequency area or regulation
4
Short-duration storage,
infrequent discharge
0.25 – 1**20 times/yearPower quality,
momentary carry-over
*This analysis uses 4 hours unless otherwise noted **This analysis uses 1 hour unless otherwise noted
***Some technologies are capable and will be used up to 10,000 cycles/yearSource:” A Study for the DOE Energy Storage Systems Program”,Sandia National Laboratories
©Designed by Igor Aronovich
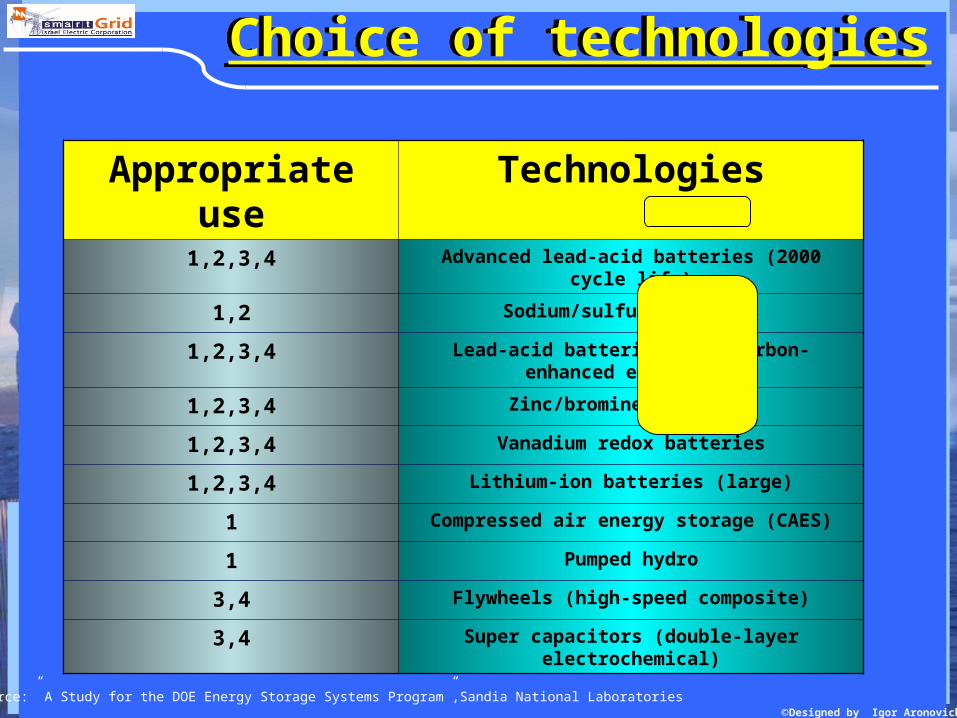
Choice of technologiesChoice of technologies
TechnologiesAppropriate useAdvanced lead-acid batteries (2000 cycle life)1,2,3,4
Sodium/sulfur batteries1,2
Lead-acid batteries with carbon-enhanced electrodes
1,2,3,4
Zinc/bromine batteries1,2,3,4
Vanadium redox batteries1,2,3,4
Lithium-ion batteries (large)1,2,3,4
Compressed air energy storage (CAES)1
Pumped hydro1
Flywheels (high-speed composite)3,4
Super capacitors (double-layer electrochemical)3,4
Source:” A Study for the DOE Energy Storage Systems Program”,Sandia National Laboratories
©Designed by Igor Aronovich
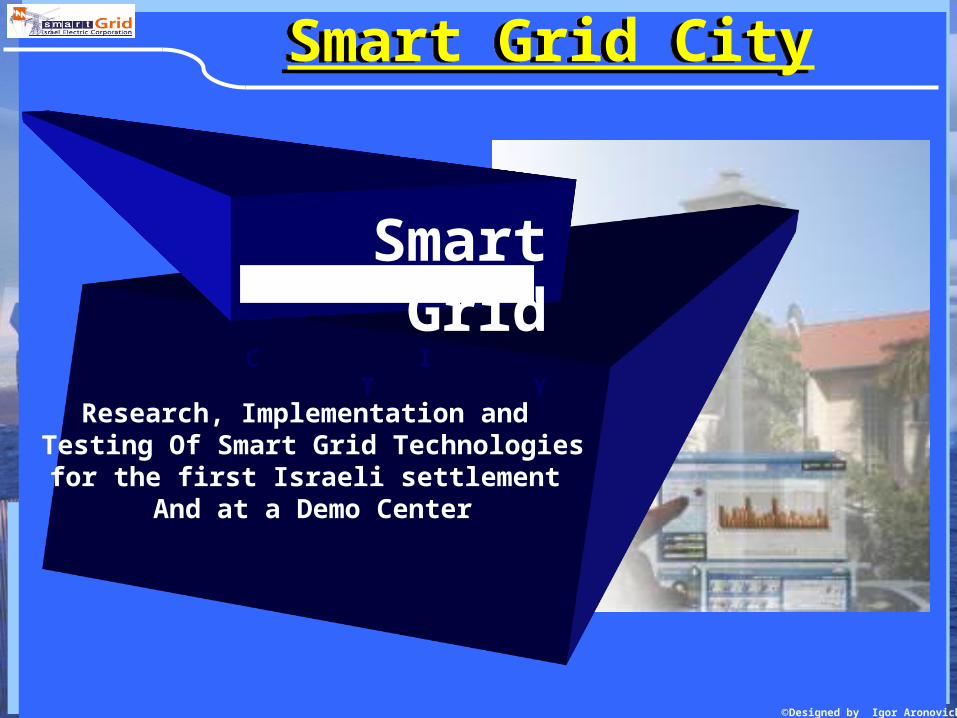
Smart Grid CitySmart Grid City
Research, Implementation and Testing Of Smart Grid Technologies
for the first Israeli settlementAnd at a Demo Center
Smart Grid C I T Y
©Designed by Igor Aronovich
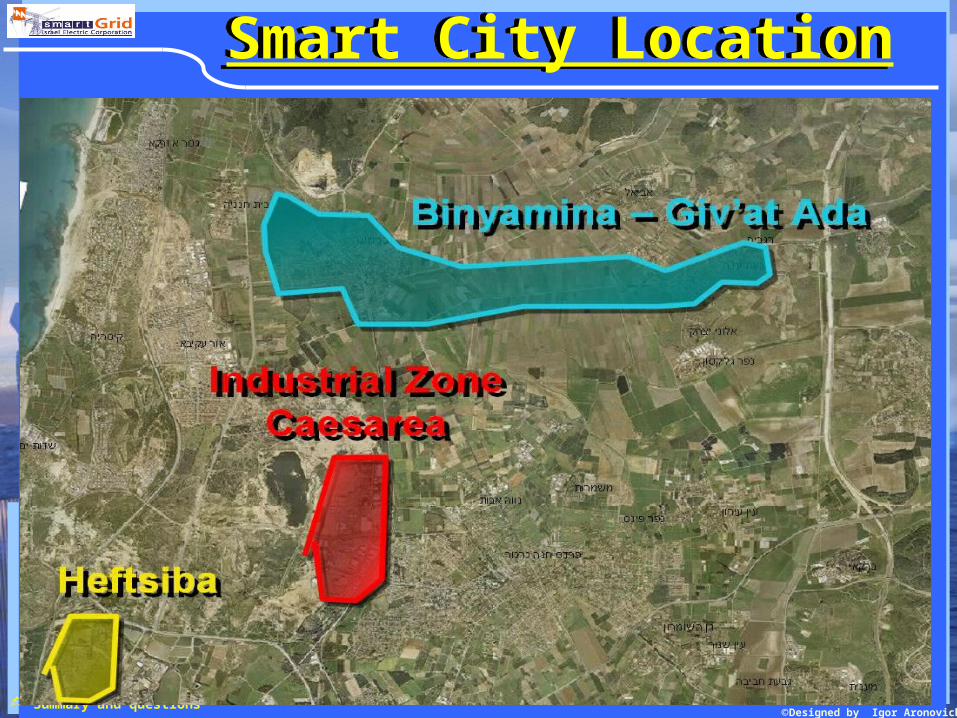
Smart City LocationSmart City Location
Summary and questions
©Designed by Igor Aronovich
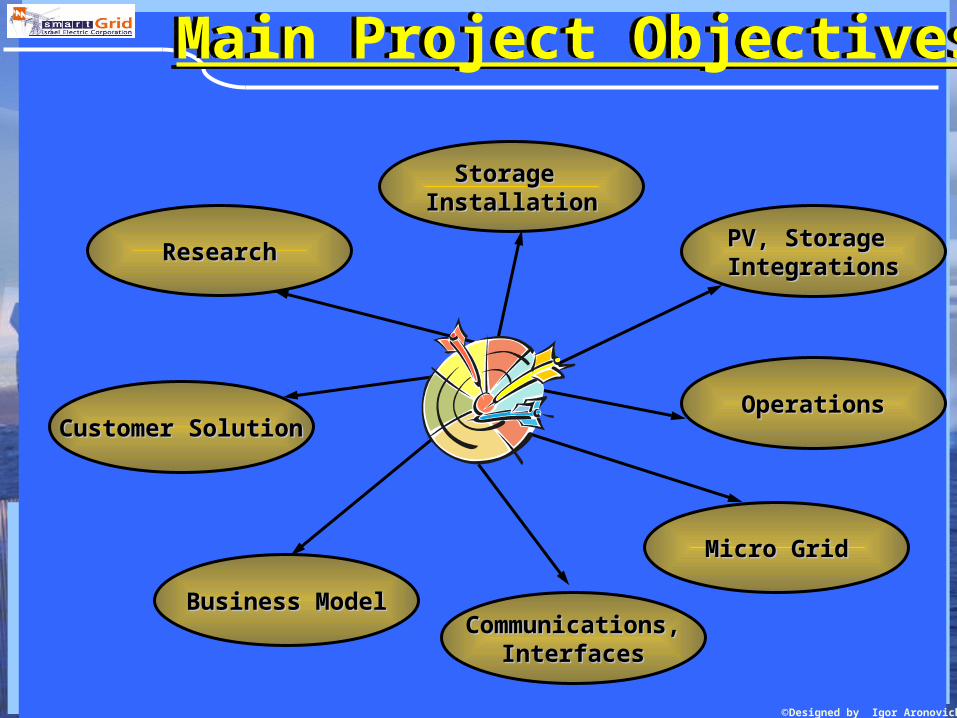
Customer SolutionCustomer Solution
Business ModelBusiness Model
Micro GridMicro Grid
Storage Storage InstallationInstallation
ResearchResearch PV, Storage PV, Storage IntegrationsIntegrations
OperationsOperations
Communications,Communications,InterfacesInterfaces
Main Project ObjectivesMain Project Objectives
©Designed by Igor Aronovich
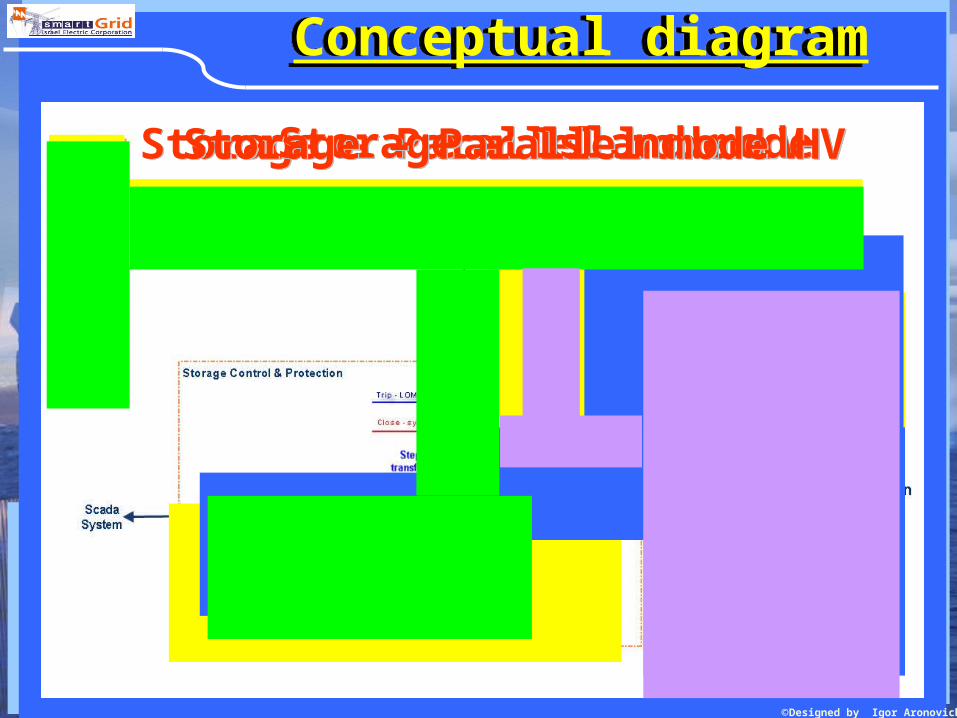
Conceptual diagramConceptual diagram
Storage – Parallel mode LV Storage – Parallel mode LV Storage – Island mode Storage – Island mode Storage – Parallel mode HV Storage – Parallel mode HV
©Designed by Igor Aronovich
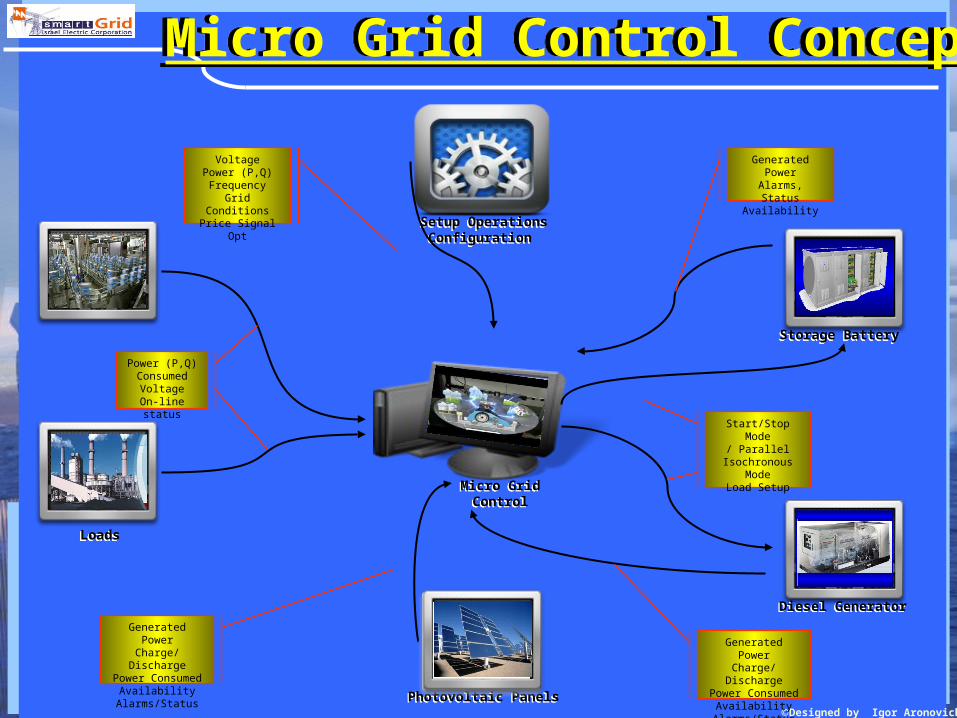
Micro Grid Control ConceptMicro Grid Control Concept
Setup Operations Configuration
Setup Operations Configuration
Photovoltaic PanelsPhotovoltaic Panels
Diesel GeneratorDiesel Generator
Storage BatteryStorage Battery
LoadsLoads
Start/Stop ModeParallel/
Isochronous Mode
Load Setup
VoltagePower (P,Q)Frequency
Grid ConditionsPrice Signal Opt
Power (P,Q)Consumed
VoltageOn-line status
Generated PowerAlarms, Status
Availability
Generated PowerCharge/DischargePower Consumed
AvailabilityAlarms/Status
Generated PowerCharge/DischargePower Consumed
AvailabilityAlarms/Status
Micro GridControl
Micro GridControl
©Designed by Igor Aronovich
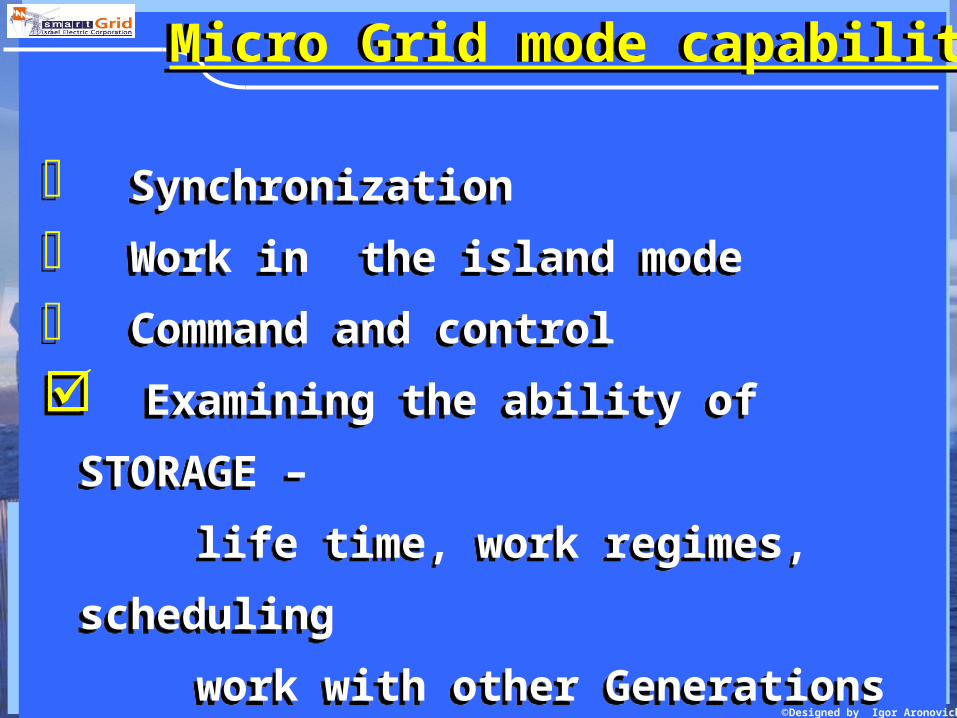
Micro Grid mode capabilityMicro Grid mode capability
Synchronization
Work in the island mode
Command and control
Examining the ability of STORAGE –
life time, work regimes, scheduling
work with other Generations means
Synchronization
Work in the island mode
Command and control
Examining the ability of STORAGE –
life time, work regimes, scheduling
work with other Generations means
©Designed by Igor Aronovich
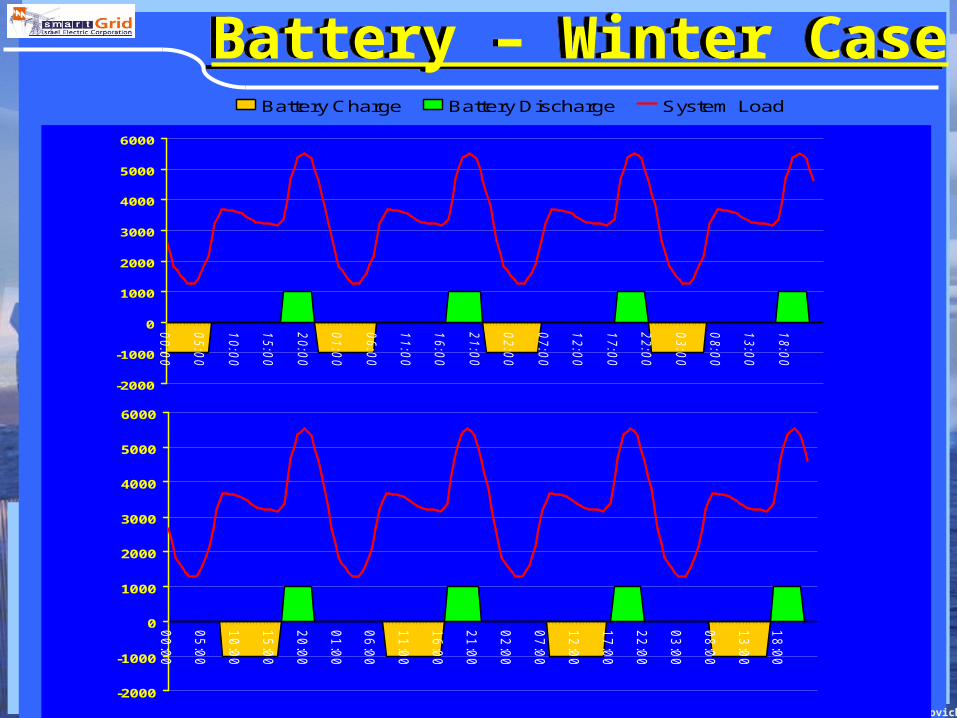
Battery – Winter CaseBattery – Winter Case
-2000
-1000
0
1000
2000
3000
4000
5000
6000
00
:00
05
:00
10
:00
15
:00
20
:00
01
:00
06
:00
11
:00
16
:00
21
:00
02
:00
07
:00
12
:00
17
:00
22
:00
03
:00
08
:00
13
:00
18
:00
Battery Charge Battery Discharge System Load
-2000
-1000
0
1000
2000
3000
4000
5000
6000
00
:00
05
:00
10
:00
15
:00
20
:00
01
:00
06
:00
11
:00
16
:00
21
:00
02
:00
07
:00
12
:00
17
:00
22
:00
03
:00
08
:00
13
:00
18
:00
©Designed by Igor Aronovich
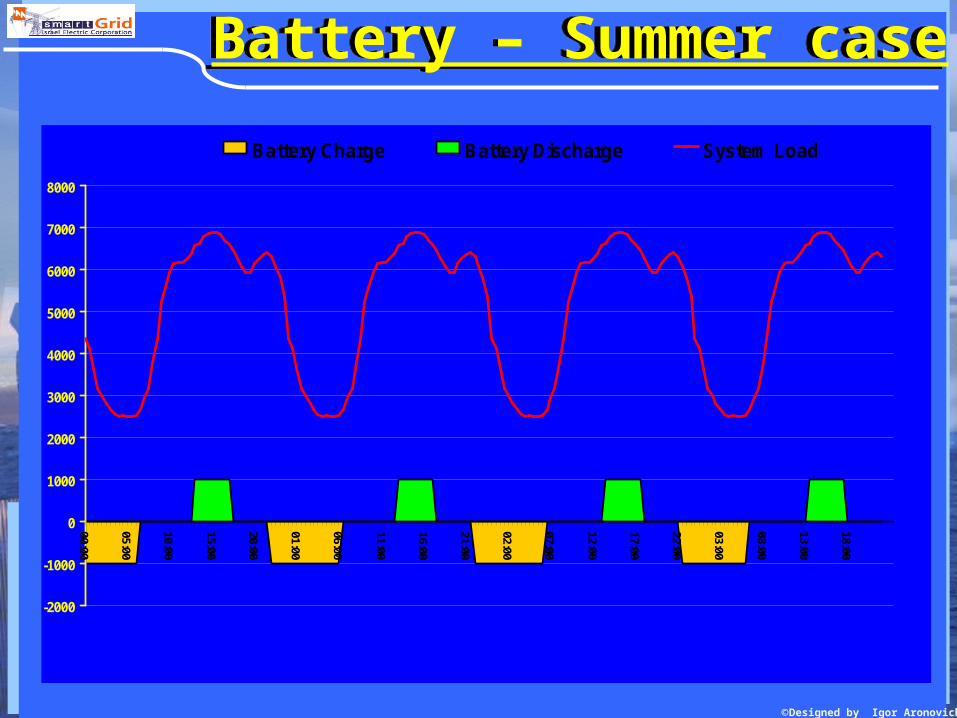
Battery – Summer caseBattery – Summer case
-2000
-1000
0
1000
2000
3000
4000
5000
6000
7000
8000
00:00
05:00
10:00
15:00
20:00
01:00
06:00
11:00
16:00
21:00
02:00
07:00
12:00
17:00
22:00
03:00
08:00
13:00
18:00
Battery Charge Battery Discharge System Load
©Designed by Igor Aronovich
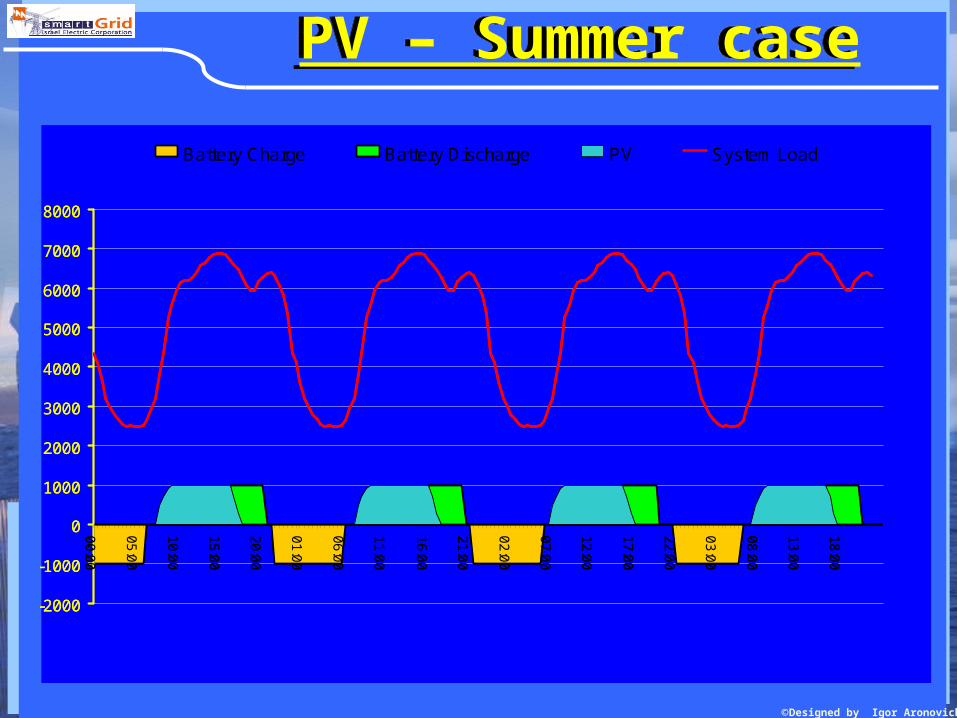
PV – Summer casePV – Summer case
-2000
-1000
0
1000
2000
3000
4000
5000
6000
7000
8000
00
:00
05
:00
10
:00
15
:00
20
:00
01
:00
06
:00
11
:00
16
:00
21
:00
02
:00
07
:00
12
:00
17
:00
22
:00
03
:00
08
:00
13
:00
18
:00
-2000
-1000
0
1000
2000
3000
4000
5000
6000
7000
8000
00
:00
05
:00
10
:00
15
:00
20
:00
01
:00
06
:00
11
:00
16
:00
21
:00
02
:00
07
:00
12
:00
17
:00
22
:00
03
:00
08
:00
13
:00
18
:00
Battery Charge Battery Discharge PV System Load
©Designed by Igor Aronovich
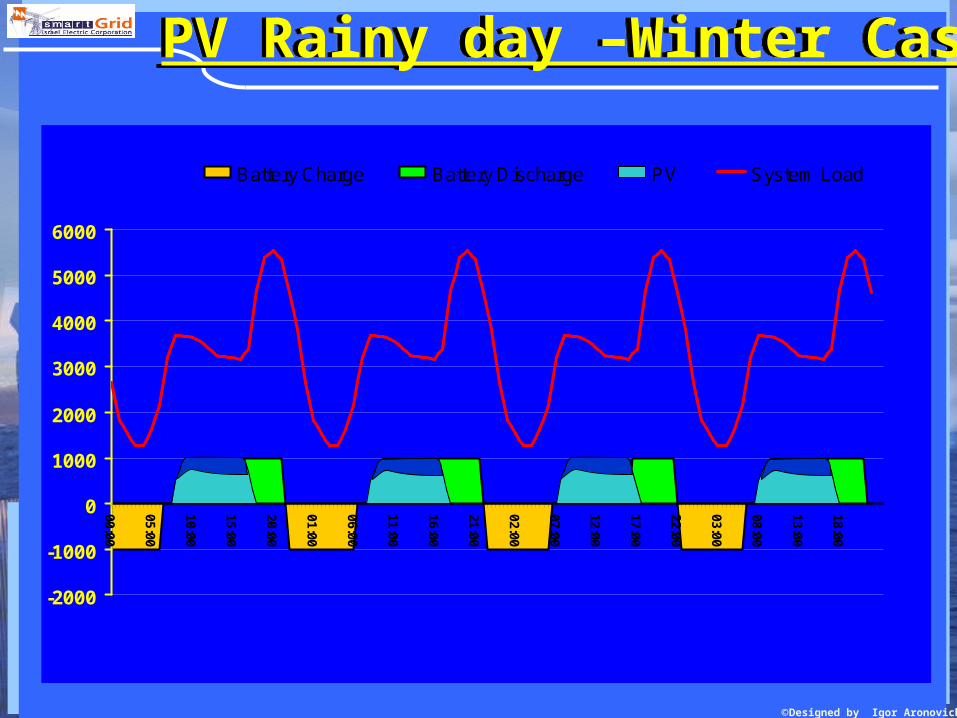
PV Rainy day –Winter CasePV Rainy day –Winter Case
-2000
-1000
0
1000
2000
3000
4000
5000
6000
00:00
05:00
10:00
15:00
20:00
01:00
06:00
11:00
16:00
21:00
02:00
07:00
12:00
17:00
22:00
03:00
08:00
13:00
18:00
Battery Charge Battery Discharge PV System Load
©Designed by Igor Aronovich
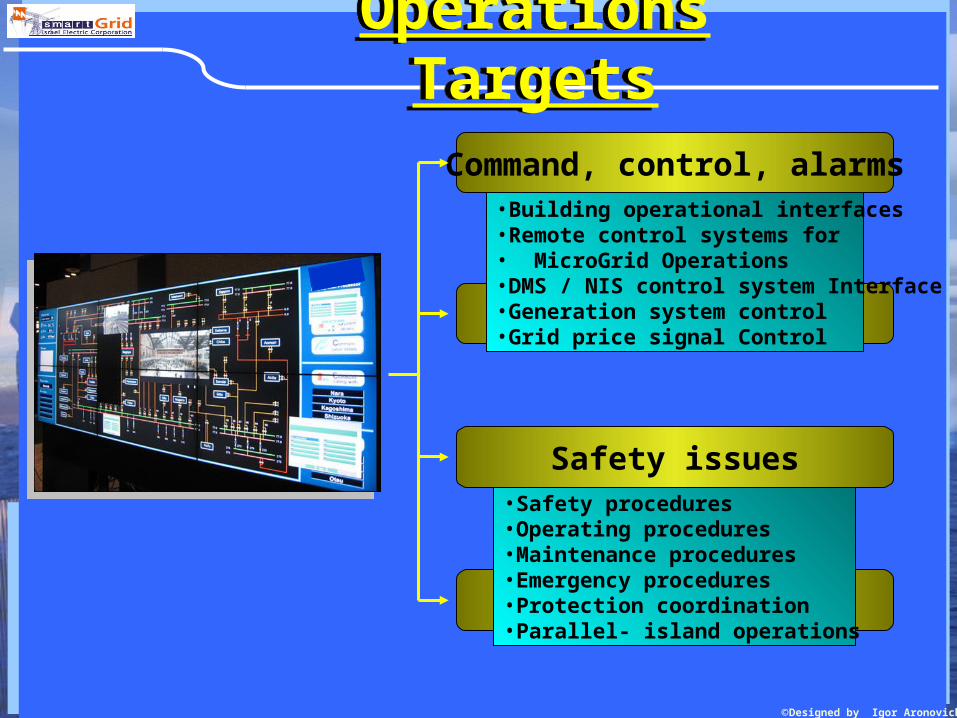
Operations Targets
Operations Targets
Operations regimes
Micro Grid Control
Command, control, alarms
Safety issues•Safety procedures•Operating procedures•Maintenance procedures•Emergency procedures•Protection coordination•Parallel- island operations
•Building operational interfaces •Remote control systems for• MicroGrid Operations•DMS / NIS control system Interface•Generation system control•Grid price signal Control
©Designed by Igor Aronovich
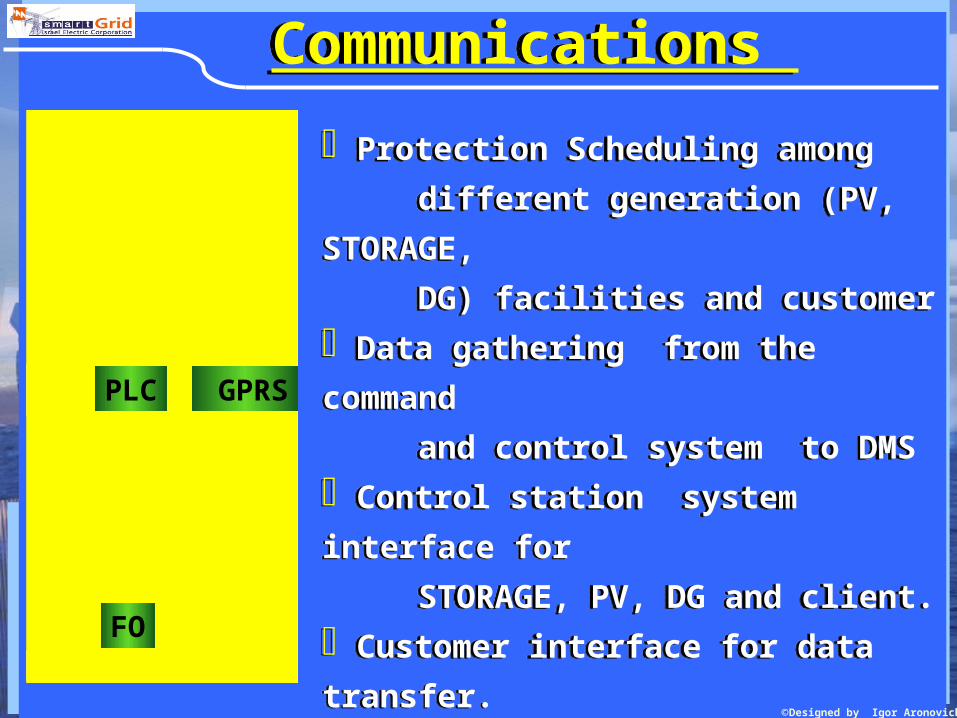
Communications Communications
Protection Scheduling among
different generation (PV, STORAGE,
DG) facilities and customer
Data gathering from the command
and control system to DMS
Control station system interface for
STORAGE, PV, DG and client.
Customer interface for data transfer.
Data transfer interfaces to the other
partners (historical data and / or real
time) without the ability to control.
GPRS
FO
PLC
©Designed by Igor Aronovich
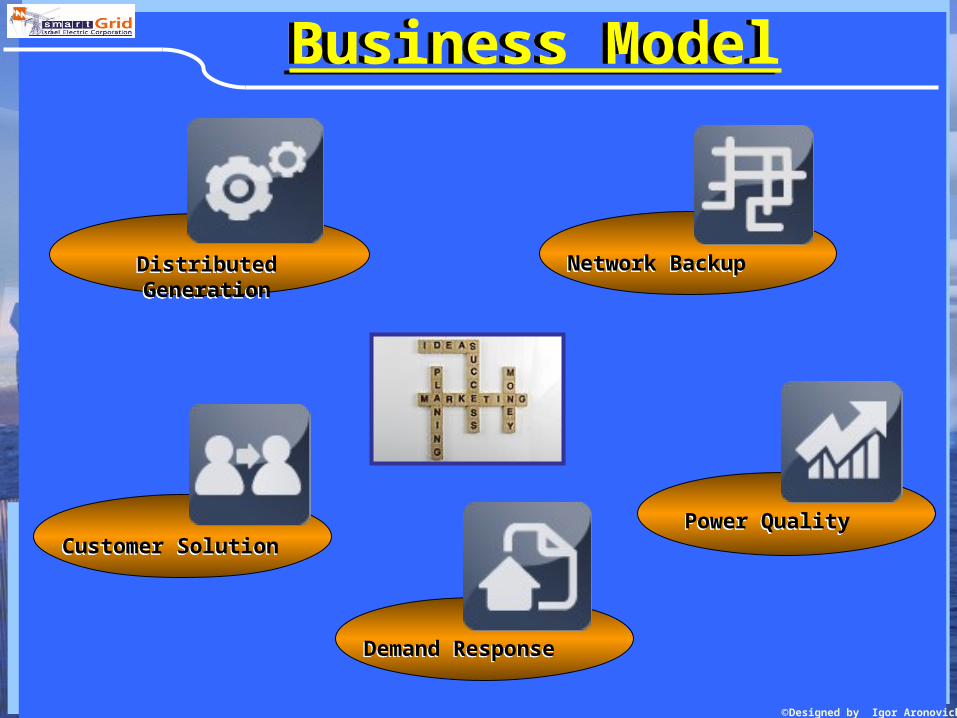
Business ModelBusiness Model
Customer SolutionCustomer SolutionPower QualityPower Quality
Demand ResponseDemand Response
Network BackupNetwork BackupDistributed GenerationDistributed Generation
©Designed by Igor Aronovich
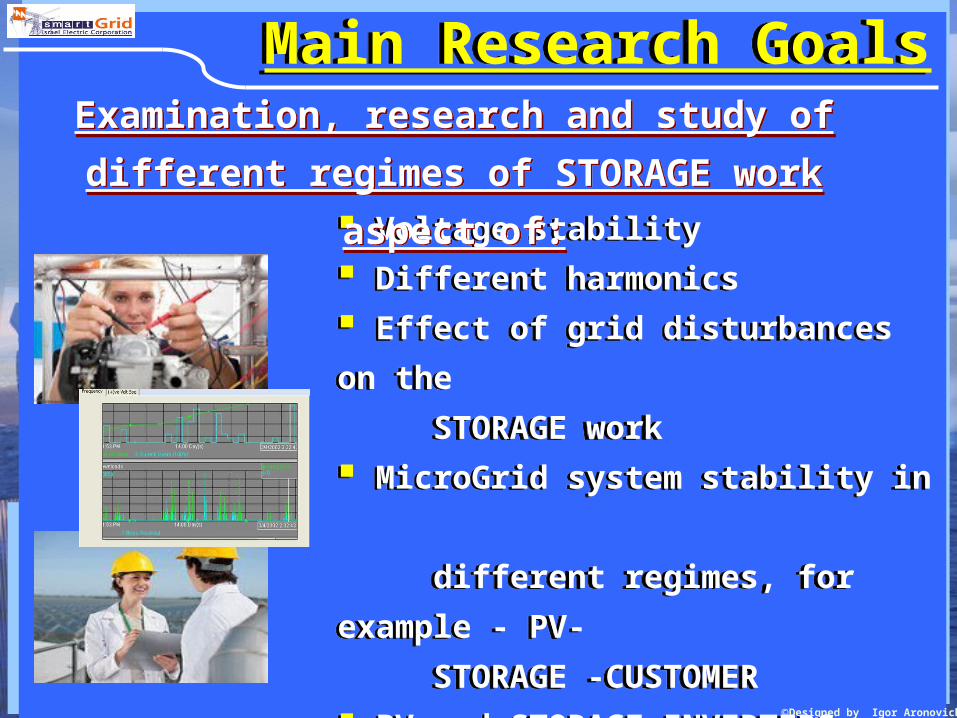
Main Research GoalsMain Research Goals
Voltage stability
Different harmonics
Effect of grid disturbances on the
STORAGE work
MicroGrid system stability in
different regimes, for example - PV-
STORAGE -CUSTOMER
PV and STORAGE INVERTERS
operations
INVERTER stability in regimes 1-2-4
Voltage stability
Different harmonics
Effect of grid disturbances on the
STORAGE work
MicroGrid system stability in
different regimes, for example - PV-
STORAGE -CUSTOMER
PV and STORAGE INVERTERS
operations
INVERTER stability in regimes 1-2-4
Examination, research and study of different
regimes of STORAGE work aspect of:
Examination, research and study of different
regimes of STORAGE work aspect of:
©Designed by Igor Aronovich
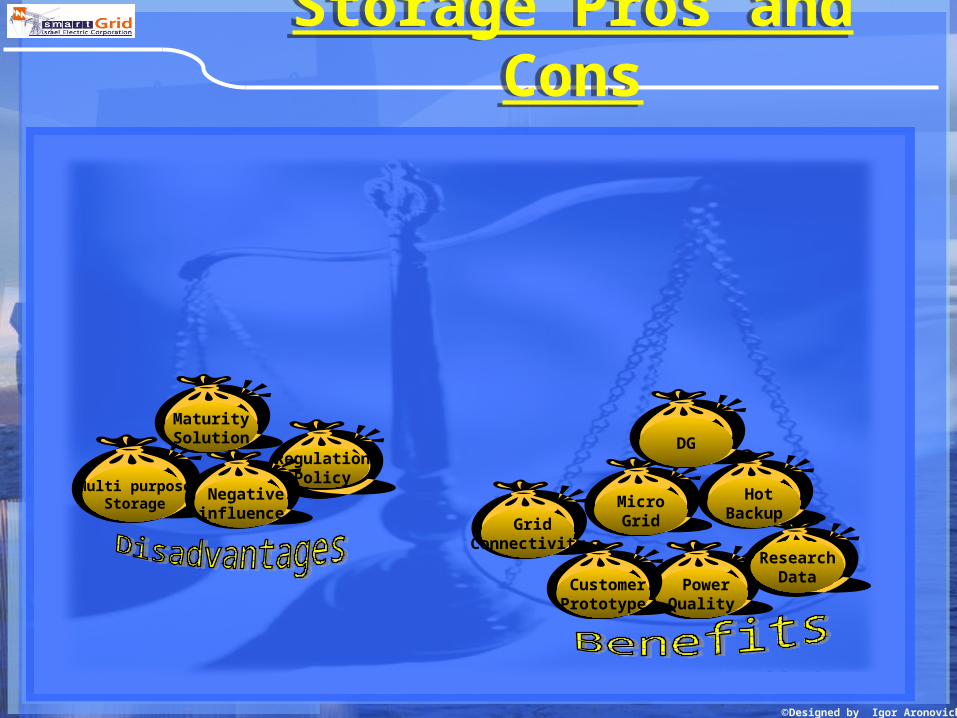
Storage Pros and Cons
Storage Pros and Cons
Multi purposeStorage
RegulationPolicy
Negative influence
Power Quality
ResearchData
MaturitySolution
Customer Prototype
Hot Backup
MicroGridGrid
Connectivity
DG
©Designed by Igor Aronovich
Thanks
and
your
Thanks
and
your
Questions
Questions
Igor AronovichSenior Deputy Operations ManagerSystem Operations, [email protected]
©Designed by Igor Aronovich
58
60
62
64
66
68
70
72
74
21:0
0
21:2
0
21:4
0
22:0
0
22:2
0
22:4
0
23:0
0
23:2
0
23:4
0
0:00
0:20
MMBTU
0
5000
10000
15000
20000
25000MW
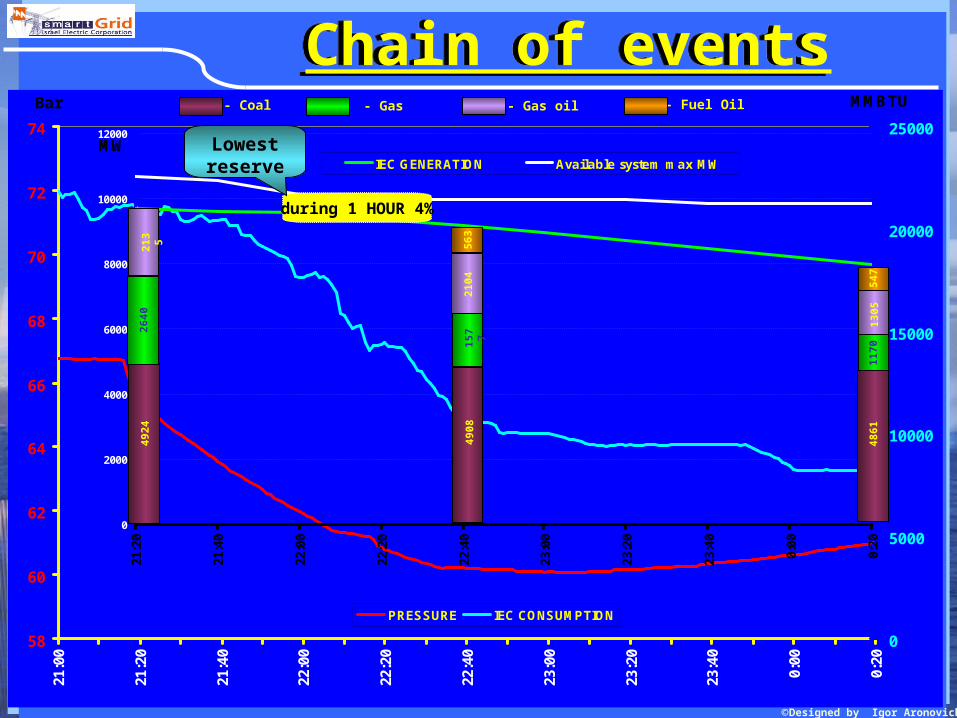
PRESSURE IEC CONSUMPTION
0
2000
4000
6000
8000
10000
1200021
:20
21:4
0
22:0
0
22:2
0
22:4
0
23:0
0
23:2
0
23:4
0
0:00
0:20
IEC GENERATION Available system max MW
Bar
4924
2640
2135
4908
1577
2104
563
4861
1305
547
1170
- Coal - Gas - Gas oil - Fuel Oil
Chain of eventsChain of events
4% during 1 HOUR
Lowestreserve