Embed Size (px)
DESCRIPTION
About Internet
Citation preview
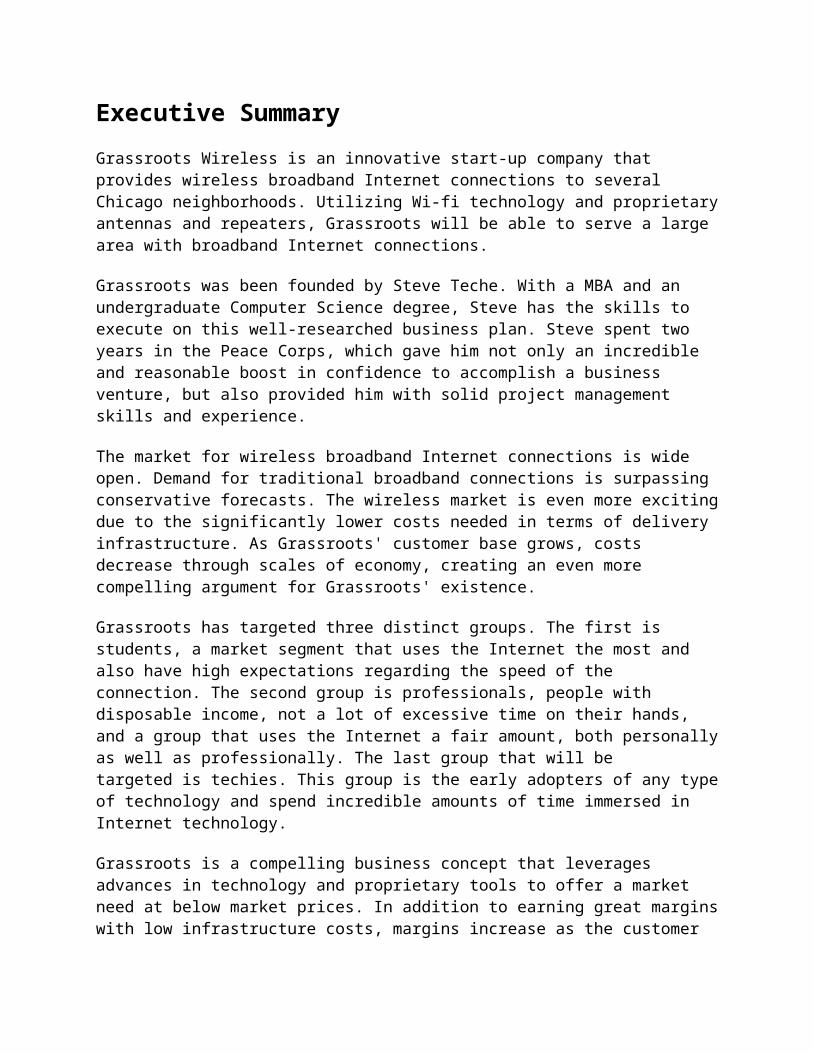
Executive Summary
Grassroots Wireless is an innovative start-up company that provides wireless broadband Internet connections to several Chicago neighborhoods. Utilizing Wi-fi technology and proprietary antennas and repeaters, Grassroots will be able to serve a large area with broadband Internet connections.
Grassroots was been founded by Steve Teche. With a MBA and an undergraduate Computer Science degree, Steve has the skills to execute on this well-researched business plan. Steve spent two years in the Peace Corps, which gave him not only an incredible and reasonable boost in confidence to accomplish a business venture, but also provided him with solid project management skills and experience.
The market for wireless broadband Internet connections is wide open. Demand for traditional broadband connections is surpassing conservative forecasts. The wireless market is even more exciting due to the significantly lower costs needed in terms of delivery infrastructure. As Grassroots' customer base grows, costs decrease through scales of economy, creating an even more compelling argument for Grassroots' existence.
Grassroots has targeted three distinct groups. The first is students, a market segment that uses the Internet the most and also have high expectations regarding the speed of the connection. The second group is professionals, people with disposable income, not a lot of excessive time on their hands, and a group that uses the Internet a fair amount, both personally as well as professionally. The last group that will be targeted is techies. This group is the early adopters of any type of technology and spend incredible amounts of time immersed in Internet technology.
Grassroots is a compelling business concept that leverages advances in technology and proprietary tools to offer a market need at below market prices. In addition to earning great margins with low infrastructure costs, margins increase as the customer base increases. This exciting business plan has a high likelihood of success with Steve Teche responsible for the execution of it. The business will earn modest profits in year two, increasing exponentially in year three. Net profit is forecasted to be commensurate in years two and three.

Need actual charts?
We recommend using LivePlan as the easiest way to create graphs for your own business plan.
Create your own business plan »
1.1 Mission
It is Grassroots Wireless' mission to provide fast, wireless Internet access at a reasonable price. The most important thing to remember is that every customer must be satisfied with our services.
1.2 Keys to Success
Practice disciplined growth. Reach profitability by year two. Ensure that the customer's needs are met and maintain a 90% customer retention ratio.
1.3 Objectives
Provide, fast, reliable, wireless Internet access. Treat customers with the upmost respect. Become profitable within two years
Read more: http://www.bplans.com/internet_isp_wireless_business_plan/executive_summary_fc.php#ixzz2Tb1ixJgo

Company Summary
Grassroots Wireless will be formed in 2003 to offer an inexpensive, wireless broadband Internet connection to compete with DSL or cable offerings. Using Wi-fi technology, it is inexpensive to set up a neighborhood network. The company was founded by Steve Teche. Steve will rely on outside investors for the necessary start-up costs.
2.1 Company Ownership
Grassroots Wireless is an Illinois L.L.C. with Steve Teche as the principal and majority owner.
2.2 Start-up Summary
Equipment that will be needed is as follows:
Three computer workstations; Wireless access point; Five repeaters; Five antennas; Assorted office equipment and supplies.
Need actual charts?
We recommend using LivePlan as the easiest way to create graphs for your own business plan.
Create your own business plan »
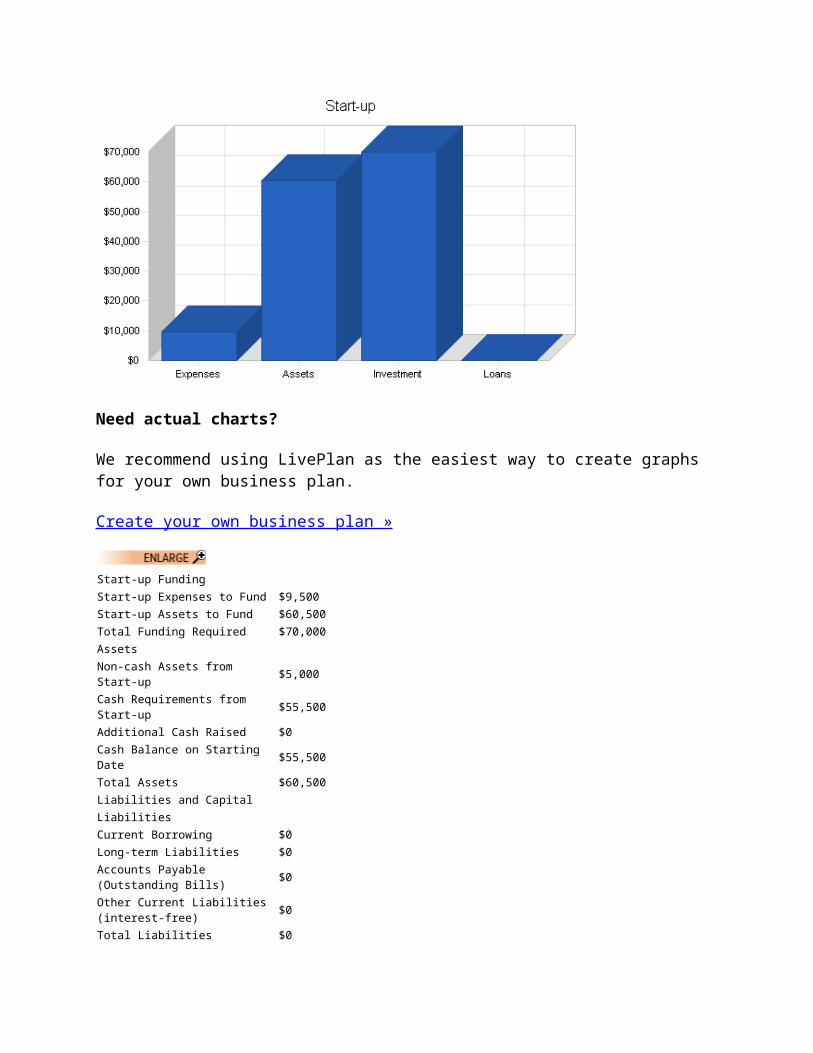
Start-up FundingStart-up Expenses to Fund $9,500 Start-up Assets to Fund $60,500 Total Funding Required $70,000 Assets Non-cash Assets from Start-up $5,000 Cash Requirements from Start-up $55,500 Additional Cash Raised $0 Cash Balance on Starting Date $55,500 Total Assets $60,500 Liabilities and CapitalLiabilitiesCurrent Borrowing $0 Long-term Liabilities $0 Accounts Payable (Outstanding Bills) $0 Other Current Liabilities (interest-free) $0 Total Liabilities $0 CapitalPlanned InvestmentInvestor 1 $15,000 Investor 2 $55,000 Additional Investment Requirement $0 Total Planned Investment $70,000 Loss at Start-up (Start-up Expenses) ($9,500)Total Capital $60,500 Total Capital and Liabilities $60,500 Total Funding $70,000
Need real financials?
We recommend using LivePlan as the easiest way to create automatic financials for your own business plan.
Create your own business plan »
Start-upRequirementsStart-up ExpensesLegal $2,000 Stationery etc. $100 Consultants $1,000 Insurance $200 Rent $200 Research and Development $1,000 Expensed Equipment $5,000 Total Start-up Expenses $9,500 Start-up AssetsCash Required $55,500 Other Current Assets $0 Long-term Assets $5,000 Total Assets $60,500 Total Requirements $70,000
Read more:

http://www.bplans.com/internet_isp_wireless_business_plan/company_summary_fc.php#ixzz2Tb1wuMJf
Services
Grassroots offers wireless broadband Internet access. The service is DSL speed with customers only needing a Wi-fi card and to live within range of the signal which covers a thirty block radius currently. There are plans to enlarge the coverage area as more customers sign up.
Wi-fi technology is based off of 2.4 mhz spectrum wireless transmissions. Using the same wave lengths that some cordless phones use, the Internet signals are broadcasted out through the neighborhood. With the supplied password and a Wi-fi receiver in each customer's computer, customers will have fast, wireless Internet connections.
Read more: http://www.bplans.com/internet_isp_wireless_business_plan/services_fc.php#ixzz2Tb2JD3Mt
Market Analysis Summary
Within the last three years there has been a proliferation of broadband Internet connections. With so many people enjoying fast connections at work, they are no longer willing to deal with a dial-up connection at home. With the advent of Wi-fi technology, customers can now enjoy a fast connection without having to lay expensive cables since the signal is sent via radio waves. The targeted market segments are: students, professionals, techies.
4.1 Market Segmentation
The market can be segmented into three distinct groups:
Students: these are people currently in academia and are accustomed to fast connections and are willing to pay for it. This group uses the Internet the most, whether they are trading MP3s or downloading videos.
Professionals: this group conducts a fair amount of business over the Internet, whether banking, e-commerce, or communications.
Techies: this group embraces technology as they enjoy challenging themselves with technology and the complexity it brings.
Other than the students, Grassroots' customers are fairly affluent (household income of >$50,000) and spend their money on technology offerings, whether it is digital cable, cellular service, or broadband Internet connections. The target customers are also generally well educated with 65% having a college degree and 20% having a graduate degree. Combining several demographic factors, Grassroots arrives at the following primary customer profile:

Spends 10 hours a week on the Internet away from home. Has purchased something from a website at least once within the last two months. Educated with at least some course work for an undergraduate degree. Household income of at least $50,000.
Need actual charts?
We recommend using LivePlan as the easiest way to create graphs for your own business plan.
Create your own business plan »
Market Analysis
Year 1 Year 2 Year 3 Year 4 Year 5
Potential Customers Growth CAGR
Students 9% 54,000 58,860 64,157 69,931 76,225 9.00% Professionals 8% 34,000 36,720 39,658 42,831 46,257 8.00% Techies 11% 10,000 11,100 12,321 13,676 15,180 11.00% Total 8.87% 98,000 106,680 116,136 126,438 137,662 8.87%
Need real financials?
We recommend using LivePlan as the easiest way to create automatic financials for your own business plan.
Create your own business plan »
4.2 Target Market Segment Strategy

Grassroots has chosen the three aforementioned target markets due to their adoption of broadband Internet technology. It is these three groups that are most likely to use a fast connection and the most willing to pay a premium for the connection.
4.3 Service Business Analysis
There are three main participants within the consumer broadband Internet market.
DSL (digital subscriber line). A connection that utilizes the copper phone lines as the method of transmission.
Cable. A connection that uses cable TV wiring for transmission. Satellite connections. These use satellites, in orbit to provide "cable" TV as well as
Internet connections to residential and remote consumers.
4.3.1 Competition and Buying Patterns
As mentioned in the previous section, DSL, cable, and satellite access are the competitors in the broadband market. Consumer buying patterns are based on two factors:
Availability: not every type of broadband connection is available to every consumer. Consumers often pick service providers based on what is available to them.
Convenience: this is often based on where the outlet cords are based in the house, whether the computer will be located closer to the cable TV or nearer to a phone jack.
Read more: http://www.bplans.com/internet_isp_wireless_business_plan/market_analysis_summary_fc.php#ixzz2Tb2RoEvW
Strategy and Implementation Summary
Simply put, Grassroots' strategy is to offer a service, demanded by customers, at a price that undercuts the competition. This will be accomplished, not by accepting below-market margins, but by leveraging technology, to help drive Grassroots' costs down. Awareness regarding Grassroots' services will be generated effectively and inexpensively to the specific target segments that Grassroots has focused on.
5.1 Competitive Edge
Grassroots' competitive edge is the effective and efficient use of Wi-fi technology. Wi-fi, while a fairly recent technology, has been adopted by several different service providers as well as used for home-based networks. What provides Grassroots with a competitive edge is its efficient use of the technology. Grassroots has developed a proprietary antenna that allows for signal transmission over great distances with less signal loss. Additionally, Grassroots has significantly

reduced administrative costs by having most administrative activities like marketing, sales, and service details administered via the Internet.
5.2 Marketing Strategy
As the name implies, Grassroots will be using a grassroots approach to developing awareness of the offered services. Grassroots will adopt a multi-pronged marketing approach:
Advertising/postings with local retailers and commercial businesses. This will provide Grassroots with great visibility in the exact community that it operates in.
Mailings. Grassroots will adopt a targeted mailing campaign to local residents. Website. Grassroots will leverage its website as a comprehensive and efficient source of
marketing/sales information.
5.3 Sales Strategy
The sales strategy that Grassroots will adopt is based on developing an awareness of Grassroots' service as a viable alternative to Cable and DSL within the community. The message used will be that you can receive broadband speed connections to your computer, wherever it may be, even your laptop on your front lawn, at a price that is a fraction of the current competitors'. This will be done with targeted advertising with local retail/commercial establishments in the area. Additionally, Grassroots will rely on mailings to get the word out. Lastly, Grassroots will have a website for marketing, sales, and administrative purposes.
5.3.1 Sales Forecast
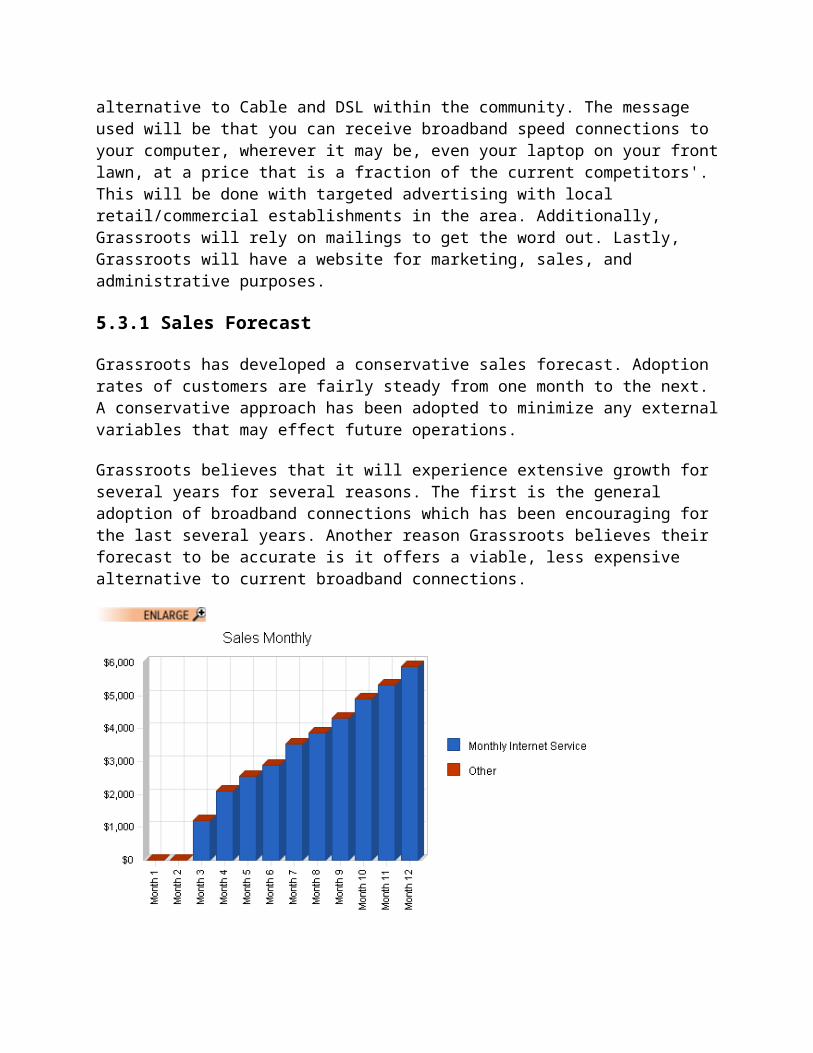
Grassroots has developed a conservative sales forecast. Adoption rates of customers are fairly steady from one month to the next. A conservative approach has been adopted to minimize any external variables that may effect future operations.
Grassroots believes that it will experience extensive growth for several years for several reasons. The first is the general adoption of broadband connections which has been encouraging for the last several years. Another reason Grassroots believes their forecast to be accurate is it offers a viable, less expensive alternative to current broadband connections.

Need actual charts?
We recommend using LivePlan as the easiest way to create graphs for your own business plan.
Create your own business plan »
Need actual charts?
We recommend using LivePlan as the easiest way to create graphs for your own business plan.
Create your own business plan »
Sales ForecastYear 1 Year 2 Year 3
Sales
Monthly Internet Service $36,584 $132,665 $211,443 Other $0 $0 $0 Total Sales $36,584 $132,665 $211,443 Direct Cost of Sales Year 1 Year 2 Year 3Administrative costs $1,829 $6,633 $10,572 Other $0 $0 $0 Subtotal Direct Cost of Sales $1,829 $6,633 $10,572
Need real financials?
We recommend using LivePlan as the easiest way to create automatic financials for your own business plan.
Create your own business plan »
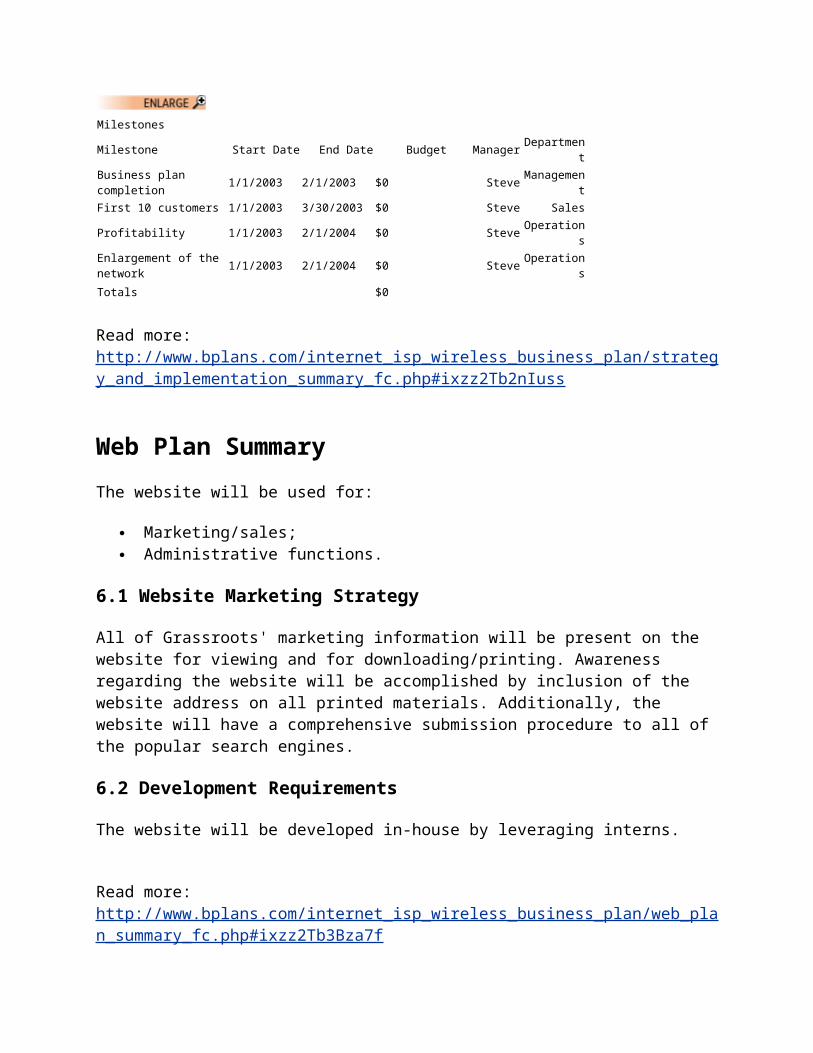
5.4 Milestones
Milestones are a very important aspect of a business plan. They provide concrete, achievable, yet lofty goals that the business must concentrate on. By targeting lofty goals, Grassroots ensures that it is aiming high, therefore it is more likely to achieve more. The milestones that Grassroots has chosen are very specific to the company and will be embraced by all employees.
Need actual charts?
We recommend using LivePlan as the easiest way to create graphs for your own business plan.
Create your own business plan »
MilestonesMilestone Start Date End Date Budget Manager DepartmentBusiness plan completion 1/1/2003 2/1/2003 $0 Steve ManagementFirst 10 customers 1/1/2003 3/30/2003 $0 Steve SalesProfitability 1/1/2003 2/1/2004 $0 Steve OperationsEnlargement of the network 1/1/2003 2/1/2004 $0 Steve Operations
Totals $0
Read more: http://www.bplans.com/internet_isp_wireless_business_plan/strategy_and_implementation_summary_fc.php#ixzz2Tb2nIuss
Web Plan Summary
The website will be used for:
Marketing/sales; Administrative functions.
6.1 Website Marketing Strategy
All of Grassroots' marketing information will be present on the website for viewing and for downloading/printing. Awareness regarding the website will be accomplished by inclusion of the website address on all printed materials. Additionally, the website will have a comprehensive submission procedure to all of the popular search engines.
6.2 Development Requirements
The website will be developed in-house by leveraging interns.
Read more: http://www.bplans.com/internet_isp_wireless_business_plan/web_plan_summary_fc.php#ixzz2Tb3Bza7f
Management Summary
Steve Teche, founder and president will be the anchor of the management team. Steve received his undergraduate degree in computer science from Loyola University. While Steve enjoyed the course work he recognized that it was not something that he was interested in pursuing as a

career. Steve decided that it would be in his best interest to study for an MBA, however, he was not immediately ready to do this. So Steve headed off to Ghana with the Peace Corps to develop community-based trading systems. Steve's Peace Corp experience was invaluable, providing him with extensive project management experience as well as giving him confidence that he could accomplish anything he set his mind out to do.
After getting back to the States, Steve began the MBA program at the University of Chicago. Steve's course of study concentrated on entrepreneurial ventures, recognizing at some point his desire to start his own business. Near the end of his second year, Steve began to hear about Wi-fi technology. He became interested in what he saw was a strong market need for inexpensive broadband Internet connections transmitted wirelessly, thereby significantly decreasing delivery costs. Steve formed Grassroots Wireless to fulfill this market need.
7.1 Personnel Plan
The two main employees beyond Steve are:
Technician: this position is responsible for the smooth operation of the wireless network as well as the website.
Administration: this is a general customer service position, assisting in sales and support.
Personnel PlanYear 1 Year 2 Year 3
President $24,000 $36,000 $48,000 Technician $19,800 $21,600 $21,600 Administration $15,000 $18,000 $18,000 Total People 3 3 3 Total Payroll $58,800 $75,600 $87,600
Read more: http://www.bplans.com/internet_isp_wireless_business_plan/management_summary_fc.php#ixzz2Tb3IOSqr
Financial Plan
The following sections outline important financial information.
8.1 Break-even Analysis
Average per-unit revenue: based on the $20 monthly access fee.Average per-unit variable cost: costs based on infrastructure, and administrative costs.Estimated monthly fixed costs: Internet connections costs.

Need actual charts?
We recommend using LivePlan as the easiest way to create graphs for your own business plan.
Create your own business plan »
Break-even Analysis
Monthly Revenue Break-even $8,072
Assumptions:
Average Percent Variable Cost 5%
Estimated Monthly Fixed Cost $7,668
Need real financials?
We recommend using LivePlan as the easiest way to create automatic financials for your own business plan.
Create your own business plan »
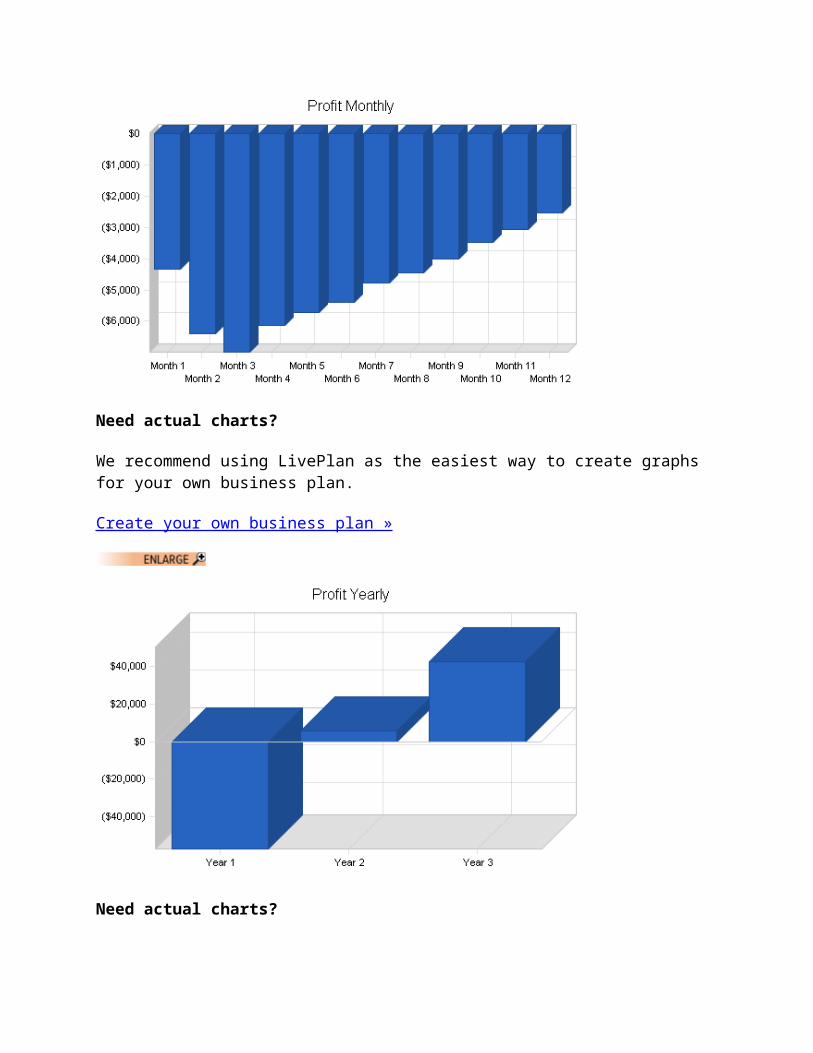
8.2 Projected Profit and Loss
The following table and charts show the Projected Profit and Loss.
Need actual charts?
We recommend using LivePlan as the easiest way to create graphs for your own business plan.
Create your own business plan »
Need actual charts?
We recommend using LivePlan as the easiest way to create graphs for your own business plan.
Create your own business plan »
Need actual charts?
We recommend using LivePlan as the easiest way to create graphs for your own business plan.
Create your own business plan »
Need actual charts?
We recommend using LivePlan as the easiest way to create graphs for your own business plan.

Create your own business plan »
Pro Forma Profit and Loss
Year 1 Year 2 Year 3
Sales $36,584 $132,665 $211,443
Direct Cost of Sales $1,829 $6,633 $10,572
Other Costs of Sales $0 $0 $0
Total Cost of Sales $1,829 $6,633 $10,572
Gross Margin $34,755 $126,032 $200,871
Gross Margin % 95.00% 95.00% 95.00%
Expenses
Payroll $58,800 $75,600 $87,600
Sales and Marketing and Other Expenses $2,400 $5,600 $12,000
Depreciation $996 $1,002 $1,002
Rent $2,400 $2,400 $2,400
Utilities $9,600 $13,000 $15,000
Insurance $3,000 $3,000 $3,000
Payroll Taxes $8,820 $11,340 $13,140
Other $6,000 $6,000 $6,000
Total Operating Expenses $92,016 $117,942 $140,142
Profit Before Interest and Taxes ($57,261) $8,090 $60,729
EBITDA ($56,265) $9,092 $61,731
Interest Expense $0 $0 $0
Taxes Incurred $0 $2,427 $18,219
Net Profit ($57,261) $5,663 $42,510
Net Profit/Sales -156.52% 4.27% 20.10%
8.3 Projected Cash Flow
The following table and chart display the Projected Cash Flow.

Need actual charts?
We recommend using LivePlan as the easiest way to create graphs for your own business plan.
Create your own business plan »
Pro Forma Cash Flow
Year 1 Year 2 Year 3
Cash Received
Cash from Operations
Cash Sales $36,584 $132,665 $211,443
Subtotal Cash from Operations $36,584 $132,665 $211,443
Additional Cash Received
Sales Tax, VAT, HST/GST Received $0 $0 $0
New Current Borrowing $0 $0 $0
New Other Liabilities (interest-free) $0 $0 $0
New Long-term Liabilities $0 $0 $0
Sales of Other Current Assets $0 $0 $0
Sales of Long-term Assets $0 $0 $0
New Investment Received $0 $0 $0
Subtotal Cash Received $36,584 $132,665 $211,443
Expenditures Year 1 Year 2 Year 3
Expenditures from Operations
Cash Spending $58,800 $75,600 $87,600
Bill Payments $31,112 $49,195 $77,871
Subtotal Spent on Operations $89,912 $124,795 $165,471
Additional Cash Spent
Sales Tax, VAT, HST/GST Paid Out $0 $0 $0
Principal Repayment of Current Borrowing $0 $0 $0
Other Liabilities Principal Repayment $0 $0 $0
Long-term Liabilities Principal Repayment $0 $0 $0
Purchase Other Current Assets $0 $0 $0
Purchase Long-term Assets $0 $0 $0
Dividends $0 $0 $0
Subtotal Cash Spent $89,912 $124,795 $165,471
Net Cash Flow ($53,328) $7,870 $45,972
Cash Balance $2,172 $10,042 $56,014
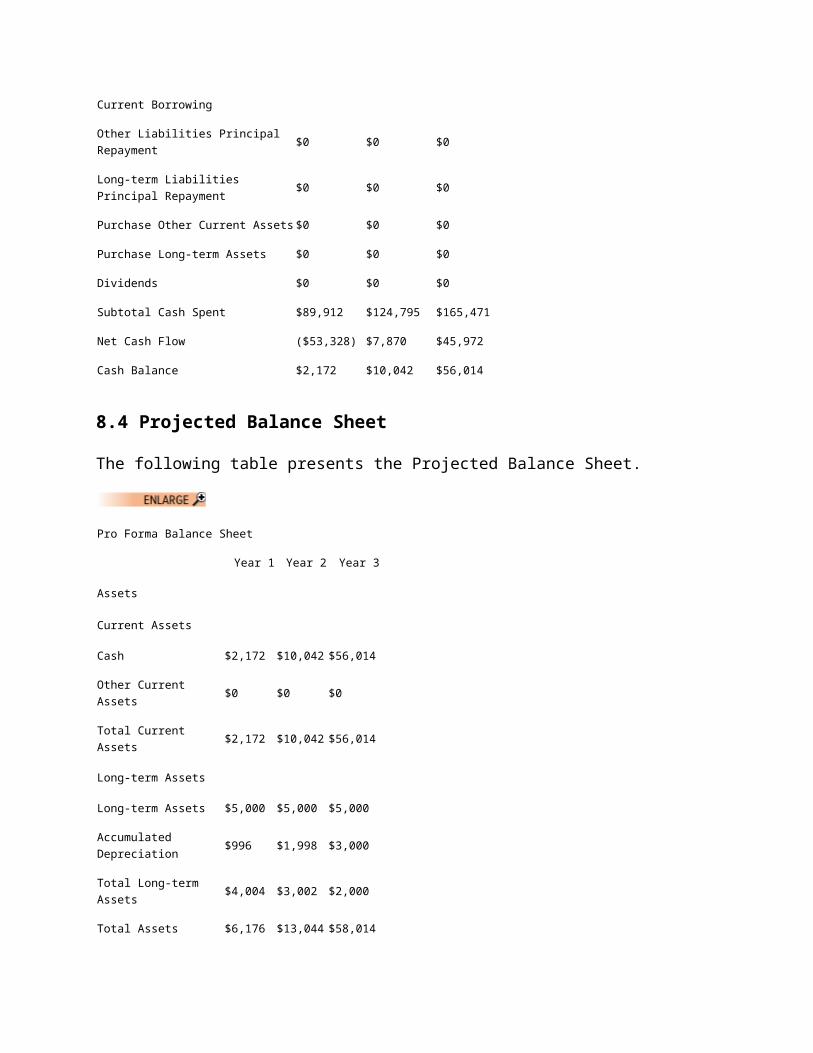
8.4 Projected Balance Sheet
The following table presents the Projected Balance Sheet.
Pro Forma Balance Sheet
Year 1 Year 2 Year 3
Assets
Current Assets
Cash $2,172 $10,042 $56,014
Other Current Assets $0 $0 $0
Total Current Assets $2,172 $10,042 $56,014
Long-term Assets
Long-term Assets $5,000 $5,000 $5,000

Accumulated Depreciation $996 $1,998 $3,000
Total Long-term Assets $4,004 $3,002 $2,000
Total Assets $6,176 $13,044 $58,014
Liabilities and Capital Year 1 Year 2 Year 3
Current Liabilities
Accounts Payable $2,938 $4,142 $6,603
Current Borrowing $0 $0 $0
Other Current Liabilities $0 $0 $0
Subtotal Current Liabilities $2,938 $4,142 $6,603
Long-term Liabilities $0 $0 $0
Total Liabilities $2,938 $4,142 $6,603
Paid-in Capital $70,000 $70,000 $70,000
Retained Earnings ($9,500) ($66,761) ($61,098)
Earnings ($57,261) $5,663 $42,510
Total Capital $3,239 $8,902 $51,412
Total Liabilities and Capital $6,176 $13,044 $58,014
Net Worth $3,239 $8,902 $51,412
8.5 Business Ratios
The following table illustrates the different Business Ratios, based on NAICS code 518111, Internet Service Providers.
Ratio Analysis
Year 1 Year 2 Year 3 Industry Profile
Sales Growth 0.00% 262.63% 59.38% 15.97%
Percent of Total Assets
Other Current Assets 0.00% 0.00% 0.00% 56.35%
Total Current Assets 35.17% 76.99% 96.55% 87.48%
Long-term Assets 64.83% 23.01% 3.45% 12.52%
Total Assets 100.00% 100.00% 100.00% 100.00%
Current Liabilities 47.56% 31.76% 11.38% 30.66%

Long-term Liabilities 0.00% 0.00% 0.00% 23.07%
Total Liabilities 47.56% 31.76% 11.38% 53.73%
Net Worth 52.44% 68.24% 88.62% 46.27%
Percent of Sales
Sales 100.00% 100.00% 100.00% 100.00%
Gross Margin 95.00% 95.00% 95.00% 100.00%
Selling, General & Administrative Expenses 251.52% 90.73% 74.90% 73.80%
Advertising Expenses 0.00% 0.00% 0.00% 1.37%
Profit Before Interest and Taxes -156.52% 6.10% 28.72% 1.03%
Main Ratios
Current 0.74 2.42 8.48 1.97
Quick 0.74 2.42 8.48 1.50
Total Debt to Total Assets 47.56% 31.76% 11.38% 59.78%
Pre-tax Return on Net Worth -1767.98% 90.88% 118.12% 2.93%
Pre-tax Return on Assets -927.10% 62.02% 104.68% 7.28%
Additional Ratios Year 1 Year 2 Year 3
Net Profit Margin -156.52% 4.27% 20.10% n.a
Return on Equity -1767.98% 63.62% 82.69% n.a
Activity Ratios
Accounts Payable Turnover 11.59 12.17 12.17 n.a
Payment Days 27 26 24 n.a
Total Asset Turnover 5.92 10.17 3.64 n.a
Debt Ratios
Debt to Net Worth 0.91 0.47 0.13 n.a
Current Liab. to Liab. 1.00 1.00 1.00 n.a
Liquidity Ratios
Net Working Capital ($765) $5,900 $49,412 n.a
Interest Coverage 0.00 0.00 0.00 n.a
Additional Ratios

Assets to Sales 0.17 0.10 0.27 n.a
Current Debt/Total Assets 48% 32% 11% n.a
Acid Test 0.74 2.42 8.48 n.a
Sales/Net Worth 11.30 14.90 4.11 n.a
Dividend Payout 0.00 0.00 0.00 n.a
Read more: http://www.bplans.com/internet_isp_wireless_business_plan/financial_plan_fc.php#ixzz2Tb3OzFt5
Appendix
Sales Forecast
Month 1 Month 2 Month 3 Month 4 Month 5 Month 6 Month 7 Month 8 Month 9 Month 10 Month 11 Month 12
Sales
Monthly Internet Service 0% $0 $0 $1,200 $2,112 $2,544 $2,887 $3,543 $3,877 $4,322 $4,899 $5,323 $5,877
Other 0% $0 $0 $0 $0 $0 $0 $0 $0 $0 $0 $0 $0
Total Sales $0 $0 $1,200 $2,112 $2,544 $2,887 $3,543 $3,877 $4,322 $4,899 $5,323 $5,877
Direct Cost of Sales Month 1 Month 2 Month 3 Month 4 Month 5 Month 6 Month 7 Month 8 Month 9 Month 10 Month 11 Month 12
Administrative costs $0 $0 $60 $106 $127 $144 $177 $194 $216 $245 $266 $294
Other $0 $0 $0 $0 $0 $0 $0 $0 $0 $0 $0 $0
Subtotal Direct Cost of Sales $0 $0 $60 $106 $127 $144 $177 $194 $216 $245 $266 $294
Need real financials?
We recommend using LivePlan as the easiest way to create automatic financials for your own business plan.
Create your own business plan »
Personnel Plan
Month 1 Month 2 Month 3 Month 4 Month 5 Month 6 Month 7 Month 8 Month 9 Month 10 Month 11 Month 12
President 0% $2,000 $2,000 $2,000 $2,000 $2,000 $2,000 $2,000 $2,000 $2,000 $2,000 $2,000 $2,000
Technician 0% $0 $1,800 $1,800 $1,800 $1,800 $1,800 $1,800 $1,800 $1,800 $1,800 $1,800 $1,800
Administration 0% $0 $0 $1,500 $1,500 $1,500 $1,500 $1,500 $1,500 $1,500 $1,500 $1,500 $1,500
Total People 1 2 3 3 3 3 3 3 3 3 3 3
Total Payroll $2,000 $3,800 $5,300 $5,300 $5,300 $5,300 $5,300 $5,300 $5,300 $5,300 $5,300 $5,300
General Assumptions
Month 1 Month 2 Month 3 Month 4 Month 5 Month 6 Month 7 Month 8 Month 9 Month 10 Month 11Month
12
Plan Month 1 2 3 4 5 6 7 8 9 10 11 12
Current Interest Rate 10.00% 10.00% 10.00% 10.00% 10.00% 10.00% 10.00% 10.00% 10.00% 10.00% 10.00% 10.00%
Long-term Interest Rate 10.00% 10.00% 10.00% 10.00% 10.00% 10.00% 10.00% 10.00% 10.00% 10.00% 10.00% 10.00%
Tax Rate 30.00% 30.00% 30.00% 30.00% 30.00% 30.00% 30.00% 30.00% 30.00% 30.00% 30.00% 30.00%
Other 0 0 0 0 0 0 0 0 0 0 0 0
Pro Forma Profit and Loss
Month 1 Month 2 Month 3 Month 4 Month 5 Month 6 Month 7 Month 8 Month 9 Month 10 Month 11Month
12
Sales $0 $0 $1,200 $2,112 $2,544 $2,887 $3,543 $3,877 $4,322 $4,899 $5,323 $5,877
Direct Cost of Sales $0 $0 $60 $106 $127 $144 $177 $194 $216 $245 $266 $294
Other Costs of Sales $0 $0 $0 $0 $0 $0 $0 $0 $0 $0 $0 $0
Total Cost of Sales $0 $0 $60 $106 $127 $144 $177 $194 $216 $245 $266 $294
Gross Margin $0 $0 $1,140 $2,006 $2,417 $2,743 $3,366 $3,683 $4,106 $4,654 $5,057 $5,583

Gross Margin % 0.00% 0.00% 95.00% 95.00% 95.00% 95.00% 95.00% 95.00% 95.00% 95.00% 95.00% 95.00%
Expenses
Payroll $2,000 $3,800 $5,300 $5,300 $5,300 $5,300 $5,300 $5,300 $5,300 $5,300 $5,300 $5,300
Sales and Marketing and Other Expenses
$200 $200 $200 $200 $200 $200 $200 $200 $200 $200 $200 $200
Depreciation $83 $83 $83 $83 $83 $83 $83 $83 $83 $83 $83 $83
Rent $200 $200 $200 $200 $200 $200 $200 $200 $200 $200 $200 $200
Utilities $800 $800 $800 $800 $800 $800 $800 $800 $800 $800 $800 $800
Insurance $250 $250 $250 $250 $250 $250 $250 $250 $250 $250 $250 $250
Payroll Taxes 15% $300 $570 $795 $795 $795 $795 $795 $795 $795 $795 $795 $795
Other $500 $500 $500 $500 $500 $500 $500 $500 $500 $500 $500 $500
Total Operating Expenses $4,333 $6,403 $8,128 $8,128 $8,128 $8,128 $8,128 $8,128 $8,128 $8,128 $8,128 $8,128
Profit Before Interest and Taxes
($4,333) ($6,403) ($6,988) ($6,122) ($5,711) ($5,385) ($4,762) ($4,445) ($4,022) ($3,474) ($3,071) ($2,545)
EBITDA ($4,250) ($6,320) ($6,905) ($6,039) ($5,628) ($5,302) ($4,679) ($4,362) ($3,939) ($3,391) ($2,988) ($2,462)
Interest Expense $0 $0 $0 $0 $0 $0 $0 $0 $0 $0 $0 $0
Taxes Incurred $0 $0 $0 $0 $0 $0 $0 $0 $0 $0 $0 $0
Net Profit ($4,333) ($6,403) ($6,988) ($6,122) ($5,711) ($5,385) ($4,762) ($4,445) ($4,022) ($3,474) ($3,071) ($2,545)
Net Profit/Sales 0.00% 0.00% -582.33% -289.85% -224.50% -186.54% -134.41% -114.65% -93.06% -70.91% -57.70% -43.30%
Pro Forma Cash Flow
Month 1 Month 2 Month 3 Month 4 Month 5 Month 6 Month 7 Month 8 Month 9 Month 10 Month 11 Month 12
Cash Received
Cash from Operations
Cash Sales $0 $0 $1,200 $2,112 $2,544 $2,887 $3,543 $3,877 $4,322 $4,899 $5,323 $5,877
Subtotal Cash from Operations $0 $0 $1,200 $2,112 $2,544 $2,887 $3,543 $3,877 $4,322 $4,899 $5,323 $5,877
Additional Cash Received
Sales Tax, VAT, HST/GST Received 0.00% $0 $0 $0 $0 $0 $0 $0 $0 $0 $0 $0 $0
New Current Borrowing $0 $0 $0 $0 $0 $0 $0 $0 $0 $0 $0 $0
New Other Liabilities (interest-free) $0 $0 $0 $0 $0 $0 $0 $0 $0 $0 $0 $0
New Long-term Liabilities $0 $0 $0 $0 $0 $0 $0 $0 $0 $0 $0 $0
Sales of Other Current Assets $0 $0 $0 $0 $0 $0 $0 $0 $0 $0 $0 $0
Sales of Long-term Assets $0 $0 $0 $0 $0 $0 $0 $0 $0 $0 $0 $0
New Investment Received $0 $0 $0 $0 $0 $0 $0 $0 $0 $0 $0 $0
Subtotal Cash Received $0 $0 $1,200 $2,112 $2,544 $2,887 $3,543 $3,877 $4,322 $4,899 $5,323 $5,877
Expenditures Month 1 Month 2 Month 3 Month 4 Month 5 Month 6 Month 7 Month 8 Month 9 Month 10 Month 11 Month 12
Expenditures from Operations
Cash Spending $2,000 $3,800 $5,300 $5,300 $5,300 $5,300 $5,300 $5,300 $5,300 $5,300 $5,300 $5,300
Bill Payments $75 $2,259 $2,530 $2,807 $2,851 $2,873 $2,890 $2,923 $2,940 $2,962 $2,991 $3,012
Subtotal Spent on Operations $2,075 $6,059 $7,830 $8,107 $8,151 $8,173 $8,190 $8,223 $8,240 $8,262 $8,291 $8,312
Additional Cash Spent
Sales Tax, VAT, HST/GST Paid Out $0 $0 $0 $0 $0 $0 $0 $0 $0 $0 $0 $0
Principal Repayment of Current Borrowing
$0 $0 $0 $0 $0 $0 $0 $0 $0 $0 $0 $0
Other Liabilities Principal Repayment $0 $0 $0 $0 $0 $0 $0 $0 $0 $0 $0 $0
Long-term Liabilities Principal Repayment
$0 $0 $0 $0 $0 $0 $0 $0 $0 $0 $0 $0
Purchase Other Current Assets $0 $0 $0 $0 $0 $0 $0 $0 $0 $0 $0 $0
Purchase Long-term Assets $0 $0 $0 $0 $0 $0 $0 $0 $0 $0 $0 $0
Dividends $0 $0 $0 $0 $0 $0 $0 $0 $0 $0 $0 $0
Subtotal Cash Spent $2,075 $6,059 $7,830 $8,107 $8,151 $8,173 $8,190 $8,223 $8,240 $8,262 $8,291 $8,312
Net Cash Flow ($2,075) ($6,059) ($6,630) ($5,995) ($5,607) ($5,286) ($4,647) ($4,346) ($3,918) ($3,363) ($2,968) ($2,435)
Cash Balance $53,425 $47,366 $40,737 $34,742 $29,135 $23,849 $19,201 $14,856 $10,938 $7,575 $4,607 $2,172
Need real financials?
We recommend using LivePlan as the easiest way to create automatic financials for your own business plan.
Create your own business plan »
Pro Forma Balance Sheet
Month 1 Month 2 Month 3 Month 4 Month 5 Month 6 Month 7 Month 8 Month 9 Month 10 Month 11 Month 12
Assets Starting Balances
Current Assets
Cash $55,500 $53,425 $47,366 $40,737 $34,742 $29,135 $23,849 $19,201 $14,856 $10,938 $7,575 $4,607 $2,172
Other Current Assets $0 $0 $0 $0 $0 $0 $0 $0 $0 $0 $0 $0 $0
Total Current Assets $55,500 $53,425 $47,366 $40,737 $34,742 $29,135 $23,849 $19,201 $14,856 $10,938 $7,575 $4,607 $2,172
Long-term Assets
Long-term Assets $5,000 $5,000 $5,000 $5,000 $5,000 $5,000 $5,000 $5,000 $5,000 $5,000 $5,000 $5,000 $5,000
Accumulated Depreciation $0 $83 $166 $249 $332 $415 $498 $581 $664 $747 $830 $913 $996
Total Long-term Assets $5,000 $4,917 $4,834 $4,751 $4,668 $4,585 $4,502 $4,419 $4,336 $4,253 $4,170 $4,087 $4,004
Total Assets $60,500 $58,342 $52,200 $45,488 $39,410 $33,720 $28,351 $23,620 $19,192 $15,191 $11,745 $8,694 $6,176
Liabilities and Capital Month 1 Month 2 Month 3 Month 4 Month 5 Month 6 Month 7 Month 8 Month 9 Month 10 Month 11 Month 12
Current Liabilities
Accounts Payable $0 $2,175 $2,436 $2,712 $2,756 $2,776 $2,793 $2,825 $2,841 $2,862 $2,890 $2,911 $2,938
Current Borrowing $0 $0 $0 $0 $0 $0 $0 $0 $0 $0 $0 $0 $0
Other Current Liabilities $0 $0 $0 $0 $0 $0 $0 $0 $0 $0 $0 $0 $0
Subtotal Current Liabilities $0 $2,175 $2,436 $2,712 $2,756 $2,776 $2,793 $2,825 $2,841 $2,862 $2,890 $2,911 $2,938
Long-term Liabilities $0 $0 $0 $0 $0 $0 $0 $0 $0 $0 $0 $0 $0
Total Liabilities $0 $2,175 $2,436 $2,712 $2,756 $2,776 $2,793 $2,825 $2,841 $2,862 $2,890 $2,911 $2,938
Paid-in Capital $70,000 $70,000 $70,000 $70,000 $70,000 $70,000 $70,000 $70,000 $70,000 $70,000 $70,000 $70,000 $70,000
Retained Earnings ($9,500) ($9,500) ($9,500) ($9,500) ($9,500) ($9,500) ($9,500) ($9,500) ($9,500) ($9,500) ($9,500) ($9,500) ($9,500)
Earnings $0 ($4,333) ($10,736) ($17,724) ($23,846) ($29,557) ($34,942) ($39,704) ($44,149) ($48,171) ($51,645) ($54,716) ($57,261)
Total Capital $60,500 $56,167 $49,764 $42,776 $36,654 $30,943 $25,558 $20,796 $16,351 $12,329 $8,855 $5,784 $3,239
Total Liabilities and Capital $60,500 $58,342 $52,200 $45,488 $39,410 $33,720 $28,351 $23,620 $19,192 $15,191 $11,745 $8,694 $6,176
Net Worth $60,500 $56,167 $49,764 $42,776 $36,654 $30,943 $25,558 $20,796 $16,351 $12,329 $8,855 $5,784 $3,239
Read more: http://www.bplans.com/internet_isp_wireless_business_plan/financial_plan_fc.php#ixzz2Tb3kwBDI