Embed Size (px)
Citation preview
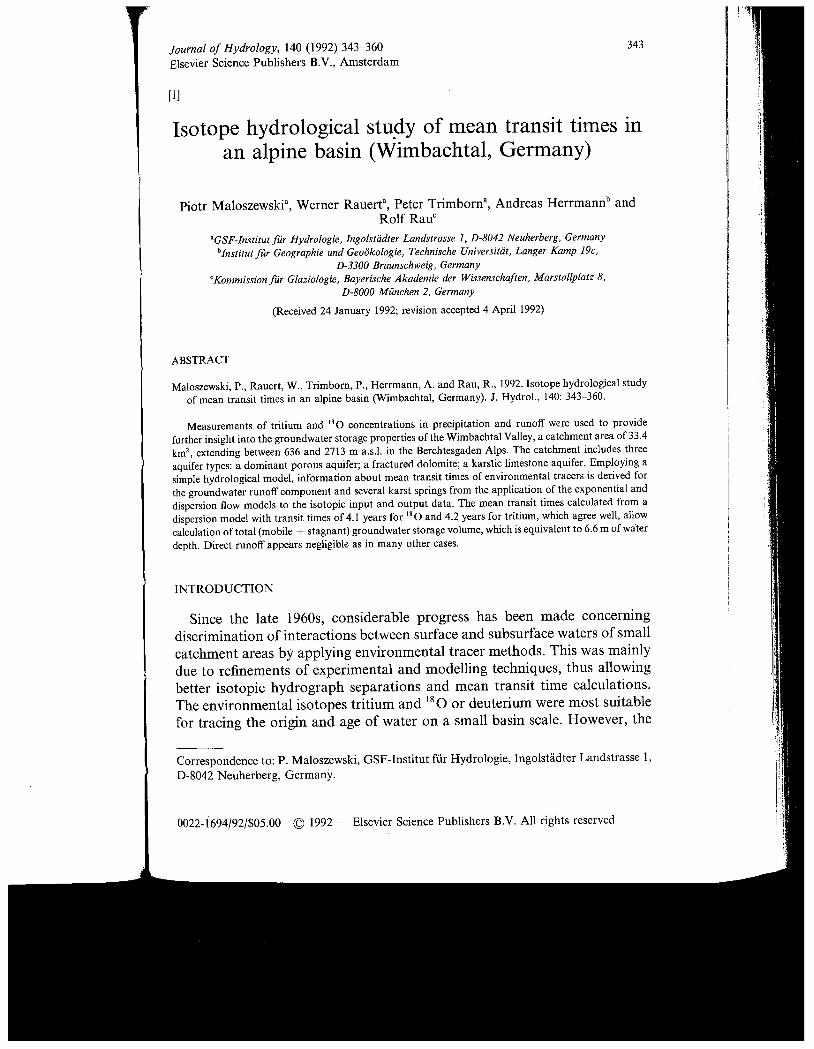
Journal of Hydrology, 140 (1992) 343-360
Elsevier Science Publishers B. , Amsterdam
(1J
Isotope hydrological stu.dY of mean transit times inan alpine basin (Wimbachtal , Germany)
Piotr Maloszewski , Werner Rauert", Peter Trimborn , Andreas Herrmannb and
Rolf Rau
GSF-Institut fur Hydrologie, Ingolstiidter Landstrasse S042 Neuherberg, Germany
lnstitut fUr Geographie und Geookologie , Technische Universitiit , Langer Kamp 19c,3300 Braunschweig, Germany
KommissionfUr Glaziologie , Bayerische Akademie der Wissenschaften , Marstallplatz SSOOO Munchen Germany
(Received 24 January 1992; revision accepted 4 April 1992)
ABSTRACT
Maloszewski , P. , Rauert, W. , Trimborn, P. , Herrmann , A. and Rau , R. , 1992. Isotope hydrological study
of mean transit times in an alpine basin (Wimbachta1 , Germany). J. Hydro!. , 140: 343-360.
Measurements of tritium and 0 concentrations in precipitation and runoff were used to providefurther insight into the groundwater storage properties of the Wimbachtal Valley, a catchment area of 33.4
, extending between 636 and 2713 m a. !. in the Berchtesgaden Alps. The catchment includes threeaquifer types: a dominant porous aquifer; a fractured dolomite; a karslic limestone aquifer. Employing asimple hydrological model , information about mean transit times of environmental tracers is derived forthe groundwater runoff component and several karst springs from the application of the exponential anddispersion flow models to the isotopic input and output data. The mean transit times calculated from a
dispersion model with transit times of 4. 1 years for 0 and 4.2 years for tritium , which agree well , allow
calculation of total (mobile + stagnant) groundwater storage volume, which is equivalent to 6.6 m of water
depth. Direct runoff appears negligible as in many other cases.
INTRODUCTION
Since the late 1960s , considerable progress has been made concerningdiscrimination of interactions between surface and subsurface waters of smallcatchment areas by applying environmental tracer methods. This was mainlydue to refinements of experimental and modelling techniques, thus allowingbetter isotopic hydro graph separations and mean transit time calculations.The environmental isotopes tritium and 0 or deuterium were most suitablefor tracing the origin and age of water on a small basin scale. However , the
Correspondence to: P. Maloszewski , GSF-Institut fUr Hydrologie, Ingolstiidter Landstrasse 18042 Neuherberg, Germany.
0022- 1694/92/$05. 00 1992 Elsevier Science Publishers B.Y. All rights reserved
343
344 P. MALOSZEWSK1 ET AL.
environmental tracer techniques do not claim to replace standard surveys orto solve hydrological problems alone. A recent comprehensive example forcombined use of isotopic with independent hydrological and geophysicalmethods is given by Herrmann et aI. J1989) for a very small , but complexcatchment system of Paleozoic rock.
The present study attempts to fill the gap between glaciated high-alpine(e. g. Moser et aI. , 1986) and subalpine catchments (e.g. Maloszewski et aI.1983; Bergmann et aI. , 1986) with a near-natural catchment in the Berchtes-gad en National Park. Considering several well-studied Central Europeanhighlands (e. g. Einsele, 1986; Herrmann et aI. , 1989), applications of theisotope technique now cover important mountain types and altitude intervalsin the region. The combination of porous , fissured rock and karst aquiferswith a considerable elevation range of nearly 2100 m is a less studied field ofapplication of specific flow models for interpretation of isotopic output datafrom subsurface reservoirs.
DESCRIPTION OF THE WIMBACHTAL CATCHMENT AND THE EXPERIMENTS
In the present study, concentrations of the radioisotope tritium and the
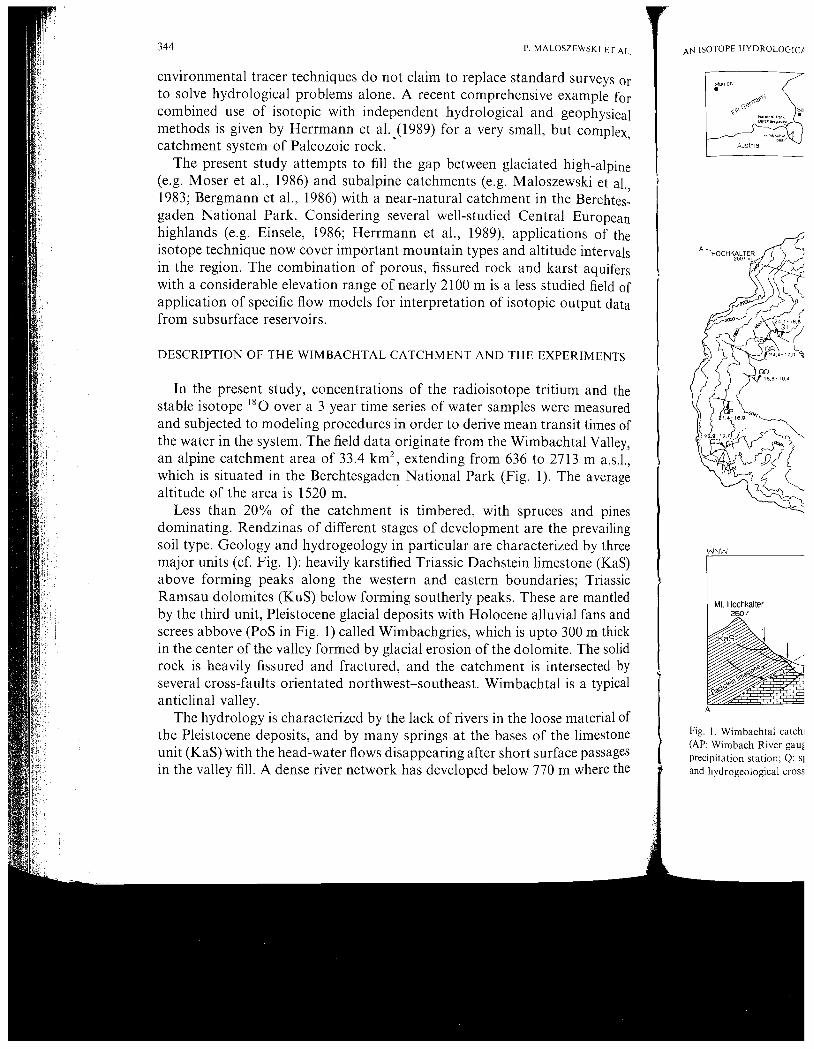
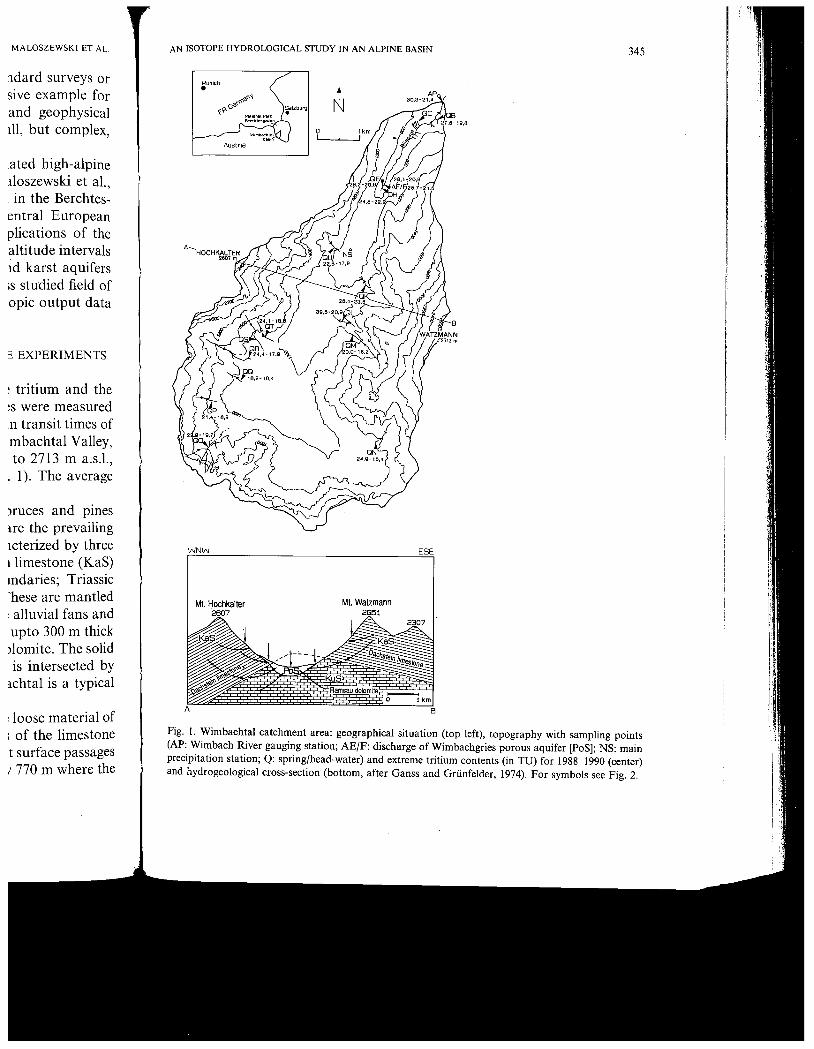
stable isotope 0 over a 3 year time series of water samples were measuredand subjected to modeling procedures in order to derive mean transit times ofthe water in the system. The field data originate from the Wimbachtal Valley,an alpine catchment area of 33.4 km , extending from 636 to 2713 m a. s.!which is situated in the Berchtesgaden National Park (Fig. 1). The averagealtitude of the area is 1520
Less than 20% of the catchment is timbered , with spruces and pinesdominating. Rendzinas of different stages of development are the prevailingsoil type. Geology and hydrogeology in particular are characterized by threemajor units (cf. Fig. I): heavily karstified Triassic Dachstein limestone (KaS)above forming peaks along the western and eastern boundaries; TriassicRamsau dolomites (KuS) below forming southerly peaks. These are mantledby the third unit , Pleistocene glacial deposits with Holocene alluvial fans andscrees abbove (PoS in Fig. 1) called Wimbachgries , which is upto 300 m thickin the center of the valley formed by glacial erosion of the dolomite. The solidrock is heavily fissured and fractured , and the catchment is intersected byseveral cross-faults orientated northwest-southeast. Wimbachtal is a typicalanticlinal valley.
The hydrology is characterized by the lack of rivers in the loose material ofthe Pleistocene deposits , and by many springs at the bases of the limestoneunit (KaS) with the head-water flows disappearing after short surface passagesin the valley fill. A dense river network has developed below 770 m where the
AN ISOTOPE HYDROLOGIU
Munich
WNW
Mt. Hochkalter267
Fig. 1. Wimbachtal catch1(AP: Wimbach River gau!precipitation station; Q: s)and hydrogeological cross
MALOSZEWSKI ET AL.
tldard surveys orsive example forand geophysicalill , but complex
lated high-alpineiloszewski et aI.. in the Berchtes-entral Europeanplications of the
altitude intervals
ld karst aquifers
;s studied field ofopic output data
E EXPERIMENTS
tritium and the
s were measuredn transit times of1mbachtal Valley,to 2713 m a.
. I). The average
)ruces and pines
He the prevailingicterized by threelimestone (KaS)
mdaries; Triassichese are mantled: alluvial fans andupto 300 m thick)lomite. The solidis intersected byichtal is a typical
: loose material of; of the limestonet surface passages
770 m where the
AN ISOTOPE HYDROLOGICAL STUDY IN AN ALPINE BASIN 345
Munich.
0F'
WNW ESE
Mt. Walzmann2651
Ramsau dolomLts
Fig. 1. Wimbachtal catchment area: geographical situation (top left), topography with sampling points(AP: Wimbach River gauging station; AE/F: discharge of Wimbachgries porous aquifer (PoSJ; NS: mainprecipitation station; Q: spring/head-water) and extreme tritium contents (in TV) for 1988- 1990 (center)and hydrogeological cross-section (bottom , after Ganss and Griinfelder , 1974). For symbols see Fig. 2.
346 P. MALOSZEWSKI ET AL.
Wimbach River rises from groundwater in the Pleistocene deposits (AEj
in Fig. I), and springwater from the Quaternary fans. Mean annual precipita-tion is 2400-2500 mm, and mean annual runoff depth at Wimbach Rivergauging station AP is 1670 mm (1.75 m3 S
In order to apply mathematicat" flow models to the information from
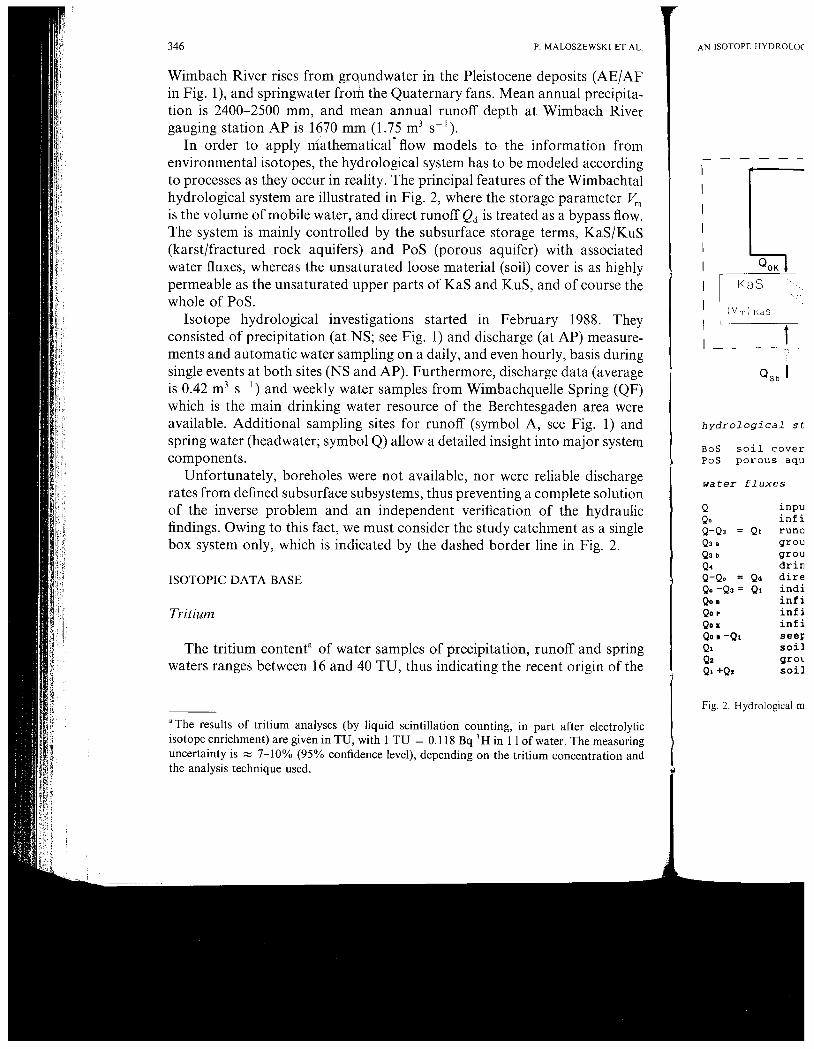
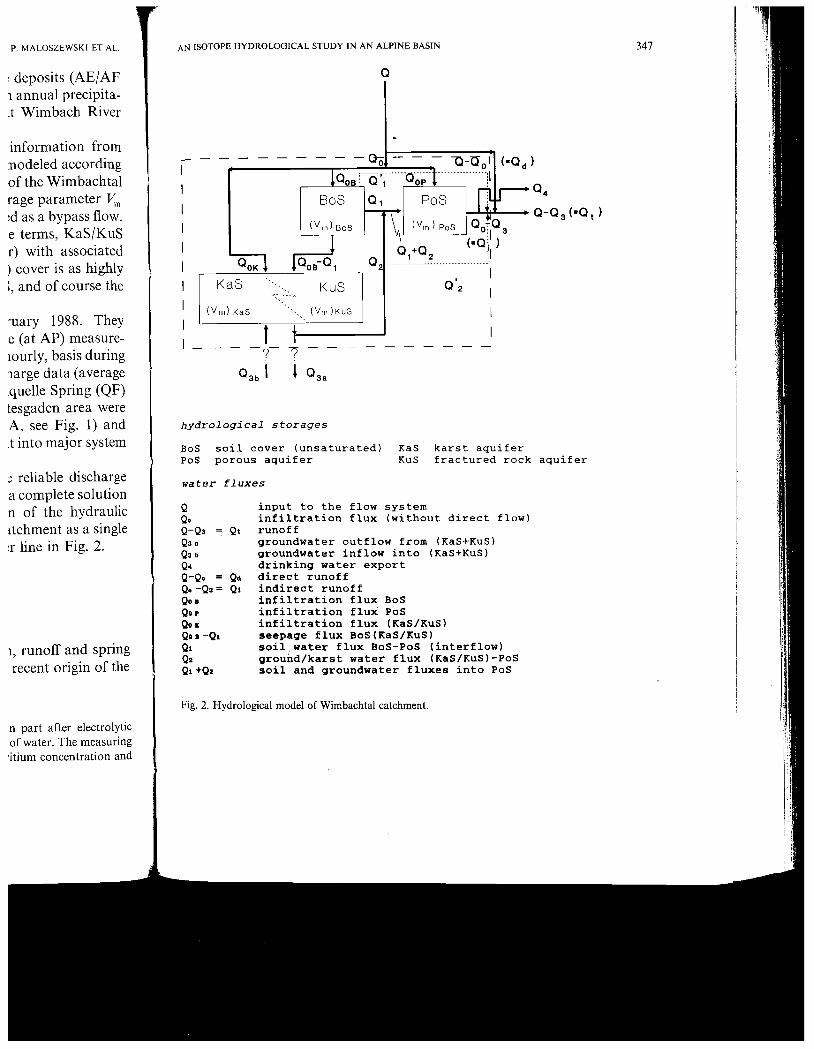
environmental isotopes , the hydrological system has to be modeled accordingto processes as they occur in reality. The principal features of the Wimbachtalhydrological system are illustrated in Fig. 2 , where the storage parameter
is the volume of mobile water , and direct runoff Qd is treated as a bypass flow.The system is mainly controlled by the subsurface storage terms , KaSjKuS(karstjfractured rock aquifers) and PoS (porous aquifer) with associatedwater fluxes , whereas the unsaturated loose material (soil) cover is as highlypermeable as the unsaturated upper parts of KaS and KuS , and of course thewhole of PoS.
Isotope hydrological investigations started in February 1988. Theyconsisted of precipitation (at NS; see Fig. I) and discharge (at AP) measure-ments and automatic water sampling on a daily, and even hourly, basis duringsingle events at both sites (NS and AP). Furthermore , discharge data (averageis 0.42 m3 S ) and weekly water samples from Wimbachquelle Spring (QF)which is the main drinking water resource of the Berchtesgaden area were
available. Additional sampling sites for runoff (symbol A, see Fig. I) andspring wate.r (headwater; symbol Q) allow a detailed insight into major systemcomponents.
Unfortunately, boreholes were not available , nor were reliable dischargerates from defined subsurface subsystems, thus preventing a complete solutionof the inverse problem and an independent verification of the hydraulicfindings. Owing to this fact , we must consider the study catchment as a singlebox system only, which is indicated by the dashed border line in Fig. 2.
ISOTOPIC DATA BASE
Tritium
The tritium content of water samples of precipitation, runoff and springwaters ranges between 16 and 40 TU , thus indicating the recent origin of the
a The results of tritium analyses (by liquid scintillation counting, in part after electrolytic
isotope enrichment) are given in TU, with 1 TU = 0. 118 Bq J H in 11 of water. The measuringuncertainty is :: 7- 10% (95% confidence level), depending on the tritium concentration andthe analysis technique used.
AN ISOTOPE HYDROLO(
KaS
(Vm )KaS
- - r;3b I
hydrological stBaSPaS
soil coverporous aqu
water fluxes
Q3 = QtQ3.Q3b
Q. = QdQ. -Q3 = QtQo.Qo rQo K
Qo. -
Ql +Qz
inpuintirunogrougroudrindireindiintiintiintiseesoilgrotsoil
Fig. 2. Hydrological m
P. MALOSZEWSKI ET AL.
: deposits (AE/AF1 annual precipita-It Wimbach River
information from
110deled accordingof the Wimbachtalrage parameter
:d as a bypass flow.e terms , KaS/KuSr) with associated
) cover is as highly, and of course the
ruary 1988. Theye (at AP) measure-lOurly, basis duringh.arge data (averagequelle Spring (QF)tesgaden area were
, see Fig. I) andIt into major system
reliable dischargea complete solutionn of the hydraulic
ltchment as a single:r line in Fig. 2.
, runoff and springrecent origin of the
II part after electrolyticof water. The measuringitium concentration and
347AN ISOTOPE HYDROLOGICAL STUDY IN AN ALPINE BASIN
0-0 (-O
KuS
--.".,
(Vm)KuS
- ? -- - - - - - - - - -
00 -0- 1 (-O
DS
""' -- --------""--
BoS PoS
)BoS \ (V )PoS 0 0:1
o +0 (-OJ)o ------
---- ...._.-------
KaS
(Vm )KaS
3b I ! 0
hydrological storages
BoSPoS
soil cover (unsaturated)porous aquifer
KaSKuS
karst aquiferfractured rock aquifer
input to the flow systeminfiltration flux (without direct flow)runoffgroundwater outflow from (KaS+KuS)groundwater inflow into (KaS+KuS)drinking water exportdirect runoffindirect runoffinfiltration flux BoSinfiltration flux PoSinfiltration flux (KaS/KuS)seepage flux BoS (KaS/KuS)soil ( water flux BoS-PoS (interflow)ground/karst water flux (KaS!KuS) -poSsoil and groundwater fluxes into PoS
Fig. 2. Hydrological model of Wimbachtal catchment.
water fluxes
Q3 = QtQ3.03 b
Q. = QdQ. -Q3 = Qt00 B
Qo p
QOI:
00 B -
01 +Qz
348 P. MALOSZEWSKI ET AL.
waters , and a certain range of mean transit times. The extreme range of tritiumcontents are shown for the sampling sites in Fig. I.
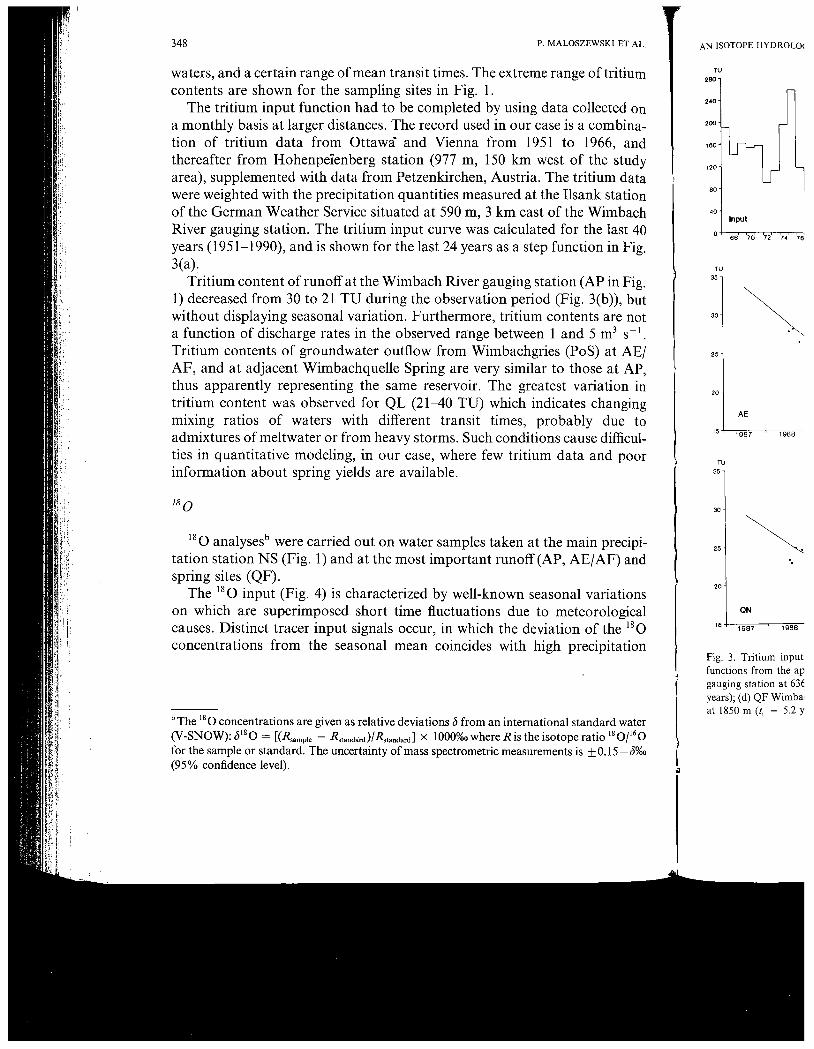
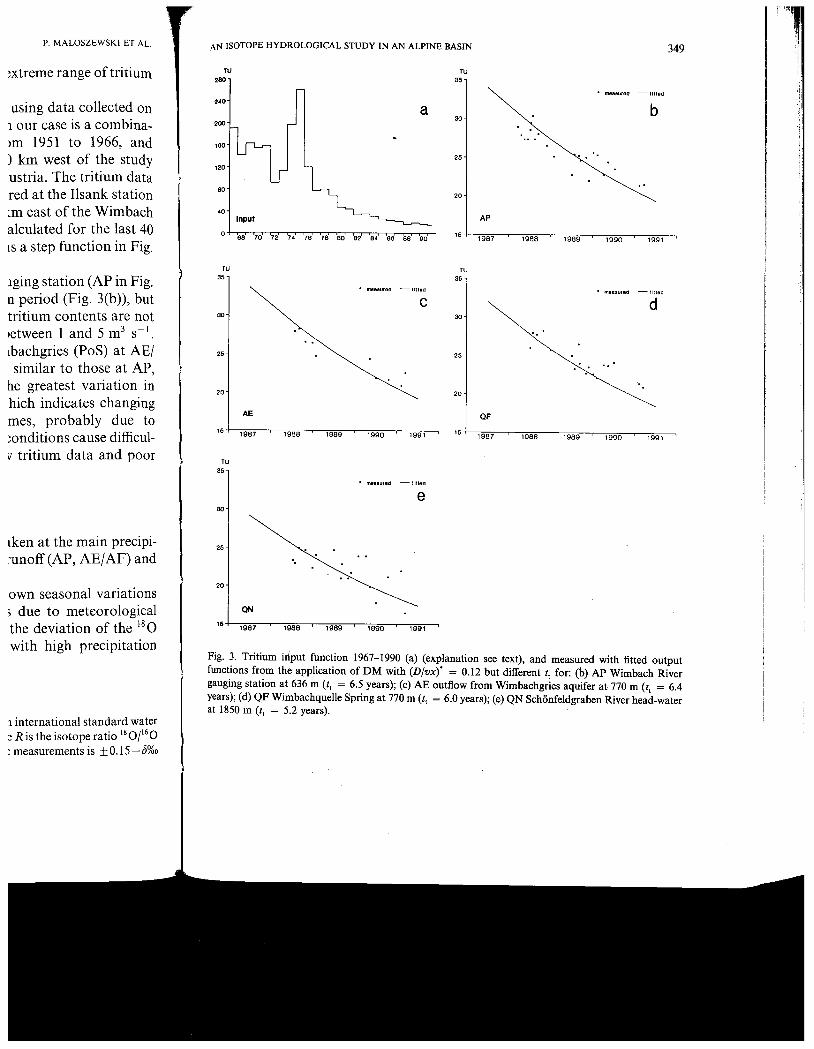
The tritium input function had to be completed by using data collected ona monthly basis at larger distances. The record used in our case is a combina-tion of tritium data from Ottawa and Vienna from 1951 to 1966, andthereafter from Hohenpeienberg station (977 m , 150 km west of the studyarea), supplemented with data from Petzenkirchen, Austria. The tritium datawere weighted with the precipitation quantities measured at the Ilsank stationof the German Weather Service situated at 590 m, 3 km east of the WimbachRiver gauging station. The tritium input curve was calculated for the last 40years (1951-1990), and is shown for the last 24 years as a step function in Fig.3(a).
Tritium content of runoff at the Wimbach River gauging station (AP in Fig.I) decreased from 30 to 21 TV during the observation period (Fig. 3(b)), butwithout displaying seasonal variation. Furthermore , tritium contents are nota function of discharge rates in the observed range between I and 5 m3 S
Tritium contents of groundwater outflow from Wimbachgries (PoS) at AEJ, and at adjacent Wimbachquelle Spring are very similar to those at AP
thus apparently representing the same reservoir. The greatest variation intritium content was observed for QL (21-40 TV) which indicates changingmixing ratios of waters with different transit times, probably due
admixtures of meltwater or from heavy storms. Such conditions cause diffcul-ties in quantitative modeling, in our case , where few tritium data and poorinformation about spring yields are available.
0 analysesb were carried out on water samples taken at the main precipi-
tation station NS (Fig. 1) and at the most important runoff (AP AEJ AF) and
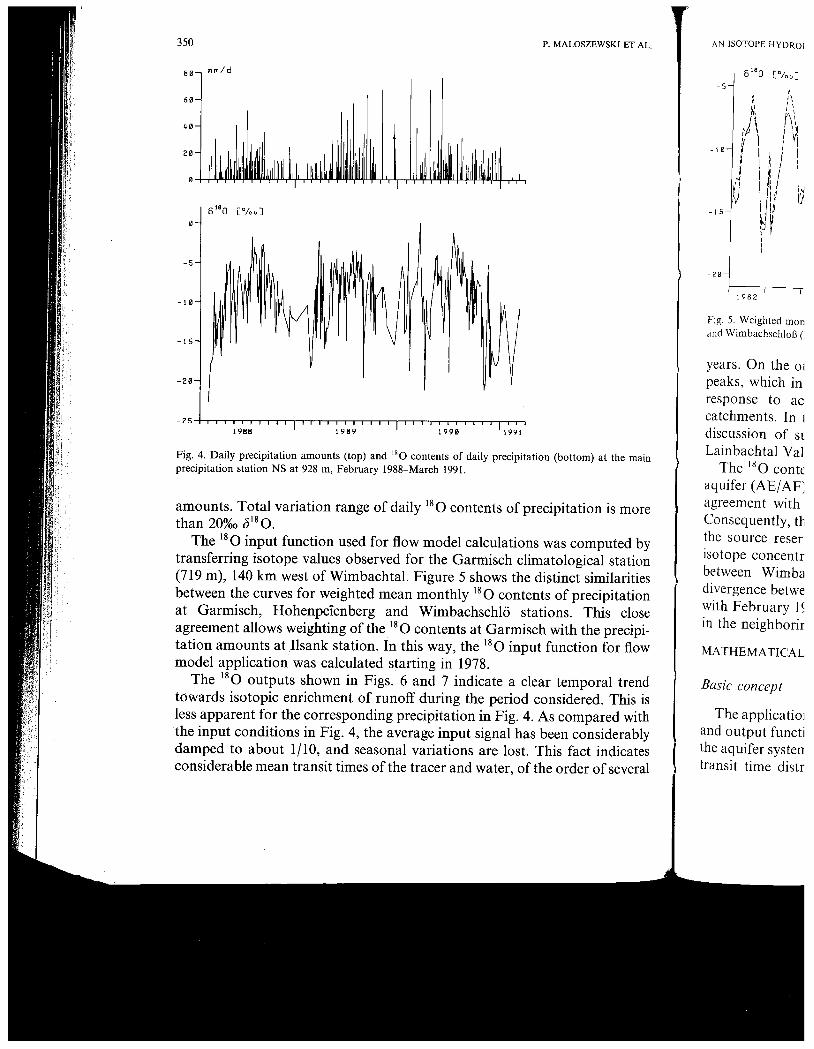
spring sites (QF).The 0 input (Fig. 4) is characterized by well-known seasonal variations
on which are superimposed short time fluctuations due to meteorological
causes. Distinct tracer input signals occur, in which the deviation of the
concentrations from the seasonal mean coincides with high precipitation
The 0 concentrations are given as relative deviations (j from an international standard water(V-SNOW): (j 0 = ((Rsample - Rstandard )/Rstandard J X 1000%n where is the isotope ratio
for the sample or standard. The uncertainty of mass spectrometric measurements is :t 0. 15 - (j%o(95% confidence level).
AN ISOTOPE HYDROLO(
280
2'0
200
'60
'20
Input
68 70 72 74 76
'987 '988
'987 '988
Fig. 3. Tritium inputfunctions from the apgauging station at 63E
years); (d) QF Wimba,at 1850 m (I, = 5.2 Y
P. MALOSZEWSKI ET AL.
xtreme range of tritium
using data collected on1 our case is a combina-)m 1951 to 1966, and) km west of the studyustria. The tritium datared at the Ilsank stationm east of the Wimbachalculated for the last 40
lS a step function in Fig.
Iging station (AP in Fig.n period (Fig. 3(b)), buttritium contents are not)etween 1 and 5 m3 S
lbachgries (PoS) at AE/similar to those at APhe greatest variation in
hich indicates changingmes, probably due onditions cause diffcul-tritium data and poor
tken at the main precipi-runoff (AP , AE/AF) and
own seasonal variationsdue to meteorological
the deviation of the
with high precipitation
II international standard wateris the isotope ratio
; measurements is :! 0. 15 - 15%0
l' '
AN ISOTOPE HYDROLOGICAL STUDY IN AN ALPINE BASIN 349
280
2-0
. .
. mellsured lilted
200
'60
'987 199'
120
Input
68 70 74 76 7800 84 86MOO 1988 1989 1990
. me811ured lItted . me8sured rilled
25
1987 1988 1989 '990 1991 '987 1988 '989 1990 '991
mellsured rllted
1987 1988 1989 1990 '991
Fig. 3. Tritium irlput function 1967-1990 (a) (explanation see text), and measured with fitted outputfunctions from the application of DM with (D/vx) = 0.12 but different I, for: (b) AP Wimbach Rivergauging station at 636 m (I, = 6.5 years); (c) AE outflow from Wimbachgries aquifer at 770 m (I, = 6.4years); (d) QF Wimbachquelle Spring at 770 m (I, = 6.0 years); (e) QN Sch6nfeldgraben River head-waterat 1850 m (I, = 5.2 years).
350 P. MALOSZEWSKI ET AL.
80 ",,,/d
2 0
0 L:o/oo
- 5
-10
1988 1989 1990 1991
Fig. 4. Daily precipitation amounts (top) and 0 contents of daily precipitation (bottom) at the mainprecipitation station NS at 928 m, February 1988-March 1991.
amounts. Total variation range of daily 0 contents of precipitation is morethan 20%0
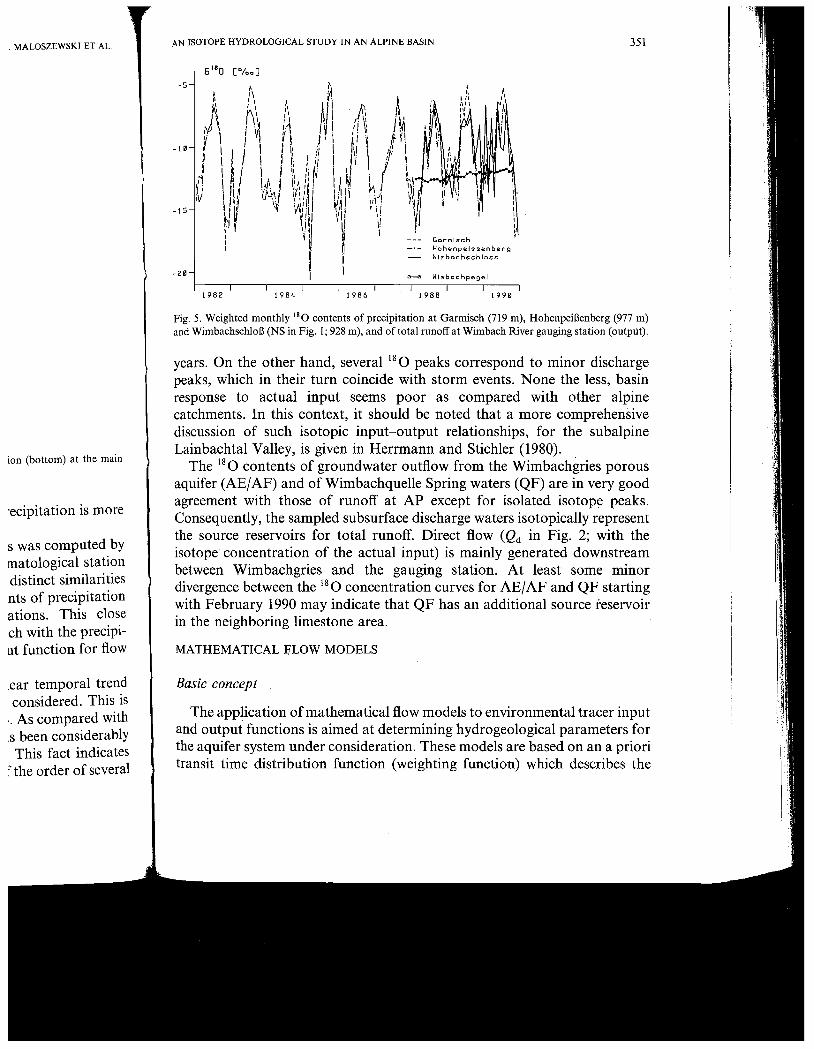
The 0 input function used for flow model calculations was computed bytransferring isotope values observed for the Garmisch climatological station(719 m), 140 km west of WimbachtaI. Figure 5 shows the distinct similaritiesbetween the curves for weighted mean monthly 0 contents of precipitationat Garmisch, Hohenpeienberg and Wimbachschlo stations. This closeagreement allows weighting of the 0 contents at Garmisch with the precipi-tation amounts at Ilsank station. In this way, the 0 input function for flowmodel application was calculated starting in 1978.
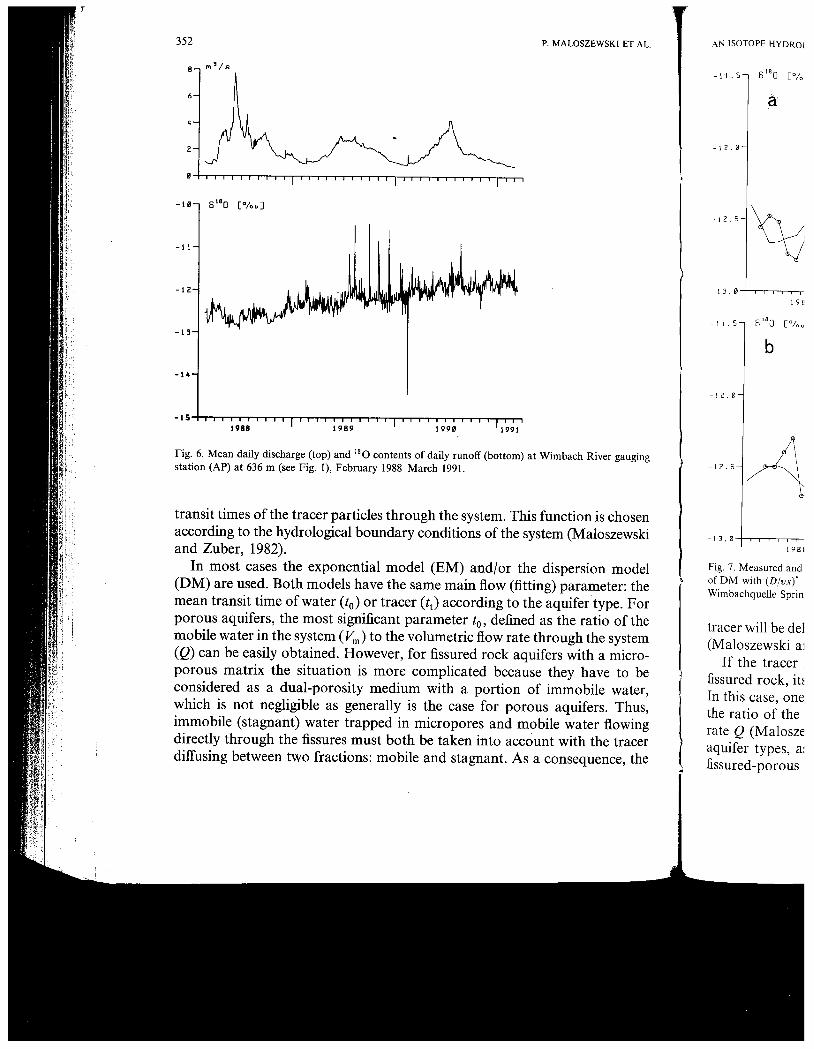
The 0 outputs shown in Figs. 6 and 7 indicate a clear temporal trendtowards isotopic enrichment of runoff during the period considered. This isless apparent for the corresponding precipitation in Fig. 4. As compared withthe input conditions in Fig. 4, the average input signal has been considerablydamped to about 1/10 and seasonal variations are lost. This fact indicatesconsiderable mean transit times of the tracer and water, of the order of several
AN ISOTOPE HYDROI
0 (O/ooJ- 5 I'
" ,
!I'
f\ \
)\
I I
I!
,"j
I 'II :J 111:
1113\.1
- 1 0
- 1 5
- 2 0
1982
Fig. 5. Weighted monand Wimbachschlol3 (
years. On the 01
peaks , which inresponse to ac
catchments. In
discussion of Sl
Lainbachtal ValThe 0 conte
aquifer (AE/AF;agreement withConsequently, tuthe source reserisotope concentrbetween Wimbadivergence betwewith February I
in the neighborir
MATHEMATICAL
Basic concept
The applicatioJand output functithe aquifer systentransit time distr
. MALOSZEWSKI ET AL.
ion (bottom) at the main
ecipitation is more
s was computed bymatological stationdistinct similarities
nts of precipitationations. This closech with the precipi-ut function for flow
lear temporal trendconsidered. This is. As compared withlS been considerably. This fact indicatesf the order of several
AN ISOTOPE HYDROLOGICAL STUDY IN AN ALPINE BASIN 351
! "
- 5
0 (0/00 J1\ :\
1\ /Y 1
)\
1\, :i\\ 1M ,
V \ I /
;:\
:! \ Iii It\
\\ f: # I I I j
iJ \ II!
V:!i I H I \\L ii \\ 'I \I!
I' 'l 1
'II/ \I \1
i I
---
Gor lschn -
.-
HohenpelssenbergWIPlbochschlass
Wil"bochpegel
1982 1984 1986 1988 1990
Fig. 5. Weighted monthly 0 contents of precipitation at Garmisch (719 m), Hohenpeil3enberg (977 m)and Wimbachschlol3 (NS in Fig. 1; 928 m), and of total runoff at Wimbach River gauging station (output).
years. On the other hand , several 0 peaks correspond to minor discharge
peaks, which in their turn coincide with storm events. None the less , basinresponse to actual input seems poor as compared with other alpinecatchments. In this context, it should be noted that a more comprehensivediscussion of such isotopic input-output relationships, for the subalpineLainbachtal Valley, is given in Herrmann and Stichler (1980).
The 0 contents of groundwater outflow from the Wimbachgries porousaquifer (AEjAF) and ofWimbachquelle Spring waters (QF) are in very goodagreement with those of runoff at AP except for isolated isotope peaks.Consequently, the sampled subsurface discharge waters isotopically representthe source reservoirs for total runoff. Direct flow (Qd in Fig. 2; with the
isotope concentration of the actual input) is mainly generated downstreambetween Wimbachgries and the gauging station. At least some minordivergence between the 0 concentration curves for AEjAF and QF startingwith February 1990 may indicate that QF has an additional source reservoirin the neighboring limestone area.
MATHEMATICAL IILOW MODELS
Basic concept
The application of mathematical flow models to environmental tracer inputand output functions is aimed at determining hydrogeological parameters forthe aquifer system under consideration. These models are based on an a prioritransit time distribution function (weighting function) which describes the
! '
352 P. MALOSZEWSKI ET AL.
B ", ' / s
-10 /00 J
-13
-14
-151988 1989 1990 1991
Fig. 6. Mean daily discharge (top) and IS O contents of daily runoff (bottom) at Wimbach River gaugingstation (AP) at 636 m (see Fig. I), February 1988-March 1991.
transit times of the tracer particles through the system. This function is chosenaccording to the hydrological boundary conditions of the system (Maloszewskiand Zuber, 1982).
In most cases the exponential model (EM) and/or the dispersion model(DM) are used. Both models have the same main flow (fitting) parameter: themean transit time of water (to or tracer (tt according to the aquifer type. Forporous aquifers , the most significant parameter defined as the ratio of themo bile water in the system to the volumetric flow rate through the system(Q) can be easily obtained. However, for fissured rock aquifers with a micro-porous matrix the situation is more complicated because they have to beconsidered as a dual-porosity medium with a portion of immobile waterwhich is not negligible as generally is the case for porous aquifers. Thusimmobile (stagnant) water trapped in micropores and mobile water flowingdirectly through the fissures must both be taken into account with the tracerdiffusing between two fractions: mobile and stagnant. As a consequence , the
AN ISOTOPE HYDRO I
- 1'1 . 5 0 (0
- 1 2 . 0
12. 5
13. 0
19 E
- 1 1 . 5 lao
- 1 2 . 0
- 1 2 . 5
- 1 3 . 019 B 1
Fig. 7. Measured andof DM with (D/vx)"Wimbachquelle Sprin
tracer will be del(Maloszewski
If the tracer
fissured rock , itIn this case , onethe ratio of the
rate (Maloszeaquifer types, a:
fissured-porous
P. MALOSZEWSKI ET AL.
a) at Wimbach River gauging
his function is chosensystem (Maloszewski
the dispersion modelfitting) parameter: the) the aquifer type. Fortled as the ratio of thelte through the systemaquifers with a micro-ause they have to be
n of immobile water
orous aquifers. Thusmobile water flowingccount with the tracerAs a consequence , the
AN ISOTOPE HYDROLOGICAL STUDY IN AN ALPINE BASIN 353
1"1 5 0 (O/oo
12.
12.
fTeosuredfitted
13.
1988 1989 19 9
- 1 I . 5 6 LBO (0/00 J
- 1 2.
12.
measuredfitted
- 1 3.
1988 1989 199
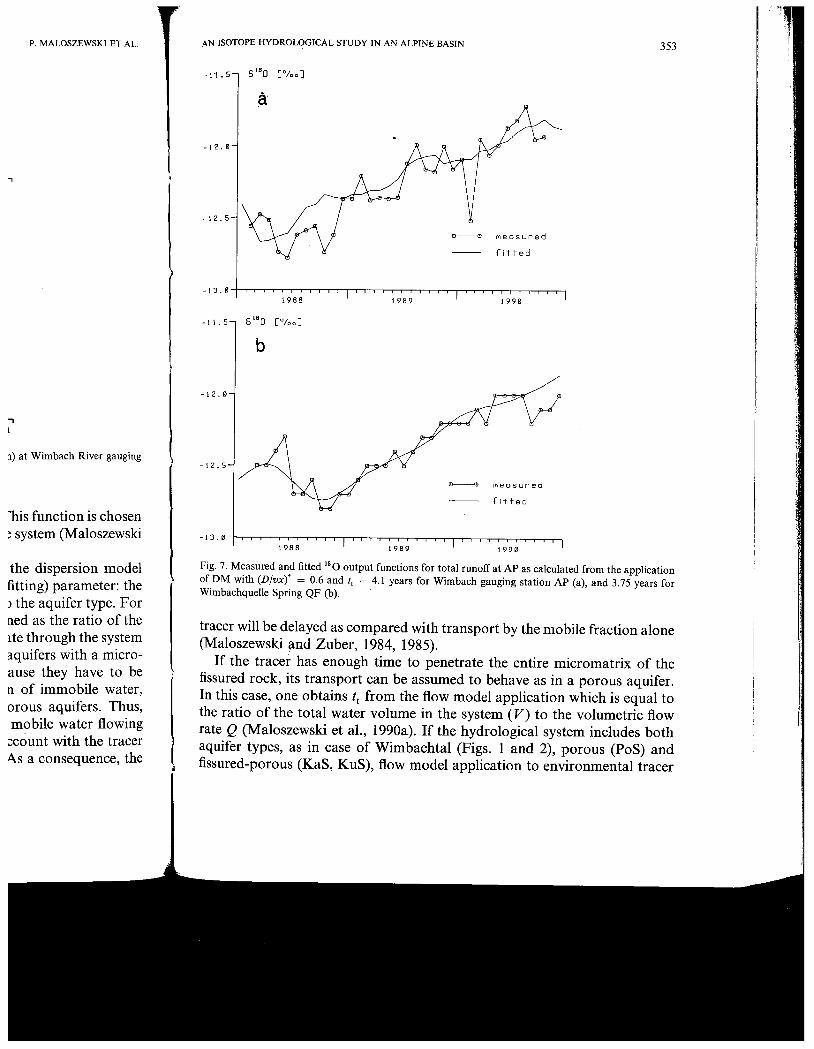
Fig. 7. Measured and fitted IS O output functions for total runoff at AP as calculated from the applicationofDM with (D/vx)' = 0.6 and It = 4. 1 years for Wimbach gauging station AP (a), and 3.75 years forWimbachquelle Spring QF (b).
tracer wil be delayed as compared with transport by the mobile fraction alone(Maloszewski ;md Zuber, 1984, 1985).
If the tracer has enough time to penetrate the entire micro matrix of thefissured rock , its transport can be assumed to behave as in a porous aquifer.In this case, one obtains from the flow model application which is equal tothe ratio of the total water volume in the system (V) to the volumetric flowrate (Maloszewski et aI. , 1990a). If the hydrological system includes bothaquifer types , as in case of Wimbachtal (Figs. 1 and 2), porous (PoS) andfissured-porous (KaS , KuS), flow model application to environmental tracer
354 P. MALOSZEWSKI ET AL.
concentrations at the exit of the groundwater system does not yield the meantransit time of water, but rather the mean transit time of tracer. However, itis possible to estimate if independent measurements of both fissure andmatrix porosities are performed (Herrmann et aI. , 1989).
A second parameter resulting from application of the dispersion model D/vx for porous and (D/vx)* for fissured-porous (fractured rock) aquifers.D/vx equals l/Pe , where Pe is the Pec1et number. The dispersion parameter(D/vx)* describes the variation of the transit times of the tracer throughfissures as a result of dispersion in fissures and diffusion between mobile andstagnant water.
For the hydrological system in a steady state, the relation between thetracer input C (t) and output concentrations Caul (t) is described by the
convolution integral:
out U) = roO Cin -r)g(r)exp( -h)d-r (1)
where is the decay constant (A = 0 for stable isotopes), and g(-r) is theweighting function defined for the one-parameter exponential model (EM) as:
g( -r ) 1/ exp ( -r /
and for the two-parameter dispersion model (DM) as:
(2)
g(-r) = (Pe/(4n-r/T))0. exp (- Pe(1- -r/T)2 /(4-r/T))/-r (3)
where is the mean transit time of water or of tracer and Pe is equal to1/(D/vx) or l/(D/vx)' according to the aquifer type.
Preparation of input functions
TritiumTritium concentration in precipitation has been highly variable since 1952.
It increased to maximum concentrations in 1963 , and then decreased. Sinceprecipitation depths vary from month to month, Davis et al. (1967) and
Dincer and Davis (1967) introduced a simple infiltration model to overcomethese diffculties. The tritium input function is calculated separately for eachyear by weighting the monthly tritium content of precipitation with the
monthly precipitation depth P; and the infiltration coeffcient a as follows:12
C = "5Ja p;CJ/"5Ja
p;)
(4)
Usually, the values are not known. It is , therefore , assumed that duringeach year only two constant values exist instead of 12 infiltration coeffcients
AN ISOTOPE HYDROLOGI
rJj for each ith
and a for winterto winter coeffcie
By introducing
C =
Lat(PCJ+
A still unsolvedvalues is assumedduring the summeyear. Grabczak ettion of a. Accordithe system Cground
ground = Cinr
which is calculatewhole observatiOlfollowing formulc
rJ = CJ-
where Ls and Lof the observatioJ
On the other h
rJ = (Qs )/(Qw
where Qs, s,
the summer and,
For 0 it is calculating annuafrom year to yearconcentration.
Hence , the inplinfiltration modelinfiltration modecalculation of the
NaPIn I I
with a i being redution coeffcients s
P. MALOSZEWSKI ET AL.
; not yield the mean. tracer. However, it
of both fissure and
dispersion model isIred rock) aquifers.
ispersion parameterthe tracer through
between mobile and
lation between theIS described by the
(1 )
)es), and g('r) is theltial model (EM) as:
(2)
(3)
(,
and Pe is equal to
variable since 1952.
hen decreased. Since
vis et aI. (1967) and1 model to overcomed separately for each
ipitation C with the
ficient Cti as follows:
(4)
assumed that duringlfiltration coeffcients
AN ISOTOPE HYDROLOGICAL STUDY IN AN ALPINE BASIN 355
!Xi for each ith month: for the summer months = 4-9 (April-September),and for winter months = 10-3 (October-March). The ratio of summerto winter coeffcient is the infiltration parameter Ct f Ct
By introducing Ct into eqn. (4) this equation can be easily simplified:
C = I(Pi C;) t(P;C;)J/(
)+
I(P;)10 (5)
A stil unsolved problem is the estimation of Ct. Usually, one of two extremevalues is assumed for e. Ct = 0 which means that infiltration does not occurduring the summer months, and Ct 1 indicating infiltration throughout theyear. Grabczak et aI. (1984) proposed the use of isotope data for determina-tion of Ct. Accordingly, the mean stable isotope content of the outflow fromthe system Cground must be equal to that of the infiltration water Cinf
ground = Cinf (6)
which is calculated as the weighted mean value by applying eqn. (5) for thewhole observation period of years. Combining eqns. (5) and (6) gives thefollowing formula for Ct (Grabczak et aI. , 1984):
!X ('P;C;)- grOUnd(p;)J/(
ground (P;)- (P;CJJ (7)
where Ls andLw are the sums calculated for all summer and winter monthsof the observation period of years (i. e. 6N months for each of them).
On the other hand Ct can be approximated using hydrological data:
!X (Qs )f(Qw (8)
where Qs,
.,
Qw and are the mean discharge and precipitation depths forthe summer and winter months, respectively.
For 0 it is not possible to apply the same procedure as for tritium, i.
calculating annual mean values. The annual mean values do not change much.from year to year, thus producing isotope input functions of almost constantconcentration.
Hence, the input function calculated on a monthly basis is required and theinfiltration model described in Bergmann et aI. (1986), which is similar to theinfiltration model for tritium is adopted in this paper. The formula forcalculation of the input function for each ith month is as follows:
(!; =
(NCt; P;(C; ground ))f I (Ct P;)+Cground; = I
(9)
with being reduced to the appertaining winter (Ct and summer (CtJ infiltra-tion coeffcients similarly as for tritium.
356 P. MALOSZEWSKI ET AL.
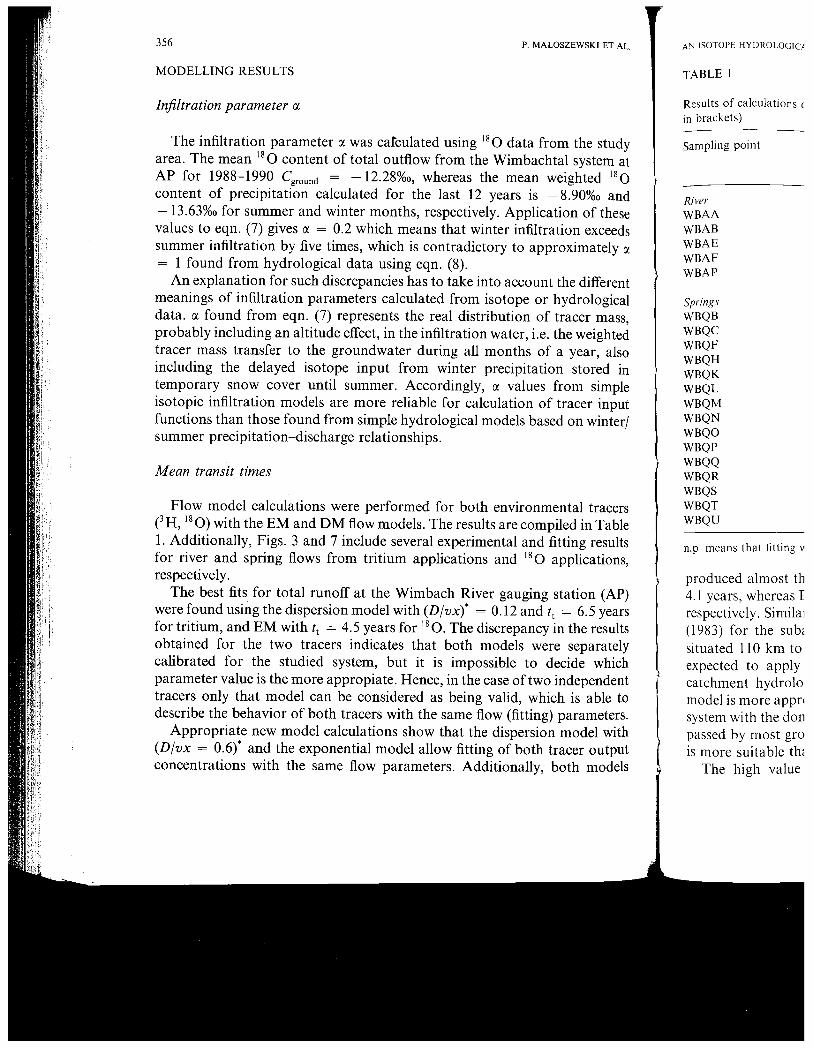
MODELLING RESULTS
Infltration parameter
The infiltration parameter (X was cafculated using 0 data from the studyarea. The mean 0 content of total outflow from the Wimbachtal system atAP for 1988- 1990 Cground
= -
12. 28%0, whereas the mean weighted
content of precipitation calculated for the last 12 years is - 8.90%0 and13. 63%0 for summer and winter months , respectively. Application of these
values to eqn. (7) gives (X = 0.2 which means that winter infiltration exceedssummer infiltration by five times , which is contradictory to approximately = I found from hydrological data using eqn. (8).
An explanation for such discrepancies has to take into account the differentmeanings of infiltration parameters calculated from isotope or hydrologicaldata. (X found from eqn. (7) represents the real distribution of tracer massprobably including an altitude effect, in the infiltration water , i.e. the weightedtracer mass transfer to the groundwater during all months of a year, alsoincluding the delayed isotope input from winter precipitation stored intemporary snow cover until summer. Accordingly, (X values from simpleisotopic infiltration models are more reliable for calculation of tracer inputfunctions than those found from simple hydrological models based on winterfsummer precipitation-discharge relationships.
Mean transit times
Flow model calculations were performed for both environmental tracers0) with the EM and DM flow models. The results are compiled in Table
1. Additionally, Figs. 3 and 7 include several experimental and fitting resultsfor river and spring flows from tritium applications and 0 applications
respectively.The best fits for total runoff at the Wimbach River gauging station (AP)
were found using the dispersion model with (Dlvx)' = 0. 12 and = 6. 5 yearsfor tritium , and EM with = 4. 5 years for 0. The discrepancy in the resultsobtained for the two tracers indicates that both models were separatelycalibrated for the studied system, but it is impossible to decide whichparameter value is the more appropiate. Hence , in the case of two independenttracers only that model can be considered as being valid , which is able todescribe the behavior of both tracers with the same flow (fitting) parameters.
Appropriate new model calculations show that the dispersion model with(Dlvx = 0.6)' and the exponential model allow fitting of both tracer outputconcentrations with the same flow parameters. Additionally, both models
AN ISOTOPE HYDROLOGIC;
TABLE I
Results of calculations (in brackets)
Sampling point
RiverWBAAWBABWBAEWBAFWBAP
SpringsWBQBWBQCWBQFWBQHWBQKWBQLWBQMWBQNWBQOWBQPWBQQWBQRWBQSWBQTWBQU
p. means that fitting v
produced almost th1 years , whereas I
respectively. Similal
(1983) for the sub,
situated 110 km toexpected to apply
catchment hydrolomodel is more apprcsystem with the donpassed by most grois more suitable th,
The high value
IALOSZEWSKI ET AL.
from the studychtal system at
weighted
- 8.90%0 and
lcation of these
tration exceeds
pproximately
mt the different)r hydrologicalof tracer masse. the weightedof a year, also
tion stored in
s from simple
of tracer input
ased on winterf
1men tal tracers
mpiled in Tabled fitting results
o applications
tlg station (AP)= 6. 5 years
cy in the results
iVere separately) decide which
wo independent
vhich is able tong) parameters..ion model with:h tracer outputy, both models
AN ISOTOPE HYDROLOGICAL STUDY IN AN ALPINE BASIN
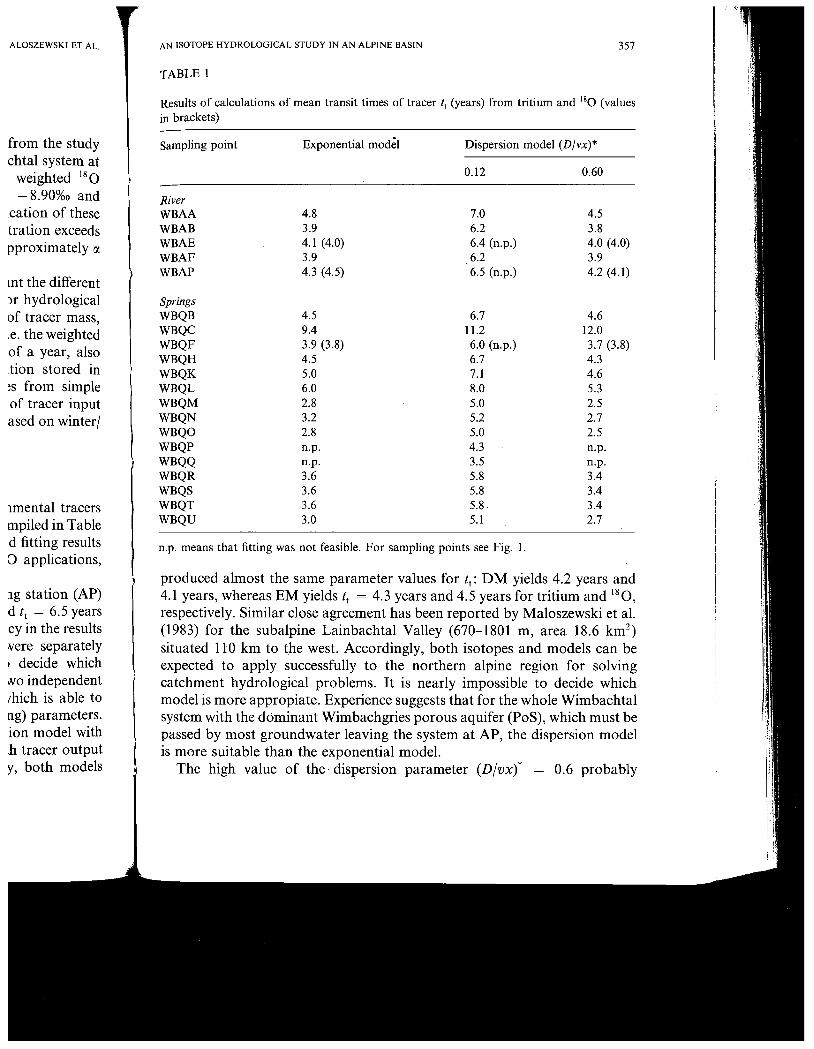
TABLE 1
Results of calculations of mean transit times of tracer (years) from tritium and ISO (valuesin brackets)
Sampling point Exponential model Dispersion model (D/vx)*
RiverWBAAWBABWBAE 4.1 (4. 6.4 (n. 0 (4.WBAFWBAP 3 (4. 5 (n. 2 (4.
SpringsWBQBWBQC 9.4 11.2 12.
WBQF 9 (3. 0 (n. 7 (3.WBQHWBQK 7.1
WBQLWBQMWBQNWBQOWBQPWBQQWBQR 3.4WBQS 3.4WBQT 3.4WBQU
p. means that fitting was not feasible. For sampling points see Fig. 1.
produced almost the same parameter values for DM yields 4.2 years and4.1 years , whereas EM yields = 4. 3 years and 4. 5 years for tritium and respectively. Similar close agreement has been reported by Maloszewski et aI.(1983) for the subalpine Lainbachtal Valley (670- 1801 m, area 18.6 kmsituated 110 km to tpe west. Accordingly, both isotopes and models can beexpected to apply successfully to the northern alpine region for solvingcatchment hydrological problems. It is nearly impossible to decide whichmodel is more appropiate. Experience suggests that for the whole Wimbachtalsystem with the dominant Wimbachgries porous aquifer (PoS), which must bepassed by most groundwater leaving the system at AP , the dispersion modelis more suitable than the exponential model.
The high value of the. dispersion parameter (D/vx)* = 0.6 probably
357
358 P. MALOSZEWSKI ET AL.
indicates that the hydrological system is hydraulically highly inhomogeneousand anisotropic , andjor that infiltration is distributed over the greater part ofthe catchment area. It is most likely that the greater part of the tracer flowsthrough the fissured-porous aquifer (KuS) at the base of the system , wherediffusion between stagnant and mobile water plays an important role andincreases the dispersion parameter.
It is necessary to point out that neither the EM or DM with (Djvx)* = 0.were able to fit the tritium contents measured in the springs QP and QQ (Fig.I). According to Table 1 , mean transit times for both springs are the shortestof all values of found from the DM application with (Djvx)* = 0. 12. A highcontribution of actual meltwater to spring yield and , therefore , larger directflow proportions could be an explanation for the divergence at QP and QQ.On the other hand , the exceptionally high for tritium found at QC isapparently not realistic considering the hydrogeological conditions. It shouldbe mentioned that all springs except QH and QF obviously drain thelimestone on top.
Accordingly, (Djvx)* has not necessarily the same value at every site. Thismeans that for QP and QQ only one solution is possible where the smaller(Djvx) value probably signifies a more homogeneous aquifer represented byboth observation sites.
Most remarkable fitting results are obtained for 0 content of total runoffat Wimbach River gauging station AP and at Wimbachquelle Spring QFrespectively, from dispersion model application with (Djvx)* = 0.6 as shownin Fig. 7. Similar good agreement between experimental and fitted data of
under natural conditions was found , for instance, in bank filtration studieswhere the isotopic input functions were directly determined for the riverwater , and not calculated (Stichler et aI. , 1986; Hotzl et aI. , 1989; Maloszewskiet aI. , 1990b). As a consequence , contribution of actual water (direct flow in Fig. 2) to total runoff and spring flow is negligible , and this applies evenmore so in the case of the spring than in total river flow.
As a final conclusion from the flow model applications, the water fluxesmeasured at AP AEjAF and QF are identical from the isotopic point of viewsuggesting that they originate from the same resource, that is , the porousWimbachgries aquifer (PoS). Other sources appear negligible , which suggeststhat direct flow plays a subordinate role in the Wimbachtal system , as alreadyconcluded from the interpretation of the 0 data in Figs. 4 and 6.
DISCUSSION
Considering the simplification of natural conditions that is necessarilyconnected with the modelling procedures , the transit times of tracer obtained
AN ISOTOPE HYDROLOGI'
from using tritiurrflow models, are
observed for the Lvolume there wasstagnant plus mobtwo isotopes with,though the ace ural
Using the compof both DM applic
' SI for the pen
+ stagnant) can b(
of 0 output cone
low , i.e. less than 5'
snowmelt). Accorc
catchment system
water depth of 6.Assuming an es
with an effective piavailable for the wbe unsaturated , an10 % vol. and 2j3porosity of 30% , t
is 470 X 10
' .
half tha t estimatedin the studied syst,from hydrologicalexperiments are cu
ACKNOWLEDGMEJ
The financial sUI
the obliging help 0Bayerisches Geologeophysical data a
REFERENCES
Bergmann , H. , Sackl , Jin a small catchmcnWater Tracing, 22-tion , Athens , pp. 2:
P. MALOSZEWSKI ET AL.
ly inhomogeneousthe greater part ofof the tracer flows
the system , wherenportant role and
Nith (D/vx)* = 0.s QP and QQ (Fig.tlgs are the shortestIX)* = 0. 12. A highefore , larger directlee at QP and QQ.n found at QC ismditions. It should)Viously drain the
at every site. This: where the smallerLifer represented by
ltent of total runofflquelle Spring QFx)* = 0.6 as shownld fitted data of
lk filtration studies
tlined for the river
1989; Maloszewskiater (direct flow ld this applies even
, the water fluxes
,topic point of viewthat is , the porousible , which suggestsII system , as alreadys. 4 and 6.
that is necessarily
~s of tracer obtained
AN ISOTOPE HYDROLOGICAL STUDY IN AN ALPINE BASIN 359
from using tritium and 0 measurements with exponential and dispersionflow models , are in very good agreement. Similar agreement has beenobserved for the Lainbachtal Valley (Maloszewski et aI. , 1983), but the watervolume there was incorrectly interpreted as mobile water only rather thanstagnant plus mobile water. Reliability ofresults is supported by the fact thattwo isotopes with different origins and input functions have been used, eventhough the accuracy of the results is diffcult to evaluate directly.
Using the computed mean transit time of tracer of 4. 15 years , the averageof both DM applications to both tritium and , and mean discharge of 1.75
I for the period 1968- 1990 , the total subsurface water volume (mobile+ stagnant) can be estimated to be: 230 X 10 . The small variationsof 0 output concentrations indicate that the direct runoff proportion is verylow , i.e. less than 5% of total runoff for some investigated flood events (stormsnowmelt) Accordingly, the total groundwater storage of the Wimbachtalcatchment system is in the order of 220 x , which is equivalent to awater depth of 6.6 m over the catchment area of 33.4 km
Assuming an estimated Wimbachgries storage volume of 2000 x
with an effective porosity of 0. , then a storage potential of 600 x available for the whole PoS reservoir. Since 1/3 of the PoS volume appears tobe unsaturated , and supposing that the mean water content of this portion is10 % vol. and 2/3 of the PoS volume is totally saturated with an effectiveporosity of 30% , the estimated water volume of the Wimbachgries reservoiris 470 x 10 . The water volume computed from isotopic data is only abouthalf that estimated. On the other hand , the isotope investigations suggest thatin the studied system only half as much water is stored than was estimatedfrom hydrological data. In ord r to resolve this discrepancy dye tracerexperiments are currently being performed.
ACKNOWLEDGMENTS
The financial support of the National Park Authority at Berchtesgaden' andthe obliging help of the Bayerisches Landesamt fUr Wasserwirtschaft and theBayerisches Geologisches Landesamt in Munich in making discharge andgeophysical data available are thankfully acknowledged.
REFERENCES
Bergmann, H. , Sackl, 8. , Maloszewski , P. and Stichler , W. , 1986. Hydrological investigationsin a small catchment area using isotope data series. In: Proc. 5th Int. Symp. on UndergroundWater Tracing, 22-27 September 1986, Athens. Institute of Geology and Mineral Explora-tion, Athens, pp. 255-272.
; i
360 P. MALOSZEWSKI ET AL.
Davis , G. , Dincer, T. , Florkowski , T. , Payne, B. and Gattinger , T. , 1967. Seasonal variationsin the tritium content of groundwaters of the Vienna basin. In: Isotope Hydrology 1966.IAEA , Vienna, pp. 451-473.
Dincer , T. and Davis , G. , 1967. Some considerations on tritium dating and the estimates of thetritium input functions. IAH Congr. , Istanbu!. Mem. IAH , pp. 276-278.
Einsele, G. (Editor), 1986. Das landschaftsokologische Forschungsprojekt NaturparkSchonbuch (Geoecological Research Project Schonbuch Nature Park). VCH , Weinheim636 pp.
Ganss, O. and Griinfelder , S. , 1974. Geologie der Berchtesgadener und Reichenhaller Alpen.A. Plenk , Berchtesgaden, 152 pp.
Grabczak , J. , Maloszewski , P. , Rozanski, K. and Zuber, A. , 1984. Estimation of the tritiuminput function with the aid of stable isotopes. Catena, 11: 105- 114.
Herrmann , A. and Stichler, W. , 1980. Groundwater-runoff relationships. Catena , 7: 251-264.Herrmann , A. , Koll , J. , Leibundgut , Ch. , Maloszewski , P. , Rau , R. , Rauert , W. , Schoniger , M.
and Stichler, W. , 1989. Wasserumsatz in einem kleinen einzugsgebiet im paliiozoischenmittelgebirge (Lange Bramke , Oberharz). Eine hydrologische systemanalyse mittels umwel-tisotopen als tracer (Turnover of water in a small catchment area of paleozoic rock. Ahydrological system analysis by using environmental isotopes as tracers). Landschaft-sokologie u. Umweltforschung, 17: 1- 186 , Braunschweig.
Hotzl, H. , Reichert, B. , Maloszewski, P. , Moser, H. and Stichler, W. , 1989. Contaminanttransport in bank filtration Determining hydraulic parameters by means of artificial andnatural labeling. In: Proc. Int. Symp. on Contaminant Transport in Groundwater, 4-6 April1989 , Stuttgart. Balkema, Rotterdam, pp. 65-71.
Maloszewski , P. and Zuber , A. , 1982. Determining the turnover time of groundwater systems
with the aid of environmental tracers , 1. Models and their applicability. J. Hydro!. , 57:207-231.
Maloszewski , P. and Zuber , A. , 1984. Interpretation of artificial and environmental tracers infissured rocks with a porous matrix. In: Isotope Hydrology 1983. IAEA, Vienna
, pp.
635-651.Maloszewski , P. and Zuber, A. , 1985. On the theory of the tracer experiments in fissured rocks
with a porous matrix. J. Hydro!. , 79: 333-358.Maloszewski , P. , Rauert , W. , Stichler, W. and Herrmann , A. , 1983. Application of flow models
in an alpine catchment area using tritium and deuterium data. J. Hydro!. , 66: 319-330.Maloszewski , P. , Rauert, W. , Stichler, W. and Herrmann, A. , 1990a. Bestimmung hydrogeo-
logischer parameter in einzugsgebieten mit kluftaquiferen unter verwendung von umwel-tisotopen und mathematischen flieBmodellen (Determination of hydrogeologicalparameters in catchment areas with fissured rock aquifers by using environmental isotopesand mathematical flow models). Freiberg. Forschungsh. C 442 Geowissenschaften
, pp.
11-21.Maloszewski , P. , Moser, H. , Stichler, W. , Bertleff, B. and Hedin, K. , 1990b. Modelling of
groundwater pollution by river bank filtration using oxygen- l 8 data. IAHS Pub!. No. 173Groundwater Monitoring and Management. IAHS , Wallingford , pp. 153- 161.
Moser , H. , Escher-Vetter , H. , Oerter, H. , Reinwarth, O. and Zunke , D. , 1986. AbfluB; in undvon Gletschern (Runoff in and from Glaciers). GSF-Bericht 41/86 , Part I (147 pp. ) and PartII (408 pp. ), Neuherberg.
Stichler , W. , Maloszewski , P. and Moser, H. , 1986. Modelling of river water infiltration usingoxygen- 18 data. J. Hydro!. , 83: 355-365.
Journal of Hydrolog.Elsevier Science Pub
(3)
Experimenof se
C. Ferrier , R.
Macaulay 1
Fresh
ABSTRACT
Ferrier, R. , McMahcExperimental stream
140: 361-370.
An acidification expeThe stream was chosen bmade to approximatelyand hydrogen , and a notdivalent cation responsealuminium release resultia program of slream spdifferent sources of alum1significantly under lowcontribute to match obsl
INTRODUCTION
The hydrologicupon its drainageintensity and thedominant soil typehydrological respotheir contributionthrough organic sc
the mineral soils , b
Correspondence to: RAberdeen , AB9 2QJ, 1
0022- 1694/92/$05.