Embed Size (px)
Citation preview
ISOM2017: THE NEW SPECIFICATION OF ORIENTEERING MAPS (AN INSIGHT)
László Zentai
László ZENTAI; Department of Cartography and Geoinformatics, ELTE Eötvös Loránd University, Budapest, Hungary; Address: Pázmány Péter sétány 1/A, 1117 Budapest, Hungary; Tel. +36 1 372 2975, E-mail: [email protected]
Abstract Orienteering maps are one of the very few maps where the map specification is internationally standardised. As orienteering maps are a kind of sport goods, the standardisation of these cartographic products was a must to guarantee the fairness of the sport. The latest specification of (forest) orienteering maps was published in 2000. Although there were no urgent issues, the development of the sport and the IT technologies required regular revision of the map specification. After the release of the previous International Specification on Orienteering Maps (ISOM), a new form of event, the sprint format was developed. As sprint events are regularly organised in urban environment (park, or downtown area), a new maps specification was developed in the first decade of the 20th century (ISSOM = International Specification of Sprint Orienteering Maps). The recent update of ISOM originally would include both specifications (ISOM and ISSOM), but finally only the ISOM was the focus.
Keywords: orienteering maps, topographic maps, standardization, legend, cartographic symbols
WHY ORIENTEERING MAPS ARE SO SPECIAL?
History
Orienteering maps are one of the very few maps where the map specification is internationally standardised. The standardisation was a relatively fast process, although the sport itself is more than 100 years old; there was not too much focus on maps and practically nothing on the standardisation in the first half of the progress. If we check the milestones of the orienteering mapping, we can recognise that from the emerging of orienteering as a civil sport (since the very last years of the 19th century) till the end of World War II, there was no chance of creating special orienteering maps. Due to the very complicated process of map production (in general), only national mapping authorities or large commercial companies were able to publish maps, and the only form of publishing was the offset printing (suitable printing quality, affordable for larger quantity prints in colour). Only professional cartographers were able to manage almost all phases of the map production process in the pre-digital era, so the only chance for using maps for the orienteering sport was to use state topographic or other maps like tourist maps in the Cold War era in Eastern Europe, when state topographic maps were classified and civil users had no access to such maps.
After World War II, when enough experiences of the international orienteering events (started among Scandinavian countries since the 1920’s) were accumulated, the implementation of relatively new technologies (stereophotogrammetry, drawing folios, etc.) started, partly initiated by Scandinavian cartographers who also practised the orienteering sport. Thanks to the development of the map printing technologies, the colour offset became more and more affordable (the first orienteering event when colour offset printed maps were used was organised in Norway in 1950). The massification of the sport in the most developed orienteering countries and the continuously increasing number of athletes reached the level of participation where the most affordable and manageable map production process for orienteering maps became the offset printing. Although it was not a very fast process, the establishing of the International Orienteering Federation (IOF) in 1961, the introduction of the official European Orienteering Championships in 1962 and the World Orienteering Championships in 1966 fastened the development. Ten countries (Sweden, Finland, Norway, Denmark, Switzerland, West Germany, East Germany, Bulgaria, Hungary, Czechoslovakia) formed the International Orienteering Federation in 1961, and the participation in international events and official championships increased continuously. The first non-European members of the IOF were Canada and Japan in 1969. In 1973, when other important non-European orienteering countries (USA, Australia, Israel) joined the IOF, the
Proceedings, 7th International Conference on Cartography and GIS, 18-23 June 2018, Sozopol, Bulgaria ISSN: 1314-0604, Eds: Bandrova T., Konečný M.
586
standardization of maps became a very important issue. Shortly after the foundation of the IOF, an international expert group started to work on the international map specification (ISOM = International Specification of Orienteering Maps).
The standardisation
The organisation of official regional and world championships also had a very important role: to understand the importance of fairness in orienteering and developing an international mapping standard/specification had a special role in this process. Orienteering maps are a kind of sport goods, so standardisation of these cartographic products was the vital step for the development of the sport.
The time of map standardisation coincided with the time of the increasing need of better and more up-to-date maps. The cycle of the updating of state topographic maps (which were used for orienteering events in the first half of the 20th century) was simply two slow for the orienteers and the focus of state topographic maps was slightly different: there was no interest in adding more details in forest areas. In the Scandinavian countries, more and more professional cartographers started to practice the orienteering sport and they were also ready to educate orienteers who were interested in the map production process. The Scandinavian state topographic maps were not classified, so they were not only easily accessible for civil use, but these maps were also known by civil users.
The field working techniques was the easier part of the production of orienteering maps. State topographic maps were used as base maps and orienteers added runnability/crossability-related information (which areas [marsh, dense vegetation, stone field], linear features [fence, cliff, highway]) enriched these maps with new content that was relevant for the sport (runnability information, smaller point and linear features which are irrelevant for the user of the topographic maps, like pits, knolls, boulders, ponds, cairn, small paths, narrow rides, gullies) and they also updated the map content (new roads and paths, vegetation changes).
Although we had suitable methods to make precise maps for orienteering, there was another crucial problem to be solved. Colours are essential parts of topographic maps, but the colour printing methods were expensive. Even the state topographic maps started to be printed in colour only from the beginning of the 20th century, when colour offset printed methods were invented (Zentai, 2014).
The first step of standardization was the unification of scales and contour intervals. At the first European Orienteering Championship, 1:25,000 scale maps were used with 10-metre contour interval. As mentioned, the first colour and field-worked orienteering map was published in Norway in 1950. In 1962, 79 orienteering maps were published in Norway, and the situation was similar in Finland and Sweden (at that time still most of the smaller events used topographic maps for orienteering events). However, the most developed orienteering country of Central Europe (Switzerland) was a little bit behind the Scandinavians at that time. This is why it was evident to use the map-making experiences of the Scandinavians at the first international discussion about orienteering maps.
The maps of the first European Championship were at a very high level: the 10-meter equidistance was a surprise for foreign participants. In 1964, the association of Nordic countries had formed a map committee, which asked the IOF to discuss the maps of international events and to form the Map Committee of the IOF. The first principles accepted internationally were as follows:
• The maps have to be so accurate and detailed that they give the possibility for the course planner to create a fair event and let each competitor easily identify his/her position during the course. Avoiding the luck factor and not giving advantages to local competitors, whose awareness of the area was an extremely important issue concerning the fairness of the sport.
• The main disadvantage of using outdated topographic maps without special orienteering fieldwork is the luck factor. If a competitor has found a path not shown on the map and was able to use it during the event, he/she can reach the control point faster than the unlucky rivals who omitted that path.
Under these circumstances the call soon came for standardized competition maps paying due regard to the particular requirements of orienteering. In the first national attempts in the sixties, corrections and runnability information were added to the basic topographic maps. At the IOF level in the mid-sixties, an expert group prepared proposals for representing the terrain on orienteering maps, which were summarised and presented in a “first draft” in 1967.
This era was the beginning of the introduction of special orienteering maps in Central Europe. In some countries the first colour maps were just extracts of topographic maps, but using the Scandinavian connections and experiences the first colour orienteering maps were published:
• 1961: Czechoslovakia (Czech Rep.)
Proceedings, 7th International Conference on Cartography and GIS, 18-23 June 2018, Sozopol, Bulgaria ISSN: 1314-0604, Eds: Bandrova T., Konečný M.
587
• 1964: Hungary
• 1965: Switzerland
• 1966: Czechoslovakia (Slovakia)
• 1967: Austria, West-Germany
In 1965, the Map Committee of the IOF was formed (the first meeting was in 1967, Zurich). All five members were cartographers: Jan Martin Larsen (Norway), Osmo Niemelä (Finland), Christer Palm (Sweden), Torkil Laursen (Denmark), Ernst Spiess (Switzerland).
The most important and urgent work of the committee was the specification of World Championship maps. They suggested following these principles:
• The orienteering maps have to be new (recent fieldwork).
• The map has to show every detail of the terrain which can affect the route choice of the competitor accurately.
• The most important is the legibility: small and unimportant details have to be omitted.
• The maps of international events have to use the same specification.
• The suggested scale is 1:25,000 or 1:20,000, the equidistance is 5 m (depending on the terrain 10 m or 2.5 m is also allowed).
The first issue of the ISOM was ratified by the IOF-Congress in Doksy, Czechoslovakia in 1969. This issue was still not a “specification” but rather a “guideline”, although it already contained quite concrete requirements. The most important specifications were the scales and the definition of colour use on the orienteering maps (Zentai, 2001):
• black (man-made features, rocks and cliffs), brown (relief)) and blue (water features) for topography,
• yellow for open ground, and
• grey or green / black for restricted runnability (vegetation).
One of the most exciting discussion topic of these early years was the colour of the forest sign. This area symbol was traditionally green on topographic maps in every country. It was a Norwegian suggestion (1965) to use white colour (the paper colour itself) for the forest (good runnability). These maps were called negative maps and this suggestion was accepted internationally in some years. Although the Scandinavian countries denied presenting runnability on their own maps (partly because most of the Scandinavian forests are runnable), they showed the runnability on the maps of their major IOF events held in their country (Spiess, 1972).
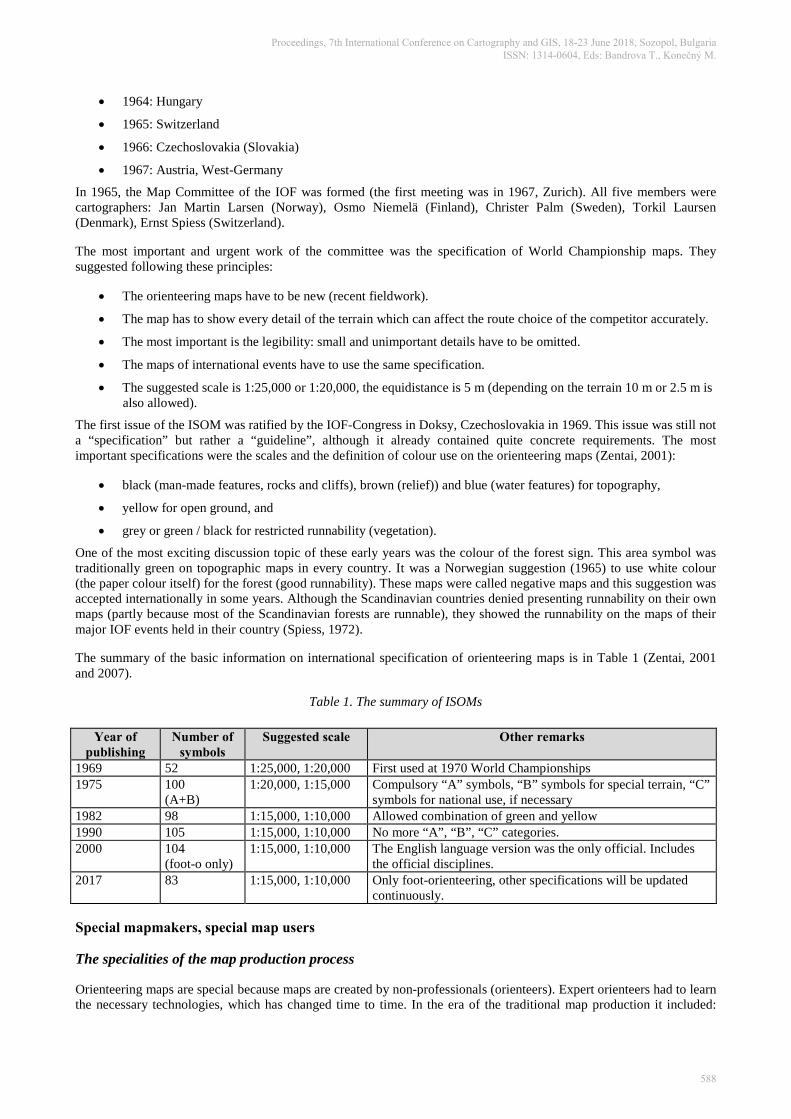
The summary of the basic information on international specification of orienteering maps is in Table 1 (Zentai, 2001 and 2007).
Table 1. The summary of ISOMs
Year of publishing
Number of symbols
Suggested scale Other remarks
1969 52 1:25,000, 1:20,000 First used at 1970 World Championships 1975 100
(A+B) 1:20,000, 1:15,000 Compulsory “A” symbols, “B” symbols for special terrain, “C”
symbols for national use, if necessary 1982 98 1:15,000, 1:10,000 Allowed combination of green and yellow 1990 105 1:15,000, 1:10,000 No more “A”, “B”, “C” categories. 2000 104
(foot-o only) 1:15,000, 1:10,000 The English language version was the only official. Includes
the official disciplines. 2017 83 1:15,000, 1:10,000 Only foot-orienteering, other specifications will be updated
continuously.
Special mapmakers, special map users
The specialities of the map production process
Orienteering maps are special because maps are created by non-professionals (orienteers). Expert orienteers had to learn the necessary technologies, which has changed time to time. In the era of the traditional map production it included:
Proceedings, 7th International Conference on Cartography and GIS, 18-23 June 2018, Sozopol, Bulgaria ISSN: 1314-0604, Eds: Bandrova T., Konečný M.
588
stereophotogrammetry, all kinds of fieldwork technologies (traditional geodetic technologies were not suitable for orienteering, because they were too slow and complicated due to the larger precision of professional surveying, which was not necessary at the scale of orienteering maps), hand drawing by ink-pens, understanding the technical phases of the offset printing process. In the beginning of the digital era, the first digital map producers of orienteering maps were computer or GIS experts. Different parts of the traditional map production process were replaced by digital methods. It is not easy to say which was the very first orienteering map that was produced digitally: first we have to define what “produced digitally” means. I am not talking about the field-working phase, although GPS and laser scanning technologies were invented at the time when personal computers started to spread in all parts of the life (not only used by scientists, experts). These technologies are much more developed today and automatic production of orienteering maps from different – mostly remote sensing – data is a reality. However, producing high quality orienteering maps still requires a lot of human work (fieldwork) on the terrain to interpret and represent the reality at the scale of orienteering maps as well as the cartographic knowledge and tradition of generalisation. Many countries where new data sources appeared (laser scanning is the most characteristic) faced a problem of overdetailed maps, because they did not really understand the importance of generalisation, the filtering of information. Without the help of professional cartographers orienteers do not really tend to remove the information they have collected from different sources, thinking that more information will make the terrain navigation easier. It is probably true, but in such cases easier also means slower. These orienteers disregard the special method of map use: orienteers are reading the map while they are running and they do not want to stop in order to read the map (Petrovič, 2014).
The first phase of the orienteering map production which was replaced by digital technologies was the map drawing. Although the graphic capabilities of the personal computers was quite limited (remember the resolution of the first computer monitors: 320*200 pixels or the 640*480 pixel VGA resolution), very expensive professional systems (like graphic workstations) were able to provide the necessary graphic capabilities even at that time. The very first digital orienteering map was probably created in Finland using the contemporary GIS system (FinGIS) of the national mapping agency. However, drawing the orienteering map by computer does not solve the problem, rather generates a new one: how to replace the traditional technological process of map production with a digital method. At the beginning of the personal computer era, only professional, very complicated and very expensive GIS or cartographic systems were able to manage this process (it probably happened so in Finland and maybe in Sweden and Norway). Few years later, when desktop publishing (DTP) software and hardware started to be affordable, non-cartographer orienteers were ready to buy personal computers and educate themselves to understand the new technology. The output was still the traditional offset printing, because the colour printing technology was simply not developed enough at that time (the first PC-based DTP software and hardware was released in 1984, but quality and relatively cheap colour printers were available only about ten years later). This was also the time when the first orienteering map drawing software, the Swiss OCAD was released in 1989. OCAD is still the most popular software for drawing orienteering maps, although nowadays open source alternative was also developed (Zentai, 2014).
Although the development of the colour digital printing technology is not a focus of this paper, I mention that thanks to the continuous development of these digital printing technologies fewer and fewer orienteering maps are produced nowadays by offset printing. The key issue is whether the quality of digitally printed technology is good enough for orienteers.
Special users
When ordinary people use maps, they always try to use it in perfect circumstances: they are creating good light circumstances, standing or putting the map on a desk, sometimes even using a magnifying glass. Orienteers are taking into consideration even the colour of the paper (whiteness) and the most wide-spread form of colour blindness when the printing colours of orienteering maps are selected.
Orienteers are using maps in less perfect circumstances:
• they read orienteering maps when they are running (in other disciplines they are riding on a bike or skiing): taking this condition into consideration, we have adjusted the minimum sizes of map symbols and line widths in the map specifications;
• the light and weather conditions can be complicated; it can be rain, and there are also night orienteering events where headlamps are used by the competitors;
• the light conditions during the orienteering events can vary, because of the different vegetation: open and semi-open areas, dense vegetation (in pine forests the light conditions are regularly much worse than in deciduous forests);
Proceedings, 7th International Conference on Cartography and GIS, 18-23 June 2018, Sozopol, Bulgaria ISSN: 1314-0604, Eds: Bandrova T., Konečný M.
589
• orienteering is not only elite sports, it is one of the most popular master sports after athletics and swimming; the large portion of master age orienteers is an important factor of financing the sport: we have to take the orienteers’ reduced visual capabilities into consideration even in the map specifications (in this year, the oldest participant in the World Masters Orienteering Championships will be older than 100 years);
• orienteering is also practised by the young generation: for the youngest (children) a different (simplified) map specification may help understanding the map reading process.
ISOM 2017, THE NEW SPECIFICATION
If we look at Table 1, we can recognise that time between the releasing years of orienteering maps specifications has increased. As a member of the IOF Map Committee since 1996, I was responsible for the ISOM 2000 project. We were working on that for four years, and when we started the project we did not have too much experience on the digital production of orienteering maps. Although ISOM 2000 was the first orienteering map specification where the digital drawing and printing technologies were taken into consideration, we were mostly concentrating on the printing phase and did not re-design the symbols themselves (there were only slight adjustments).
Soon after the release of ISOM 2000, a new form of foot orienteering, a sprint format was introduced (first time in 2001 in the World Orienteering Championships). Sprint was an even faster format of orienteering, regularly organised in urban or park environment. The course length is much shorter (max. 3-4 kilometres), the running time is about 15 minutes. The urban or park environment is quite different from the forests, so the IOF Map Committee developed a separate map specification for sprint orienteering (ISSOM = International Specification of Sprint Orienteering Maps), which was based on ISOM, but there were some principal changes:
• there are linear and areal symbols in ISSOM, where uncrossability also means forbidden to cross (it was necessary to introduce this principle in urban environment),
• we also had to deal with the traffic problem (which is normally not an issue in forest areas), and the only solution was to prohibit the traffic during the event (this is not a mapping, rather an organisational issue),
• multi-level structures should be avoided for sprint orienteering as it is impossible to represent these areas on a single sheet of paper (it is again not a mapping issue, but an important principle).
ISOM 201X, the time frame
When the ISOM 201X project was started in 2008, there was no date of completion defined. The IOF charged the Map Committee with modernising/updating ISOM 2000, taking into consideration the ISSOM experiences and the development of digital printing technologies. Although there were no urgent issues, the development of the sport and the IT technologies required regular revision of the map specification.
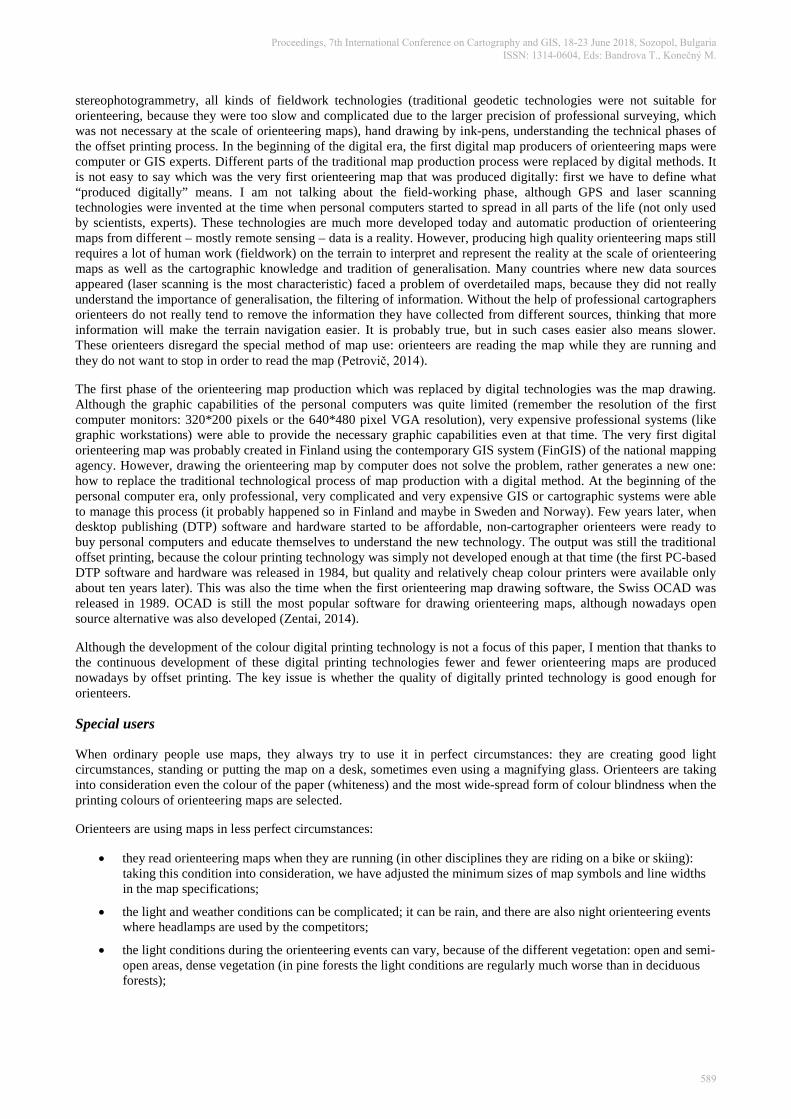
The recent update of ISOM originally would include both specifications (ISOM and ISSOM), but finally (due to technical and man-power reasons) only the ISOM was the focus. The long process of update had different sections. At the end of the first section of the very long and detailed process a new draft document (200 pages) was created for internal use, but after that the strategy of the update has changed and the planned final product was reverted to a short booklet (similar to ISOM 2000). In the second part of the updating process the focus has changed to the harmonisation of ISOM and ISSOM, as part of the global trend of harmonising orienteering rules in general. Finally, the ISOM was released in 2017 (Figure 1, 2, 3).
The milestones of the ISOM 201X process:
• 2008: the first call to national federations: consultation
• 2009–12: creation of the first draft
• 2013: an expert group was established to take care of special issues (colour blindness, digital printing process), the second consultation round with the national federations
• 2014–15: creation of final draft
• 2016: the third consultation round
• 2017: release of the ISOM.
The summary of the most relevant changes:
Proceedings, 7th International Conference on Cartography and GIS, 18-23 June 2018, Sozopol, Bulgaria ISSN: 1314-0604, Eds: Bandrova T., Konečný M.
590
• Simplification: Map scale 1:10,000 is a strict enlargement of the 1:15,000 scale map (exceptions removed).
o Exceptions used to be:
magnetic north lines (spacing),
course overprint symbols.
• Clarification of minimum dimensions.
• Add precise graphical definitions for some symbols.
• Alignment with ISSOM (symbols, symbol dimensions, impassable/passable, area with forbidden access, railway).
• Tightening up several symbol definitions. Use the term “prominent” instead of the term “special”:
o Added new-shape point symbols (brown triangle, blue square, black asterisk)
reasons: requests, change of semantics of some symbols.
o Removed (blue x)
reason: no need for more than one prominent feature.
o Changed
reason: avoid problems for mixing colours (both shape and colour of point symbols are different).
o Clarification
Must / Shall / Required / May.
o Adjustment of runnability categories.
o Footprints:
Footprint sizes are added for each symbol, where it is relevant
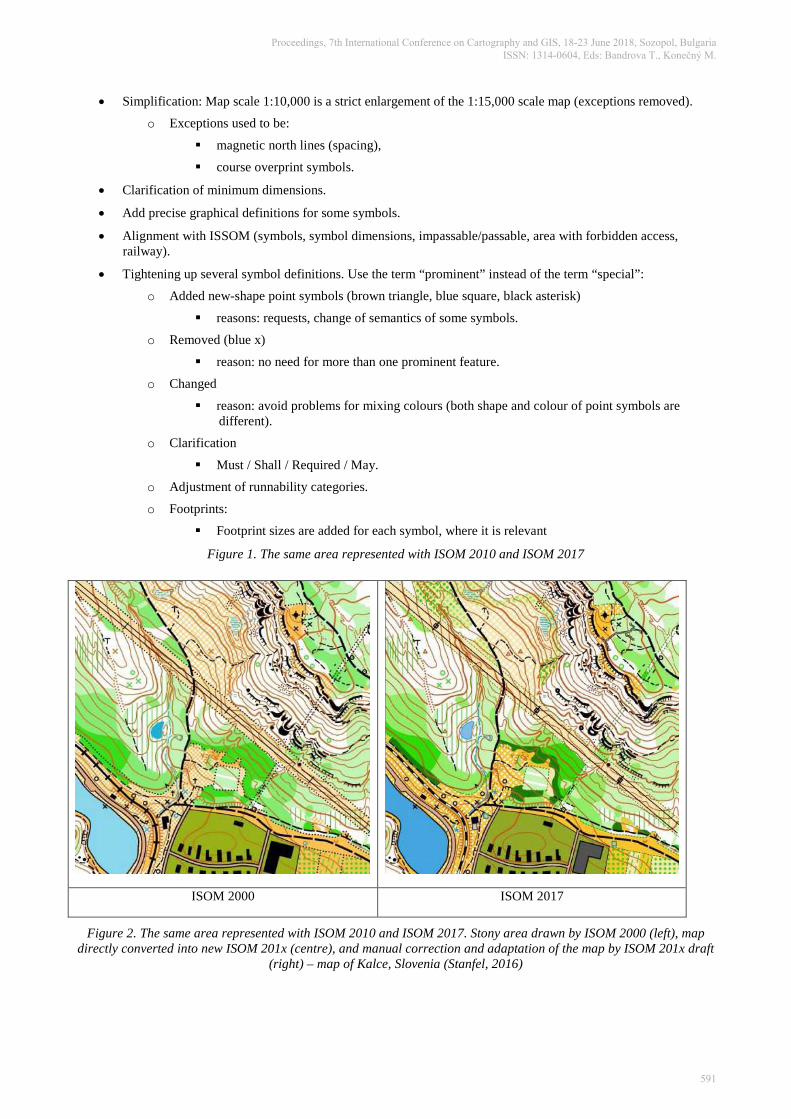
Figure 1. The same area represented with ISOM 2010 and ISOM 2017
ISOM 2000 ISOM 2017
Figure 2. The same area represented with ISOM 2010 and ISOM 2017. Stony area drawn by ISOM 2000 (left), map directly converted into new ISOM 201x (centre), and manual correction and adaptation of the map by ISOM 201x draft
(right) – map of Kalce, Slovenia (Stanfel, 2016)
Proceedings, 7th International Conference on Cartography and GIS, 18-23 June 2018, Sozopol, Bulgaria ISSN: 1314-0604, Eds: Bandrova T., Konečný M.
591
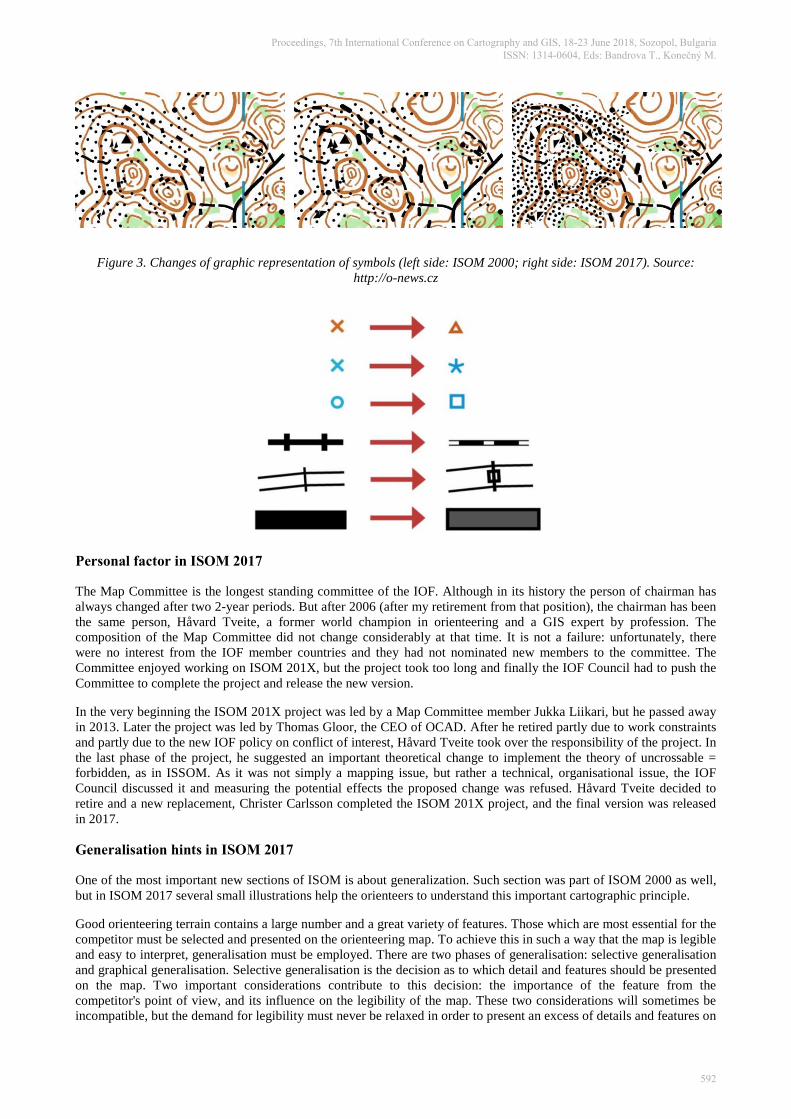
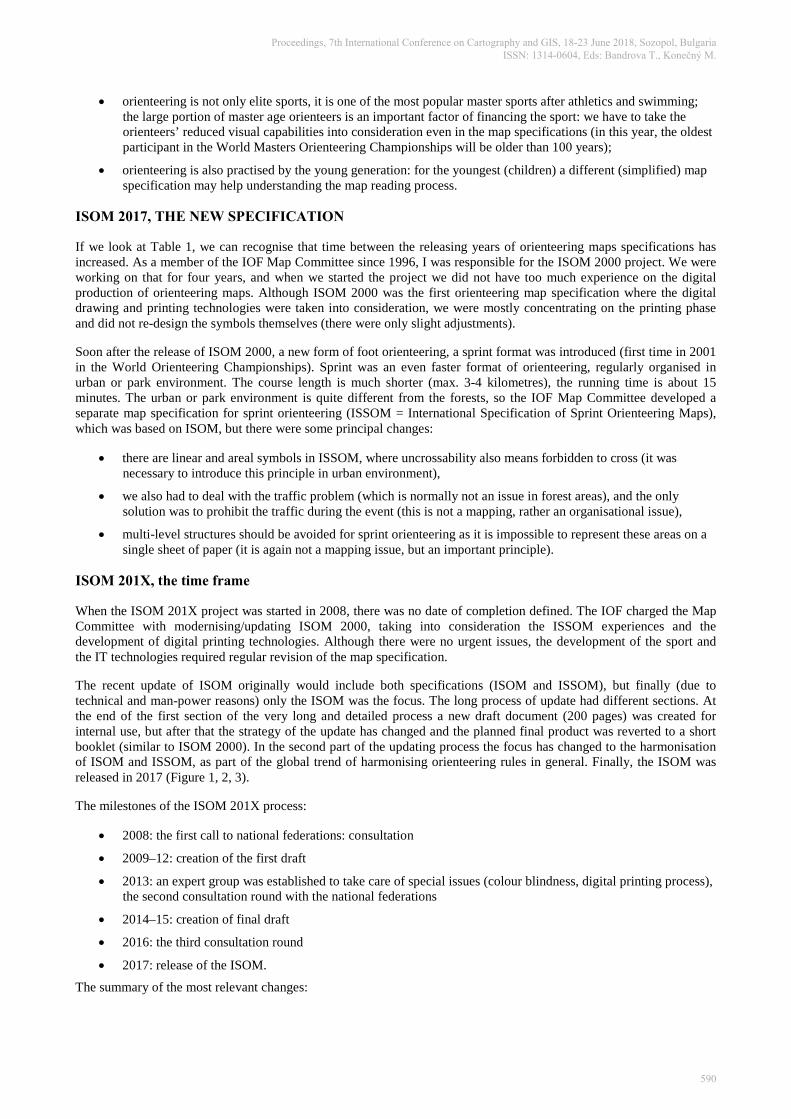
Figure 3. Changes of graphic representation of symbols (left side: ISOM 2000; right side: ISOM 2017). Source: http://o-news.cz
Personal factor in ISOM 2017
The Map Committee is the longest standing committee of the IOF. Although in its history the person of chairman has always changed after two 2-year periods. But after 2006 (after my retirement from that position), the chairman has been the same person, Håvard Tveite, a former world champion in orienteering and a GIS expert by profession. The composition of the Map Committee did not change considerably at that time. It is not a failure: unfortunately, there were no interest from the IOF member countries and they had not nominated new members to the committee. The Committee enjoyed working on ISOM 201X, but the project took too long and finally the IOF Council had to push the Committee to complete the project and release the new version.
In the very beginning the ISOM 201X project was led by a Map Committee member Jukka Liikari, but he passed away in 2013. Later the project was led by Thomas Gloor, the CEO of OCAD. After he retired partly due to work constraints and partly due to the new IOF policy on conflict of interest, Håvard Tveite took over the responsibility of the project. In the last phase of the project, he suggested an important theoretical change to implement the theory of uncrossable = forbidden, as in ISSOM. As it was not simply a mapping issue, but rather a technical, organisational issue, the IOF Council discussed it and measuring the potential effects the proposed change was refused. Håvard Tveite decided to retire and a new replacement, Christer Carlsson completed the ISOM 201X project, and the final version was released in 2017.
Generalisation hints in ISOM 2017
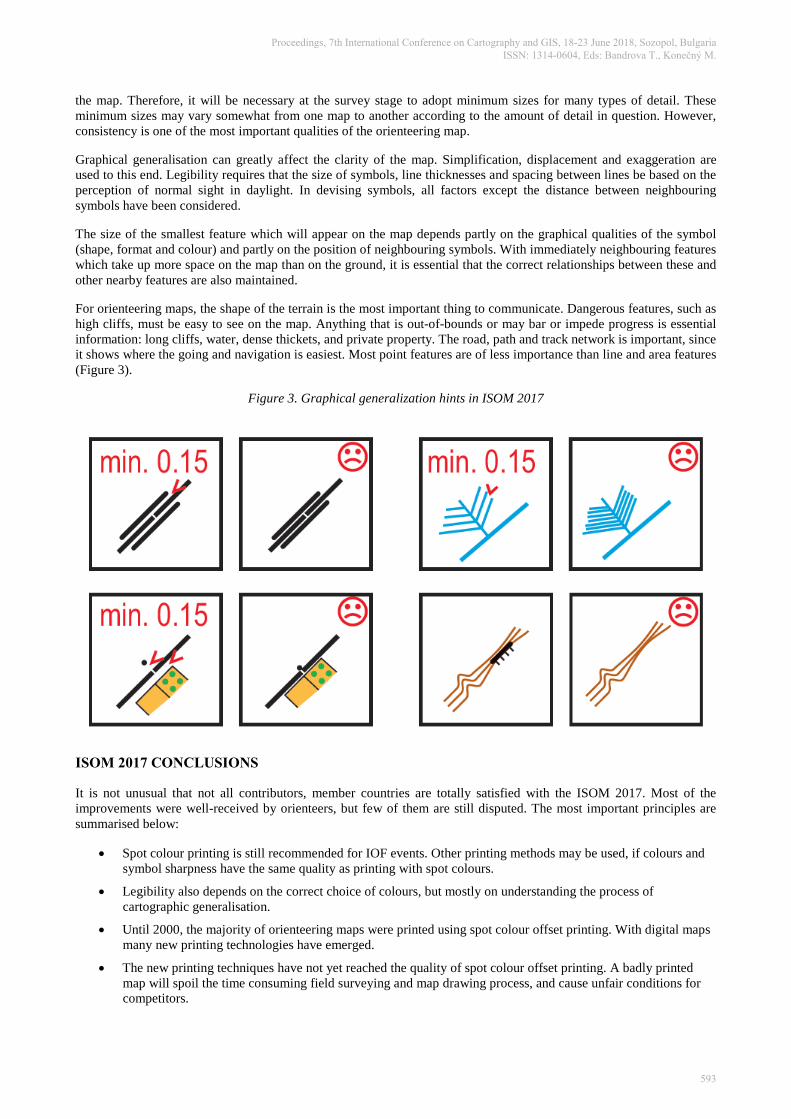
One of the most important new sections of ISOM is about generalization. Such section was part of ISOM 2000 as well, but in ISOM 2017 several small illustrations help the orienteers to understand this important cartographic principle.
Good orienteering terrain contains a large number and a great variety of features. Those which are most essential for the competitor must be selected and presented on the orienteering map. To achieve this in such a way that the map is legible and easy to interpret, generalisation must be employed. There are two phases of generalisation: selective generalisation and graphical generalisation. Selective generalisation is the decision as to which detail and features should be presented on the map. Two important considerations contribute to this decision: the importance of the feature from the competitor's point of view, and its influence on the legibility of the map. These two considerations will sometimes be incompatible, but the demand for legibility must never be relaxed in order to present an excess of details and features on
Proceedings, 7th International Conference on Cartography and GIS, 18-23 June 2018, Sozopol, Bulgaria ISSN: 1314-0604, Eds: Bandrova T., Konečný M.
592
the map. Therefore, it will be necessary at the survey stage to adopt minimum sizes for many types of detail. These minimum sizes may vary somewhat from one map to another according to the amount of detail in question. However, consistency is one of the most important qualities of the orienteering map.
Graphical generalisation can greatly affect the clarity of the map. Simplification, displacement and exaggeration are used to this end. Legibility requires that the size of symbols, line thicknesses and spacing between lines be based on the perception of normal sight in daylight. In devising symbols, all factors except the distance between neighbouring symbols have been considered.
The size of the smallest feature which will appear on the map depends partly on the graphical qualities of the symbol (shape, format and colour) and partly on the position of neighbouring symbols. With immediately neighbouring features which take up more space on the map than on the ground, it is essential that the correct relationships between these and other nearby features are also maintained.
For orienteering maps, the shape of the terrain is the most important thing to communicate. Dangerous features, such as high cliffs, must be easy to see on the map. Anything that is out-of-bounds or may bar or impede progress is essential information: long cliffs, water, dense thickets, and private property. The road, path and track network is important, since it shows where the going and navigation is easiest. Most point features are of less importance than line and area features (Figure 3).
Figure 3. Graphical generalization hints in ISOM 2017
ISOM 2017 CONCLUSIONS
It is not unusual that not all contributors, member countries are totally satisfied with the ISOM 2017. Most of the improvements were well-received by orienteers, but few of them are still disputed. The most important principles are summarised below:
• Spot colour printing is still recommended for IOF events. Other printing methods may be used, if colours and symbol sharpness have the same quality as printing with spot colours.
• Legibility also depends on the correct choice of colours, but mostly on understanding the process of cartographic generalisation.
• Until 2000, the majority of orienteering maps were printed using spot colour offset printing. With digital maps many new printing technologies have emerged.
• The new printing techniques have not yet reached the quality of spot colour offset printing. A badly printed map will spoil the time consuming field surveying and map drawing process, and cause unfair conditions for competitors.
Proceedings, 7th International Conference on Cartography and GIS, 18-23 June 2018, Sozopol, Bulgaria ISSN: 1314-0604, Eds: Bandrova T., Konečný M.
593

• For major IOF events, only spot colour offset printing will be allowed until the IOF decides that the quality of alternative printing methods have reached a sufficient level.
• The number of symbols is much fewer than in the previous ISOM, but this change is mostly due to theoretical issues.
REFERENCES
Petrovič D. (2014): Reducing Field Work with Automation in Orienteering Map Production. Scientific Journal of Orienteering, Vol. 19 issue 1, pp. 3–12.
Spiess E (1972) International genormte topographische Karten für den Orientierungslauf, International Yearbook of Cartography, 124-129.
Stanfel M (2016) Comparison of the Current and New International Specifications for Orienteering Maps, In (editors: Buchroithner M, Schröter B, Heidig U) Unbounded Mapping of Mountains, Proceedings of the 10th ICA Mountain Cartography Workshop, Bertechsgaden, 237–247
Zentai L (2001) Development of orienteering maps' standardization, In: Li Li (ed.) Proceedings of the 20th International Cartographic Conference - Mapping the 21st Century. International Cartographic Association, pp. 2753-2759. Vol. 4.. (ISBN 7-5030-1018-5)
Zentai L (2007) History of orienteering maps, 12th International Conference on Orienteering Maps, Kiev, Ukraine
Zentai L (2014) Implementation of Cartographic and Digital Techniques in Orienteering Maps, In: Buchroithner M, Prechtel N, Burghhardt D (eds.) Cartography from Pole to Pole: Selected Contributions to the XXVIth International Conference of the ICA, Dresden: Springer Verlag, 2014. pp. 19-29. (ISBN 978-3-642-32617-2)
BIOGRAPHY
László ZENTAI, 1959, Department of Cartography and Geoinformatics, ELTE Eötvös Loránd University, Budapest. Academic experience: Master in Cartography (1984), Doctor univ. (1992), PhD degree (Hungarian Academy of Sciences, 1995), Doctor of Science, (Hungarian Academy of Sciences, 2006). Practical experience: Computer cartography, digital atlases, topographic maps, relief representation, orienteering maps, education and training in cartography, orienteering maps. Publications: Over 170 scientific papers, more than 100 maps and atlases. More than 150 orienteering maps were fieldworked and drawn. Recent positions: Secretary-General of the International Cartographic Association (2011–), Vice-Rector of ELTE Eötvös Loránd University (2007–2010; 2017–), Council member of the International Orienteering Federation (2006–), former member (1996–2002) and chair (2002–2006) of the Map Commission, Head of the Department of Cartography and Geoinformatics (2005–).
Proceedings, 7th International Conference on Cartography and GIS, 18-23 June 2018, Sozopol, Bulgaria ISSN: 1314-0604, Eds: Bandrova T., Konečný M.
594