Embed Size (px)
Citation preview
Faculty of Natural Resources and
Agricultural Sciences
Isolation of antibiotic producing
microorganisms by screening for
antibiotic resistance
Emma Nordenfjäll
Department of Microbiology
Independent project • 15 hec • First cycle, G2E
Biology with specialisation in Biotechnology - Bachelor's Programme •
Examensarbete/Sveriges lantbruksuniversitet,
Institutionen för mikrobiologi, 2014:7 • ISSN 1101-8151
Uppsala 2014

Isolation of antibiotic producing microorganisms by screening for
antibiotic resistance
Emma Nordenfjäll
Supervisor: Joakim Bjerketorp, Swedish University of Agricultural Sciences,
Department of Microbiology
Assistant Supervisor: Jolanta Levenfors, Swedish University of Agricultural Sciences,
Department of Microbiology
Examiner: Bengt Guss, Swedish University of Agricultural Sciences,
Department of Microbiology
Credits: 15 hec
Level: First cycle, G2E
Course title: Independent project in Biology - bachelor project
Course code: EX0689
Programme/education: Biology with specialisation in Biotechnology - Bachelor's Programme
Place of publication: Uppsala
Year of publication: 2014
Title of series: Examensarbete/Sveriges lantbruksuniversitet, Institutionen för mikrobiologi
No: 2014:7
ISSN: 1101-8151
Online publication: http://stud.epsilon.slu.se
Keywords: Antibiotics, secondary metabolites, antibiotic resistance, isolation methods, rare-
actinomycetes, unexplored ecological niches, diterpene synthases, non-ribosomal peptide
synthases, type I polyketide synthases, type II polyketide synthases
Sveriges lantbruksuniversitet
Swedish University of Agricultural Sciences
Faculty of Natural Resources and Agricultural Sciences
Uppsala BioCenter
Department of Microbiology

Abstract
The worldwide use of antibiotics has rapidly increased since the discovery of the secondary
metabolite penicillin made by Alexander Fleming in 1928. Since then, thousands of useful
secondary metabolites of microbial origin have been discovered. About 80 % of these
substances originate from Actinomycetes and in particularly Streptomyces species. Lately, the
search have been focused upon finding rare-actinomycetes where the chance of discover a
novel secondary metabolite is larger. The use of antibiotics the past decades has led to a rapid
evolution in microorganisms where naturally occurring resistance genes to antibiotics are
spreading fast, hence the need for new antibiotics increases. New isolation and screening
methods applied on samples from under-explored ecological niches like marine environments
and plant endophytes are examined to increase the change of finding new useful antimicrobial
metabolites. In the current work, samples were collected from a broad range of ecological
niches; five marine samples from the west coast of Sweden, two plant samples and one
sample from lichen from the middle of Sweden and one sample of bat guano from the
Philippines. The samples were plated onto three different media containing one of five
different antibiotics in two concentrations. Two hundred and thirty-five bacterial isolates were
collected and 64 isolates were identified by sequencing their 16S rDNA. Using 58 of these
isolates, a phylogenetic tree were constructed on the genus and species level. A PCR-
screening covering four genes in different enzymatic pathways for secondary metabolite
production were done on all samples to evaluate the theoretical ability to produce the most
important types of secondary metabolites. Finally to determine production of antibacterial
activity a zone-inhibition assay against one species of Staphylococcus and one species of
Pseudomonas were performed on 14 isolates.

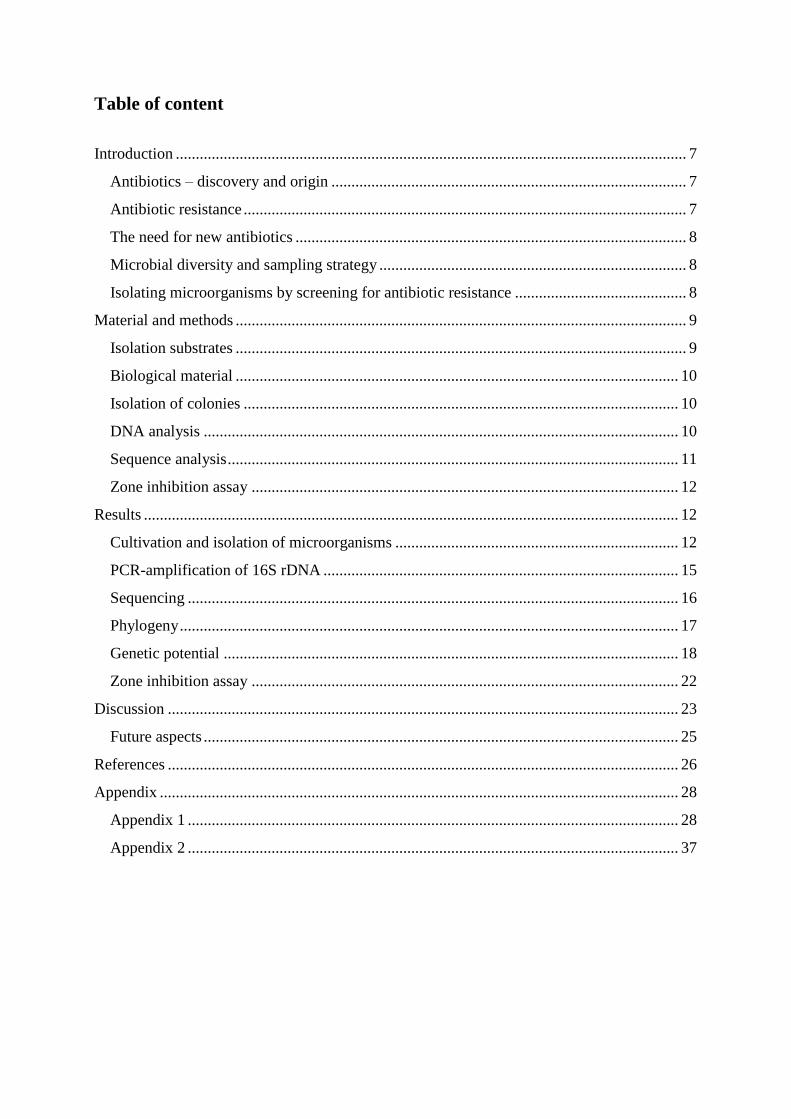
Table of content
Introduction ................................................................................................................................ 7
Antibiotics – discovery and origin ......................................................................................... 7
Antibiotic resistance ............................................................................................................... 7
The need for new antibiotics .................................................................................................. 8
Microbial diversity and sampling strategy ............................................................................. 8
Isolating microorganisms by screening for antibiotic resistance ........................................... 8
Material and methods ................................................................................................................. 9
Isolation substrates ................................................................................................................. 9
Biological material ............................................................................................................... 10
Isolation of colonies ............................................................................................................. 10
DNA analysis ....................................................................................................................... 10
Sequence analysis ................................................................................................................. 11
Zone inhibition assay ........................................................................................................... 12
Results ...................................................................................................................................... 12
Cultivation and isolation of microorganisms ....................................................................... 12
PCR-amplification of 16S rDNA ......................................................................................... 15
Sequencing ........................................................................................................................... 16
Phylogeny ............................................................................................................................. 17
Genetic potential .................................................................................................................. 18
Zone inhibition assay ........................................................................................................... 22
Discussion ................................................................................................................................ 23
Future aspects ....................................................................................................................... 25
References ................................................................................................................................ 26
Appendix .................................................................................................................................. 28
Appendix 1 ........................................................................................................................... 28
Appendix 2 ........................................................................................................................... 37

7
Introduction
Antibiotics – discovery and origin
One of history’s most fortunate discoveries occurred by chance in London in 1928. Professor
Alexander Fleming inoculated a strain of staphylococci on an agar plate and left it on his
workbench. After a longer period of time the plate caught his attention – a mold colony had
contaminated it but around the mold colony no bacterial growth could be observed (Fleming,
1929; Sköld, 2006). The substance suppressing bacterial growth was named penicillin and
about ten years later its full potential as a drug had been disclosed. The discovery and further
development of penicillin provided a cure for many of the so far deadly diseases caused by
bacteria. Spurred by the success of penicillin, an extensive search among other
microorganisms started for similarly useful compounds (Sköld, 2006). During the following
20 years the most important groups of antibiotics were discovered and these includes e.g.
macrolides and tetracycline (Bérdy, 2005). About 70 to 80 % of all antibiotics discovered
during this time originate from actinomycetes and especially from various Streptomyces
species. Actinomycetes are a group of gram-positive bacteria most commonly isolated from
soil but also from other environmental niches such as in marine sediments. When compared to
other microorganisms they generally carry a large number of genes encoding for many
different enzymes involved in the production of secondary metabolites that could be of
interest for discovering novel antibiotics (Baltz, 2008; Tiwari & Gupta, 2013). Various
environmental samples have been studied extensively over the last 50 years, mostly resulting
in the re-discovery of many already known compounds. However, as only a tiny fraction of
the available samples have, so far, been collected many actinomycetes taxon’s could still be
undiscovered (Baltz, 2008).
Antibiotic resistance
Effective antibiotics are essential in order to maintain the high standard of healthcare that
nowadays is taken for granted by enabling medical control of bacterial infections. The success
of antibiotics has led to their massive consumption and distribution in healthcare for humans
and animals but also to abundant use in agriculture and in animal breeding. This
overconsumption of antibiotics has led to an enormous selective pressure on the bacteria,
which have been forced to adapt to the antibiotics and hence gain resistance or die. The
adaption is very rapid and resistance usually occurs one to two years after a new antibiotic is
introduced (Sköld, 2006). An additional problem is the occurrence of multi-resistant bacteria,
which are resistant against many different antibiotics. A study by Costa et al. 2006 shows that
8
out of 480 different bacterial strains found in soil, two was multi-drug resistant to 15 of 21
drugs tested and every strain in the study was in average multi-drug resistant to seven or eight
different antibiotics.
The need for new antibiotics
As the antibiotic resistance is spreading, the need for new antibiotics is increasing. One of the
possible ways to increase the chance of finding novel antibiotics is to find new approaches for
isolating interesting bacteria and fungi or at least make the existing methods more efficient.
One of the more promising techniques is to use the resistance and enhance the self-protection
mechanism antibiotic producers need to have, in order to avoid suicide. A study by Thaker et
al. (2013) showed that using resistance as a trait for selection increases the hit rate of
interesting isolates with at least four orders of magnitude as compared to classical screening.
The second approach is to search for new sampling sites and to focus on isolation of rare
actinomycetes rather than the most common Streptomyces species that have been found in soil
samples worldwide. Rare actinomycetes are harder to isolate and culture but the possibility
that an yet undiscovered secondary metabolite is produced is higher since these species are
not so well studied as others actinomycetes (Tiwari & Gupta, 2013).
Microbial diversity and sampling strategy
Studies have shown that unknown species and genetically different strains of actinomycetes
are still abundantly present in nature. Paradoxically some of the last places to be explored by
mankind for its microbiological diversity are the oceans, which cover more than 70 % of the
earth’s surface. Studies with promising results have now been made where rare actinomycetes
have been isolated from marine environments from e.g. shallow water sediments of the
Trondheim fjord (Bull et al., 2000; Bredholt et al., 2007). Some ecosystems are more under-
explored than others and therefore more interesting as for example microbial plant
endophytes, microbial insect symbionts, lichens and most marine environments. These
biological niches will most likely contain unknown actinomycetes communities that hopefully
may be connected to novel secondary metabolites (Genilloud et al., 2011).
Isolating microorganisms by screening for antibiotic resistance
In this study microorganisms, including actinomycetes, were isolated from five marine
samples from the west coast of Sweden, two plant samples from Sweden and one sample from
the feces of bats from a cave in the Philippines. The different samples harbor a broad range of
different bacterial species and the possibility to isolate rare actinomycetes from interesting
ecological niches might, therefore be higher. Also the samples origin varied from three
9
gastrointestinal samples of different fish species, one from mussels, one from macroalgea, one
from bat guano, one from lichens to samples of both leaves and roots of the traditional
medicine plant Celandine.
Portions of the samples were incubated on three different growth media with different nutrient
composition as well as five different antibiotics. Based on their morphology, colonies were
isolated and identified using sequence analysis. Subsequently a genome-wide PCR-based
screening was performed to investigate the potential of the isolated microorganisms to create
secondary metabolites. Some of the isolates were also tested for their ability to inhibit the
growth of the two non-pathogenic species of bacteria, Staphylococcus warneri and
Pseudomonas resinovorans, which are closely related to the bacterial pathogens
Staphylococcus aureus and Pseudomonas aeruginosa.
Material and methods
Isolation substrates
Three growth media with different nutrient composition were used in the experiment (Table
1). Five different antibiotics, Spectinomycin (Duchefa, The Netherlands), Rifampicin
(Sigma), Erythromycin (Sigma), Lincomycin (Sigma) and Streptomycin (Sigma) were
supplemented to the media rendering six different plates of each media type including a
control without antibiotics. In isolation experiment A, the concentration of antibiotics in the
media was adjusted to be 25 µg/ml. In isolation experiment B, the antibiotic concentration
was 50 µg/ml except for Rifampicin where the concentration was 12.5 µg/ml.
Table 1. Media composition of the media used in the experiments.
Media Composition
IM7 Chitin 2g (Alfa Aesar), K2HPO 0.5g (Merck) , FESO4 · 7 H20 1mg (Sigma) ,
Agar 18 g (Difco), Sea Salt 23 g (Foodgrade), H20 1L
NBC Nutrient broth 1g (Difco), Casamino acids 1g (Dicfo), Agar 14g (Difco), H2O 1L
NBC-
SW
Nutrient broth 1g (Difco) , Casamino acids 1g (Difco), Agar 14g (Difco), Sea
Salt 33g (food grade quality), H2O 1L
10
Biological material
Eight samples of different natural origin were collected and treated differently depending on
its origin and composition (Table 2). All samples except for the Celandine had been frozen in
-80 °C prior the experiments.
Table 2. Sample denotation, content and origin.
Sample Content Origin
B Cuckoo wrasse, Labrus mixtus The Swedish West coast
T cod, Gadus morhua The Swedish West coast
M Mackerel, Scomber scombrus The Swedish West coast
E Blue mussels, Mytilus edulis Mollösund, Skagerak, Sweden
P Mackroalgea Torekov, Skälderviken, Sweden
G Bat guano The Philippines
SB Leaves from Celandine, Chelidonium majus L. Uppland, Sweden
SR Roots from Celandine, Chelidonium majus L. Uppland, Sweden
L Lichen Uppland, Sweden
Isolation of colonies
Microbial colonies were chosen from the plates for further purification and preservation based
on colony morphology (shape, size and color) and preferably from plates with relatively large
difference in the number of colonies between the control plates and the antibiotic plates. The
selected colonies were re-streaked onto the same type of plates and further incubated for
about 10 days at 20 °C. For preservation and DNA purification, liquid cultures were started
from pure bacterial isolates by inoculating a loop of bacteria in 1 ml of half strength VPB
medium (15 g Vegetable Peptone broth, (Oxoid), 1000 ml deionized H2O) followed by
incubation for 2 days at 25 °C on a rotary shaker (135 rpm). Aliquots from the liquid cultures
were frozen in 15 % glycerol for storage at -80 °C and a part of the remaining material was
used for DNA purification.
DNA analysis
DNA was extracted using the FastDNA™ SPIN Kit for Soil (MP Biomedicals) following the
manufacturer’s description, except for the speed setting for the Fast DNA instrument that was
were set on 6.0 for 2 40 seconds.
11
PCR amplification of the 16S rDNA was performed using the primers 27F (5'-AGAGTT
TGATCMTGGCTCAG-3') to 1492R (5'-CGGTTACCTTGTTACGACTT-3'). Each PCR reaction
of 25 µl in total included 12.5 µl DreamTaq DNA polymerase mix (ThermoFisher Scientific),
6.5µl dH2O, the final concentration 0.4 µM of each primer and 4 µl DNA template. The
cycling conditions for the amplification of the 16s rDNA region were as follow: 5 min at 95
°C, 25 cycles at 94 °C for 40 s, at 55 °C for 30 s and 1 min at 72 °C, then followed by a final
elongation step for 7 min at 72 °C. When needed, an additional round of PCR for the 16S
rDNA were performed using the primers 27F to 765R (5’-CTGTTTGCTCCCCACGCTTTC-3’)
and 704F (5′-GTAGCGGTGAAATGCGTAGA-3’) to 1492R using the same cycling conditions.
The amplified PCR-products were purified using the Qiagen PCR-purification kit. The
purified PCR-products were mixed with either the primer 27F or 1492R and sent to Macrogen
for Sanger sequencing.
For the amplification of the four genes that indicate the genetic potential of each isolate to
produce the secondary metabolites: diterpene synthases (DTSs), type 1 polyketide synthases
(PKS-I), type II polyketide synthases (PKS-II) and nonribosomal peptide synthetases
(NRPSs), a PCR analysis was run using the primers previously described by Ayuso-Sacido &
Genilloud, (2005) (PKS-I and NRPSs) and by Xie et al., (2014) (DTSs and PKS-II). The
cycling conditions for amplification of the four genes were as above with the exception that
30 cycles were run and the elongation time was set up to 1 min and 20 seconds. All PCR-
products were analyzed on a 1 % agarose gel with a GeneRuler™ 1kb Plus DNA ladder
(Thermo Scientific) at 70 V for about 30 minutes.
Sequence analysis
Sequences obtained from Macrogen were analyzed using software MEGA version 6 (Tamura
et al., 2013). The obtained sequences were sequenced by a forward and a reverse primer and
therefore an overlapping central part could be found. The two sequences were aligned the
software MUSCLE (Edgar, 2004). Low quality regions were excluded and the trimmed
sequences were then uploaded to the RDP database (Maidak et al., 2006) and the SILVA
database (Quast et al., 2013). The 10 nearest sequences were then selected and aligned before
being downloaded to the software MEGA in order to construct a phylogenetic tree. The tree
was constructed using the method Maximum Likelihood with the General Time Reversible
model and bootstrap testing of 1000. Branches with bootstrap support lower than 70 were
12
collapsed. The phylogenetic tree based on the SILVA database was compared to the one
obtained from the RDP database.
Zone inhibition assay
The two test strains used in the assay were obtained from the Culture Collection, University
of Göteborg (CCUG), Pseudomonas resinovorans CCUG 2473T (P. resinovorans) and
Staphylococcus warneri CCUG 7325T (S. warneri). Strains were spread on VPA plates (10 g
VPB (Oxoid), 1000 ml deionized H2O, 14 cm in Ø). Following concentrations were used: P.
resinovorans - colony forming units/ml (cfu/ml) and S. warneri cfu/ml.
Directly after, 10 µl of overnight cultures of selected bacterial isolates from experiment A,
were spotted in even distance from each other. Twelve isolates were spotted for each plate
and the plates were then incubated at 25 °C for 3 days. The plates were inspected for
occurrence of inhibition zone around colonies and isolates that gave rise to an inhibition zone
were further tested. Agar plugs were cut out with the back of a 200 µl pipet-tip from the
inhibition zone and placed in 350 µl of methanol. The tubes with plugs were sonicated for 10
minutes and then centrifuged at 14 000 rpm for 5 min. The liquid were then transferred to new
tubes and a HPLC-MS, high performance liquid chromatography – mass spectrophotometer,
(Agilent 1100 HPLC/Bruher maXis Impact ESI-QTOF MS) was performed by loading 1 µl
sample into the column (Thermo Scientific Accucore 3 50 mm with 2.6 µm particels). The
eluent used were A: H2O (0.2 % FA) and B: MeCN (0.2 %FA). A gradient of the eluent was
set at 10-95 % B in 4 min, 95 % B for 3 min, 10 % B for 3 min, 0.8 ml/min.
Results
Cultivation and isolation of microorganisms
The number of microbial colonies growing on the plates in experiment A was extremely
variable depending on the sample. The assortment of bacterial colonies on the plates varied
not only between samples but also between control plates and plates with different antibiotics.
Examples of different colony types and the differences between an antibiotic plate (to the left)
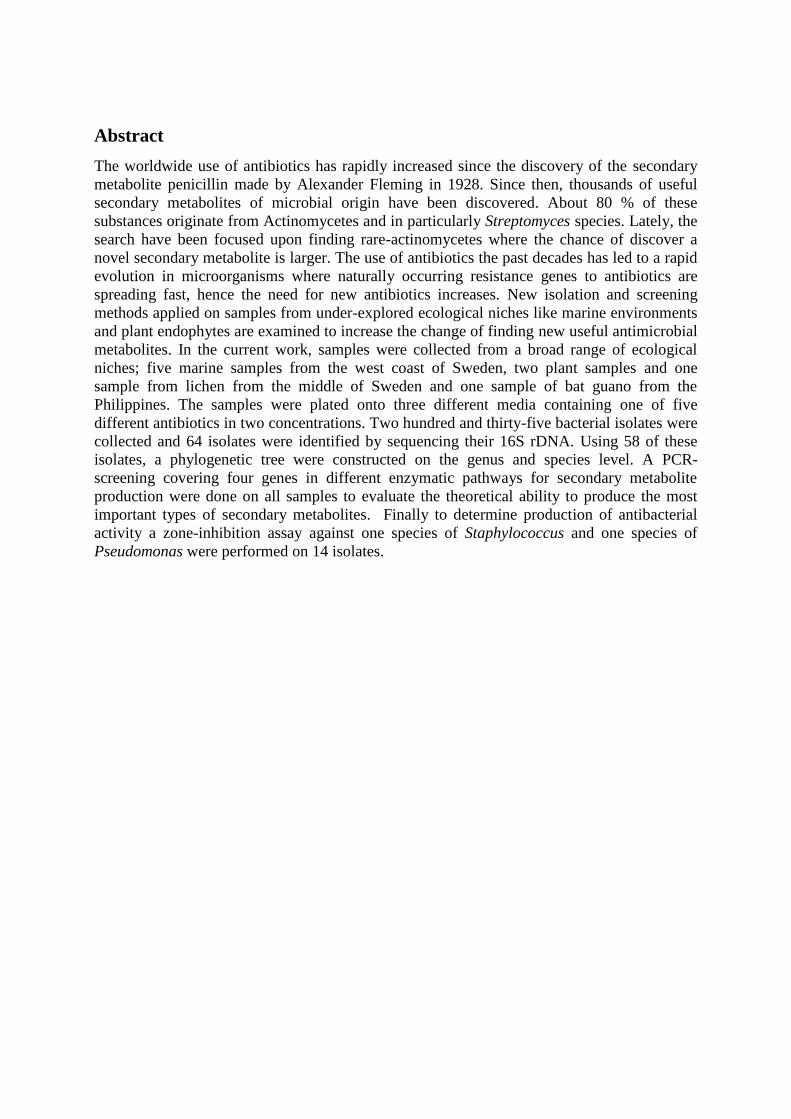
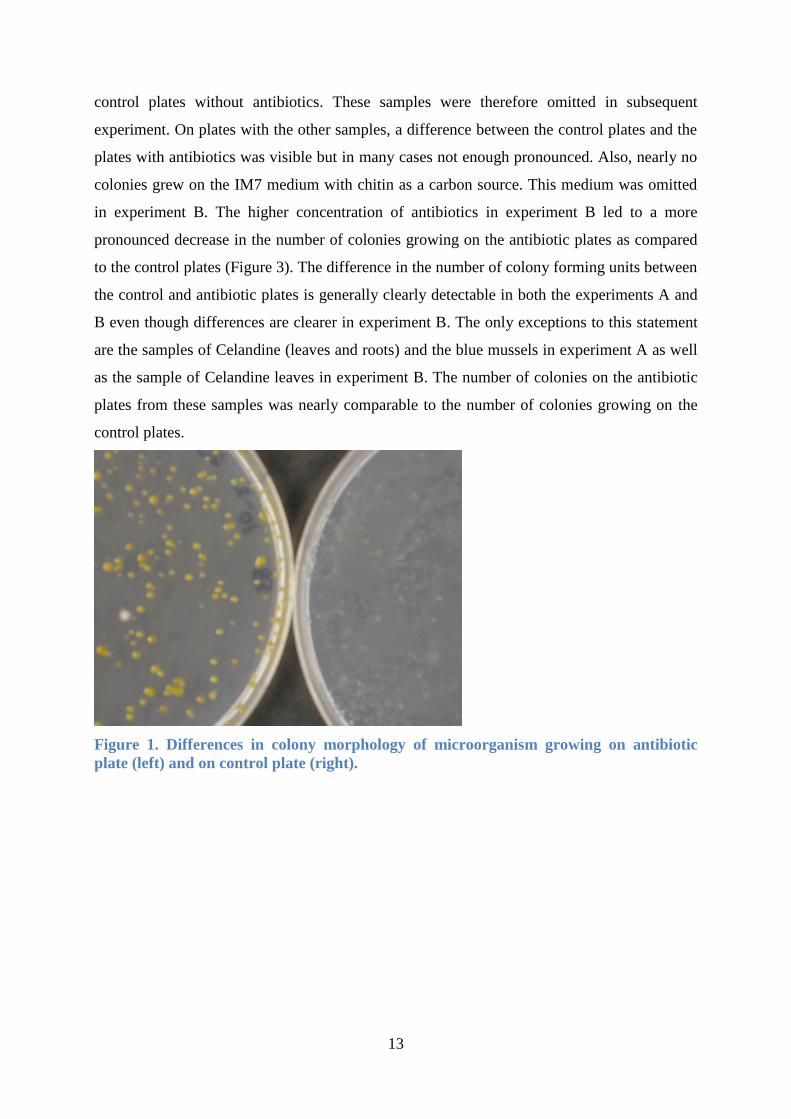
and a control plate (to the right) are displayed in Figure 1. In total 86 isolated colonies, mostly
bacteria but also some fungi from experiment A and 189 colonies from experiment B was
selected and cultured (Appendix 1).
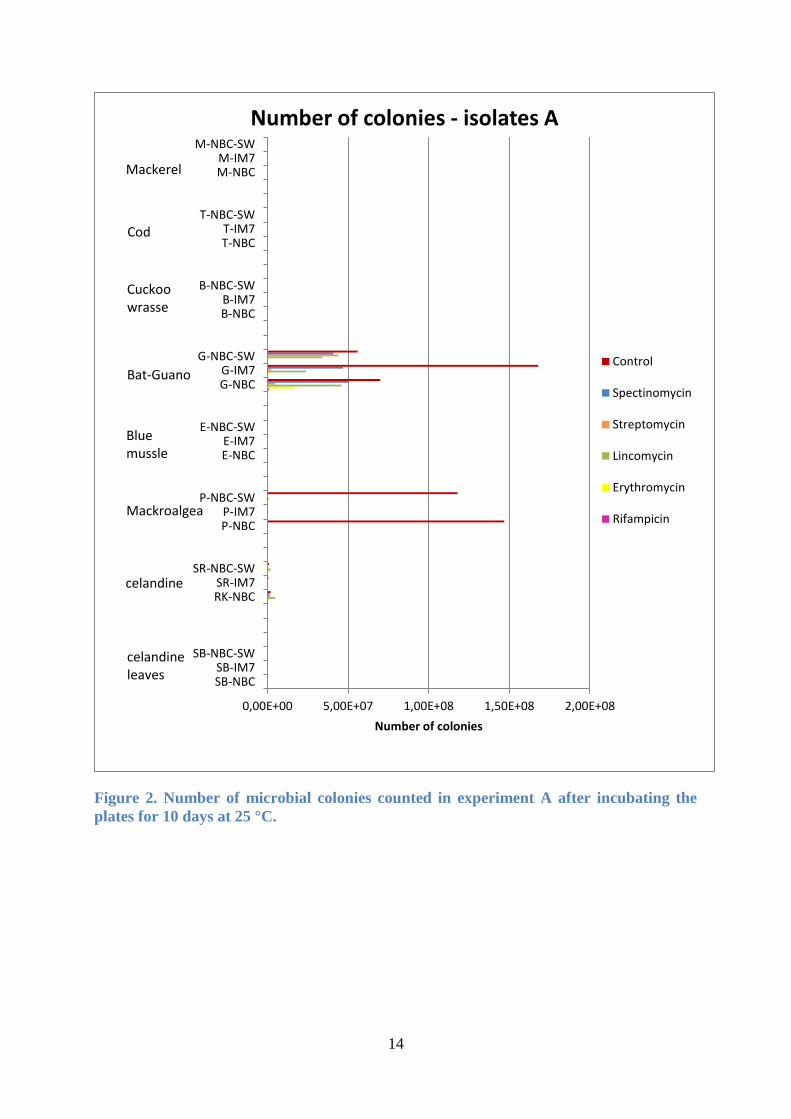
The number of colonies was counted on each plate for experiment A (Figure 2). Number of
colonies grown on plates from Cod, Mackerel and Cuckoo wrasse was extremely low even on
13
control plates without antibiotics. These samples were therefore omitted in subsequent
experiment. On plates with the other samples, a difference between the control plates and the
plates with antibiotics was visible but in many cases not enough pronounced. Also, nearly no
colonies grew on the IM7 medium with chitin as a carbon source. This medium was omitted
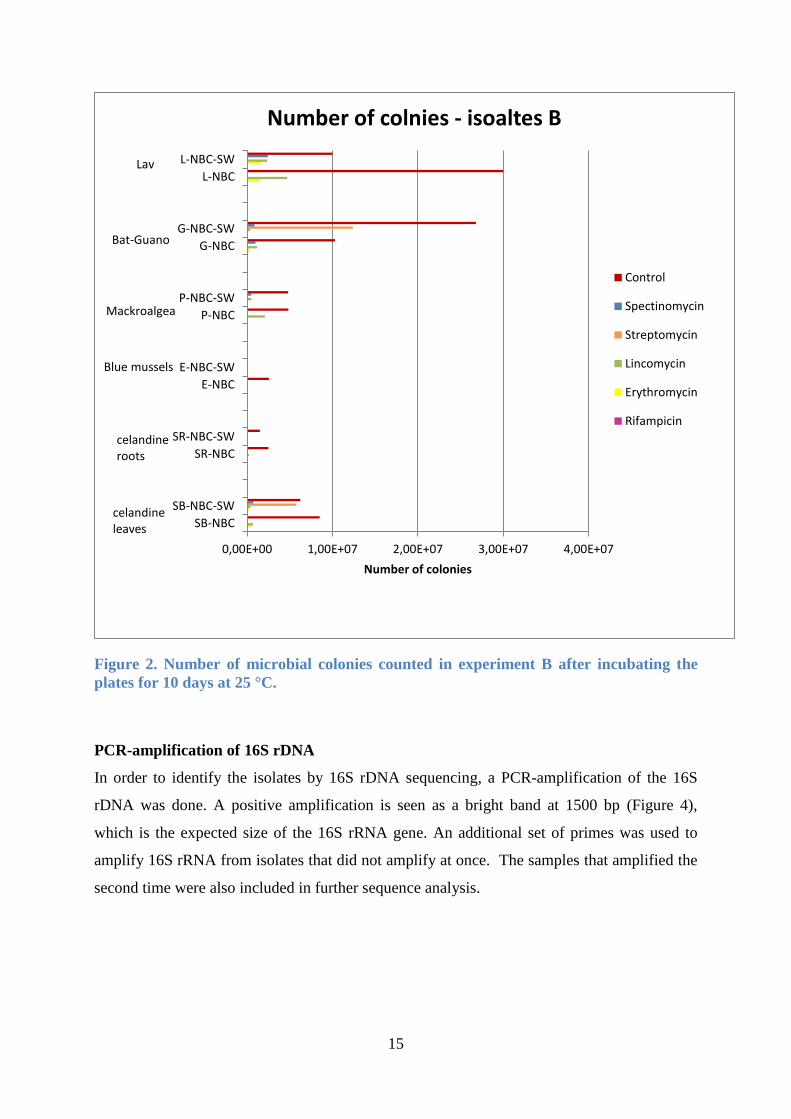
in experiment B. The higher concentration of antibiotics in experiment B led to a more
pronounced decrease in the number of colonies growing on the antibiotic plates as compared
to the control plates (Figure 3). The difference in the number of colony forming units between
the control and antibiotic plates is generally clearly detectable in both the experiments A and
B even though differences are clearer in experiment B. The only exceptions to this statement
are the samples of Celandine (leaves and roots) and the blue mussels in experiment A as well
as the sample of Celandine leaves in experiment B. The number of colonies on the antibiotic
plates from these samples was nearly comparable to the number of colonies growing on the
control plates.
Figure 1. Differences in colony morphology of microorganism growing on antibiotic
plate (left) and on control plate (right).
14
Figure 2. Number of microbial colonies counted in experiment A after incubating the
plates for 10 days at 25 °C.
0,00E+00 5,00E+07 1,00E+08 1,50E+08 2,00E+08
SB-NBCSB-IM7
SB-NBC-SW
RK-NBCSR-IM7
SR-NBC-SW
P-NBCP-IM7
P-NBC-SW
E-NBCE-IM7
E-NBC-SW
G-NBCG-IM7
G-NBC-SW
B-NBCB-IM7
B-NBC-SW
T-NBCT-IM7
T-NBC-SW
M-NBCM-IM7
M-NBC-SW
Number of colonies
Number of colonies - isolates A
Control
Spectinomycin
Streptomycin
Lincomycin
Erythromycin
Rifampicin
celandine leaves
celandine
Mackroalgea
Blue mussle
Bat-Guano
Cuckoo wrasse
Cod
Mackerel
15
Figure 2. Number of microbial colonies counted in experiment B after incubating the
plates for 10 days at 25 °C.
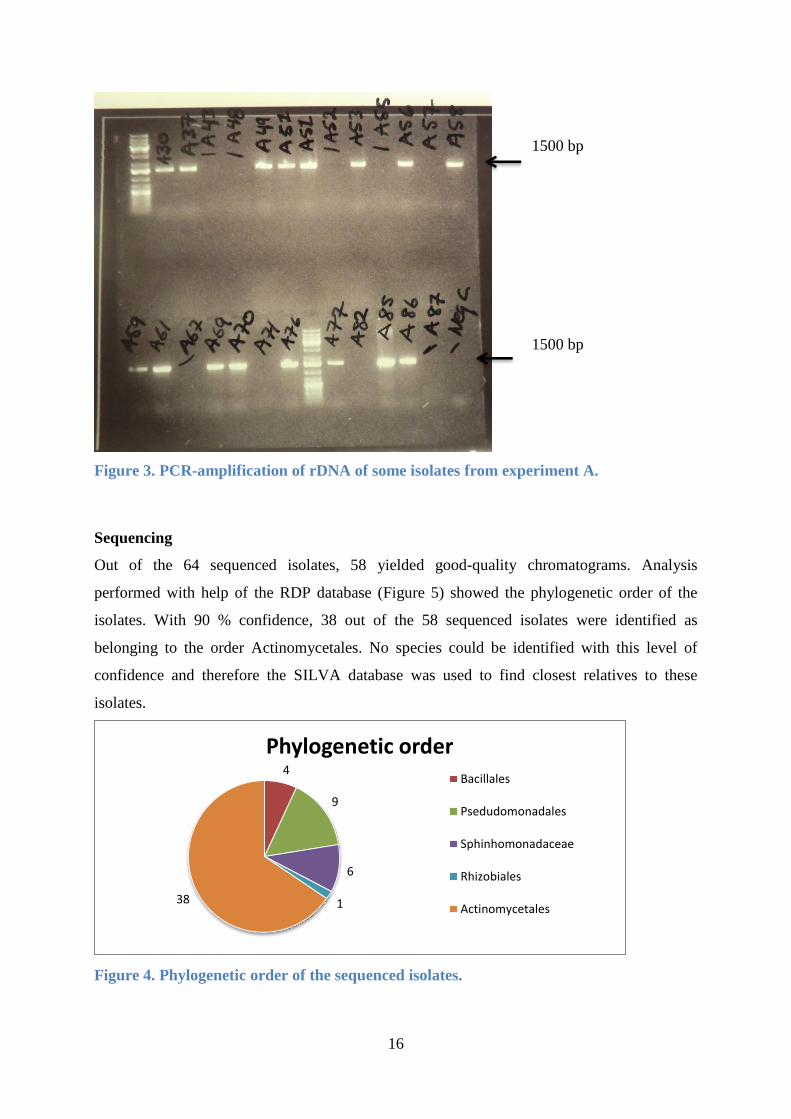
PCR-amplification of 16S rDNA
In order to identify the isolates by 16S rDNA sequencing, a PCR-amplification of the 16S
rDNA was done. A positive amplification is seen as a bright band at 1500 bp (Figure 4),
which is the expected size of the 16S rRNA gene. An additional set of primes was used to
amplify 16S rRNA from isolates that did not amplify at once. The samples that amplified the
second time were also included in further sequence analysis.
0,00E+00 1,00E+07 2,00E+07 3,00E+07 4,00E+07
SB-NBC
SB-NBC-SW
SR-NBC
SR-NBC-SW
E-NBC
E-NBC-SW
P-NBC
P-NBC-SW
G-NBC
G-NBC-SW
L-NBC
L-NBC-SW
Number of colonies
Number of colnies - isoaltes B
Control
Spectinomycin
Streptomycin
Lincomycin
Erythromycin
Rifampicin
Lav
Bat-Guano
Mackroalgea
Blue mussels
celandine leaves
celandine roots
16
Figure 3. PCR-amplification of rDNA of some isolates from experiment A.
Sequencing
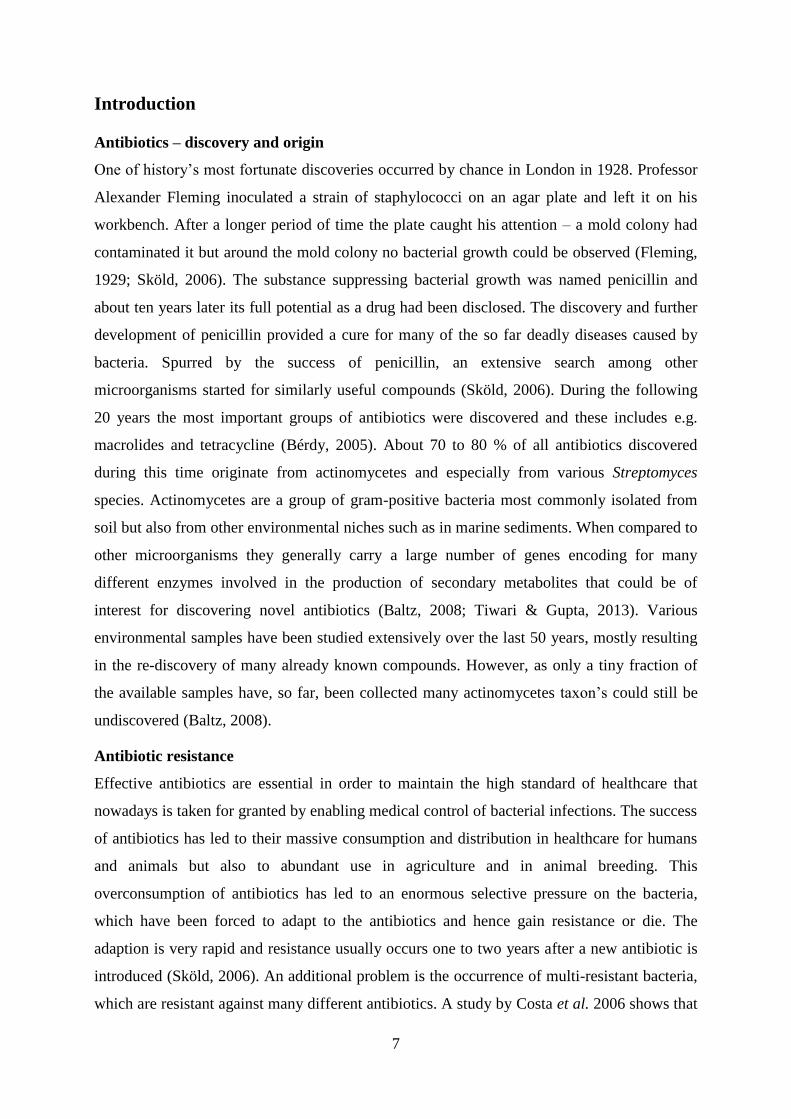
Out of the 64 sequenced isolates, 58 yielded good-quality chromatograms. Analysis
performed with help of the RDP database (Figure 5) showed the phylogenetic order of the
isolates. With 90 % confidence, 38 out of the 58 sequenced isolates were identified as
belonging to the order Actinomycetales. No species could be identified with this level of
confidence and therefore the SILVA database was used to find closest relatives to these
isolates.
Figure 4. Phylogenetic order of the sequenced isolates.
4
9
6
1 38
Phylogenetic order Bacillales
Psedudomonadales
Sphinhomonadaceae
Rhizobiales
Actinomycetales
1500 bp
1500 bp
17
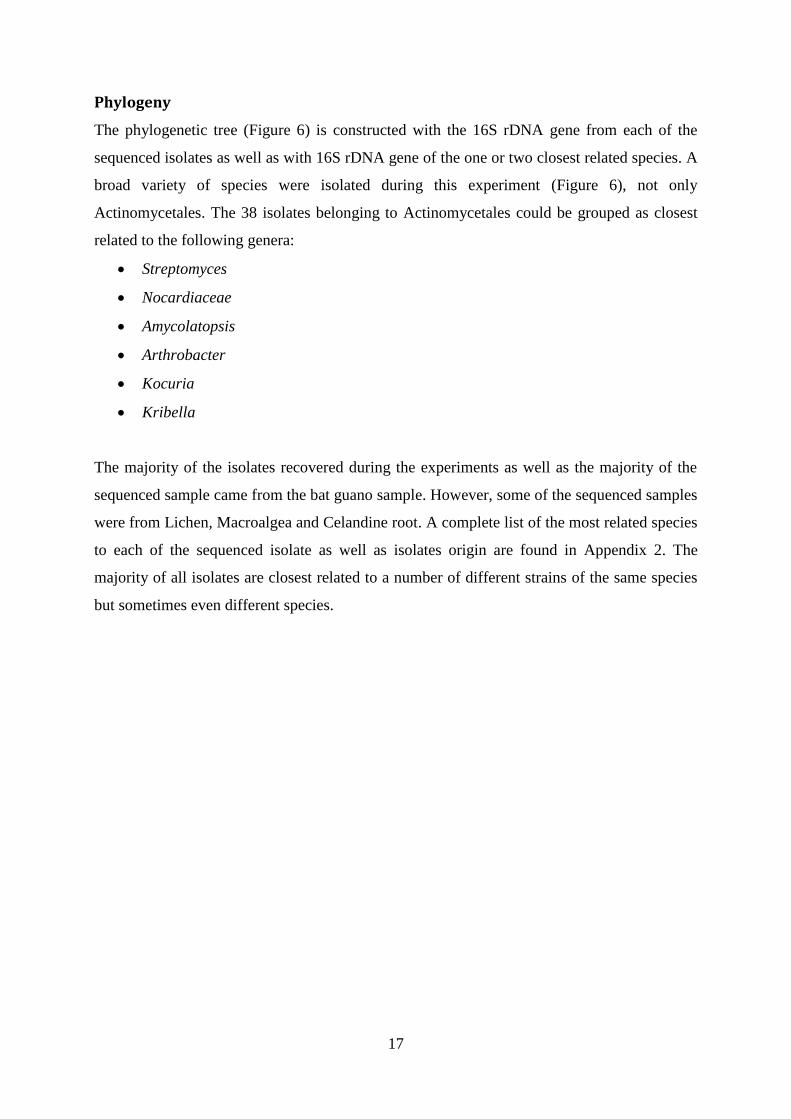
Phylogeny
The phylogenetic tree (Figure 6) is constructed with the 16S rDNA gene from each of the
sequenced isolates as well as with 16S rDNA gene of the one or two closest related species. A
broad variety of species were isolated during this experiment (Figure 6), not only
Actinomycetales. The 38 isolates belonging to Actinomycetales could be grouped as closest
related to the following genera:
Streptomyces
Nocardiaceae
Amycolatopsis
Arthrobacter
Kocuria
Kribella
The majority of the isolates recovered during the experiments as well as the majority of the
sequenced sample came from the bat guano sample. However, some of the sequenced samples
were from Lichen, Macroalgea and Celandine root. A complete list of the most related species
to each of the sequenced isolate as well as isolates origin are found in Appendix 2. The
majority of all isolates are closest related to a number of different strains of the same species
but sometimes even different species.
18
Figure 5. Phylogenetic tree of the 58 isolates recovered in this experiment constructed
with Maximum Likelihood with the General Time Reversible model and bootstrap
testing of 1000, branches with bootstrap support lower than 70 was collapsed.
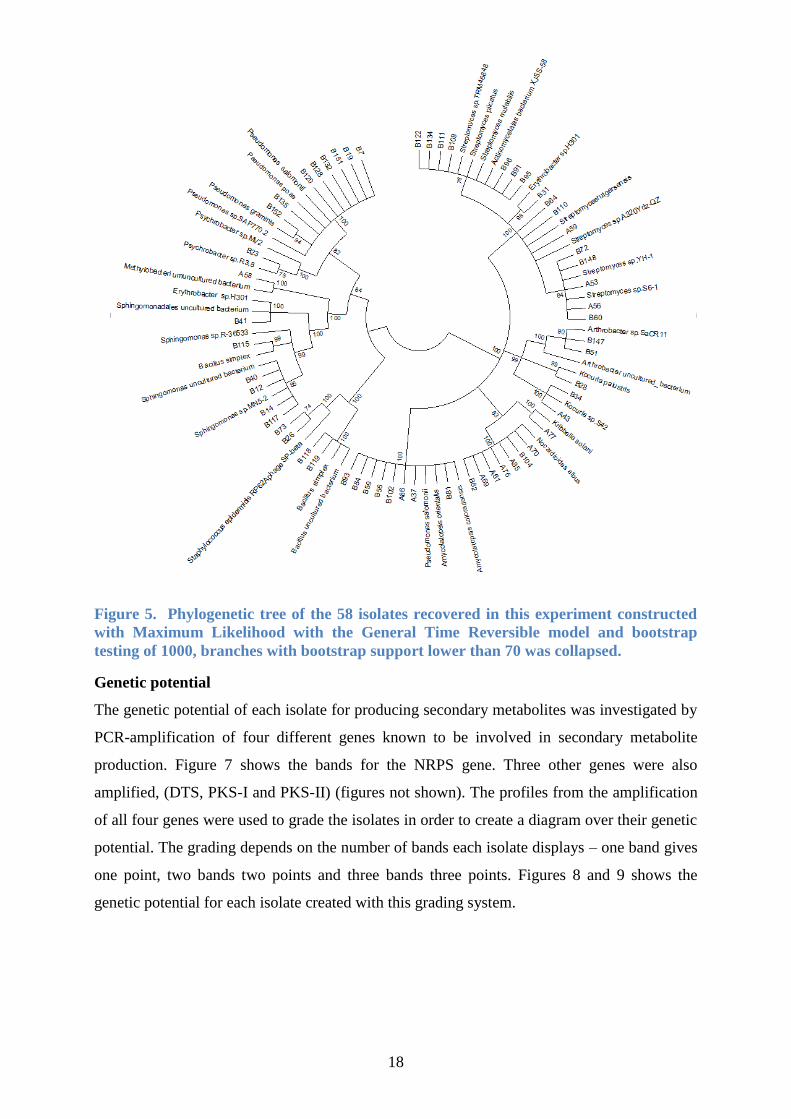
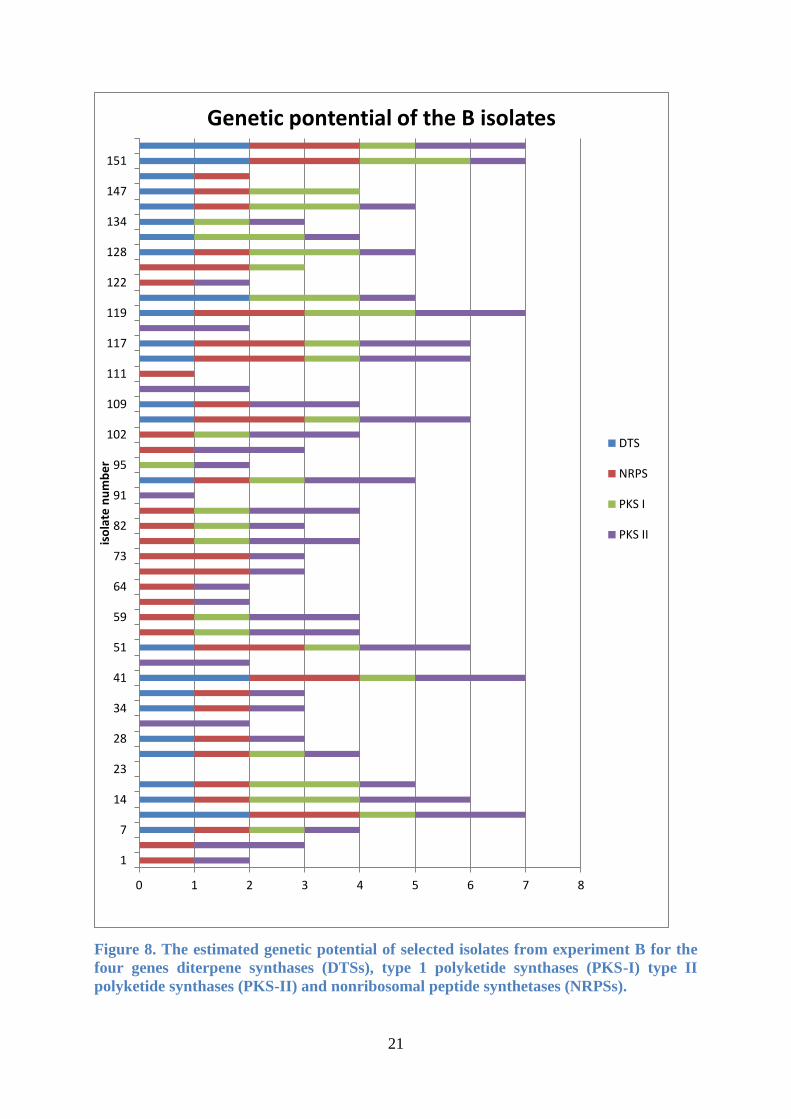
Genetic potential
The genetic potential of each isolate for producing secondary metabolites was investigated by
PCR-amplification of four different genes known to be involved in secondary metabolite
production. Figure 7 shows the bands for the NRPS gene. Three other genes were also
amplified, (DTS, PKS-I and PKS-II) (figures not shown). The profiles from the amplification
of all four genes were used to grade the isolates in order to create a diagram over their genetic
potential. The grading depends on the number of bands each isolate displays – one band gives
one point, two bands two points and three bands three points. Figures 8 and 9 shows the
genetic potential for each isolate created with this grading system.
19
Figure 6. PCR-amplification of the NRPS gene for some isolates in experiment B.
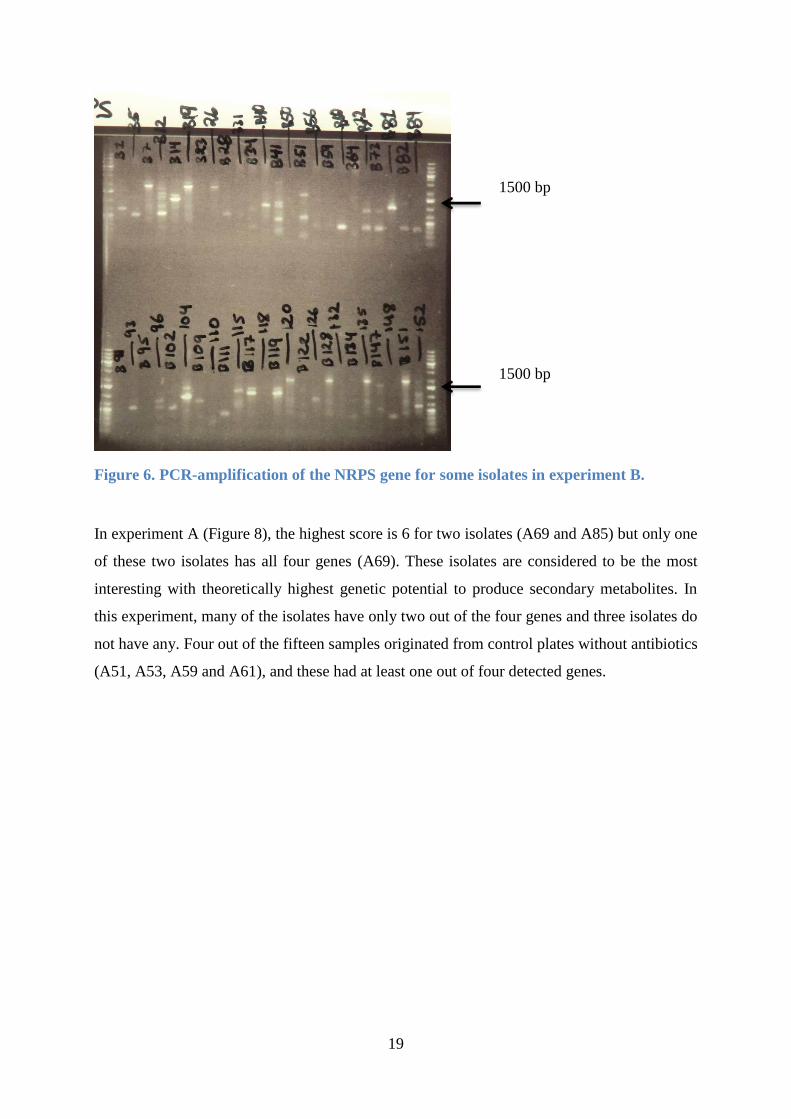
In experiment A (Figure 8), the highest score is 6 for two isolates (A69 and A85) but only one
of these two isolates has all four genes (A69). These isolates are considered to be the most
interesting with theoretically highest genetic potential to produce secondary metabolites. In
this experiment, many of the isolates have only two out of the four genes and three isolates do
not have any. Four out of the fifteen samples originated from control plates without antibiotics
(A51, A53, A59 and A61), and these had at least one out of four detected genes.
1500 bp
1500 bp
20
Figure 7. The estimated genetic potential of some of the isolates from experiment A for
the four genes diterpene synthases (DTSs), type 1 polyketide synthases (PKS-I) type II
polyketide synthases (PKS-II) and nonribosomal peptide synthetases (NRPSs).
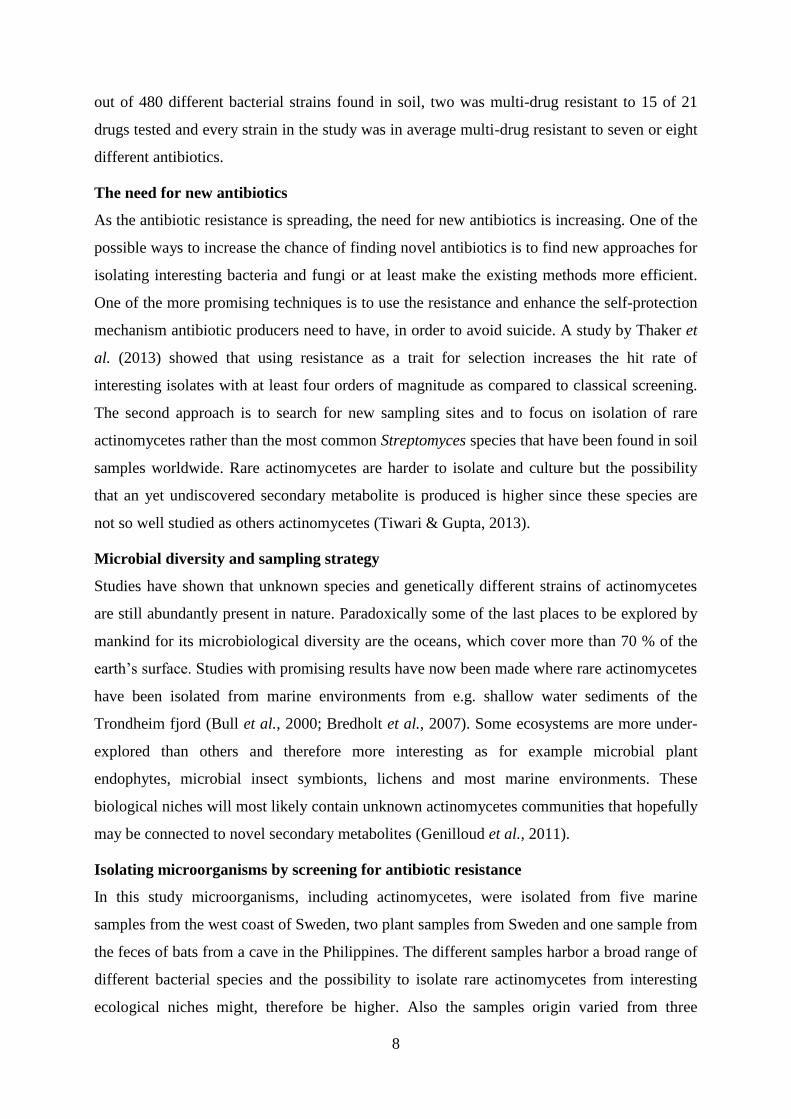
The genetic potential of the B isolates is generally a bit higher as compared to the A isolates
with an overall higher score and the maximum score of seven compared to six for the A
isolates. Also, 14 out of 48 isolates in this experiment have all four genes and five isolates
reaches the highest score of seven. Only three isolates were from control plates (B19, B23 and
B60) and out of these three isolates the isolate B19 have all four genes whereas isolate B23
does not have any of these genes. This shows that the theoretical ability to create secondary
metabolites is high even when the bacteria not are under the selection pressure.
0 1 2 3 4 5 6 7
30
37
49
51
53
56
58
59
61
69
70
76
77
85
86
Iso
late
nu
mb
er
Genetic pontential of the A isoltes
DTS
NRPS
PKS I
PKS II
21
Figure 8. The estimated genetic potential of selected isolates from experiment B for the
four genes diterpene synthases (DTSs), type 1 polyketide synthases (PKS-I) type II
polyketide synthases (PKS-II) and nonribosomal peptide synthetases (NRPSs).
0 1 2 3 4 5 6 7 8
1
7
14
23
28
34
41
51
59
64
73
82
91
95
102
109
111
117
119
122
128
134
147
151
iso
late
nu
mb
er
Genetic pontential of the B isolates
DTS
NRPS
PKS I
PKS II
22
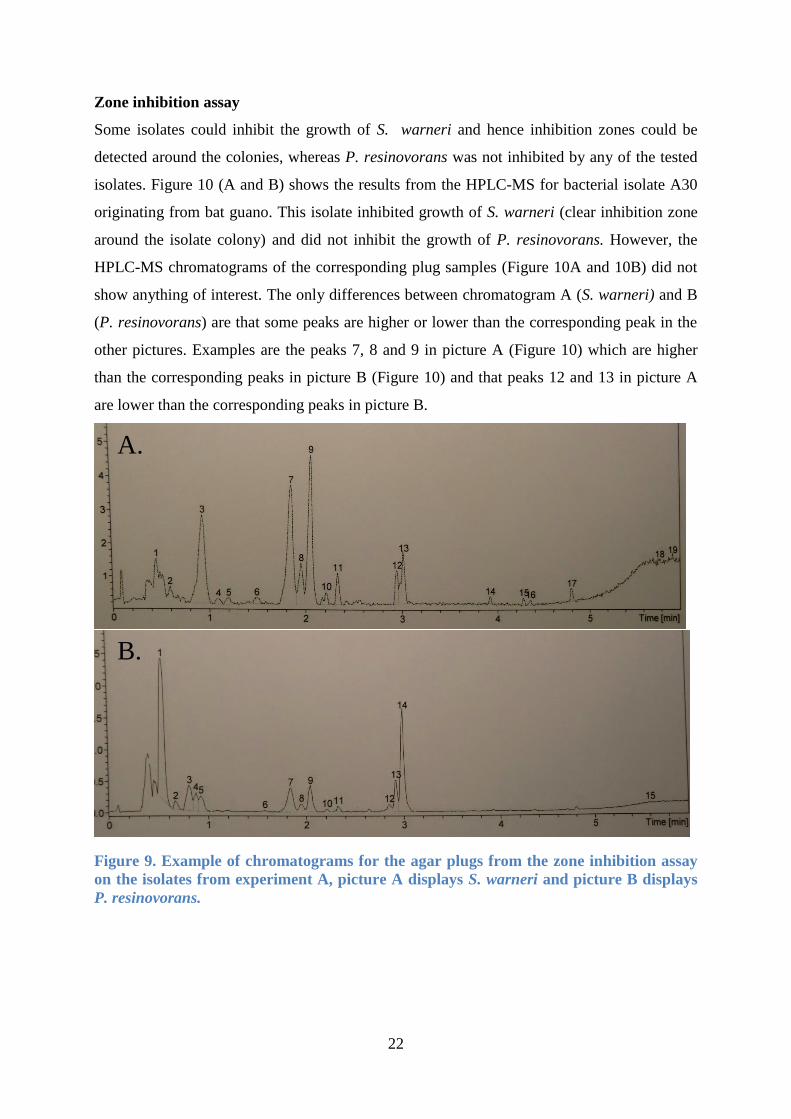
Zone inhibition assay
Some isolates could inhibit the growth of S. warneri and hence inhibition zones could be
detected around the colonies, whereas P. resinovorans was not inhibited by any of the tested
isolates. Figure 10 (A and B) shows the results from the HPLC-MS for bacterial isolate A30
originating from bat guano. This isolate inhibited growth of S. warneri (clear inhibition zone
around the isolate colony) and did not inhibit the growth of P. resinovorans. However, the
HPLC-MS chromatograms of the corresponding plug samples (Figure 10A and 10B) did not
show anything of interest. The only differences between chromatogram A (S. warneri) and B
(P. resinovorans) are that some peaks are higher or lower than the corresponding peak in the
other pictures. Examples are the peaks 7, 8 and 9 in picture A (Figure 10) which are higher
than the corresponding peaks in picture B (Figure 10) and that peaks 12 and 13 in picture A
are lower than the corresponding peaks in picture B.
Figure 9. Example of chromatograms for the agar plugs from the zone inhibition assay
on the isolates from experiment A, picture A displays S. warneri and picture B displays
P. resinovorans.
A.
B.
23
Discussion
The aim of this study was to isolate microorganism, in particular rare actinomycetes from
interesting ecological niches and preferably with a high genetic potential to produce
secondary metabolites. The samples were taken from various environmental niches: the salty
waters of the southern west coasts of Sweden, the inland of the middle of Sweden and the
tropical Philippines. Moreover, the samples were of very diverse biological nature. Thus
many different niches were simultaneously studied as the samples ranged from bat guano to
marine environments including different species of fishes, mussels and macroalgea.
Furthermore, some samples were of plant origin (both leaves and roots) and finally there was
a sample of lichen, a composite organism consisting of fungi and cyanobacteria. The samples
were cultivated on different media containing various antibiotics and therefore antibiotic
resistant strains were easier selected and separated from non-resistant strains.
All samples did not yield colonies of bacteria under the experimental conditions applied and
hence were excluded from the experiments (Cod, Mackerel and Cuckoo wrasse). All the other
samples gave rise to colonies in varying amounts. The most successful sample both in colony
numbers and morphological diversity was the bat guano sample. Two different antibiotic
concentrations were also tested and the higher concentration resulted in a better differentiation
between control and antibiotic plates. This shows, as could be expected, that the selection
pressure on the bacteria increases with the concentration of antibiotics.
The attempts to amplify the 16S rDNA gene of selected isolates revealed the majority of
samples did amplify with the most commonly used primers. A second attempt to amplify the
non-amplifying isolates was performed with the use of other primers but no amplification
occurred. This could be due to the fact that only universal primer pairs were used during both
amplifications. Such universal primers are designed to be complementary to a broad variety of
species but obviously not to all species of bacteria and especially not to the unique ones. A
different primer pair targeting other groups of microorganism could be useful to try but was
not in this study. Another but more unlikely source of error could be that the DNA extraction
may have failed or that the DNA has been degraded after the extraction.
The phylogenetic tree based on the 58 obtained 16S rDNA sequences showed that a broad
variety of species have been isolated during the experiments. Out of these 58 sequences 38
24
sequences were from Actinomycetales, many of these isolates are classified as rare
actinomycetes i.e. non Streptomyces species. These isolates are potential producers of
secondary metabolites that may still be unknown and further testing of these isolates is
necessary to evaluate their full potential. Moreover, the potential of the 20 isolates of non-
Actinomycetales species might also be of interest for further studies.
The genome analysis performed in the experiment proved to be very useful since it could
display the genetic potential of each selected isolate before performing e.g. bioassays. The
widely spread antibiotic resistance forces us to look after novel antimicrobial compounds that
could become useful and therefore antibiotics encoded by novel genes are of the highest
interest. The fact that some of the investigated isolates possess multiple genes involved in
secondary metabolism does not mean that they actually use them to produce antimicrobial
metabolites of interest but they might. Nevertheless, the most promising isolates and
especially these that carry all four probed genes should be further investigated to reveal the
possible secondary metabolites that could be produced. However, the presence of such a gene
does not guaranty the production of a corresponding secondary metabolite. Therefore to
evaluate the accuracy of the genetic potential test, the generated data must be combined with
future cultivation experiments and the examination of secondary metabolites with promising
profiles of antimicrobial activity. Some of the rare actinomycetes isolated during this
experiment were from the species of Arthrobacter (i.e. B51 and B147) and Kocuria (i.e. B34).
The genetic potential of these isolates was highest for isolate B51 (4 genes), isolate B147 and
B34 had 3 genes each. This high theoretical ability to produce secondary metabolites is very
promising and consistent with the theories that rare actinomycetes are an under-explored
source for discovery of novel secondary metabolites.
The zone inhibition assay with isolates from experiment A showed a difference in inhibition
capacity against S. warneri as compared to P. resinovorans. Whereas the growth of the
Staphylococcus could be controlled and inhibited by at least some of the isolates the growth of
Pseudomonas was not. The assay might be not favorable for tests with actinomycetes as it
apparently favors the fast growing Staphylococcus and Pseudomonas. On the other hand, the
applied isolates of actinomycetes usually need more time to grow and thus to produce
secondary metabolites. Therefore, the assay should be modified in a way that favors the more
slowly growing isolates. For example, older cultures could have been used or the isolates
25
could have been spread at an earlier time-point compared to the test organisms and hence
favor the more slowly growing bacterial isolates.
The methods to isolate microorganism by screening for antibiotic resistance that were used in
this study attempted to isolate a higher proportion of interesting microorganisms i.e. potential
producers of secondary metabolites. The result from the two experiments with different
antibiotic concentrations seems to point to the conclusion that this selective cultivation
method is working since the higher antibiotic concentration renders more isolates with a
higher genetic potential to produce secondary metabolites as shown by the genome analysis in
Figures 8 and 9. However, further tests with the selected isolates are needed to confirm this
conclusion. By using samples from diverse ecological niches in the experiment, the
probability of finding rare organisms is further increased and also the probability of finding
novel secondary metabolites that possibly could be used as novel antibiotics.
Future aspects
The current need for new antibiotics will always be a relevant problem since the evolution and
adaption of the microorganisms will never stop. However, it is not very likely to think that we
ever could outsmart evolution and find a secondary metabolite that will kill every pathogenic
microorganism in about 80 years. I would say, the best we can hope for is to hold back the
spread of antibiotic resistance by changing and restrict the use of antibiotics for example in
farming and animal breeding. It is also important to shorten the time between the discovery of
useful antimicrobial secondary metabolite and its introduction to the market. Even if we all
hope to hold back the microorganisms for a short time, further work in this field is crucial.
Infectious diseases are still the biggest cause of death world-wide, even with the health care
standards nowadays (Selvameenal et al., 2009) and must be taken care off.
26
References
Ayuso-Sacido, A. & Genilloud, O. (2005). New PCR Primers for the Screening of NRPS and
PKS-I Systems in Actinomycetes: Detection and Distribution of These Biosynthetic
Gene Sequences in Major Taxonomic Groups. Microbial Ecology, 49, 10–24.
Baltz, R. H. (2008). Renaissance in antibacterial discovery from actinomycetes. Current
Opinion in Pharmacology, 8, 557–563.
Bérdy, J. (2005). Bioactive Microbial Metabolites. Journal of Antibiotics, 58(1), 1–26.
Bredholt, H., Galatenko, O. A., Engelhardt, K., Fjærvik, E., Terkhova, L. P. & Zotchev, S. B.
(2007). Rare actinomycete bacteria from the shallow water sediments of the
Trondheim fjord, Norwy: isolation, diversity and biological activity. Environmental
Microbiology, 9(11), 2756–2764.
Bull, A. T., Ward, A. C. & Goodfellow, M. (2000). Search and Discovery Strategies for
Biotechnology: the Paradigm Shift. Microbiology and Molecular Biology Reviews,
64(3), 573–606.
Costa, V. M. ., McGrann, K. M., Hughes, D. W. & Wright, G. D. (2006). Sampling the
Antibiotic Resistome. Science, 311(5759), 374–377.
Edgar, R. C. (2004). MUSCLE: multiple sequence alignment with high accuracy and high
throughput. Nucleic Acid Research, 32(5), 1792–97.
Fleming, A. (1929). On the antibacterial action of cultures of a penicillium with special
reference to their use in the isolation of B. influenzae. British Journal of Experimental
Pathology, 10, 226–236.
Genilloud, O., González, I., Salazar, O., Martín, J., Rubén Tormo, J. & Vicente, F. (2011).
Current apporaches to exploit actinomycetes as a source of novel natural products.
Journal of Industrial Microbiology & Biotechnology, 38(3), 375–389.
Maidak, B. L., Olsen, G. J., Larsen, N., Overbeek, R., McCaughey, M. J. & Woese, C. R.
(2006). The Ribosomal Database Project (RDP). Nucleic Acid Research, 24(1), 82–85.
Quast, C., Pruesse, E., Yilmaz, P., Gerken, J., Schweer, T., Yarza, P., Peplies, J. & Glöckner,
F. (2013). The SILVA ribosomal RNA gene database project: improved data
processing and web-based tools. Nucleic Acid Research, 41(1), 590–596.
Selvameenal, L., Radhakrishnan, M. & Balagurunathan, R. (2009). Antibiotic pigment from
desert soil actinomycetes: biological activity, purification and chemical screening.
Indian Journal of Pharmaceutical Sciences, 71(5), 499–504.
27
Sköld, O. (2006). Antibiotika och antibiotika resistens. 1. ed Studentlitteratur. ISBN 978-91-
44-03621-2.
Tamura, K., Stecher, G., Peterson, D., Filipski, A. & Kumar, S. (2013). MEGA6: Molecular
Evolutionary Genetics Analysis Version 6.0. Molecular Biology and Evolution, 30,
2725–2729.
Thaker, M. N., Wang, W., Spanogiannopouls, P., Waglechner, N., King, A. M., Medina, R. &
Wright, G. D. (2013). Identifyingproducers of antibacterial compounds by screening
for antibiotic resistance. Nature Biotechnology, 31(10), 922–929.
Tiwari, K. & Gupta, R. K. (2013). Diversity and isolation of rare actinomycetes: an overview.
Critical Reviews in Microbiology, 39(3), 256–294.
Xie, P., Ma, M., Rateb, M. E., Shaaban, K. A., Yo, Z., Huang, S.-X., Zhao, L.-X., Zhu, X.,
Yan, Y., Peterson, R. M., Lohman, J. R., Yang, D., Yin, M., Rudolf, J. D., Jiang, Y.,
Duan, Y. & Shen, B. (2014). Biosynthetic Potential-Based Strain Prioritization for
Natural Product Discovery: A Showcase for Diterpenoid-Producing Actinomycetes.
Journal of Natural Products, 77(2), 377–387.
Zhao, L.-X., Xu, L.-H. & Jiang, C.-L. (2012). Methods for the study of endophytic microorg...
[Methods Enzymol. 2012] - PubMed - NCBI. Methods in Enzymology, 517, 3–21.
28
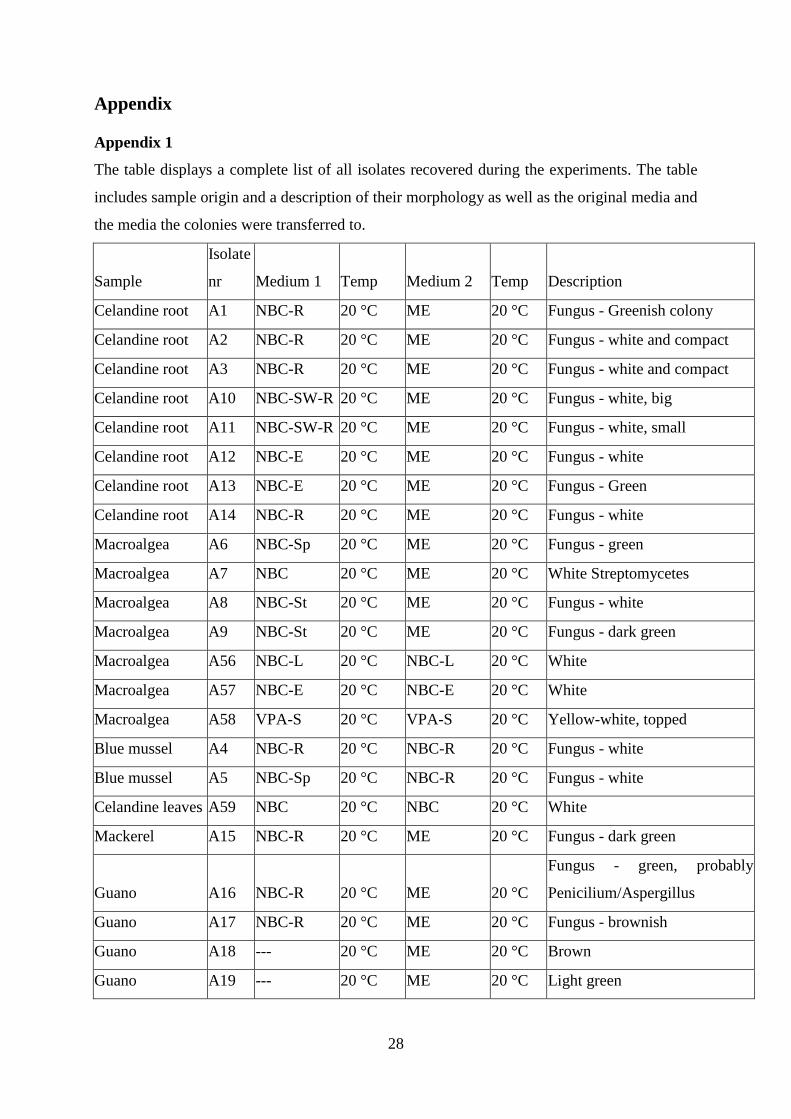
Appendix
Appendix 1
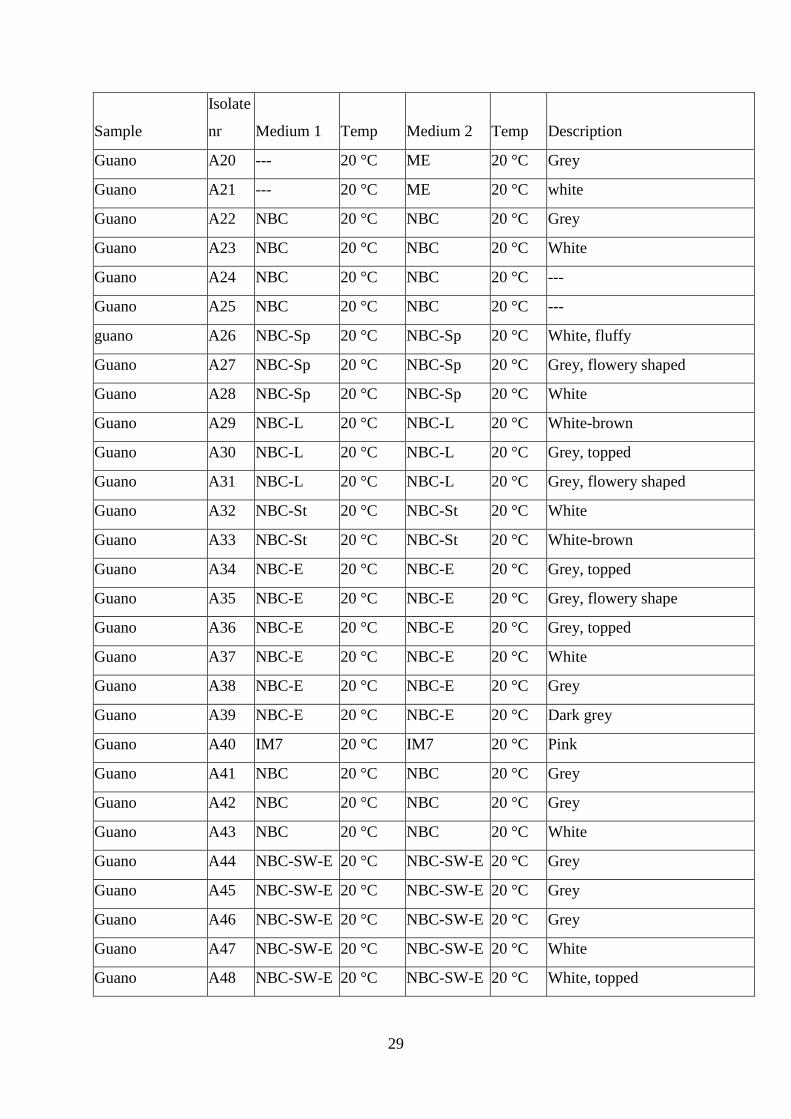
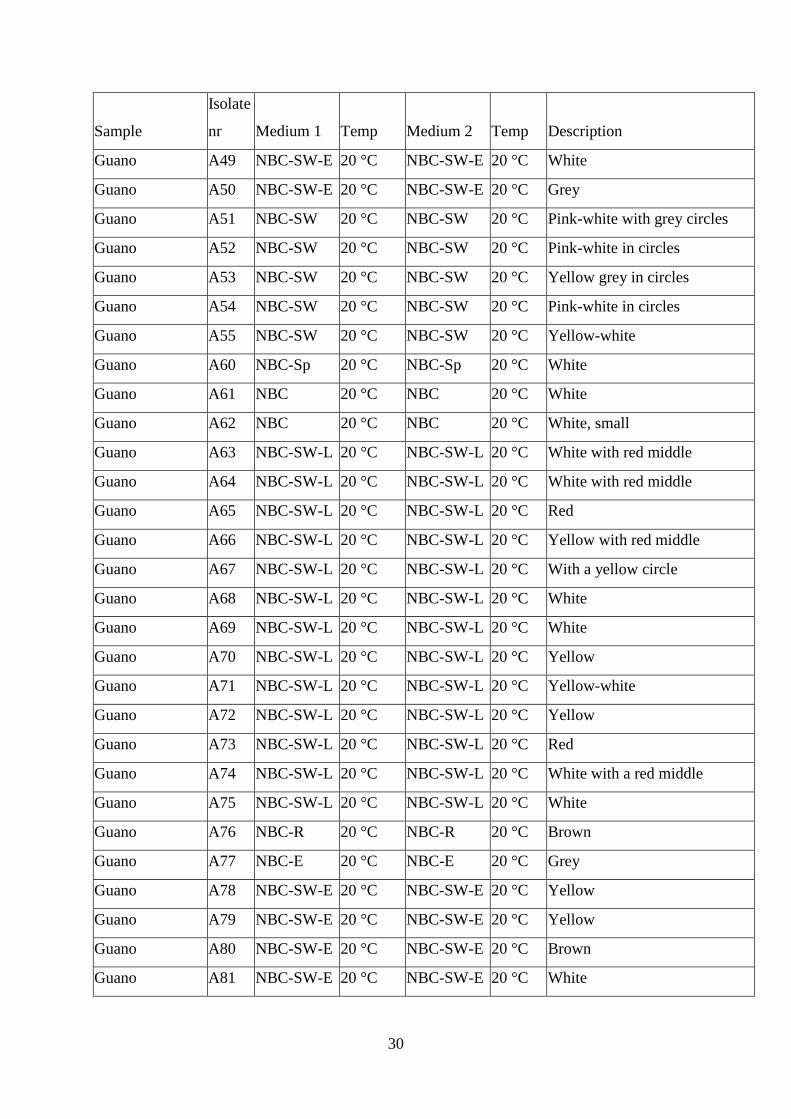
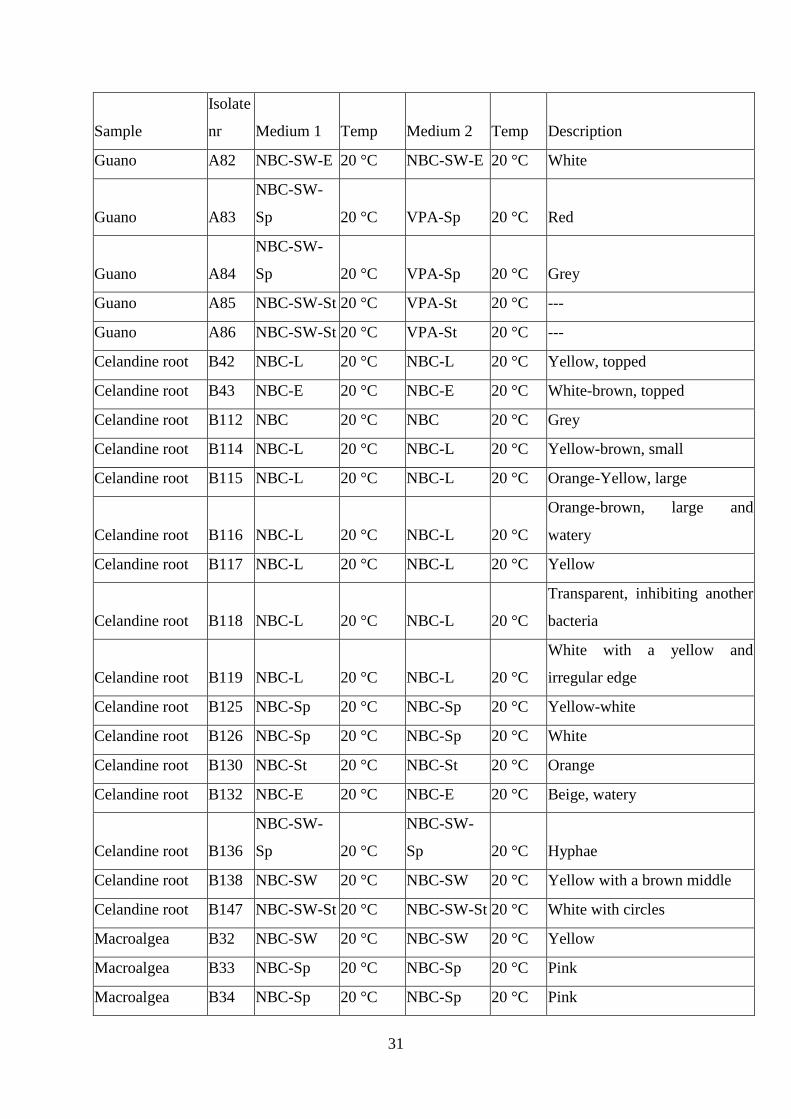
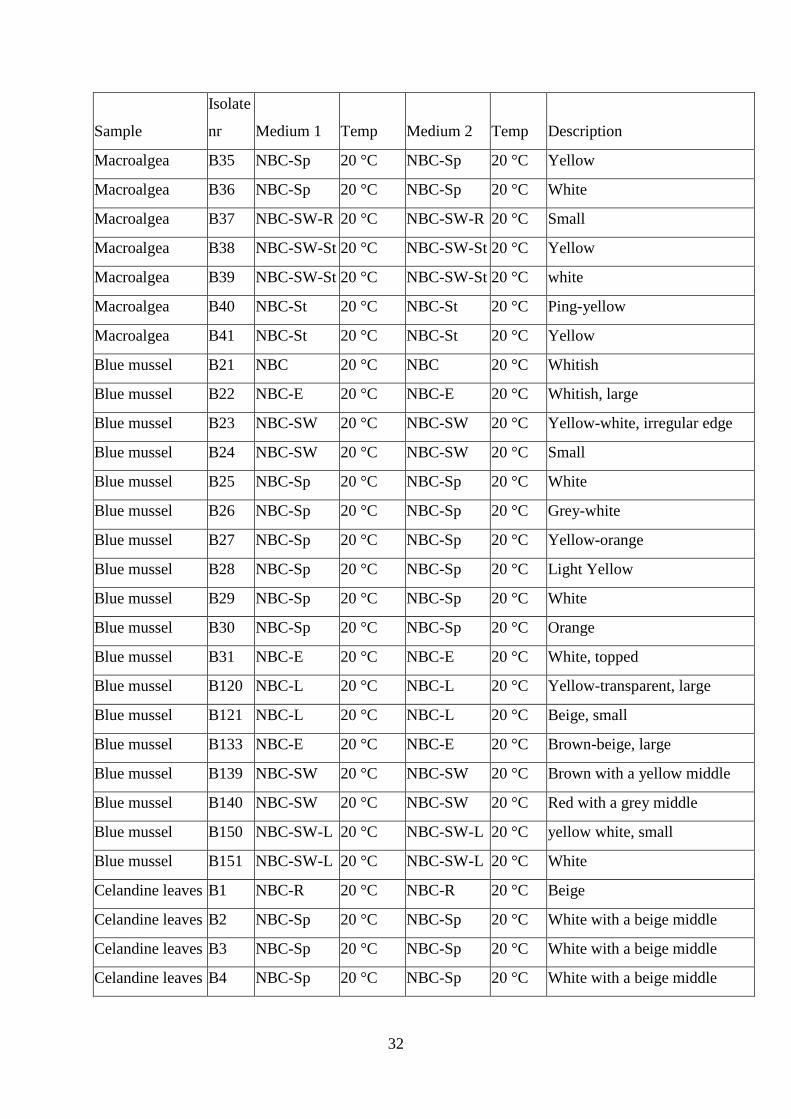
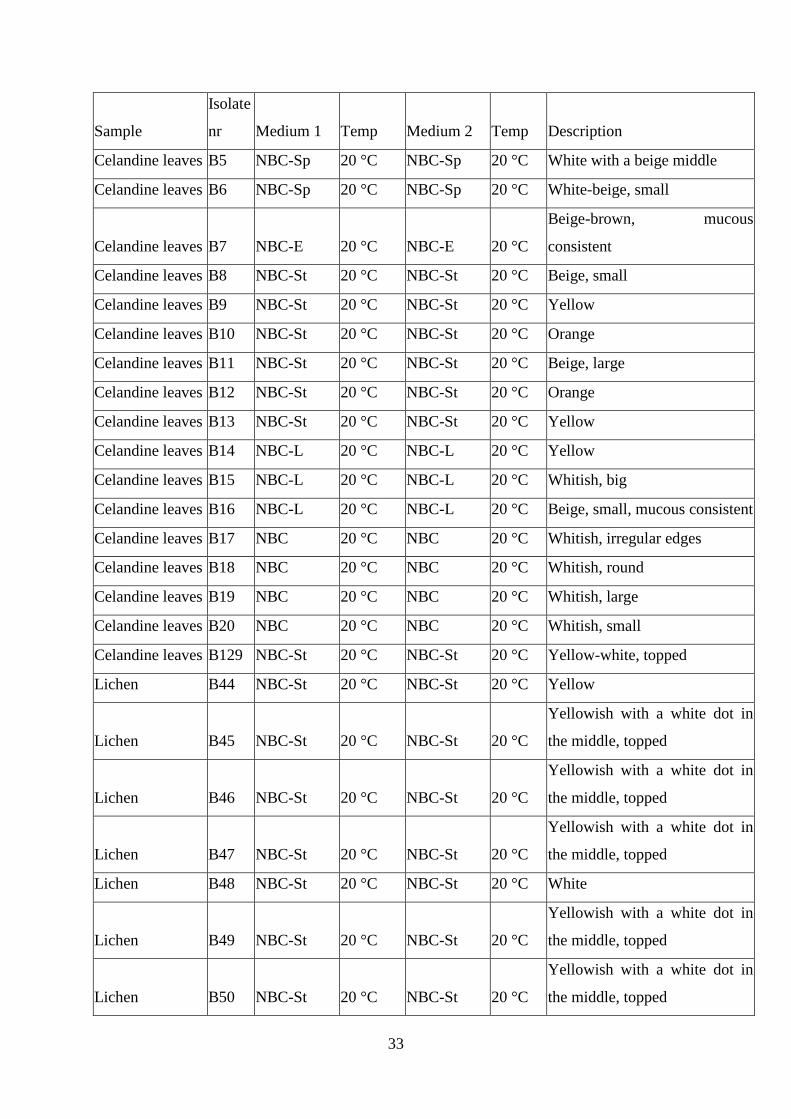
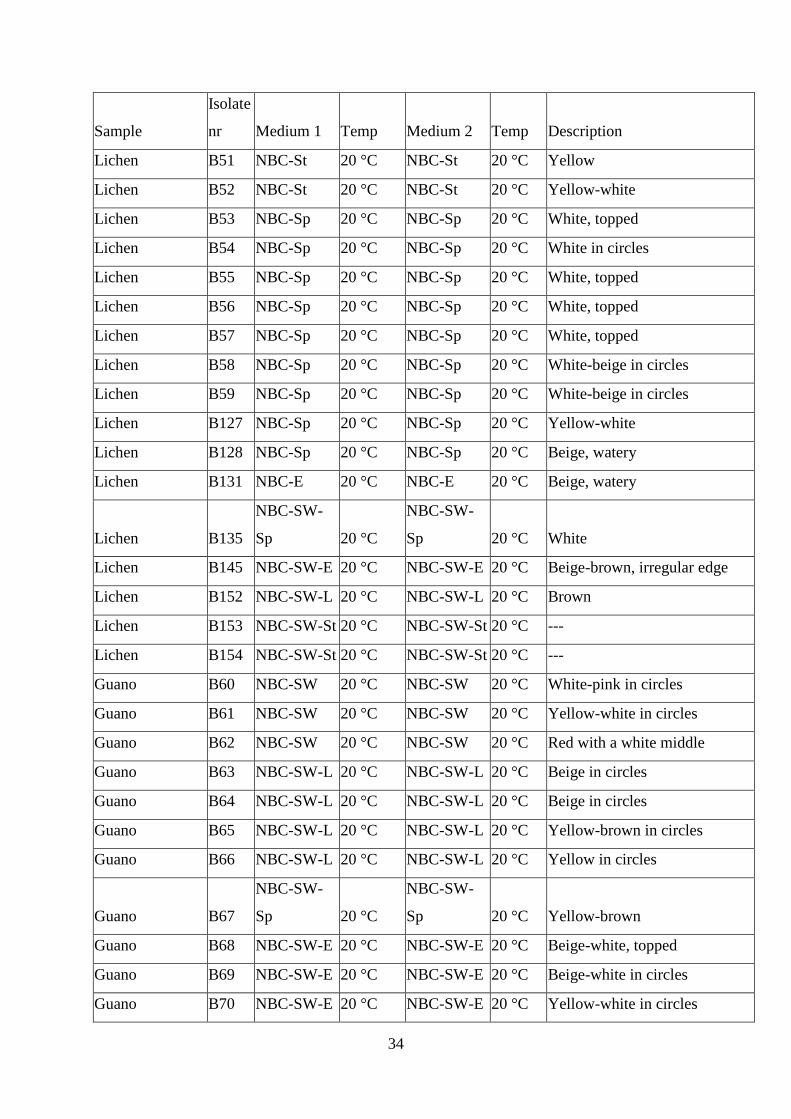
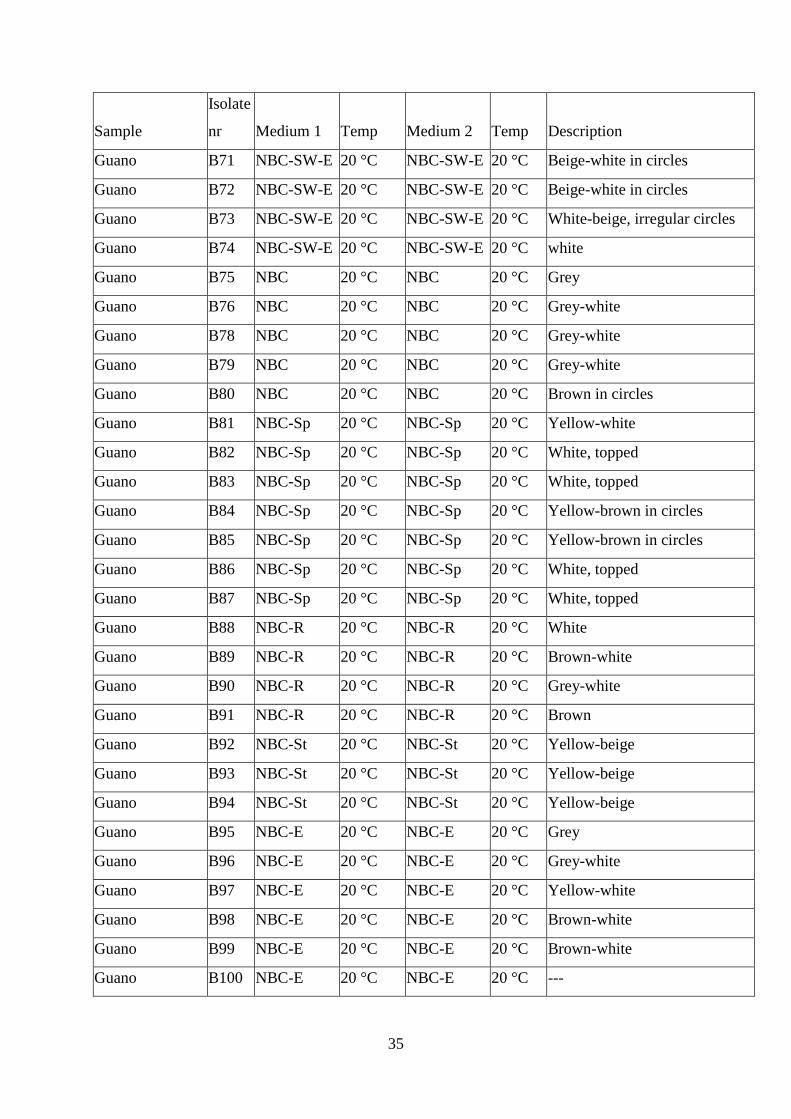
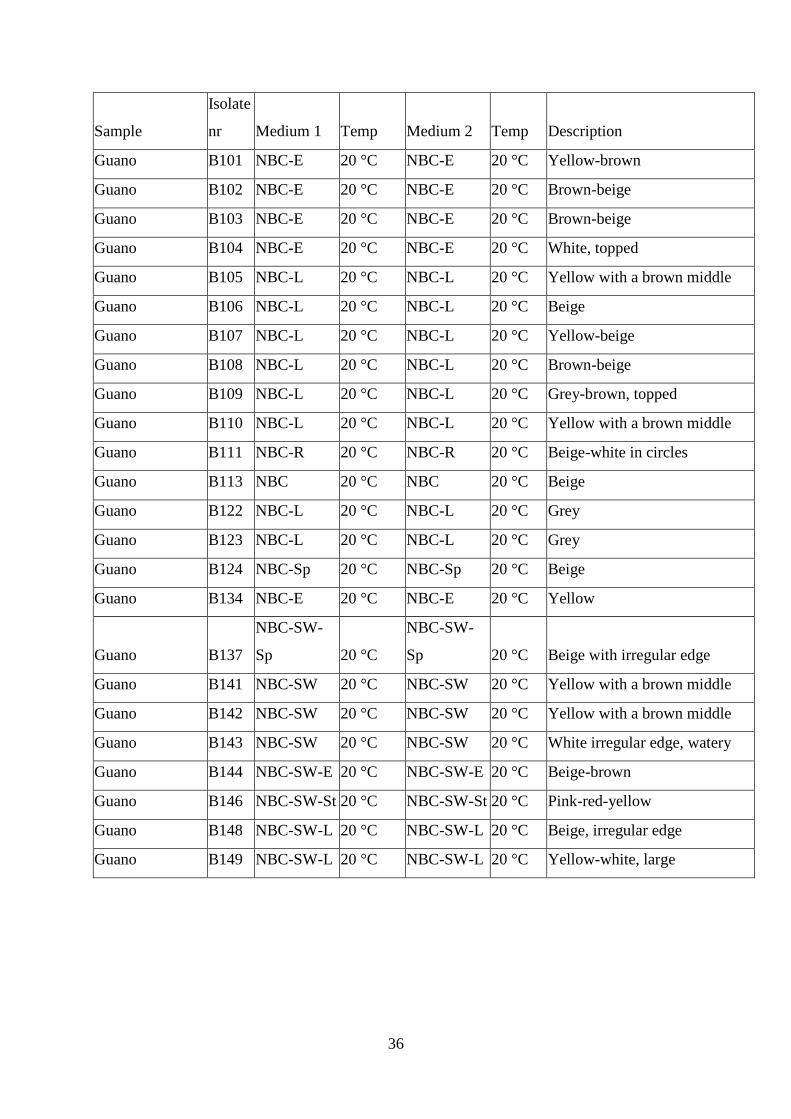
The table displays a complete list of all isolates recovered during the experiments. The table
includes sample origin and a description of their morphology as well as the original media and
the media the colonies were transferred to.
Sample
Isolate
nr Medium 1 Temp Medium 2 Temp Description
Celandine root A1 NBC-R 20 °C ME 20 °C Fungus - Greenish colony
Celandine root A2 NBC-R 20 °C ME 20 °C Fungus - white and compact
Celandine root A3 NBC-R 20 °C ME 20 °C Fungus - white and compact
Celandine root A10 NBC-SW-R 20 °C ME 20 °C Fungus - white, big
Celandine root A11 NBC-SW-R 20 °C ME 20 °C Fungus - white, small
Celandine root A12 NBC-E 20 °C ME 20 °C Fungus - white
Celandine root A13 NBC-E 20 °C ME 20 °C Fungus - Green
Celandine root A14 NBC-R 20 °C ME 20 °C Fungus - white
Macroalgea A6 NBC-Sp 20 °C ME 20 °C Fungus - green
Macroalgea A7 NBC 20 °C ME 20 °C White Streptomycetes
Macroalgea A8 NBC-St 20 °C ME 20 °C Fungus - white
Macroalgea A9 NBC-St 20 °C ME 20 °C Fungus - dark green
Macroalgea A56 NBC-L 20 °C NBC-L 20 °C White
Macroalgea A57 NBC-E 20 °C NBC-E 20 °C White
Macroalgea A58 VPA-S 20 °C VPA-S 20 °C Yellow-white, topped
Blue mussel A4 NBC-R 20 °C NBC-R 20 °C Fungus - white
Blue mussel A5 NBC-Sp 20 °C NBC-R 20 °C Fungus - white
Celandine leaves A59 NBC 20 °C NBC 20 °C White
Mackerel A15 NBC-R 20 °C ME 20 °C Fungus - dark green
Guano A16 NBC-R 20 °C ME 20 °C
Fungus - green, probably
Penicilium/Aspergillus
Guano A17 NBC-R 20 °C ME 20 °C Fungus - brownish
Guano A18 --- 20 °C ME 20 °C Brown
Guano A19 --- 20 °C ME 20 °C Light green
29
Sample
Isolate
nr Medium 1 Temp Medium 2 Temp Description
Guano A20 --- 20 °C ME 20 °C Grey
Guano A21 --- 20 °C ME 20 °C white
Guano A22 NBC 20 °C NBC 20 °C Grey
Guano A23 NBC 20 °C NBC 20 °C White
Guano A24 NBC 20 °C NBC 20 °C ---
Guano A25 NBC 20 °C NBC 20 °C ---
guano A26 NBC-Sp 20 °C NBC-Sp 20 °C White, fluffy
Guano A27 NBC-Sp 20 °C NBC-Sp 20 °C Grey, flowery shaped
Guano A28 NBC-Sp 20 °C NBC-Sp 20 °C White
Guano A29 NBC-L 20 °C NBC-L 20 °C White-brown
Guano A30 NBC-L 20 °C NBC-L 20 °C Grey, topped
Guano A31 NBC-L 20 °C NBC-L 20 °C Grey, flowery shaped
Guano A32 NBC-St 20 °C NBC-St 20 °C White
Guano A33 NBC-St 20 °C NBC-St 20 °C White-brown
Guano A34 NBC-E 20 °C NBC-E 20 °C Grey, topped
Guano A35 NBC-E 20 °C NBC-E 20 °C Grey, flowery shape
Guano A36 NBC-E 20 °C NBC-E 20 °C Grey, topped
Guano A37 NBC-E 20 °C NBC-E 20 °C White
Guano A38 NBC-E 20 °C NBC-E 20 °C Grey
Guano A39 NBC-E 20 °C NBC-E 20 °C Dark grey
Guano A40 IM7 20 °C IM7 20 °C Pink
Guano A41 NBC 20 °C NBC 20 °C Grey
Guano A42 NBC 20 °C NBC 20 °C Grey
Guano A43 NBC 20 °C NBC 20 °C White
Guano A44 NBC-SW-E 20 °C NBC-SW-E 20 °C Grey
Guano A45 NBC-SW-E 20 °C NBC-SW-E 20 °C Grey
Guano A46 NBC-SW-E 20 °C NBC-SW-E 20 °C Grey
Guano A47 NBC-SW-E 20 °C NBC-SW-E 20 °C White
Guano A48 NBC-SW-E 20 °C NBC-SW-E 20 °C White, topped
30
Sample
Isolate
nr Medium 1 Temp Medium 2 Temp Description
Guano A49 NBC-SW-E 20 °C NBC-SW-E 20 °C White
Guano A50 NBC-SW-E 20 °C NBC-SW-E 20 °C Grey
Guano A51 NBC-SW 20 °C NBC-SW 20 °C Pink-white with grey circles
Guano A52 NBC-SW 20 °C NBC-SW 20 °C Pink-white in circles
Guano A53 NBC-SW 20 °C NBC-SW 20 °C Yellow grey in circles
Guano A54 NBC-SW 20 °C NBC-SW 20 °C Pink-white in circles
Guano A55 NBC-SW 20 °C NBC-SW 20 °C Yellow-white
Guano A60 NBC-Sp 20 °C NBC-Sp 20 °C White
Guano A61 NBC 20 °C NBC 20 °C White
Guano A62 NBC 20 °C NBC 20 °C White, small
Guano A63 NBC-SW-L 20 °C NBC-SW-L 20 °C White with red middle
Guano A64 NBC-SW-L 20 °C NBC-SW-L 20 °C White with red middle
Guano A65 NBC-SW-L 20 °C NBC-SW-L 20 °C Red
Guano A66 NBC-SW-L 20 °C NBC-SW-L 20 °C Yellow with red middle
Guano A67 NBC-SW-L 20 °C NBC-SW-L 20 °C With a yellow circle
Guano A68 NBC-SW-L 20 °C NBC-SW-L 20 °C White
Guano A69 NBC-SW-L 20 °C NBC-SW-L 20 °C White
Guano A70 NBC-SW-L 20 °C NBC-SW-L 20 °C Yellow
Guano A71 NBC-SW-L 20 °C NBC-SW-L 20 °C Yellow-white
Guano A72 NBC-SW-L 20 °C NBC-SW-L 20 °C Yellow
Guano A73 NBC-SW-L 20 °C NBC-SW-L 20 °C Red
Guano A74 NBC-SW-L 20 °C NBC-SW-L 20 °C White with a red middle
Guano A75 NBC-SW-L 20 °C NBC-SW-L 20 °C White
Guano A76 NBC-R 20 °C NBC-R 20 °C Brown
Guano A77 NBC-E 20 °C NBC-E 20 °C Grey
Guano A78 NBC-SW-E 20 °C NBC-SW-E 20 °C Yellow
Guano A79 NBC-SW-E 20 °C NBC-SW-E 20 °C Yellow
Guano A80 NBC-SW-E 20 °C NBC-SW-E 20 °C Brown
Guano A81 NBC-SW-E 20 °C NBC-SW-E 20 °C White
31
Sample
Isolate
nr Medium 1 Temp Medium 2 Temp Description
Guano A82 NBC-SW-E 20 °C NBC-SW-E 20 °C White
Guano A83
NBC-SW-
Sp 20 °C VPA-Sp 20 °C Red
Guano A84
NBC-SW-
Sp 20 °C VPA-Sp 20 °C Grey
Guano A85 NBC-SW-St 20 °C VPA-St 20 °C ---
Guano A86 NBC-SW-St 20 °C VPA-St 20 °C ---
Celandine root B42 NBC-L 20 °C NBC-L 20 °C Yellow, topped
Celandine root B43 NBC-E 20 °C NBC-E 20 °C White-brown, topped
Celandine root B112 NBC 20 °C NBC 20 °C Grey
Celandine root B114 NBC-L 20 °C NBC-L 20 °C Yellow-brown, small
Celandine root B115 NBC-L 20 °C NBC-L 20 °C Orange-Yellow, large
Celandine root B116 NBC-L 20 °C NBC-L 20 °C
Orange-brown, large and
watery
Celandine root B117 NBC-L 20 °C NBC-L 20 °C Yellow
Celandine root B118 NBC-L 20 °C NBC-L 20 °C
Transparent, inhibiting another
bacteria
Celandine root B119 NBC-L 20 °C NBC-L 20 °C
White with a yellow and
irregular edge
Celandine root B125 NBC-Sp 20 °C NBC-Sp 20 °C Yellow-white
Celandine root B126 NBC-Sp 20 °C NBC-Sp 20 °C White
Celandine root B130 NBC-St 20 °C NBC-St 20 °C Orange
Celandine root B132 NBC-E 20 °C NBC-E 20 °C Beige, watery
Celandine root B136
NBC-SW-
Sp 20 °C
NBC-SW-
Sp 20 °C Hyphae
Celandine root B138 NBC-SW 20 °C NBC-SW 20 °C Yellow with a brown middle
Celandine root B147 NBC-SW-St 20 °C NBC-SW-St 20 °C White with circles
Macroalgea B32 NBC-SW 20 °C NBC-SW 20 °C Yellow
Macroalgea B33 NBC-Sp 20 °C NBC-Sp 20 °C Pink
Macroalgea B34 NBC-Sp 20 °C NBC-Sp 20 °C Pink
32
Sample
Isolate
nr Medium 1 Temp Medium 2 Temp Description
Macroalgea B35 NBC-Sp 20 °C NBC-Sp 20 °C Yellow
Macroalgea B36 NBC-Sp 20 °C NBC-Sp 20 °C White
Macroalgea B37 NBC-SW-R 20 °C NBC-SW-R 20 °C Small
Macroalgea B38 NBC-SW-St 20 °C NBC-SW-St 20 °C Yellow
Macroalgea B39 NBC-SW-St 20 °C NBC-SW-St 20 °C white
Macroalgea B40 NBC-St 20 °C NBC-St 20 °C Ping-yellow
Macroalgea B41 NBC-St 20 °C NBC-St 20 °C Yellow
Blue mussel B21 NBC 20 °C NBC 20 °C Whitish
Blue mussel B22 NBC-E 20 °C NBC-E 20 °C Whitish, large
Blue mussel B23 NBC-SW 20 °C NBC-SW 20 °C Yellow-white, irregular edge
Blue mussel B24 NBC-SW 20 °C NBC-SW 20 °C Small
Blue mussel B25 NBC-Sp 20 °C NBC-Sp 20 °C White
Blue mussel B26 NBC-Sp 20 °C NBC-Sp 20 °C Grey-white
Blue mussel B27 NBC-Sp 20 °C NBC-Sp 20 °C Yellow-orange
Blue mussel B28 NBC-Sp 20 °C NBC-Sp 20 °C Light Yellow
Blue mussel B29 NBC-Sp 20 °C NBC-Sp 20 °C White
Blue mussel B30 NBC-Sp 20 °C NBC-Sp 20 °C Orange
Blue mussel B31 NBC-E 20 °C NBC-E 20 °C White, topped
Blue mussel B120 NBC-L 20 °C NBC-L 20 °C Yellow-transparent, large
Blue mussel B121 NBC-L 20 °C NBC-L 20 °C Beige, small
Blue mussel B133 NBC-E 20 °C NBC-E 20 °C Brown-beige, large
Blue mussel B139 NBC-SW 20 °C NBC-SW 20 °C Brown with a yellow middle
Blue mussel B140 NBC-SW 20 °C NBC-SW 20 °C Red with a grey middle
Blue mussel B150 NBC-SW-L 20 °C NBC-SW-L 20 °C yellow white, small
Blue mussel B151 NBC-SW-L 20 °C NBC-SW-L 20 °C White
Celandine leaves B1 NBC-R 20 °C NBC-R 20 °C Beige
Celandine leaves B2 NBC-Sp 20 °C NBC-Sp 20 °C White with a beige middle
Celandine leaves B3 NBC-Sp 20 °C NBC-Sp 20 °C White with a beige middle
Celandine leaves B4 NBC-Sp 20 °C NBC-Sp 20 °C White with a beige middle
33
Sample
Isolate
nr Medium 1 Temp Medium 2 Temp Description
Celandine leaves B5 NBC-Sp 20 °C NBC-Sp 20 °C White with a beige middle
Celandine leaves B6 NBC-Sp 20 °C NBC-Sp 20 °C White-beige, small
Celandine leaves B7 NBC-E 20 °C NBC-E 20 °C
Beige-brown, mucous
consistent
Celandine leaves B8 NBC-St 20 °C NBC-St 20 °C Beige, small
Celandine leaves B9 NBC-St 20 °C NBC-St 20 °C Yellow
Celandine leaves B10 NBC-St 20 °C NBC-St 20 °C Orange
Celandine leaves B11 NBC-St 20 °C NBC-St 20 °C Beige, large
Celandine leaves B12 NBC-St 20 °C NBC-St 20 °C Orange
Celandine leaves B13 NBC-St 20 °C NBC-St 20 °C Yellow
Celandine leaves B14 NBC-L 20 °C NBC-L 20 °C Yellow
Celandine leaves B15 NBC-L 20 °C NBC-L 20 °C Whitish, big
Celandine leaves B16 NBC-L 20 °C NBC-L 20 °C Beige, small, mucous consistent
Celandine leaves B17 NBC 20 °C NBC 20 °C Whitish, irregular edges
Celandine leaves B18 NBC 20 °C NBC 20 °C Whitish, round
Celandine leaves B19 NBC 20 °C NBC 20 °C Whitish, large
Celandine leaves B20 NBC 20 °C NBC 20 °C Whitish, small
Celandine leaves B129 NBC-St 20 °C NBC-St 20 °C Yellow-white, topped
Lichen B44 NBC-St 20 °C NBC-St 20 °C Yellow
Lichen B45 NBC-St 20 °C NBC-St 20 °C
Yellowish with a white dot in
the middle, topped
Lichen B46 NBC-St 20 °C NBC-St 20 °C
Yellowish with a white dot in
the middle, topped
Lichen B47 NBC-St 20 °C NBC-St 20 °C
Yellowish with a white dot in
the middle, topped
Lichen B48 NBC-St 20 °C NBC-St 20 °C White
Lichen B49 NBC-St 20 °C NBC-St 20 °C
Yellowish with a white dot in
the middle, topped
Lichen B50 NBC-St 20 °C NBC-St 20 °C
Yellowish with a white dot in
the middle, topped
34
Sample
Isolate
nr Medium 1 Temp Medium 2 Temp Description
Lichen B51 NBC-St 20 °C NBC-St 20 °C Yellow
Lichen B52 NBC-St 20 °C NBC-St 20 °C Yellow-white
Lichen B53 NBC-Sp 20 °C NBC-Sp 20 °C White, topped
Lichen B54 NBC-Sp 20 °C NBC-Sp 20 °C White in circles
Lichen B55 NBC-Sp 20 °C NBC-Sp 20 °C White, topped
Lichen B56 NBC-Sp 20 °C NBC-Sp 20 °C White, topped
Lichen B57 NBC-Sp 20 °C NBC-Sp 20 °C White, topped
Lichen B58 NBC-Sp 20 °C NBC-Sp 20 °C White-beige in circles
Lichen B59 NBC-Sp 20 °C NBC-Sp 20 °C White-beige in circles
Lichen B127 NBC-Sp 20 °C NBC-Sp 20 °C Yellow-white
Lichen B128 NBC-Sp 20 °C NBC-Sp 20 °C Beige, watery
Lichen B131 NBC-E 20 °C NBC-E 20 °C Beige, watery
Lichen B135
NBC-SW-
Sp 20 °C
NBC-SW-
Sp 20 °C White
Lichen B145 NBC-SW-E 20 °C NBC-SW-E 20 °C Beige-brown, irregular edge
Lichen B152 NBC-SW-L 20 °C NBC-SW-L 20 °C Brown
Lichen B153 NBC-SW-St 20 °C NBC-SW-St 20 °C ---
Lichen B154 NBC-SW-St 20 °C NBC-SW-St 20 °C ---
Guano B60 NBC-SW 20 °C NBC-SW 20 °C White-pink in circles
Guano B61 NBC-SW 20 °C NBC-SW 20 °C Yellow-white in circles
Guano B62 NBC-SW 20 °C NBC-SW 20 °C Red with a white middle
Guano B63 NBC-SW-L 20 °C NBC-SW-L 20 °C Beige in circles
Guano B64 NBC-SW-L 20 °C NBC-SW-L 20 °C Beige in circles
Guano B65 NBC-SW-L 20 °C NBC-SW-L 20 °C Yellow-brown in circles
Guano B66 NBC-SW-L 20 °C NBC-SW-L 20 °C Yellow in circles
Guano B67
NBC-SW-
Sp 20 °C
NBC-SW-
Sp 20 °C Yellow-brown
Guano B68 NBC-SW-E 20 °C NBC-SW-E 20 °C Beige-white, topped
Guano B69 NBC-SW-E 20 °C NBC-SW-E 20 °C Beige-white in circles
Guano B70 NBC-SW-E 20 °C NBC-SW-E 20 °C Yellow-white in circles
35
Sample
Isolate
nr Medium 1 Temp Medium 2 Temp Description
Guano B71 NBC-SW-E 20 °C NBC-SW-E 20 °C Beige-white in circles
Guano B72 NBC-SW-E 20 °C NBC-SW-E 20 °C Beige-white in circles
Guano B73 NBC-SW-E 20 °C NBC-SW-E 20 °C White-beige, irregular circles
Guano B74 NBC-SW-E 20 °C NBC-SW-E 20 °C white
Guano B75 NBC 20 °C NBC 20 °C Grey
Guano B76 NBC 20 °C NBC 20 °C Grey-white
Guano B78 NBC 20 °C NBC 20 °C Grey-white
Guano B79 NBC 20 °C NBC 20 °C Grey-white
Guano B80 NBC 20 °C NBC 20 °C Brown in circles
Guano B81 NBC-Sp 20 °C NBC-Sp 20 °C Yellow-white
Guano B82 NBC-Sp 20 °C NBC-Sp 20 °C White, topped
Guano B83 NBC-Sp 20 °C NBC-Sp 20 °C White, topped
Guano B84 NBC-Sp 20 °C NBC-Sp 20 °C Yellow-brown in circles
Guano B85 NBC-Sp 20 °C NBC-Sp 20 °C Yellow-brown in circles
Guano B86 NBC-Sp 20 °C NBC-Sp 20 °C White, topped
Guano B87 NBC-Sp 20 °C NBC-Sp 20 °C White, topped
Guano B88 NBC-R 20 °C NBC-R 20 °C White
Guano B89 NBC-R 20 °C NBC-R 20 °C Brown-white
Guano B90 NBC-R 20 °C NBC-R 20 °C Grey-white
Guano B91 NBC-R 20 °C NBC-R 20 °C Brown
Guano B92 NBC-St 20 °C NBC-St 20 °C Yellow-beige
Guano B93 NBC-St 20 °C NBC-St 20 °C Yellow-beige
Guano B94 NBC-St 20 °C NBC-St 20 °C Yellow-beige
Guano B95 NBC-E 20 °C NBC-E 20 °C Grey
Guano B96 NBC-E 20 °C NBC-E 20 °C Grey-white
Guano B97 NBC-E 20 °C NBC-E 20 °C Yellow-white
Guano B98 NBC-E 20 °C NBC-E 20 °C Brown-white
Guano B99 NBC-E 20 °C NBC-E 20 °C Brown-white
Guano B100 NBC-E 20 °C NBC-E 20 °C ---
36
Sample
Isolate
nr Medium 1 Temp Medium 2 Temp Description
Guano B101 NBC-E 20 °C NBC-E 20 °C Yellow-brown
Guano B102 NBC-E 20 °C NBC-E 20 °C Brown-beige
Guano B103 NBC-E 20 °C NBC-E 20 °C Brown-beige
Guano B104 NBC-E 20 °C NBC-E 20 °C White, topped
Guano B105 NBC-L 20 °C NBC-L 20 °C Yellow with a brown middle
Guano B106 NBC-L 20 °C NBC-L 20 °C Beige
Guano B107 NBC-L 20 °C NBC-L 20 °C Yellow-beige
Guano B108 NBC-L 20 °C NBC-L 20 °C Brown-beige
Guano B109 NBC-L 20 °C NBC-L 20 °C Grey-brown, topped
Guano B110 NBC-L 20 °C NBC-L 20 °C Yellow with a brown middle
Guano B111 NBC-R 20 °C NBC-R 20 °C Beige-white in circles
Guano B113 NBC 20 °C NBC 20 °C Beige
Guano B122 NBC-L 20 °C NBC-L 20 °C Grey
Guano B123 NBC-L 20 °C NBC-L 20 °C Grey
Guano B124 NBC-Sp 20 °C NBC-Sp 20 °C Beige
Guano B134 NBC-E 20 °C NBC-E 20 °C Yellow
Guano B137
NBC-SW-
Sp 20 °C
NBC-SW-
Sp 20 °C Beige with irregular edge
Guano B141 NBC-SW 20 °C NBC-SW 20 °C Yellow with a brown middle
Guano B142 NBC-SW 20 °C NBC-SW 20 °C Yellow with a brown middle
Guano B143 NBC-SW 20 °C NBC-SW 20 °C White irregular edge, watery
Guano B144 NBC-SW-E 20 °C NBC-SW-E 20 °C Beige-brown
Guano B146 NBC-SW-St 20 °C NBC-SW-St 20 °C Pink-red-yellow
Guano B148 NBC-SW-L 20 °C NBC-SW-L 20 °C Beige, irregular edge
Guano B149 NBC-SW-L 20 °C NBC-SW-L 20 °C Yellow-white, large
37
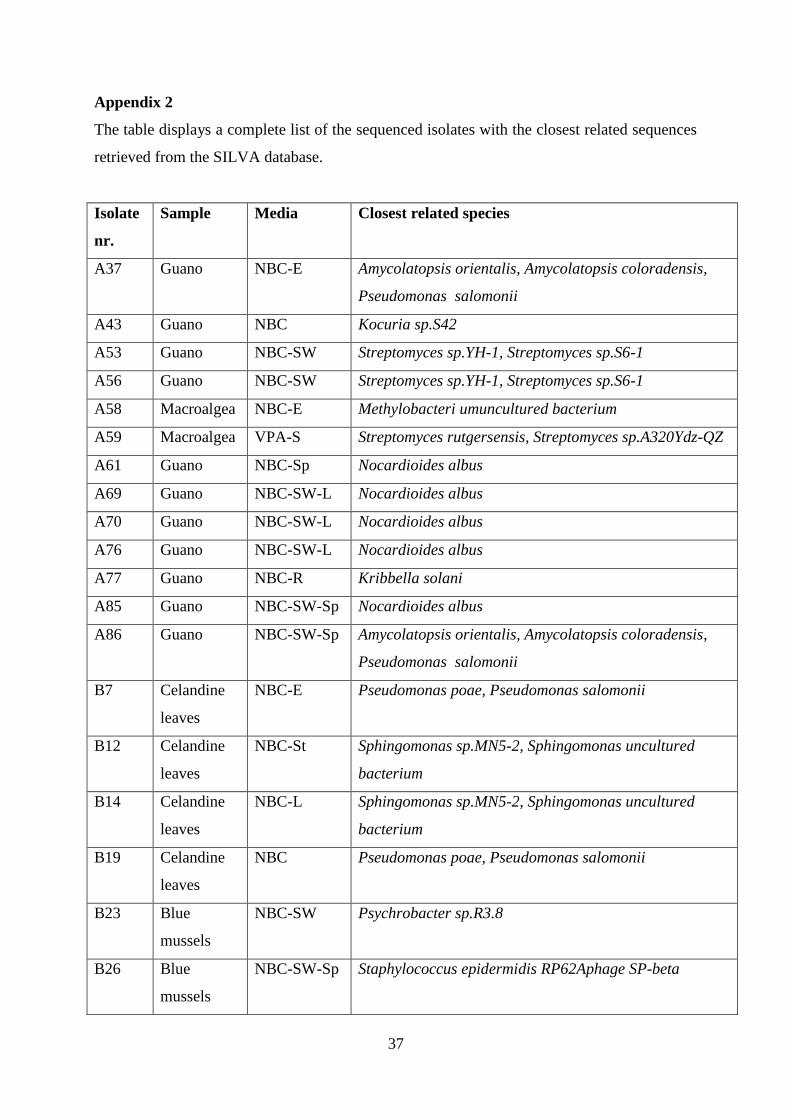
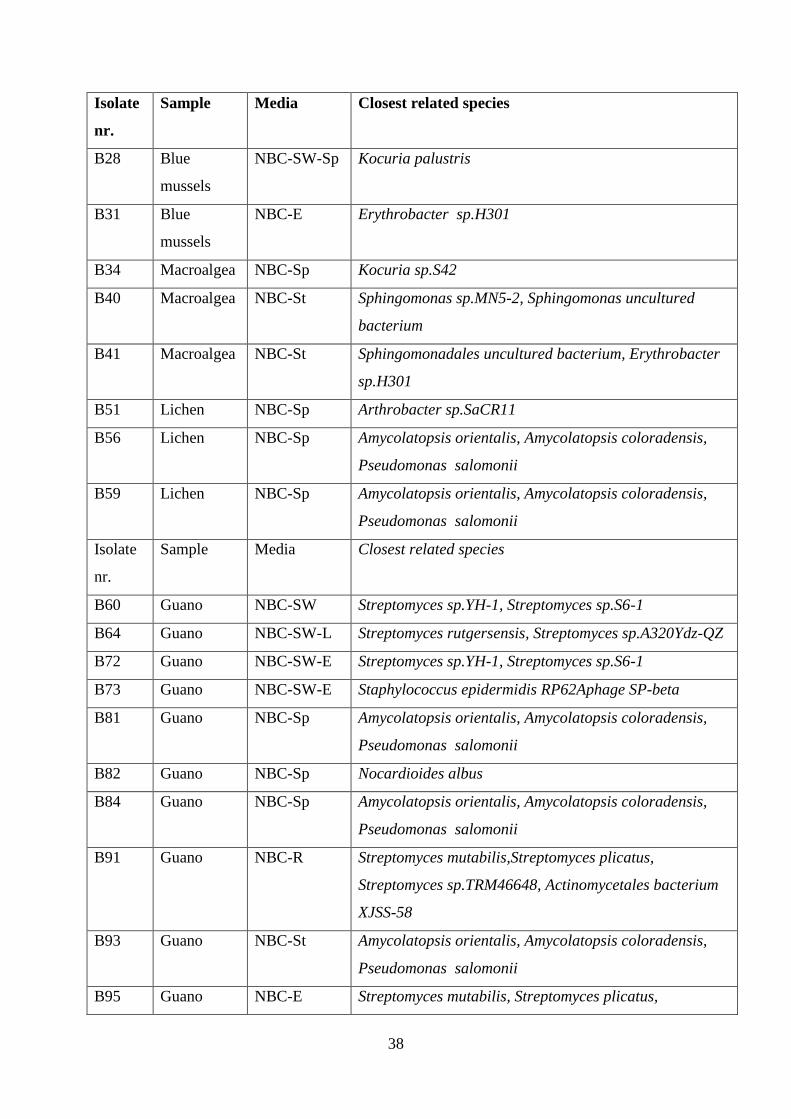
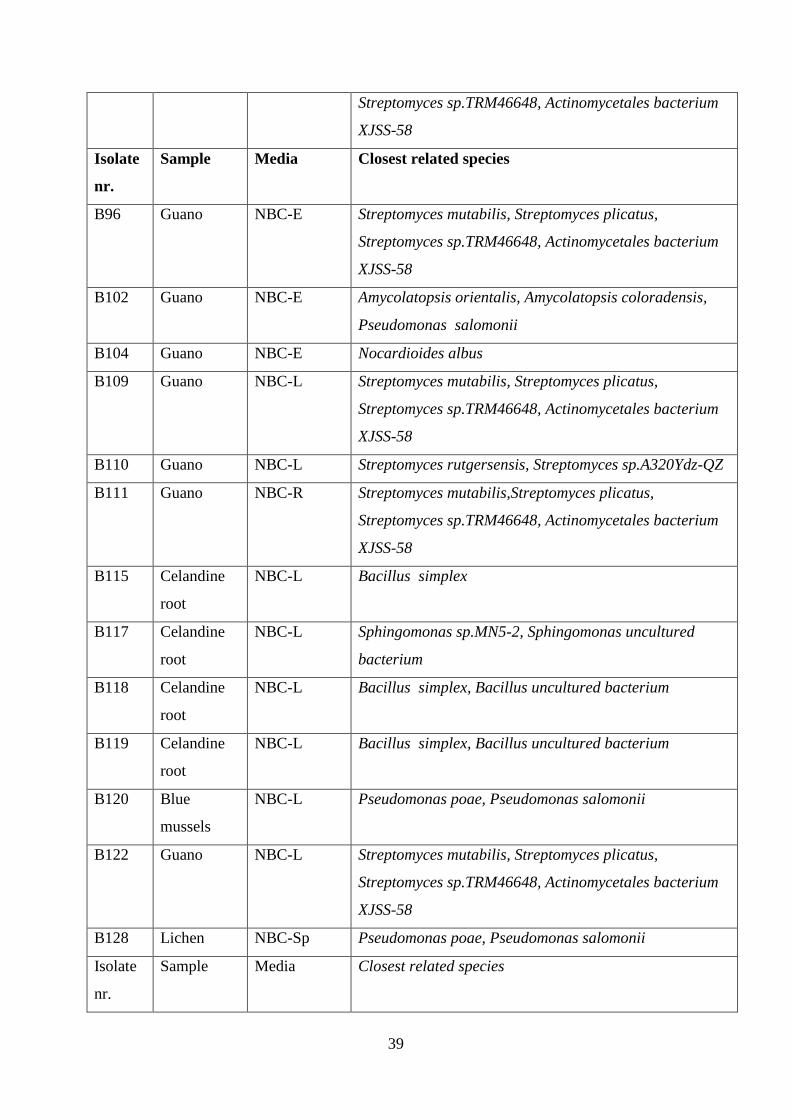
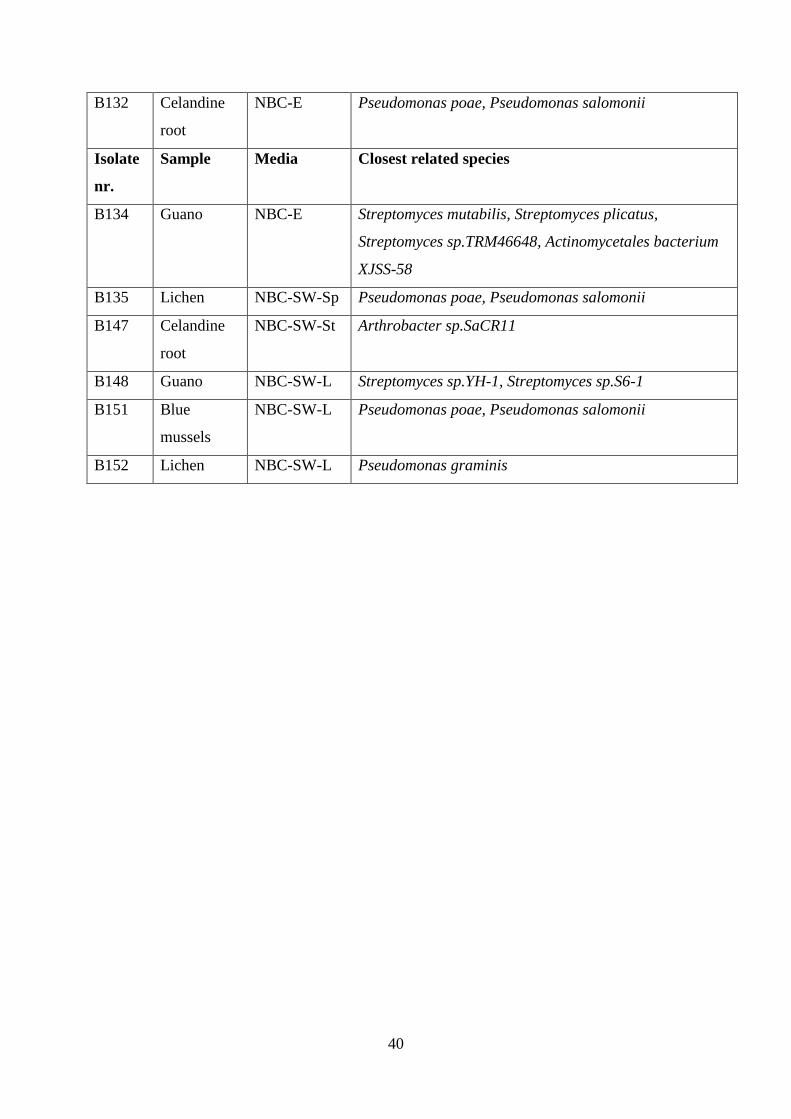
Appendix 2
The table displays a complete list of the sequenced isolates with the closest related sequences
retrieved from the SILVA database.
Isolate
nr.
Sample Media Closest related species
A37 Guano NBC-E Amycolatopsis orientalis, Amycolatopsis coloradensis,
Pseudomonas salomonii
A43 Guano NBC Kocuria sp.S42
A53 Guano NBC-SW Streptomyces sp.YH-1, Streptomyces sp.S6-1
A56 Guano NBC-SW Streptomyces sp.YH-1, Streptomyces sp.S6-1
A58 Macroalgea NBC-E Methylobacteri umuncultured bacterium
A59 Macroalgea VPA-S Streptomyces rutgersensis, Streptomyces sp.A320Ydz-QZ
A61 Guano NBC-Sp Nocardioides albus
A69 Guano NBC-SW-L Nocardioides albus
A70 Guano NBC-SW-L Nocardioides albus
A76 Guano NBC-SW-L Nocardioides albus
A77 Guano NBC-R Kribbella solani
A85 Guano NBC-SW-Sp Nocardioides albus
A86 Guano NBC-SW-Sp Amycolatopsis orientalis, Amycolatopsis coloradensis,
Pseudomonas salomonii
B7 Celandine
leaves
NBC-E Pseudomonas poae, Pseudomonas salomonii
B12 Celandine
leaves
NBC-St Sphingomonas sp.MN5-2, Sphingomonas uncultured
bacterium
B14 Celandine
leaves
NBC-L Sphingomonas sp.MN5-2, Sphingomonas uncultured
bacterium
B19 Celandine
leaves
NBC Pseudomonas poae, Pseudomonas salomonii
B23 Blue
mussels
NBC-SW Psychrobacter sp.R3.8
B26 Blue
mussels
NBC-SW-Sp Staphylococcus epidermidis RP62Aphage SP-beta
38
Isolate
nr.
Sample Media Closest related species
B28 Blue
mussels
NBC-SW-Sp Kocuria palustris
B31 Blue
mussels
NBC-E Erythrobacter sp.H301
B34 Macroalgea NBC-Sp Kocuria sp.S42
B40 Macroalgea NBC-St Sphingomonas sp.MN5-2, Sphingomonas uncultured
bacterium
B41 Macroalgea NBC-St Sphingomonadales uncultured bacterium, Erythrobacter
sp.H301
B51 Lichen NBC-Sp Arthrobacter sp.SaCR11
B56 Lichen NBC-Sp Amycolatopsis orientalis, Amycolatopsis coloradensis,
Pseudomonas salomonii
B59 Lichen NBC-Sp Amycolatopsis orientalis, Amycolatopsis coloradensis,
Pseudomonas salomonii
Isolate
nr.
Sample Media Closest related species
B60 Guano NBC-SW Streptomyces sp.YH-1, Streptomyces sp.S6-1
B64 Guano NBC-SW-L Streptomyces rutgersensis, Streptomyces sp.A320Ydz-QZ
B72 Guano NBC-SW-E Streptomyces sp.YH-1, Streptomyces sp.S6-1
B73 Guano NBC-SW-E Staphylococcus epidermidis RP62Aphage SP-beta
B81 Guano NBC-Sp Amycolatopsis orientalis, Amycolatopsis coloradensis,
Pseudomonas salomonii
B82 Guano NBC-Sp Nocardioides albus
B84 Guano NBC-Sp Amycolatopsis orientalis, Amycolatopsis coloradensis,
Pseudomonas salomonii
B91 Guano NBC-R Streptomyces mutabilis,Streptomyces plicatus,
Streptomyces sp.TRM46648, Actinomycetales bacterium
XJSS-58
B93 Guano NBC-St Amycolatopsis orientalis, Amycolatopsis coloradensis,
Pseudomonas salomonii
B95 Guano NBC-E Streptomyces mutabilis, Streptomyces plicatus,
39
Streptomyces sp.TRM46648, Actinomycetales bacterium
XJSS-58
Isolate
nr.
Sample Media Closest related species
B96 Guano NBC-E Streptomyces mutabilis, Streptomyces plicatus,
Streptomyces sp.TRM46648, Actinomycetales bacterium
XJSS-58
B102 Guano NBC-E Amycolatopsis orientalis, Amycolatopsis coloradensis,
Pseudomonas salomonii
B104 Guano NBC-E Nocardioides albus
B109 Guano NBC-L Streptomyces mutabilis, Streptomyces plicatus,
Streptomyces sp.TRM46648, Actinomycetales bacterium
XJSS-58
B110 Guano NBC-L Streptomyces rutgersensis, Streptomyces sp.A320Ydz-QZ
B111 Guano NBC-R Streptomyces mutabilis,Streptomyces plicatus,
Streptomyces sp.TRM46648, Actinomycetales bacterium
XJSS-58
B115 Celandine
root
NBC-L Bacillus simplex
B117 Celandine
root
NBC-L Sphingomonas sp.MN5-2, Sphingomonas uncultured
bacterium
B118 Celandine
root
NBC-L Bacillus simplex, Bacillus uncultured bacterium
B119 Celandine
root
NBC-L Bacillus simplex, Bacillus uncultured bacterium
B120 Blue
mussels
NBC-L Pseudomonas poae, Pseudomonas salomonii
B122 Guano NBC-L Streptomyces mutabilis, Streptomyces plicatus,
Streptomyces sp.TRM46648, Actinomycetales bacterium
XJSS-58
B128 Lichen NBC-Sp Pseudomonas poae, Pseudomonas salomonii
Isolate
nr.
Sample Media Closest related species
40
B132 Celandine
root
NBC-E Pseudomonas poae, Pseudomonas salomonii
Isolate
nr.
Sample Media Closest related species
B134 Guano NBC-E Streptomyces mutabilis, Streptomyces plicatus,
Streptomyces sp.TRM46648, Actinomycetales bacterium
XJSS-58
B135 Lichen NBC-SW-Sp Pseudomonas poae, Pseudomonas salomonii
B147 Celandine
root
NBC-SW-St Arthrobacter sp.SaCR11
B148 Guano NBC-SW-L Streptomyces sp.YH-1, Streptomyces sp.S6-1
B151 Blue
mussels
NBC-SW-L Pseudomonas poae, Pseudomonas salomonii
B152 Lichen NBC-SW-L Pseudomonas graminis