Embed Size (px)
Citation preview
ISOLATION AND CHARACTERIZATION OF THE
CYTOTOXIC COMPONENTS OF A FIJIAN SPONGE,
HIPPOSPONGIA SP.
By
Rohitesh R KUMAR
A thesis submitted in fulfillment of the requirements for the degree of
Master of Science in
Chemistry
Copyright © 2010 by Rohitesh Kumar
School of Biological and Chemical Sciences
Faculty of Science, Technology and Environment
The University of the South Pacific
June, 2010.
i
Declaration of Originality
Statement by Author

ii
Dedication
To my lovely parents and all my great teachers
iii
Acknowledgment
I extend my sincere gratitude to all those who have made this project a success but a
mere “Thank you” in acknowledgment is not enough to show my appreciation of
their support. Firstly and foremost I would like to thank my supervisor, Prof. William
Aalbersberg, the Director of Institute of Applied Sciences (IAS), USP for his kind
guidance and advice throughout this project. It was a great honor and learning
experience to work under your supervision and to be part of the Natural Products
team at IAS. Specials thanks are due to Institute of Applied Sciences and to the
Faculty of Science, Technology and Environment, USP for funding this research.
Many thanks to Prof. Jaspers Marcel and Dr Joiji Tabudravu of University of
Aberdeen, in Scotland for running NMR and LC-MS experiments for my samples,
for discussing the data with me and for their assistance. Thanks a lot.
I am grateful to Mr. Klaus Feussner, the Acting Project Manager of our team for
assisting me in choosing a sample to work on and for guiding me not only in the lab
but also during the diving trips to collect more samples. Furthermore, I would like to
thank Mr. Mukesh Kant Sharma for being a great mentor and for his support. Many
thanks are owed to the fellow colleagues for those group discussions that we had in
the lab and also for their support and ideas.
A big “Vinaka vakalevu” to the technical staff of the Natural Product Unit for their
hard work in extracting, doing bioassays and setting up experiments. I would also
like to thank the technicians of the Chemistry Department for their assistance in
using some of the instruments.
Special thanks are also due to my aunty and her family for providing me with
accommodation, hot meals and taking good care of me.
Above all, I am grateful to have such loving, caring and understanding parents who
had immense faith in me. Thank you Mum and Dad for your support financially and
emotionally through this journey in search of knowledge.
iv
I thank the lord for giving me such strength, patience, wisdom and guidance to help
me to this extent.
Thank you lord!
v
ABSTRACT
A marine sponge of the genus Hippospongia, collected near Kia Island, off Labasa,
Vanua Levu, exhibited cytotoxic activity towards brine shrimps. In order to identify
the active principles, the crude extract of this sponge was subjected to a range of
purification steps guided by brine shrimp bioassay. The purification steps which
included solvent partitioning, Flash Column Chromatography (FCC) and High
Performance Liquid Chromatography (HPLC) lead to the isolation of three known
cytotoxic compounds: epi-ilimaquinone [102], smenospongine [106] and
glycinylilimaquinone [107]
Bioactive hexane and dichloromethane (DCM) extracts from solvent partitioning
were subjected to normal phase (NP)-FCC and the fraction eluted with 4:1 ethyl
acetate-hexane was further purified on reverse phase (RP)-HPLC with 80%
acetonitrile-water and lead to the isolation of the known compound 1, epi-
ilimaquinone. Another fraction obtained from NP-FCC of the DCM extract eluted
with 1:1 ethyl acetate-hexane was subjected to RP-HPLC with the mobile phase of
80% acetonitrile-water and 0.1% trifluoroacetic acid (TFA) and yielded the second
known compound, smenospongine. Compound 3 was isolated from the methanol
fraction from solvent partitioning. This fraction was subjected to reverse phase
vacuum liquid chromatography (RP-VLC) with methanol-water. The fraction eluted
with 80% methanol-water yielded the known cytotoxic compound 3, known as
glycinylilimaquinone, upon purification on RP-HPLC with 65% acetonitrile-water
and 0.1% TFA.
LC-MS and NMR data of the compounds isolated were used to elucidate the
structures. From the 1H NMR data of the three compounds it was apparent that these
compounds are related and are analogues belonging to the group of compounds
known as sesquiterpene quinones or amino quinones. All the compounds isolated
showed cytotoxic activity towards brine shrimps. Compound 1, epi-ilimaquinone
exhibited the most cytotoxicity at 18µg/ml, compound 2, smenospongine exhibited
moderate cytotoxicity of 188µg/ml while compound 3, glycinylilimaquinone was the
least active with the cytotoxic activity of greater than 500µg/ml.
vi
ABBREVIATION
% percentage
µ micron
µg microgram 13C NMR Carbon Nuclear Magnetic Resonance 1H NMR Proton Nuclear Magnetic Resonance
AIDS Acquired Immunodeficiency Syndrome
BuOH Butanol
C Carbon
CD Circular dichroism
CD3OD Deuterated Methanol
CDCl3 Deuterated Chloroform
COSY Correlated Spectroscopy
dbe Double bond equivalence
DCM Dichloromethane
DMSO Dimethylsulfoxide
DNA Deoxyribonucleic acid
EMEA The European Medicines Agency
ESIMS Electron Spray Ionisation Mass Spectroscopy
EU European Union
FCC Flash Column Chromatography
FD Dichloromethane fraction
FDA Food and Drug Adminstration
FH Hexane fraction
FM Methanol fraction
FSW Filtered sea water
g Grams
H Hydrogen
H2O Water
HDAC Histone deacetylase
HIV Human immuno-deficiency virus
HMBC Hetronuclear Multiple Bond Correlation
vii
HMQC Hetronuclear Multiple Quantum Correlation
HPLC High Performance Liquid Chromatography
HSQC Hetronuclear Single Bond Correlation
Hz hertz
IAS Institute of Applied Sciences
IC50 Inhibitory concentration (IC) where 50% of a
population dies.
IR Infrared
J Coupling constant
LC-MS Liquid Chromatography-Mass Spectroscopy
LD50 Lethal dosage where 50% of a population dies.
m meter
m/z mass to charge ratio
MeCN Acetonitrile
MeOH Methanol
mg milligram
MHz Megahertz
min minute
ml milliliter
mM millimolar
mmu Molecular mass unit
MNP Marine Natural Product
Mult. Multiplicity.
NCI National Cancer Institute
NKT Natural killer T-cells lymphocytes
nm nanometer
NP Normal phase
PKC Protein kinase C
ppm parts per million
RBF round bottom flask
RDB equiv. Relative double bond equivalence
Rf Retention factor
Rho Rho-protein
viii
RP Reverse phase
Rt Retention time
sec second
sp. species
TFA Trifluoroacetic acid
TLC Thin Layer Chromatography
USA United Stated of America
USP The University of the South Pacific
UV Ultraviolet
VLC Vacuum Liquid Chromatography
WB Butanol fraction
α alpha
β beta
δ chemical shift (ppm)
λ wavelength
μl microlitre
ix
TABLE OF CONTENTS
ABSTRACT ............................................................................................................ v
ABBREVIATION .................................................................................................. vi
TABLE OF CONTENTS ........................................................................................... ix
LIST OF FIGURES .................................................................................................. xii
LIST OF TABLES ................................................................................................... xvi
CHAPTER 1 INTRODUCTION AND LITERATURE REVIEW ....................... 1
1.1 Introduction ....................................................................................................... 1
1.1.1 Natural products.......................................................................................... 1
1.1.2 Marine natural products .......................................................................... 3
1.1.3 Marine natural products derived drugs in clinical trials ......................... 4
1.1.4 Morphology of marine sponges ............................................................ 15
1.2 Aim and objectives .......................................................................................... 19
1.3 Literature Review ............................................................................................ 19
1.3.1 The order Dictyoceratida ...................................................................... 20
1.3.2 The family Spongiidae .......................................................................... 23
1.3.3 Chemistry of the Genus Hippospongia ................................................. 35
CHAPTER 2 METHODOLOGY ........................................................................ 43
2.1 General Procedure ........................................................................................... 43
2.2 Isolation of bioactive compounds .................................................................... 44
x
2.2.1 Collection and identification of the specimen ....................................... 44
2.2.2 Extraction, isolation and purification .................................................... 44
2.2.3 Extraction and solvent partitioning ....................................................... 44
2.2.4 Chromatography and purification ......................................................... 45
2.2.4.1 Isolation of Compound 1............................................................... 45
2.2.4.2 Isolation of Compound 2............................................................... 46
2.2.4.3 Isolation of Compound 3............................................................... 46
2.3 Bioassay ........................................................................................................... 48
2.3.1 Brine shrimp bioassay ........................................................................... 48
2.3.2 Hatching the eggs .................................................................................. 48
2.3.3 Preparation of samples .......................................................................... 48
2.3.4 Cytotoxicity assay ................................................................................. 49
CHAPTER 3 RESULTS AND DISCUSSION ................................................... 50
3.1 Isolation of cytotoxic compounds from Hippospongia sp. .............................. 50
3.2 Isolation and purification of cytotoxic compound 1 ........................................ 51
3.2.1 Purity check ........................................................................................... 54
3.2.2 UV and IR spectroscopic analysis ........................................................ 55
3.2.3 Crystallization of the compound ........................................................... 55
3.2.4 LC-MS and NMR data of compound 1 ................................................. 57
3.2.5 Structure elucidation of the compound 1 .............................................. 60
3.2.6 Verification of the stereochemistry ....................................................... 70
3.2.7 Some reported properties of epi-ilimaquinone ...................................... 81
3.3 Isolation of cytotoxic compound 2 .................................................................. 82
3.3.1 UV and IR spectroscopic analysis ........................................................ 84
xi
3.3.2 LC-MS and NMR data of compound 2 ................................................. 86
3.3.3 Structure elucidation of compound 2 .................................................... 93
3.3.4 Some reported properties of compound 2 ............................................. 98
3.4. Isolation of cytotoxic compound 3 ................................................................. 99
3.4.1 LC-MS data of compound 3 ................................................................ 101
3.4.2 Structure elucidation of compound 3 .................................................. 102
3.5 Sesquiterpene quinones and related compounds from sponge of the order Dictyoceratida .............................................................................................. 113
CHAPTER 4 CONCLUSION ........................................................................... 114
REFERENCES .................................................................................................... 116
APPENDIX ......................................................................................................... 124
Appendix 1....................................................................................................... 124
Appendix 2....................................................................................................... 130
Appendix 3....................................................................................................... 134
Appendix 4....................................................................................................... 139
xii
LIST OF FIGURES
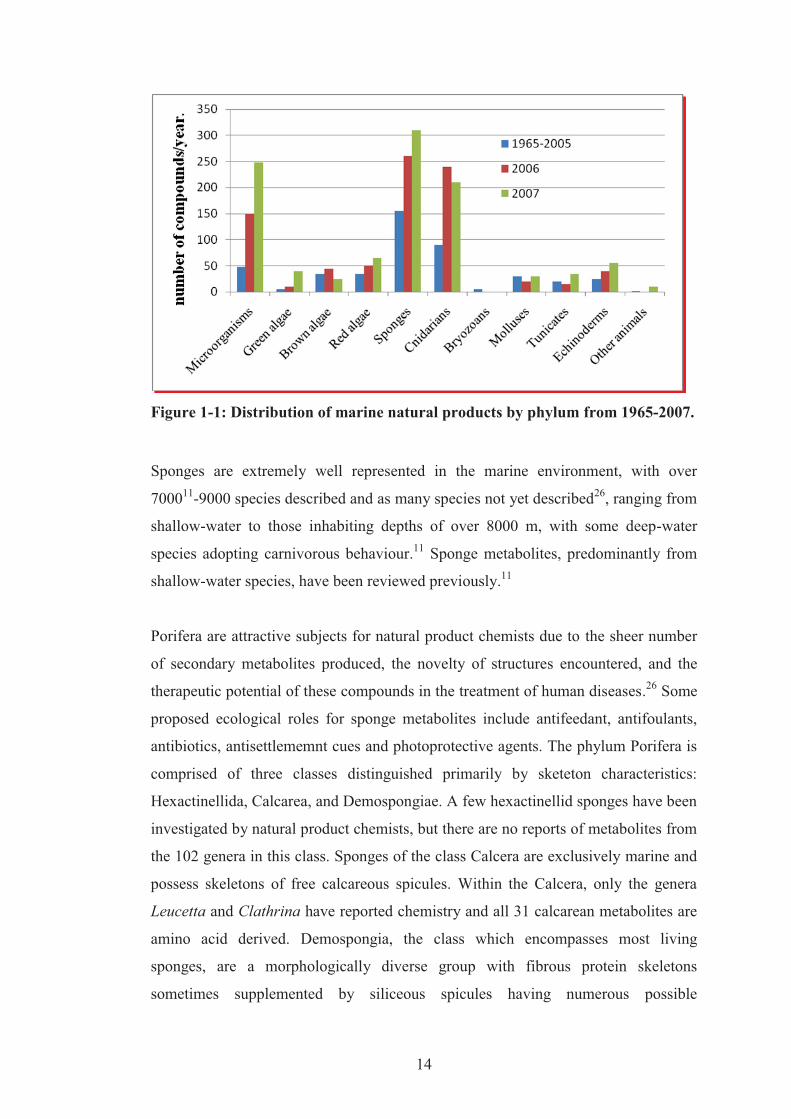
Figure 1-1: Distribution of marine natural products by phylum from 1965-2007. .... 14
Figure 1-2: Specialized cells of a sponge. .................................................................. 18
Figure 1-3: Taxonomic relationships within the order Dictyoceratida. ..................... 20
Figure 2-1: Isolation of secondary metabolite from the sponge. ............................... 47
Figure 3-1: NP-TLC profile of the fractions obtained from the FD fraction. ............ 52
Figure 3-2: NP-TLC (a) of the active component from FHF4H4 and FDF2H2
fraction. RP-TLC (b) of the compound isolated as yellow and violet liquid. ............ 52
Figure 3-3: Chromatogram of the active FJ05-097FDF2 fraction. ............................ 53
Figure 3-4: Chromatogram of the active HPLC fraction on a Refractive Index
Detector. ..................................................................................................................... 54
Figure 3-5: IR spectrum (KBr) of the active compound 1 ......................................... 56
Figure 3-6: Electron spray ionisation mass spectrum of compound 1. Inset: UV
profile of compound 1. ............................................................................................... 58
Figure 3-7: HMBC correlations of partial structure 1A. ............................................ 61
Figure 3-8: HMBC correlation of partial structure 1B............................................... 61
Figure 3-9: HMBC and COSY correlations of partial structure 1C. ......................... 62
Figure 3-10: All HMBC correlations of 1,4-benzoquinone chromophore. ................ 62
Figure 3-11: COSY correlation of partial structure 1D. ............................................ 65
Figure 3-12: HMBC correlations of partial structure 1E. .......................................... 65
Figure 3-13: Partial structure 1F showing COSY and HMBC correlations. ............. 66
Figure 3-14: Partial structure 1G showing COSY and HMBC correlations. ............. 66
Figure 3-15: Partial structure 1H showing COSY correlations. ................................ 67
Figure 3-16: Partial structure 1I showing HMBC correlation of the sesquiterpene
moiety. ........................................................................................................................ 68
Figure 3-17: Final structure of compound 1. ............................................................. 69
xiii
Figure 3-18: Absolute stereochemistry of epi-ilimaquinone. .................................... 71
Figure 3-19: Calculated mean δ 13C for four different 4,9-friedodrimene skeletons
found in sponges. ....................................................................................................... 72
Figure 3-20: Tautomerisation of epi-ilimaquinone and ilimaquinone. ...................... 73
Figure 3-21: 1H NMR (400MHz) spectrum of compound 1 (CDCl3). ...................... 74
Figure 3-22: 13C NMR spectrum of compound 1 (CDCl3). ....................................... 75
Figure 3-23: 1H-1H COSY spectrum of compound 1 (CDCl3). ................................. 76
Figure 3-24: HMQC spectrum of compound 1 (CDCl3). ........................................... 77
Figure 3-25: HMBC spectrum of compound 1 (CDCl3). ........................................... 78
Figure 3-26: Comparison of the 1H NMR of the two epimers. ................................. 79
Figure 3-27: NP-TLC profile of epi-ilimaquinone. ................................................... 79
Figure 3-28: HPLC chromatogram of the bioactive FJ05-097FDF4 fraction. .......... 83
Figure 3-29: RP-TLC of fraction FJ05-097FDF4H6. ................................................ 84
Figure 3-30: IR spectrum (KBr) of compound 2. Inset: UV profile of compound 2. 85
Figure 3-31: ESI-LCMS of compound 2. .................................................................. 86
Figure 3-32: 1H NMR (400MHz) of compound 2 (CD3OD). .................................... 89
Figure 3-33: 1H-1H COSY of compound 2 (CD3OD). ............................................... 90
Figure 3-34: HSQC spectrum of compound 2 (CD3OD). .......................................... 91
Figure 3-35: HMBC spectrum of compound 2 (CD3OD). ......................................... 92
Figure 3-36: HMBC correlations of partial structure 2A. .......................................... 93
Figure 3-37: HMBC correlations of partial structure 2B. .......................................... 94
Figure 3-38: HMBC correlations of compound 2. ..................................................... 95
Figure 3-39: Structure of compound 2, smenospongine. ........................................... 95
Figure 3-40: Final structure of compound 2, [106] smenospongine. ......................... 98
Figure 3-41: HPLC chromatogram of the bioactive FJ05-097FMF2 fraction. ........ 100
Figure 3-42: RP-TLC of fraction FJ05-097FMF2H7. ............................................. 100
xiv
Figure 3-43: ESI-LCMS of compound 3. Inset: UV profile of compound 3. .......... 101
Figure 3-44: HMBC correlations of partial structure 3A. ........................................ 102
Figure 3-45: 1H NMR of compound 3 (CD3OD). .................................................... 105
Figure 3-46: 13C NMR of compound 3 (CD3OD). ................................................... 106
Figure 3-47: 1H-1H COSY of compound 3 (CD3OD). ............................................. 107
Figure 3-48: HSQC spectrum of compound 3 (CD3OD). ........................................ 108
Figure 3-49: HMBC spectrum of compound 3 (CD3OD). ....................................... 109
Figure 3-50: HMBC correlations of partial structure 3B. ........................................ 110
Figure 3-51: Final structure of compound 3, [107] Glycinylilimaquinone. ............. 111
LIST OF FIGURES IN APPENDIX
Figure A 1: Expanded 1H NMR of compound 1. ..................................................... 124
Figure A 2: Expanded 1H NMR of compound 1. ..................................................... 124
Figure A 3: Expanded 13C NMR of compound 1. .................................................... 125
Figure A 4: Expanded 13C NMR of compound 1. .................................................... 125
Figure A 5: Expanded 1H-1H COSY of compound 1. .............................................. 126
Figure A 6: Expanded 1H-1H COSY of compound 1. .............................................. 126
Figure A 7: Expanded HMQC spectrum of compound 1. ....................................... 127
Figure A 8: Expanded HMQC spectrum of compound 1. ....................................... 127
Figure A 9: Expanded HMBC spectrum of compound 1. ........................................ 128
Figure A 10: Expanded HMBC spectrum of compound 1. ...................................... 128
Figure A 11: Expanded HMBC spectrum of compound 1. ...................................... 129
Figure A 12: Expanded 1H NMR of compound 2. ................................................... 130
Figure A 13: Expanded 1H NMR of compound 2. ................................................... 130
Figure A 14: Expanded 1H-1H COSY of compound 2. ............................................ 131
Figure A 15: Expanded 1H-1H COSY of compound 2. ............................................ 131
xv
Figure A 16: Expanded HSQC spectrum of compound 2. ....................................... 132
Figure A 17: Expanded HSQC spectrum of compound 2. ....................................... 132
Figure A 18: Expanded HMBC spectrum of compound 2. ...................................... 133
Figure A 19: Expanded HMBC spectrum of compound 2. ...................................... 133
Figure A 20: Expanded 1H NMR of compound 3. ................................................... 134
Figure A 21: Expanded 1H NMR of compound 3. ................................................... 134
Figure A 22: Expanded 13C NMR of compound 3. .................................................. 135
Figure A 23: Expanded 13C NMR spectrum of compound 3. .................................. 135
Figure A 24: Expanded 1H-1H COSY spectrum of compound 3. ............................ 136
Figure A 25: Expanded 1H-1H COSY spectrum of compound 3. ............................ 136
Figure A 26: Expanded HSQC spectrum of compound 3. ....................................... 137
Figure A 27: Expanded HSQC spectrum of compound 3. ....................................... 137
Figure A 28: Expanded HMBC spectrum of compound 3. ...................................... 138
Figure A 29: Expanded HMBC spectrum of compound 3. ...................................... 138
Figure A 30: Plot for calculation of LD50. ............................................................... 139
xvi
LIST OF TABLES
Table 1-1: Selected Marine natural products in development in anticancer trials ..... 13
Table 3-1: Weight and bioactivity of the four fractions ............................................. 50
Table 3-2: Weight and bioactivity of FH and FD fractions ....................................... 51
Table 3-3: Weight and bioactivity of the HPLC fractions ......................................... 53
Table 3-4: Elemental composition search on mass 359.22m/z .................................. 58
Table 3-5: NMR data for the compound 1 (CDCl3) ................................................... 59
Table 3-6: NMR values of epi-ilimaquinone and ilimaquinone (CDCl3) .................. 80
Table 3-7: Weights and activity of the FJ05-097FDF4 HPLC sub-fractions ............ 83
Table 3-8: Elemental composition search on mass 344.22m/z .................................. 87
Table 3-9: NMR data of compound 2 in CD3OD ...................................................... 88
Table 3-10: Comparison of the NMR data for smenospongine ................................. 97
Table 3-11: Weights and bioactivity of the FJ05-097FMF2 HPLC sub-fractions..... 99
Table 3-12: Elemental composition search on mass 402.23m/z .............................. 101
Table 3-13: NMR data of compound 3 in CD3OD .................................................. 104
Table 3-14: Comparison of the NMR data of glycinylilimaquinone ....................... 111
Table 4-1: Summary of three compounds isolated .................................................. 114
1
CHAPTER 1 INTRODUCTION AND LITERATURE
REVIEW
1.1 Introduction
1.1.1 Natural products
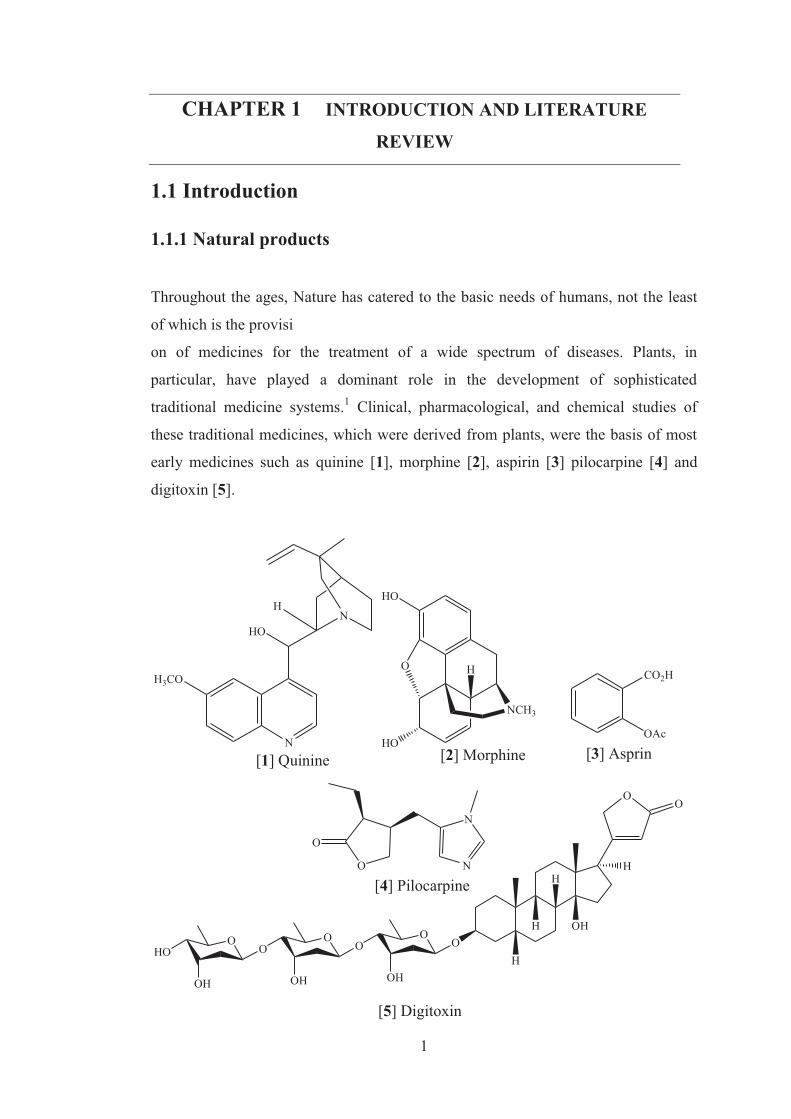
Throughout the ages, Nature has catered to the basic needs of humans, not the least
of which is the provisi
on of medicines for the treatment of a wide spectrum of diseases. Plants, in
particular, have played a dominant role in the development of sophisticated
traditional medicine systems.1 Clinical, pharmacological, and chemical studies of
these traditional medicines, which were derived from plants, were the basis of most
early medicines such as quinine [1], morphine [2], aspirin [3] pilocarpine [4] and
digitoxin [5].
CO2H
OAc
[3] AsprinN
HON
H
[1] Quinine
H3CO
HO
HO
HO
NCH3
[2] Morphine
O N
N
O
[4] Pilocarpine
O
OH
HO OO
OO
O
OH OH
OO
H
H
H
OH
H
[5] Digitoxin
2
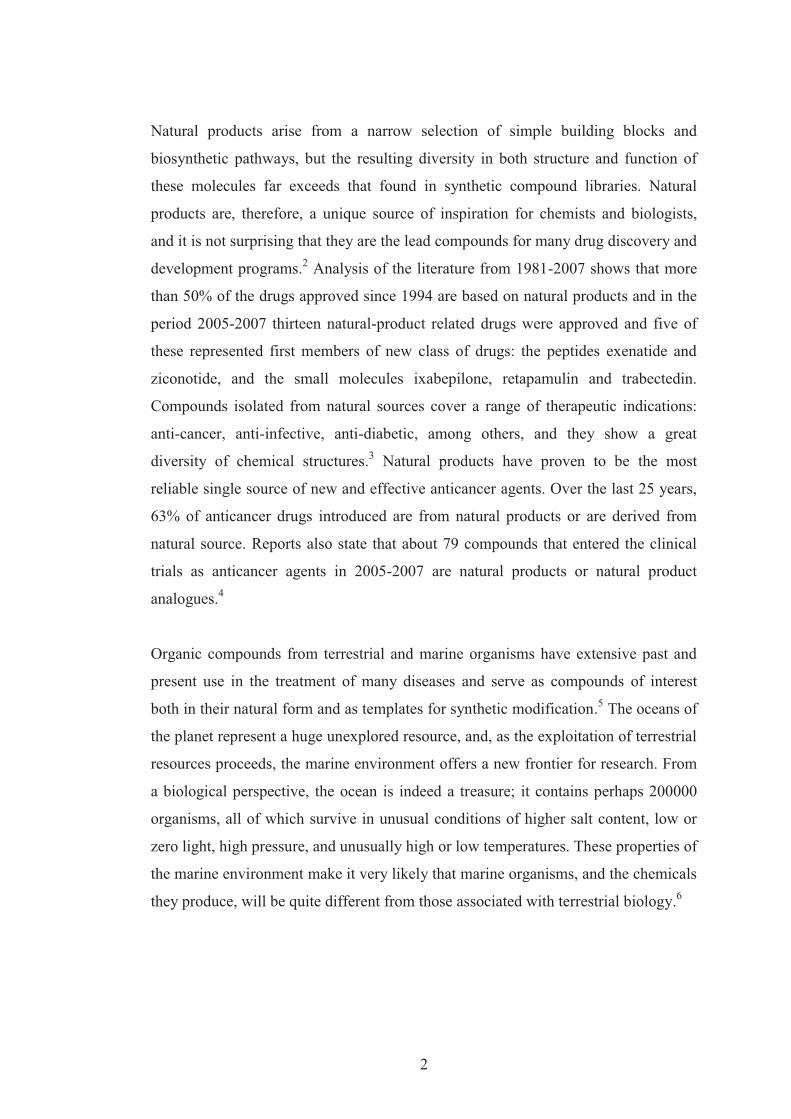
Natural products arise from a narrow selection of simple building blocks and
biosynthetic pathways, but the resulting diversity in both structure and function of
these molecules far exceeds that found in synthetic compound libraries. Natural
products are, therefore, a unique source of inspiration for chemists and biologists,
and it is not surprising that they are the lead compounds for many drug discovery and
development programs.2 Analysis of the literature from 1981-2007 shows that more
than 50% of the drugs approved since 1994 are based on natural products and in the
period 2005-2007 thirteen natural-product related drugs were approved and five of
these represented first members of new class of drugs: the peptides exenatide and
ziconotide, and the small molecules ixabepilone, retapamulin and trabectedin.
Compounds isolated from natural sources cover a range of therapeutic indications:
anti-cancer, anti-infective, anti-diabetic, among others, and they show a great
diversity of chemical structures.3 Natural products have proven to be the most
reliable single source of new and effective anticancer agents. Over the last 25 years,
63% of anticancer drugs introduced are from natural products or are derived from
natural source. Reports also state that about 79 compounds that entered the clinical
trials as anticancer agents in 2005-2007 are natural products or natural product
analogues.4
Organic compounds from terrestrial and marine organisms have extensive past and
present use in the treatment of many diseases and serve as compounds of interest
both in their natural form and as templates for synthetic modification.5 The oceans of
the planet represent a huge unexplored resource, and, as the exploitation of terrestrial
resources proceeds, the marine environment offers a new frontier for research. From
a biological perspective, the ocean is indeed a treasure; it contains perhaps 200000
organisms, all of which survive in unusual conditions of higher salt content, low or
zero light, high pressure, and unusually high or low temperatures. These properties of
the marine environment make it very likely that marine organisms, and the chemicals
they produce, will be quite different from those associated with terrestrial biology.6
3
1.1.2 Marine natural products
Natural products possess a broad diversity of structure and function, and they provide
inspiration for chemistry, biology, and medicine.2 With the ocean covering 70% of
the Earth’s surface, and with the uniqueness of the environmental conditions present
in the oceans, it is easily understandable why the ocean can be considered as a very
promising source of natural drugs or synthetic derivatives, for the future.7 The
Ocean, which is called the ‘mother of origin of life’, is also the source of structurally
unique natural products that are mainly accumulated in living organisms. Several of
these compounds show pharmacological activities and are helpful for the discovery
of bioactive compounds, primarily for deadly diseases like cancer or acquired
immuno-deficiency syndrome (AIDS), while other compounds have been developed
as analgesics or to treat inflammation.8 Natural products isolated from marine
organisms have also been shown to have a great potential in drug discovery.7 Many
marine organisms are soft bodied and have a sedentary life style necessitating
chemical means of defense; therefore, they have evolved the ability to synthesize
toxic compounds or to obtain them from marine microorganisms. These compounds
help them deter predators, keep competitors at bay or paralyze their prey. Natural
products released into the water are rapidly diluted and, therefore, need to be highly
potent to have any effect. For this reason, and because of the immense biological
diversity in the sea as a whole, it is increasingly recognized that a huge number of
natural products and novel chemical entities exist in the oceans, with biological
activities that may be useful in the quest for finding drugs with greater efficacy and
specificity for the treatment of many human diseases.9 Marine organisms have
evolved biochemical and physiological mechanisms that include the production of
bioactive compounds for such purposes as reproduction, communication, and
protection against predation, infection and competition. With the continuous
emergence of new diseases and the development of drug resistance in harmful
bacteria, viruses, and cancer cells, there is a continuous need for the development of
new drugs with novel mechanisms of action.10
In recent years, many bioactive compounds have been extracted from various marine
animals like tunicates, sponges, soft corals, sea hares, nudibranchs, bryozoans, sea
4
slugs and marine organisms8. To date, researchers have isolated more than 20000
natural products from marine flora and fauna11 and only in the year 2006, 779 new
compounds were isolated which were of marine origin.12 The sponges and
coelenterates continue to dominate as source phyla of new compounds, with
microorganisms being the other major phyla.13 Most sessile marine invertebrates
contain a primitive immune system and produce toxic chemicals as a form of
defense.
1.1.3 Marine natural products derived drugs in clinical trials
In particular, the marine environment, a rich source of structurally unique, bioactive
metabolites, has produced a number of drug candidates that are currently in clinical
trials.11 The development of clinically useful drugs is a long and tedious process that
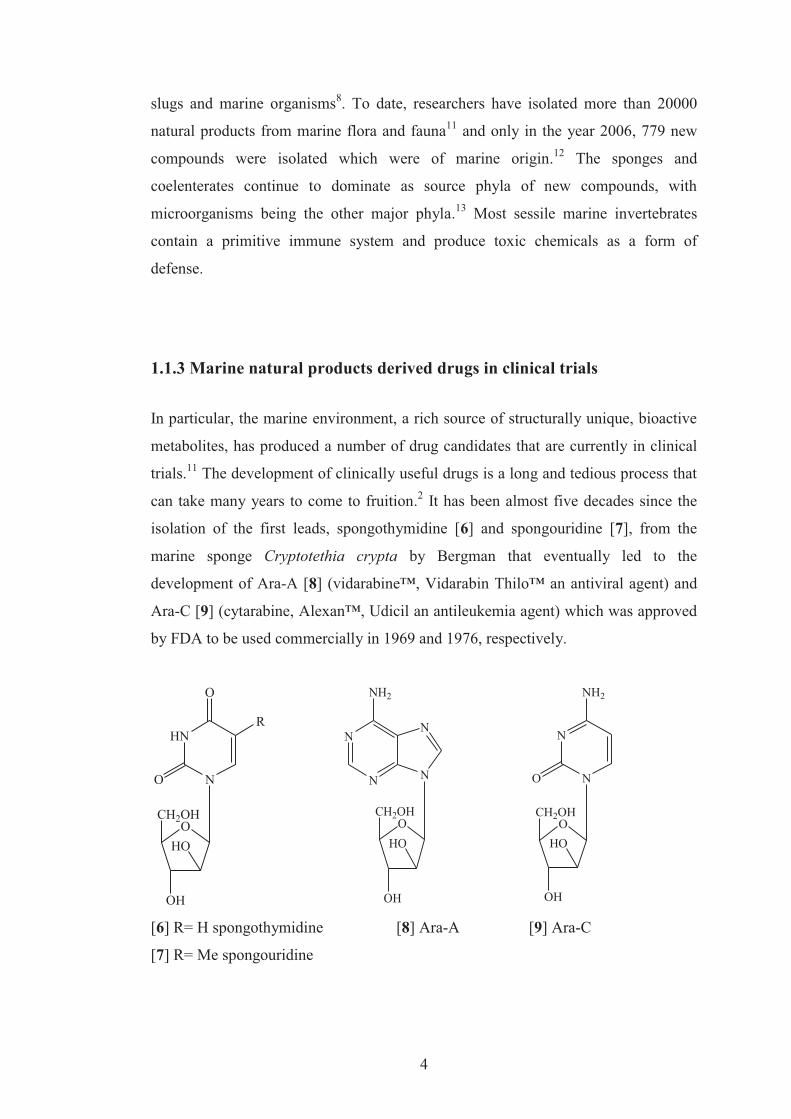
can take many years to come to fruition.2 It has been almost five decades since the
isolation of the first leads, spongothymidine [6] and spongouridine [7], from the
marine sponge Cryptotethia crypta by Bergman that eventually led to the
development of Ara-A [8] (vidarabine™, Vidarabin Thilo™ an antiviral agent) and
Ara-C [9] (cytarabine, Alexan™, Udicil an antileukemia agent) which was approved
by FDA to be used commercially in 1969 and 1976, respectively.
O
OH
CH2OH
N
HN
O
R
O
HO
N
N N
N
OHO
OH
CH2OH
NH2
O
OH
CH2OH
HO
N
N
O
NH2
[6] R= H spongothymidine [8] Ara-A [9] Ara-C
[7] R= Me spongouridine
5
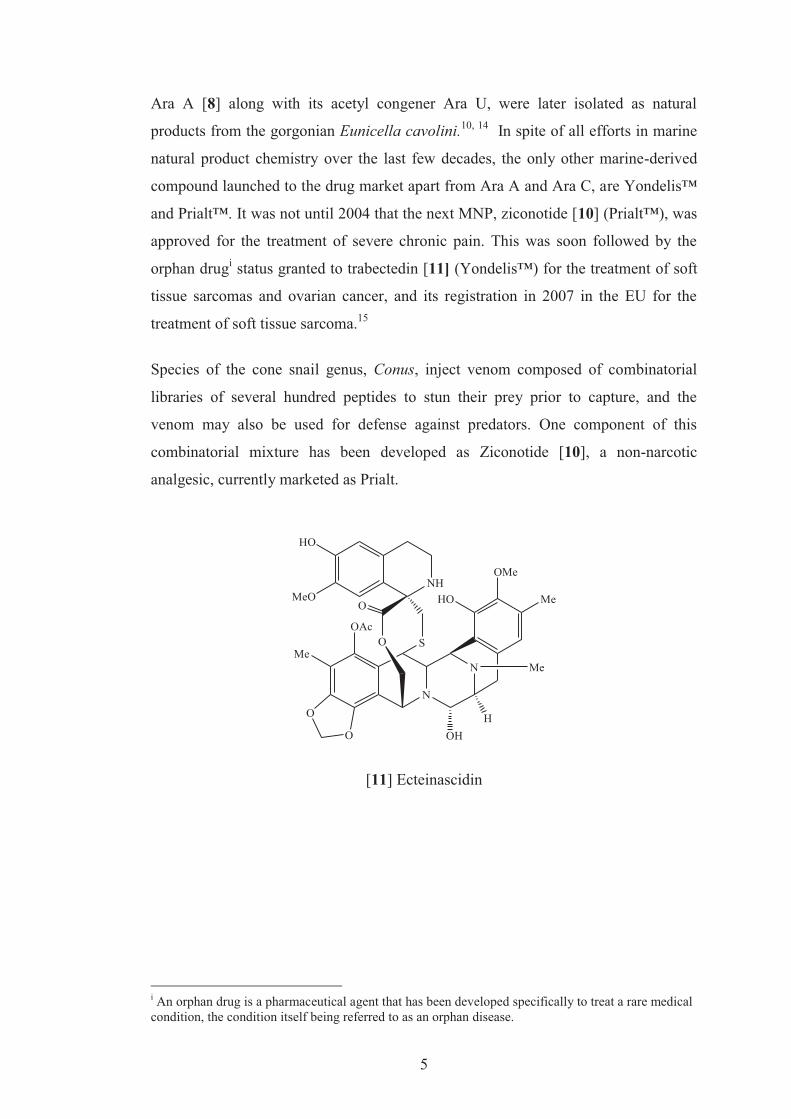
Ara A [8] along with its acetyl congener Ara U, were later isolated as natural
products from the gorgonian Eunicella cavolini.10, 14 In spite of all efforts in marine
natural product chemistry over the last few decades, the only other marine-derived
compound launched to the drug market apart from Ara A and Ara C, are Yondelis™
and Prialt™. It was not until 2004 that the next MNP, ziconotide [10] (Prialt™), was
approved for the treatment of severe chronic pain. This was soon followed by the
orphan drugi status granted to trabectedin [11] (Yondelis™) for the treatment of soft
tissue sarcomas and ovarian cancer, and its registration in 2007 in the EU for the
treatment of soft tissue sarcoma.15
Species of the cone snail genus, Conus, inject venom composed of combinatorial
libraries of several hundred peptides to stun their prey prior to capture, and the
venom may also be used for defense against predators. One component of this
combinatorial mixture has been developed as Ziconotide [10], a non-narcotic
analgesic, currently marketed as Prialt.
O
O
N
N
Me
OMe
HOH
Me
OAc
HO
O S
O
NH
HO
MeO
Me
[11] Ecteinascidin
i An orphan drug is a pharmaceutical agent that has been developed specifically to treat a rare medical condition, the condition itself being referred to as an orphan disease.
6
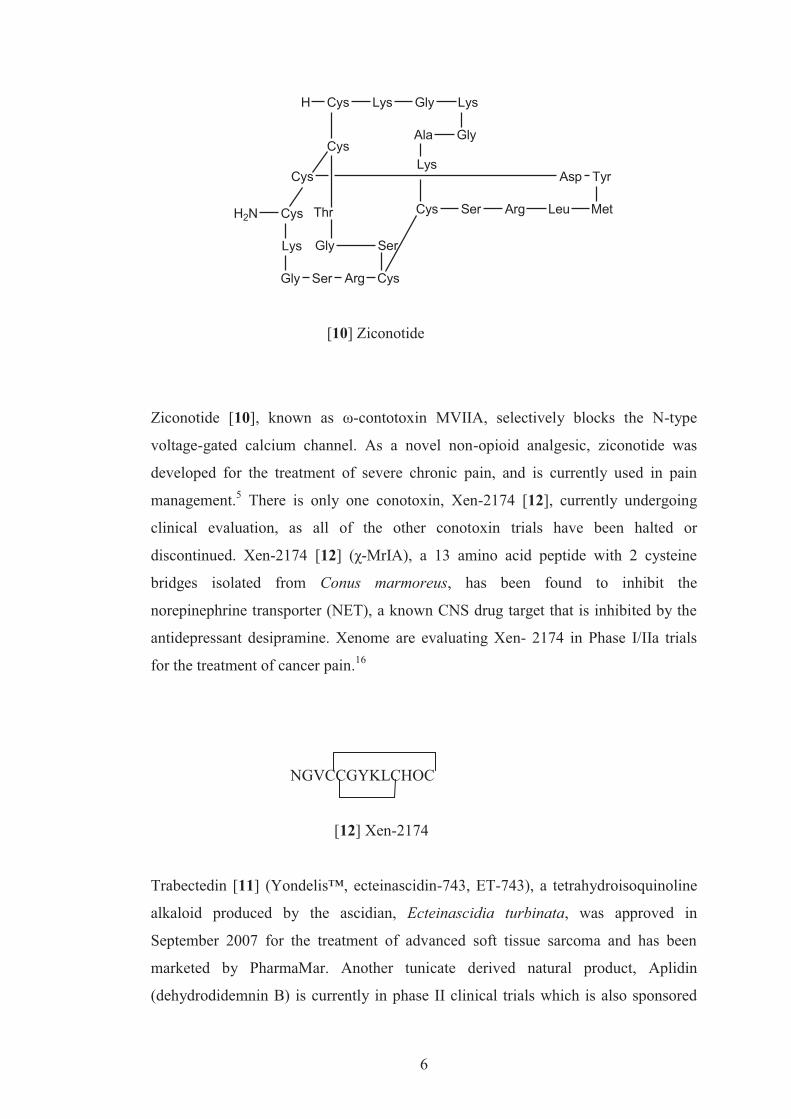
[10] Ziconotide
H Cys Lys Gly Lys
GlyAla
Lys
Cys Ser Arg Leu Met
Cys
Cys
CysH2N
Lys
Gly Ser Arg Cys
TyrAsp
SerGly
Thr
Ziconotide [10], known as ω-contotoxin MVIIA, selectively blocks the N-type
voltage-gated calcium channel. As a novel non-opioid analgesic, ziconotide was
developed for the treatment of severe chronic pain, and is currently used in pain
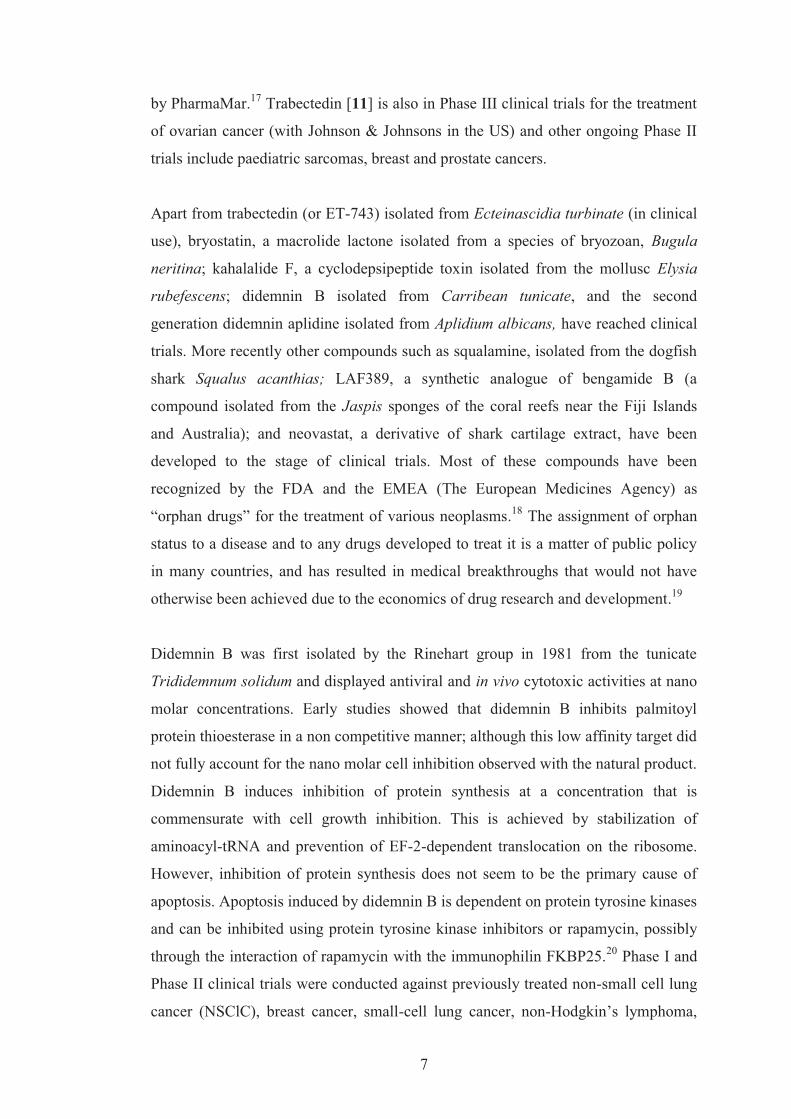
management.5 There is only one conotoxin, Xen-2174 [12], currently undergoing
clinical evaluation, as all of the other conotoxin trials have been halted or
discontinued. Xen-2174 [12] (χ-MrIA), a 13 amino acid peptide with 2 cysteine
bridges isolated from Conus marmoreus, has been found to inhibit the
norepinephrine transporter (NET), a known CNS drug target that is inhibited by the
antidepressant desipramine. Xenome are evaluating Xen- 2174 in Phase I/IIa trials
for the treatment of cancer pain.16
NGVCCGYKLCHOC
[12] Xen-2174
Trabectedin [11] (Yondelis™, ecteinascidin-743, ET-743), a tetrahydroisoquinoline
alkaloid produced by the ascidian, Ecteinascidia turbinata, was approved in
September 2007 for the treatment of advanced soft tissue sarcoma and has been
marketed by PharmaMar. Another tunicate derived natural product, Aplidin
(dehydrodidemnin B) is currently in phase II clinical trials which is also sponsored
7
by PharmaMar.17 Trabectedin [11] is also in Phase III clinical trials for the treatment
of ovarian cancer (with Johnson & Johnsons in the US) and other ongoing Phase II
trials include paediatric sarcomas, breast and prostate cancers.
Apart from trabectedin (or ET-743) isolated from Ecteinascidia turbinate (in clinical
use), bryostatin, a macrolide lactone isolated from a species of bryozoan, Bugula
neritina; kahalalide F, a cyclodepsipeptide toxin isolated from the mollusc Elysia
rubefescens; didemnin B isolated from Carribean tunicate, and the second
generation didemnin aplidine isolated from Aplidium albicans, have reached clinical
trials. More recently other compounds such as squalamine, isolated from the dogfish
shark Squalus acanthias; LAF389, a synthetic analogue of bengamide B (a
compound isolated from the Jaspis sponges of the coral reefs near the Fiji Islands
and Australia); and neovastat, a derivative of shark cartilage extract, have been
developed to the stage of clinical trials. Most of these compounds have been
recognized by the FDA and the EMEA (The European Medicines Agency) as
“orphan drugs” for the treatment of various neoplasms.18 The assignment of orphan
status to a disease and to any drugs developed to treat it is a matter of public policy
in many countries, and has resulted in medical breakthroughs that would not have
otherwise been achieved due to the economics of drug research and development.19
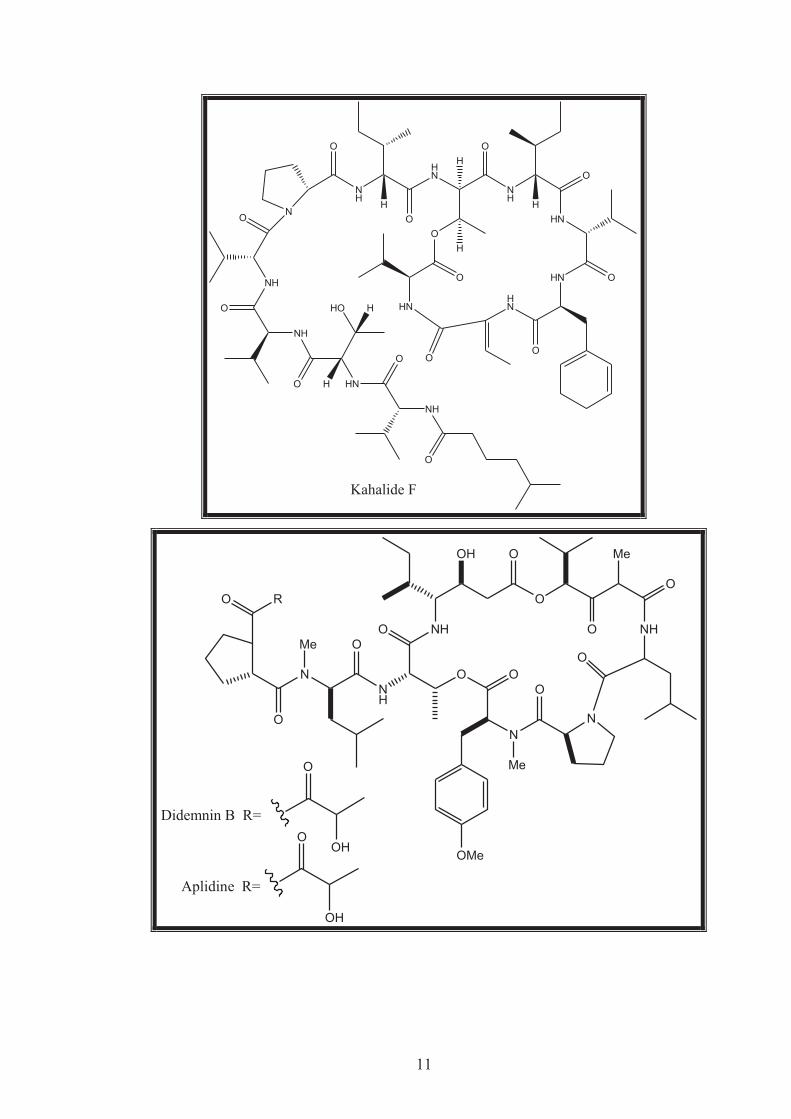
Didemnin B was first isolated by the Rinehart group in 1981 from the tunicate
Trididemnum solidum and displayed antiviral and in vivo cytotoxic activities at nano
molar concentrations. Early studies showed that didemnin B inhibits palmitoyl
protein thioesterase in a non competitive manner; although this low affinity target did
not fully account for the nano molar cell inhibition observed with the natural product.
Didemnin B induces inhibition of protein synthesis at a concentration that is
commensurate with cell growth inhibition. This is achieved by stabilization of
aminoacyl-tRNA and prevention of EF-2-dependent translocation on the ribosome.
However, inhibition of protein synthesis does not seem to be the primary cause of
apoptosis. Apoptosis induced by didemnin B is dependent on protein tyrosine kinases
and can be inhibited using protein tyrosine kinase inhibitors or rapamycin, possibly
through the interaction of rapamycin with the immunophilin FKBP25.20 Phase I and
Phase II clinical trials were conducted against previously treated non-small cell lung
cancer (NSClC), breast cancer, small-cell lung cancer, non-Hodgkin’s lymphoma,
8
metastatic melanoma, glioblastoma multiforme, and CNS tumors. However, these
trials resulted in significant neuromuscular toxicity and no objective responses.
Nevertheless, didemnin B showed activity in patients with advanced pretreated non-
Hodgkin’s lymphoma, but trials were suspended owing to onset of severe fatigue in
patients. Other trials showed a high incidence of anaphylaxis, and were therefore
terminated. All current trials of didemnim B are on hold.20
Aplidine (dehydrodidemnin B) was first reported in a 1991 patent by Rinehart and is
obtained from the Mediterranean tunicate Aplidium albicans.20 Aplidine differs from
didemnin B only in replacement of the N-lactyl side chain with a pyruvyl group.
Aplidine shows similar levels of antitumour activity to didemnin B in cultured tumor
cells, and has been shown to induce apoptosis by induction of oxidative stress, which
triggers the pro-apoptotic receptor Fas (CD-95) and induces mitochondrion-mediated
apoptosis. Aplidine also activates p38 mitogen-activated protein kinases (MAPKs)
and JNK and inhibits secretion of vascular endothelial growth factor (VEGF).
Aplidine has also been shown to inhibit angiogenesis in chick embryos in vivo and to
selectively disrupt β-sheet fibrils caused by prion protein sequence PrP 106–126 in a
1:1 molar ratio. Phase II clinical trials with aplidine are ongoing for metastatic
melanoma, multiple myeloma, non-Hodgkin’s lymphoma, acute lymphoblastic
leukaemia, prostate cancer and bladder cancer.20
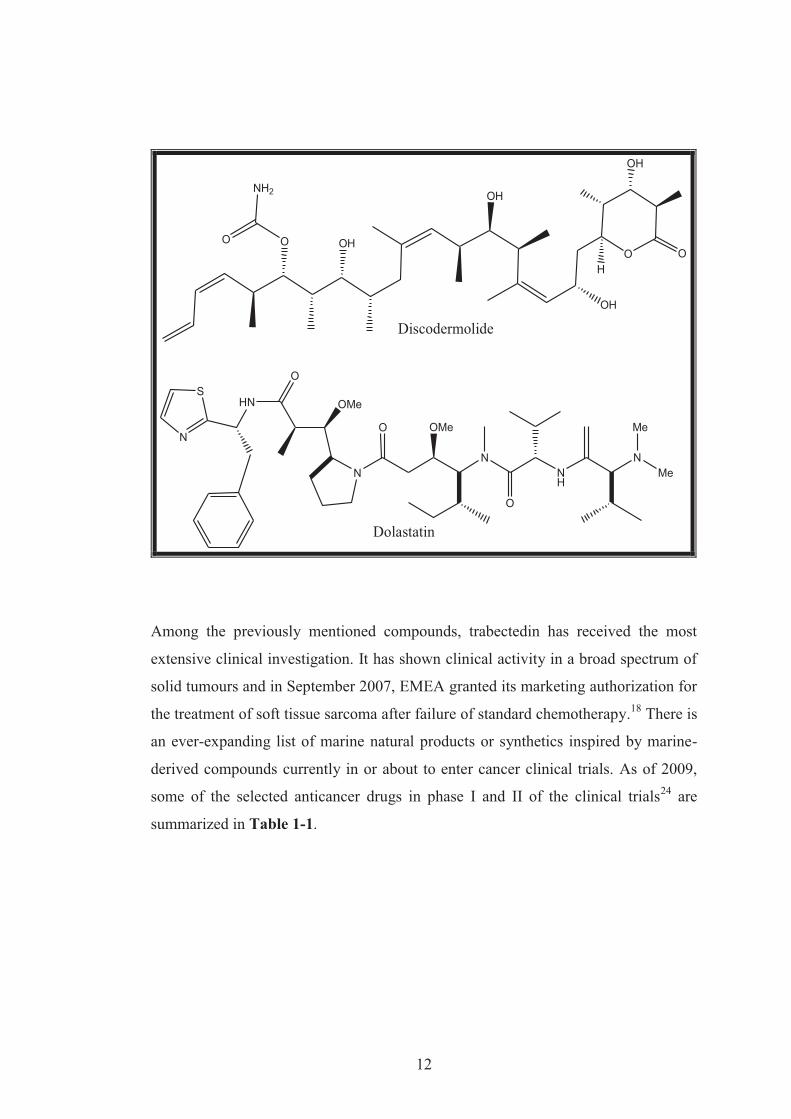
Discodermolide was first isolated in 1990 by Gunasekera and co-workers at the
Harbor Branch Oceanographic Institute, Florida, USA, from the rare deep-water
sponge Discodermia dissoluta.20, 21 Discodermolide functions as an
immunosuppressant and induces G2/M phase cell-cycle arrest in lymphoid and non-
lymphoid cells at nanomolar concentrations, Discodermolide has further shown in
vivo activity against HCT-116 colorectal cancer xenografts in mice. Co-treatment of
mice with (+)-anhydrodiscodermolide C and bacteriolytic treatment with Clostridium
novyi-NT spores resulted in a rapid, complete cure of four out of five animals with a
single injection. A Phase I clinical study of (+)-discodermolide showed no
neuropathy or neutropaenia, and demonstrated mild-to-moderate toxicity from 0.6
mg/m2 to 19.2 mg/m2. The pharmacokinetics of (+)-discodermolide were shown to
be non-linear with recycling of (+)-discodermolide between tissues and the
9
circulatory system. At present, Novartis has discontinued Phase I trials with (+)-
discodermolide owing to lack of efficacy and toxicity problems.20, 22
The discovery of the dolastatins from Dolabella auricularia,3 had its beginnings in
1972 during an explorative expedition to the island state of Mauritius in the Western
Indian Ocean.20 Dolastatin 10 exhibited outstanding in vitro cytotoxic activity against
cancer cells. Alcohol extracts of D. auricularia showed exceptionally potent activity
against murine NCI P388 lymphocytic leukaemia cells at subnanomolar
concentrations (ED50 value of 4.6 × 10⁻⁵μg/ml).20 The dolastatins inhibit cell
proliferation and induce apoptosis in numerous malignant cell lines.22 Dolastatins
exerted profound cytotoxic effects in animals bearing intraperitoneal tumors; in
addition, they exhibited synergistic antitumor activity with vinca alkaloids and
bryostatin. Dolastatin 10 has been evaluated in various phase I clinical trials.
Preliminary data indicated that 40% of patients developed moderate peripheral
neuropathy and patients with underlying neuropathy are at increased risk for this
side-effect. Subsequent phase II studies failed to demonstrate activity in solid
tumors.22
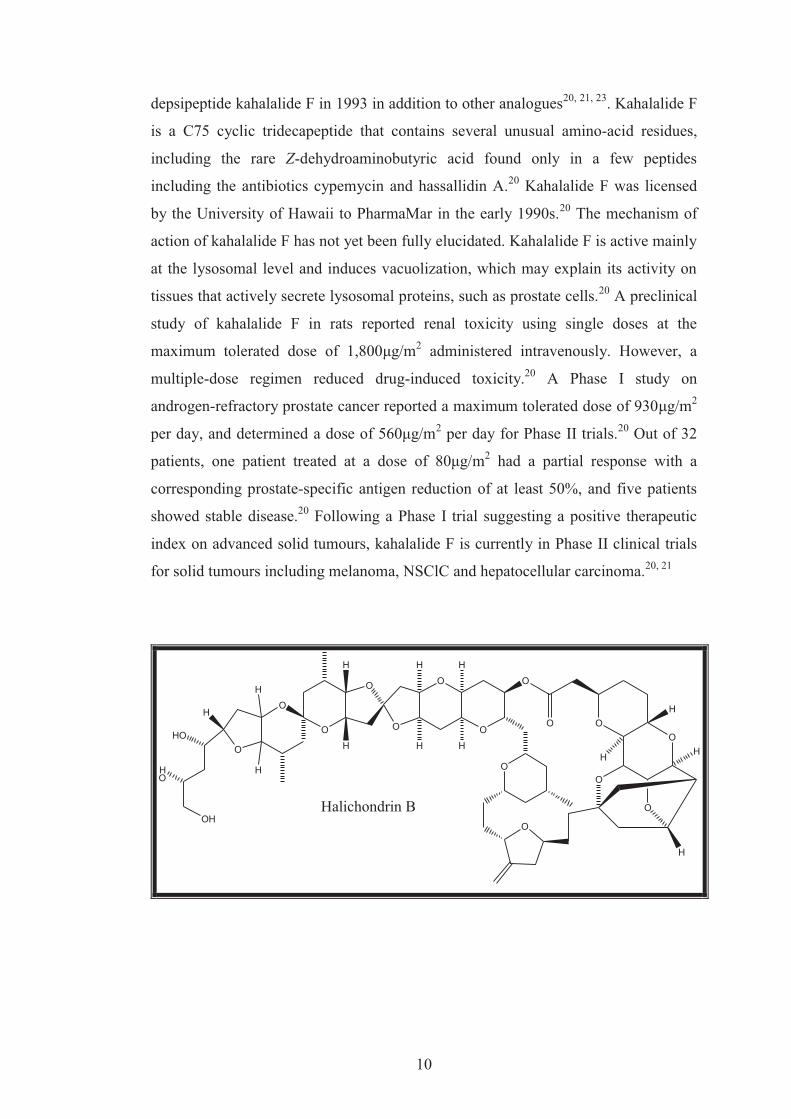
Halichondrin B, extracted from a black-colored marine sponge Halichondria okadai,
exhibits potent in vivo antitumor activity.21 Halichondrin B was found to be most
potent among the series. It was isolated in very low yield (1.8x10⁻⁶% to 4.0x10⁻⁵%).21
Mechanistic studies conducted on halichondrin B revealed that it targeted tubulin. It
was demonstrated by the NCI that halichondrin B is a mitotic inhibitor which binds
to the vinca domain of tubulin, resulting in inhibition of microtubule formation and
tubulin-dependent GTP hydrolysis. The compound was found to be extremely
effective in vivo against human solid tumors which had been xenografted into
immune-deficient mice. It also exhibited an IC50 value of 0.3 nM against L-1210
murine leukemia cells, thereby surpassing in potency the best previously known
agents, dolastatin-10 (0.5 nM), rhizoxin (1 nM) and vinblastine (20 nM). More than
1,100 vials of Halichondrin B were distributed during 2004 for phase I and II clinical
trials.20, 21
Seasonal collections of the sacoglossan (sea slug) Elysia rufescens by the Scheuer
group from the University of Hawaii led to the isolation of the novel antitumor
10
depsipeptide kahalalide F in 1993 in addition to other analogues20, 21, 23. Kahalalide F
is a C75 cyclic tridecapeptide that contains several unusual amino-acid residues,
including the rare Z-dehydroaminobutyric acid found only in a few peptides
including the antibiotics cypemycin and hassallidin A.20 Kahalalide F was licensed
by the University of Hawaii to PharmaMar in the early 1990s.20 The mechanism of
action of kahalalide F has not yet been fully elucidated. Kahalalide F is active mainly
at the lysosomal level and induces vacuolization, which may explain its activity on
tissues that actively secrete lysosomal proteins, such as prostate cells.20 A preclinical
study of kahalalide F in rats reported renal toxicity using single doses at the
maximum tolerated dose of 1,800μg/m2 administered intravenously. However, a
multiple-dose regimen reduced drug-induced toxicity.20 A Phase I study on
androgen-refractory prostate cancer reported a maximum tolerated dose of 930μg/m2
per day, and determined a dose of 560μg/m2 per day for Phase II trials.20 Out of 32
patients, one patient treated at a dose of 80μg/m2 had a partial response with a
corresponding prostate-specific antigen reduction of at least 50%, and five patients
showed stable disease.20 Following a Phase I trial suggesting a positive therapeutic
index on advanced solid tumours, kahalalide F is currently in Phase II clinical trials
for solid tumours including melanoma, NSClC and hepatocellular carcinoma.20, 21
O
O
H
HO
HO
OH
O
O O
O O
O
O
O
O OO
O
O
H
H
H
H
H
H
H
HH
H HH
Halichondrin B
11
HN O
HN
ONH H
O
HN
OO
NH
O
N
H
H
O
HN
O
NH
O
NH
O HN
HO H
O
NH
O
HN
OO
H
H
Kahalide F
O
OH
Didemnin B R=
NH
OH
O
O
O
Me
O
NHO
NH
O O
N
O
N
OO
N
O
Me
O R
OMe
Me
O
OH
Aplidine R=
12
N
Me
MeNH
N
O
OMe
N
O
OMeHN
OS
N
Dolastatin
OH
OH
OHOO
NH2
O
OH
OH
Discodermolide
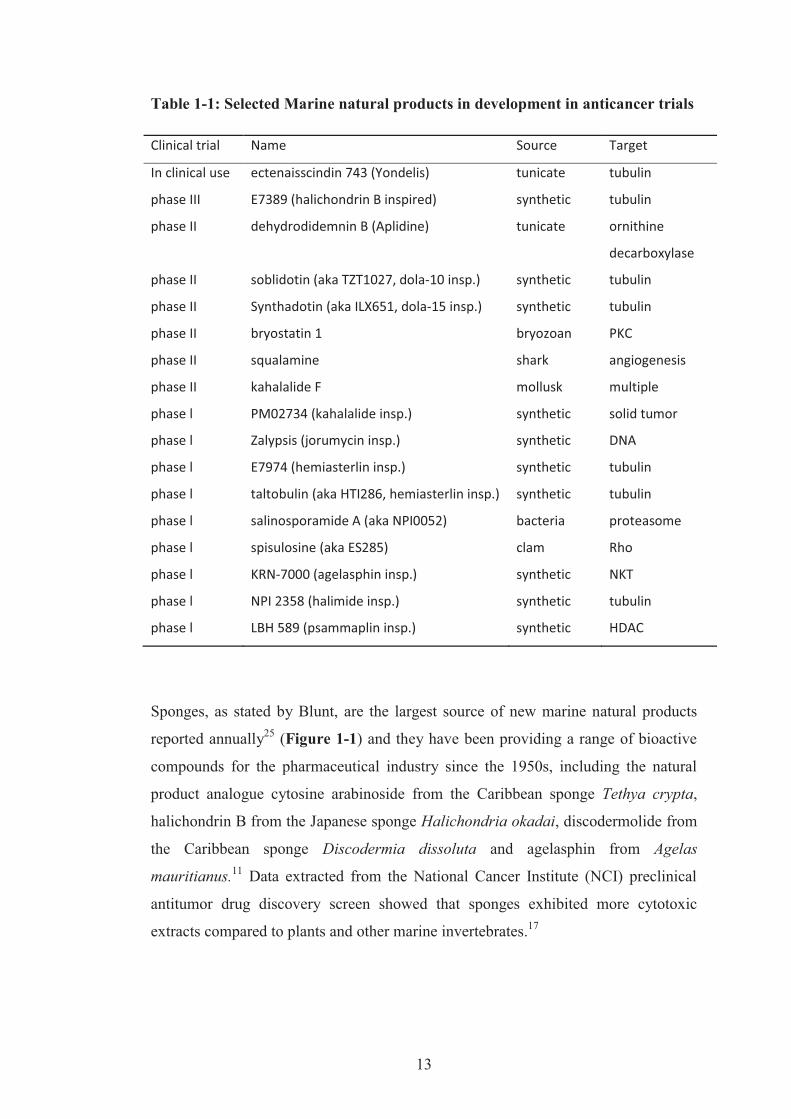
Among the previously mentioned compounds, trabectedin has received the most
extensive clinical investigation. It has shown clinical activity in a broad spectrum of
solid tumours and in September 2007, EMEA granted its marketing authorization for
the treatment of soft tissue sarcoma after failure of standard chemotherapy.18 There is
an ever-expanding list of marine natural products or synthetics inspired by marine-
derived compounds currently in or about to enter cancer clinical trials. As of 2009,
some of the selected anticancer drugs in phase I and II of the clinical trials24 are
summarized in Table 1-1.
13
Table 1-1: Selected Marine natural products in development in anticancer trials
Clinical trial Name Source Target
In clinical use ectenaisscindin 743 (Yondelis) tunicate tubulin
phase III E7389 (halichondrin B inspired) synthetic tubulin
phase II dehydrodidemnin B (Aplidine) tunicate ornithine
decarboxylase
phase II soblidotin (aka TZT1027, dola-10 insp.) synthetic tubulin
phase II Synthadotin (aka ILX651, dola-15 insp.) synthetic tubulin
phase II bryostatin 1 bryozoan PKC
phase II squalamine shark angiogenesis
phase II kahalalide F mollusk multiple
phase l PM02734 (kahalalide insp.) synthetic solid tumor
phase l Zalypsis (jorumycin insp.) synthetic DNA
phase l E7974 (hemiasterlin insp.) synthetic tubulin
phase l taltobulin (aka HTI286, hemiasterlin insp.) synthetic tubulin
phase l salinosporamide A (aka NPI0052) bacteria proteasome
phase l spisulosine (aka ES285) clam Rho
phase l KRN-7000 (agelasphin insp.) synthetic NKT
phase l NPI 2358 (halimide insp.) synthetic tubulin
phase l LBH 589 (psammaplin insp.) synthetic HDAC
Sponges, as stated by Blunt, are the largest source of new marine natural products
reported annually25 (Figure 1-1) and they have been providing a range of bioactive
compounds for the pharmaceutical industry since the 1950s, including the natural
product analogue cytosine arabinoside from the Caribbean sponge Tethya crypta,
halichondrin B from the Japanese sponge Halichondria okadai, discodermolide from
the Caribbean sponge Discodermia dissoluta and agelasphin from Agelas
mauritianus.11 Data extracted from the National Cancer Institute (NCI) preclinical
antitumor drug discovery screen showed that sponges exhibited more cytotoxic
extracts compared to plants and other marine invertebrates.17
14
Figure 1-1: Distribution of marine natural products by phylum from 1965-2007.
Sponges are extremely well represented in the marine environment, with over
700011-9000 species described and as many species not yet described26, ranging from
shallow-water to those inhabiting depths of over 8000 m, with some deep-water
species adopting carnivorous behaviour.11 Sponge metabolites, predominantly from
shallow-water species, have been reviewed previously.11
Porifera are attractive subjects for natural product chemists due to the sheer number
of secondary metabolites produced, the novelty of structures encountered, and the
therapeutic potential of these compounds in the treatment of human diseases.26 Some
proposed ecological roles for sponge metabolites include antifeedant, antifoulants,
antibiotics, antisettlememnt cues and photoprotective agents. The phylum Porifera is
comprised of three classes distinguished primarily by sketeton characteristics:
Hexactinellida, Calcarea, and Demospongiae. A few hexactinellid sponges have been
investigated by natural product chemists, but there are no reports of metabolites from
the 102 genera in this class. Sponges of the class Calcera are exclusively marine and
possess skeletons of free calcareous spicules. Within the Calcera, only the genera
Leucetta and Clathrina have reported chemistry and all 31 calcarean metabolites are
amino acid derived. Demospongia, the class which encompasses most living
sponges, are a morphologically diverse group with fibrous protein skeletons
sometimes supplemented by siliceous spicules having numerous possible
15
configurations.26 Metabolites reported from the order Dictyoceratidan are
predominantly isoprenid in origin. The distribution of isoprenoid class is specific
within the dictyocertid families: linear furano sesterterpenes (Irciniidae),
sesterterpenes with tetronic acid functional groups (Thorectidae), meroterpenoids
(Spongiidae), and sesquiterpenes (Dysideidae). It is also important to note that there
are some deviations from the general trends of the secondary metabolite distribution
within the subclass. The largest number of secondary metabolites has been reported
from Dysidae sp.26
1.1.4 Morphology of marine sponges Sponges are the simplest of the mutlicellular animals and belong to the phylum
Porifera. Their bodies consist of jelly-like mesohyl sandwiched between two thin
layers of cells. While all the animals have unspecialized cells that can transform into
specialized cells, sponges are unique in having some specialized cells that can
transform into other types, often migrating between the main cell layers and the
mesohyl in the process. Sponges do not have nervous, digestive or circulatory
systems. Instead, most rely on maintaining a constant water flow through their bodies
to obtain food and oxygen and to remove waste, and the shapes of their bodies are
adapted to maximize the efficiency of the water flow. All are sessile aquatic animals
and, although there are freshwater species, the great majorities are marine species,
ranging from tidal zones to depths exceeding 8800 meters. While most of the
approximately 7000 known species feed on bacteria and other food particles in the
water, some host photosynthesizing micro-organisms as endosymbionts and these
alliances often produce more food and oxygen than they consume.27
Sponges are known for regenerating from fragments that are broken off, although
this only works if the fragments include the right types of cells. A few species
reproduce by budding. When conditions deteriorate, for example as temperatures
drop, many freshwater species and a few marine ones produce gemmules, "survival
pods" of unspecialized cells that remain dormant until conditions improve and then
either form completely new sponges or re-colonize the skeletons of their parents.
However, most sponges use sexual reproduction by releasing sperm cells into the
16
water. In viviparousii species the cells that capture most of the adults' food capture
the sperm cells but, instead of digesting them, transport them to ova in the parent's
mesohyl. The fertilized eggs begin development within the parent and the larvae are
released to swim off in search of places to settle. In oviparous species both sperm
and egg cells are released into the water and fertilization and development take place
outside the parent's bodies.27
Sponges use various materials to reinforce their mesohyl and in some cases to
produce skeletons, and this forms the main basis for classifying sponges. Calcareous
sponges produce spicules made of calcium carbonate. Demosponges reinforce the
mesohyl with fibers of a special form of collagen called spongin, most also produce
spicules of silica, and a few secrete massive external frameworks of calcium
carbonate. Although glass sponges also produce spicules made of silica, their bodies
mainly consist of syncytia that in some ways behave like many cells sharing a single
external membrane, and in others like individual cells with multiple nuclei. Probably
because of their variety of construction methods, demosponges constitute about 90%
of all known species, including all freshwater ones, and have the widest range of
habitats. Calcareous sponges are restricted to relatively shallow marine waters where
production of calcium carbonate is easiest. The fragile glass sponges are restricted to
polar regions and the ocean depths where predators are rare, and their feeding
systems very efficiently harvest what little food is available.27
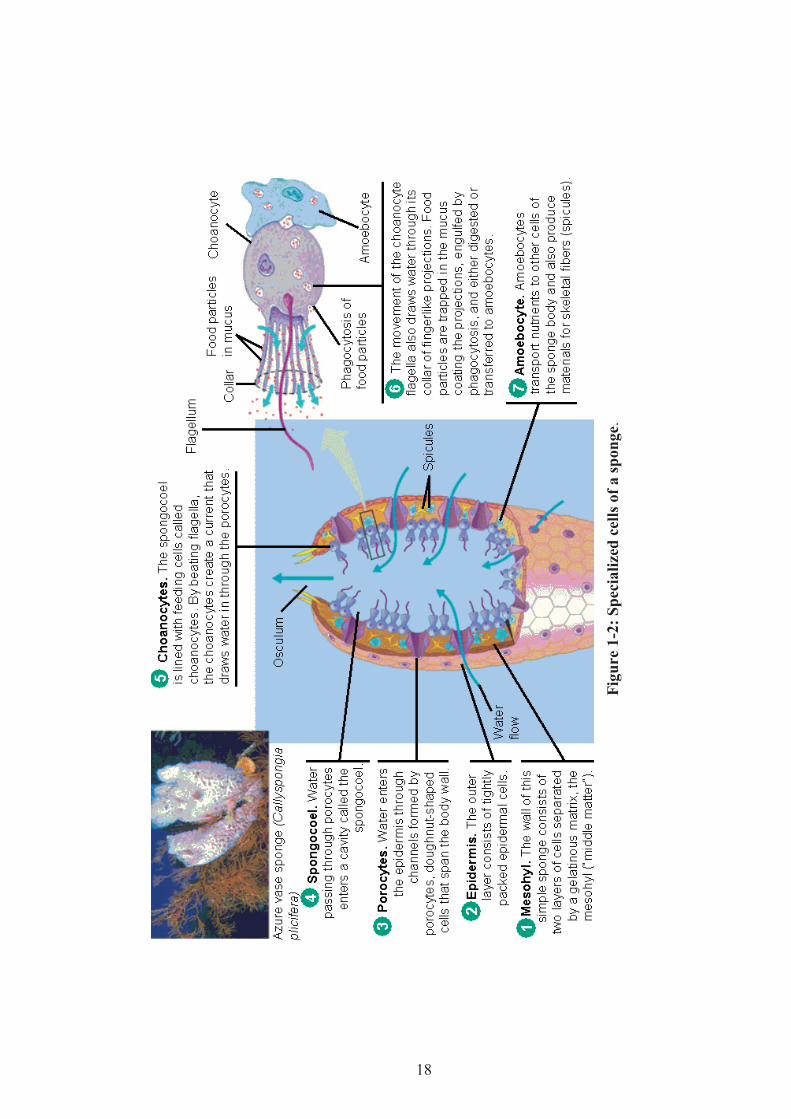
The body plan of a typical sponge is shown in Figure 1-2 below. Water (carrying
suspended plankton and other potential food) enters numerous small pores called
ostia (singular, ostium). The ostia are surrounded by donut-shaped cells called
porocytes that open and close to control water flow. For the sponge depicted in
Figure 1-2, water flows directly into an open chamber called the spongocoel (the
term "coel" refers to an open space or body cavity in an animal). Water leaves the
spongocoel by a larger opening (the osculum).28
ii A viviparous animal is an animal employing vivipary: the embryo develops inside the body of the mother, as opposed to outside in an egg (ovipary). The mother then gives live birth.
17
The interior of the spongocoel is lined with flagellated cells called choanocytes (or
collar cells; Figure 1-2). The choanocytes have a tubular collar facing the
spongocoel. A flagellum extends from the center of this collar, the movement of
which creates currents that force water through the sponge's "plumbing system".
Sponges can control the water flow by various combinations of wholly or partially
closing the osculum and ostia (the intake pores) and varying the beat of the flagella,
and may shut it down if there is a lot of sand or silt in the water.28 Suspended food
particles (plankton, larvae, etc) in the water are drawn through the collar from below,
trapped on the outside of the collar, and then phagocytized.28
18
Fi
gure
1-2
: Spe
cial
ized
cel
ls o
f a sp
onge
.
19
1.2 Aim and objectives
Aim: To isolate and structurally characterize the cytotoxic natural product from the
marine sponge, Hippospongia sp.
Objective
1. To acquire skills in extraction, isolation and purification of the active
components of the marine specimen using bioassay-guided fractionation.
2. To learn the skills of conducting Brine Shrimp Bioassay.
3. To obtain knowledge in the use of 1D and 2D NMR technique and other
spectral data for the characterization of the active compound.
4. To apply the above skills in isolation and characterization of the major
compounds of a sponge of the Genus Hippospongia.
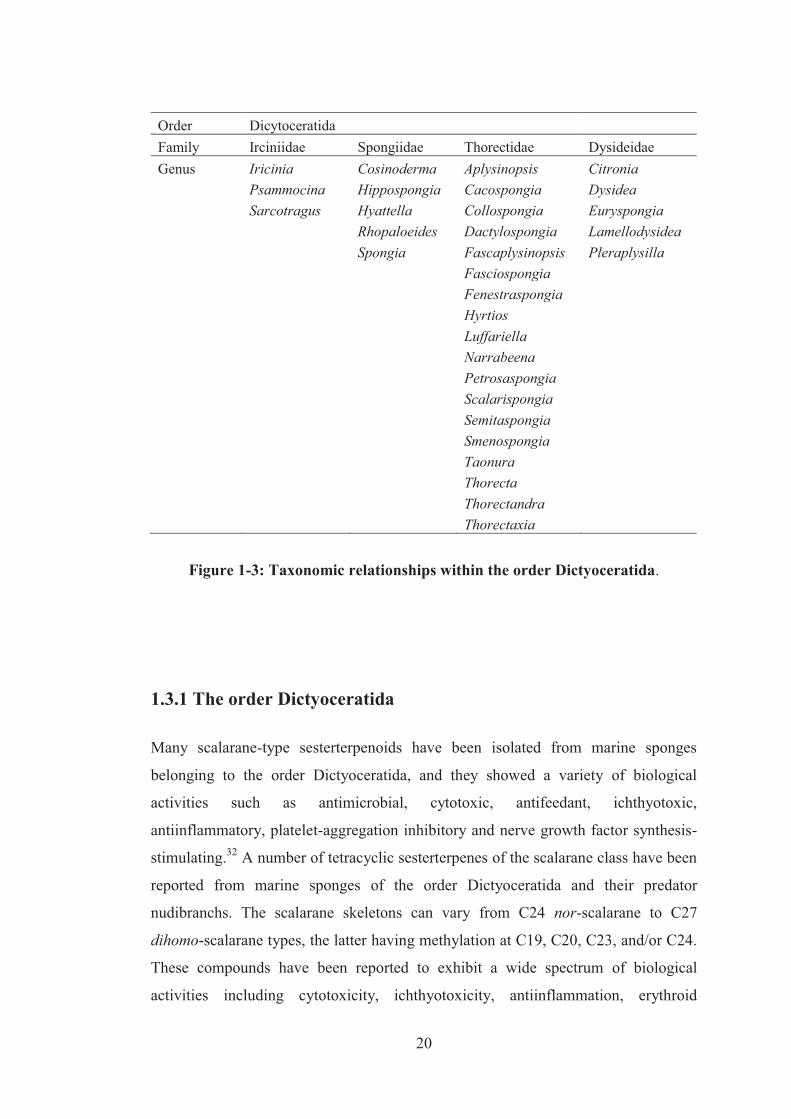
1.3 Literature Review The sponges of the genus Hippospongia belong to the order of Dictyoceratida and
family Spongiidae. Sponges belonging to this order have four families and within
each family there are a number of genera as shown in below Figure 1-3. (Note: not
all the sponges are shown in this figure). The sponge being studied has eleven genera
and the genus to which this sponge belongs to has thirty one species.29 Sponges of
the order Dictyoceratida are often prominent members of South Pacific island coral
reefs. Biologically, they are unique as their skeleton is fibrous rather than mineral in
content.30 The Demospongiae includes three subclasses (Homoscleromorpha,
Tetractinomorpha, and Ceracinomorpha) and are composed of 12 orders of which
Halichondria, Haplosclerida, and Dictyoceratida have been reported to contain the
highest number of novel secondary metabolites.31
20
Order Dicytoceratida Family Irciniidae Spongiidae Thorectidae Dysideidae Genus Iricinia Cosinoderma Aplysinopsis Citronia Psammocina Hippospongia Cacospongia Dysidea Sarcotragus Hyattella Collospongia Euryspongia Rhopaloeides Dactylospongia Lamellodysidea Spongia Fascaplysinopsis Pleraplysilla Fasciospongia Fenestraspongia Hyrtios Luffariella Narrabeena Petrosaspongia Scalarispongia Semitaspongia Smenospongia Taonura Thorecta Thorectandra Thorectaxia
Figure 1-3: Taxonomic relationships within the order Dictyoceratida.
1.3.1 The order Dictyoceratida Many scalarane-type sesterterpenoids have been isolated from marine sponges
belonging to the order Dictyoceratida, and they showed a variety of biological
activities such as antimicrobial, cytotoxic, antifeedant, ichthyotoxic,
antiinflammatory, platelet-aggregation inhibitory and nerve growth factor synthesis-
stimulating.32 A number of tetracyclic sesterterpenes of the scalarane class have been
reported from marine sponges of the order Dictyoceratida and their predator
nudibranchs. The scalarane skeletons can vary from C24 nor-scalarane to C27
dihomo-scalarane types, the latter having methylation at C19, C20, C23, and/or C24.
These compounds have been reported to exhibit a wide spectrum of biological
activities including cytotoxicity, ichthyotoxicity, antiinflammation, erythroid
21
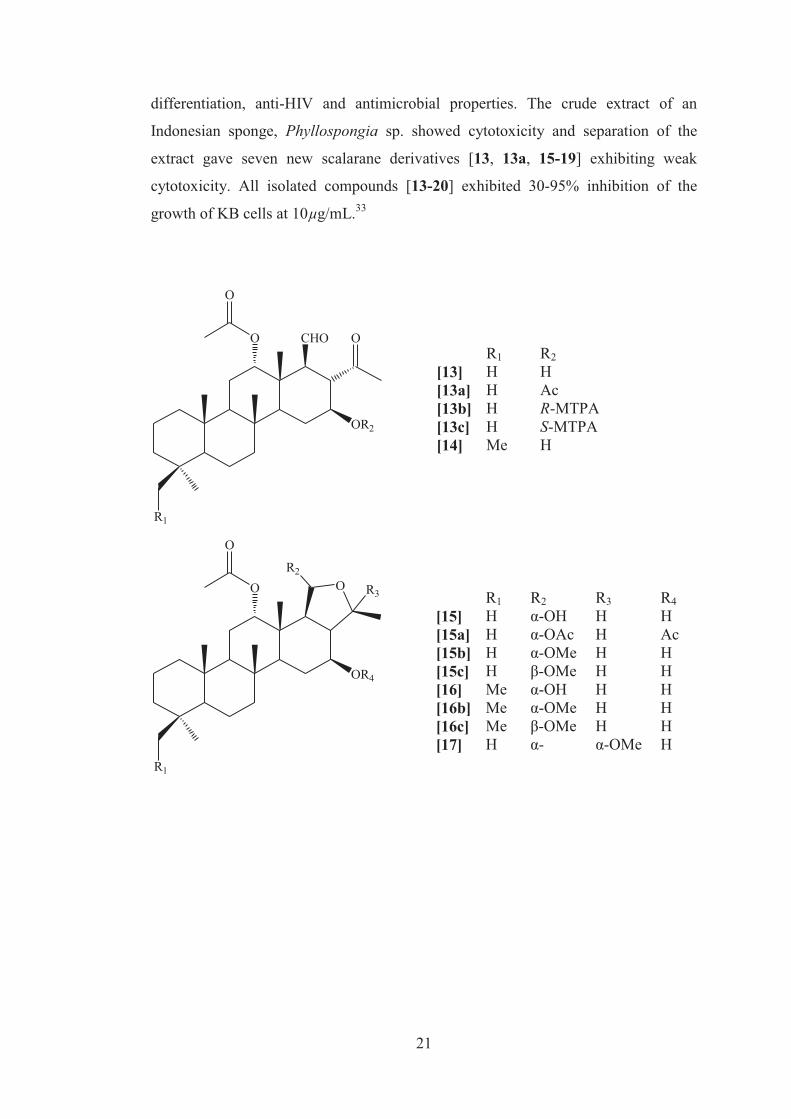
differentiation, anti-HIV and antimicrobial properties. The crude extract of an
Indonesian sponge, Phyllospongia sp. showed cytotoxicity and separation of the
extract gave seven new scalarane derivatives [13, 13a, 15-19] exhibiting weak
cytotoxicity. All isolated compounds [13-20] exhibited 30-95% inhibition of the
growth of KB cells at 10µg/mL.33
CHO
OR2
O
O
O
R1
R1 R2 [13] H H [13a] H Ac [13b] H R-MTPA [13c] H S-MTPA [14] Me H
OR4
O
O
R1
OR2
R3
R1 R2 R3 R4 [15] H α-OH H H [15a] H α-OAc H Ac [15b] H α-OMe H H [15c] H β-OMe H H [16] Me α-OH H H [16b] Me α-OMe H H [16c] Me β-OMe H H [17] H α- α-OMe H
22
R2
OH
O
O
O
R1
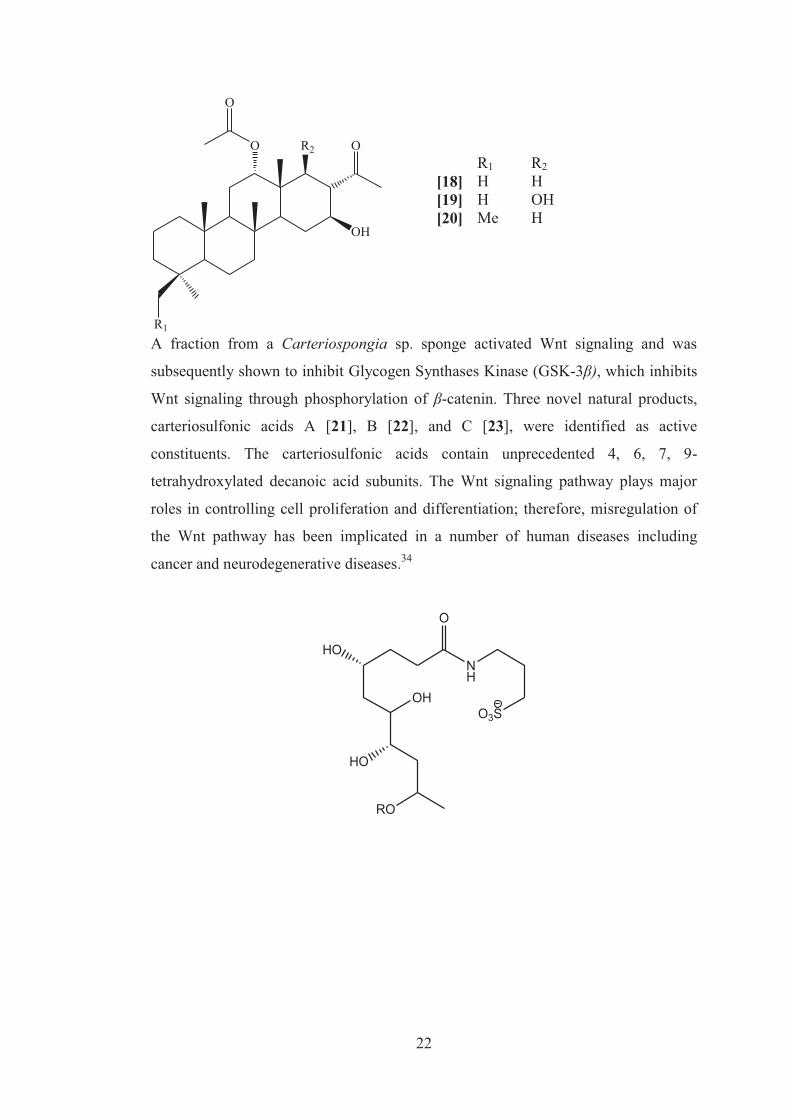
R1 R2 [18] H H [19] H OH [20] Me H
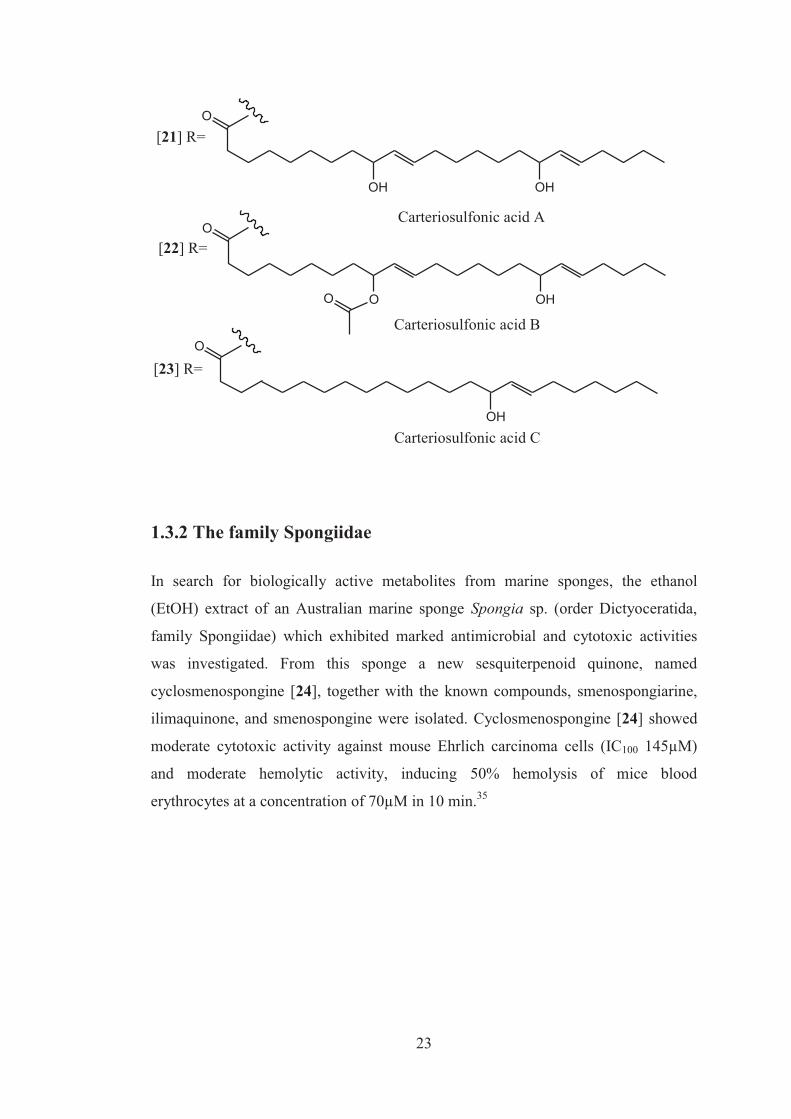
A fraction from a Carteriospongia sp. sponge activated Wnt signaling and was
subsequently shown to inhibit Glycogen Synthases Kinase (GSK-3β), which inhibits
Wnt signaling through phosphorylation of β-catenin. Three novel natural products,
carteriosulfonic acids A [21], B [22], and C [23], were identified as active
constituents. The carteriosulfonic acids contain unprecedented 4, 6, 7, 9-
tetrahydroxylated decanoic acid subunits. The Wnt signaling pathway plays major
roles in controlling cell proliferation and differentiation; therefore, misregulation of
the Wnt pathway has been implicated in a number of human diseases including
cancer and neurodegenerative diseases.34
OH
NH
O3S
O
HO
RO
HO
23
O
OH OH
[21] R=
O
O OHO
O
OH
[22] R=
[23] R=
Carteriosulfonic acid A
Carteriosulfonic acid B
Carteriosulfonic acid C
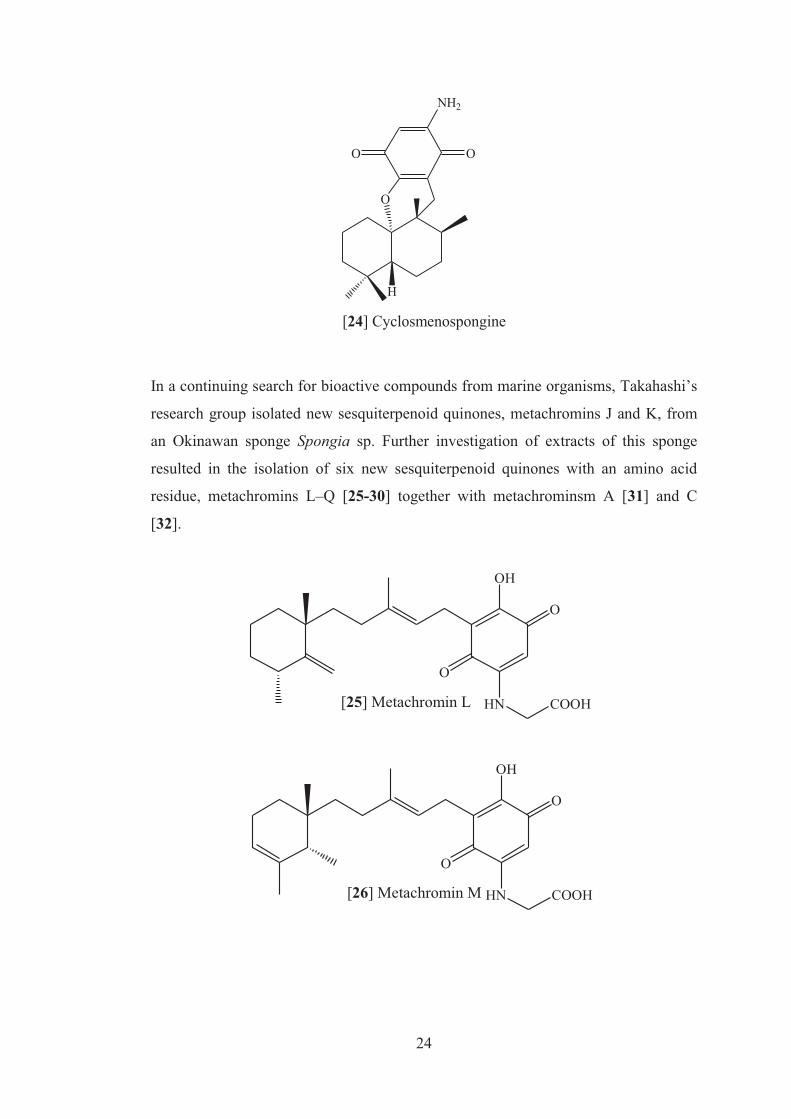
1.3.2 The family Spongiidae In search for biologically active metabolites from marine sponges, the ethanol
(EtOH) extract of an Australian marine sponge Spongia sp. (order Dictyoceratida,
family Spongiidae) which exhibited marked antimicrobial and cytotoxic activities
was investigated. From this sponge a new sesquiterpenoid quinone, named
cyclosmenospongine [24], together with the known compounds, smenospongiarine,
ilimaquinone, and smenospongine were isolated. Cyclosmenospongine [24] showed
moderate cytotoxic activity against mouse Ehrlich carcinoma cells (IC100 145µM)
and moderate hemolytic activity, inducing 50% hemolysis of mice blood
erythrocytes at a concentration of 70µM in 10 min.35
24
H
O
OO
NH2
[24] Cyclosmenospongine
In a continuing search for bioactive compounds from marine organisms, Takahashi’s
research group isolated new sesquiterpenoid quinones, metachromins J and K, from
an Okinawan sponge Spongia sp. Further investigation of extracts of this sponge
resulted in the isolation of six new sesquiterpenoid quinones with an amino acid
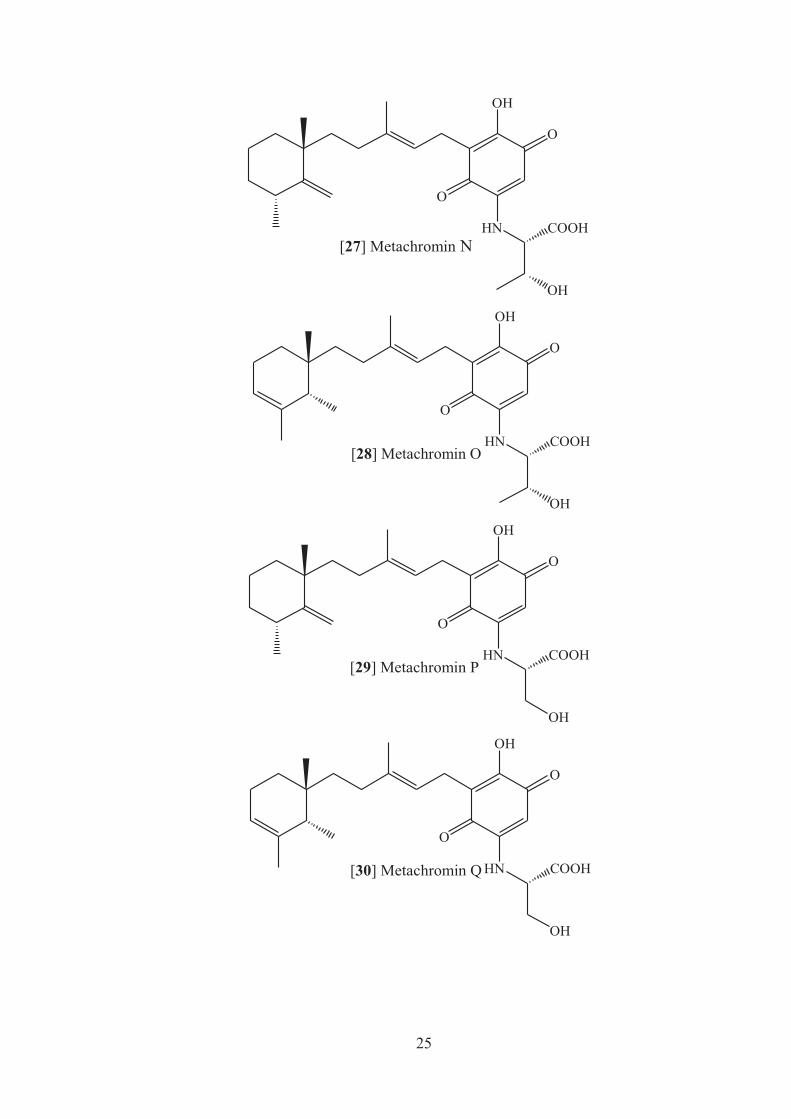
residue, metachromins L–Q [25-30] together with metachrominsm A [31] and C
[32].
OH
O
O
HN COOH[25] Metachromin L
OH
O
O
HN COOH[26] Metachromin M
25
OH
O
O
HN COOH[27] Metachromin N
OH OH
O
O
HN COOH[28] Metachromin O
OH OH
O
O
HN COOH[29] Metachromin P
OH OH
O
O
HN COOH[30] Metachromin Q
OH
26
OH
O
O
OMe[31] Metachromin AOH
O
O
OMe[32] Metachromin C
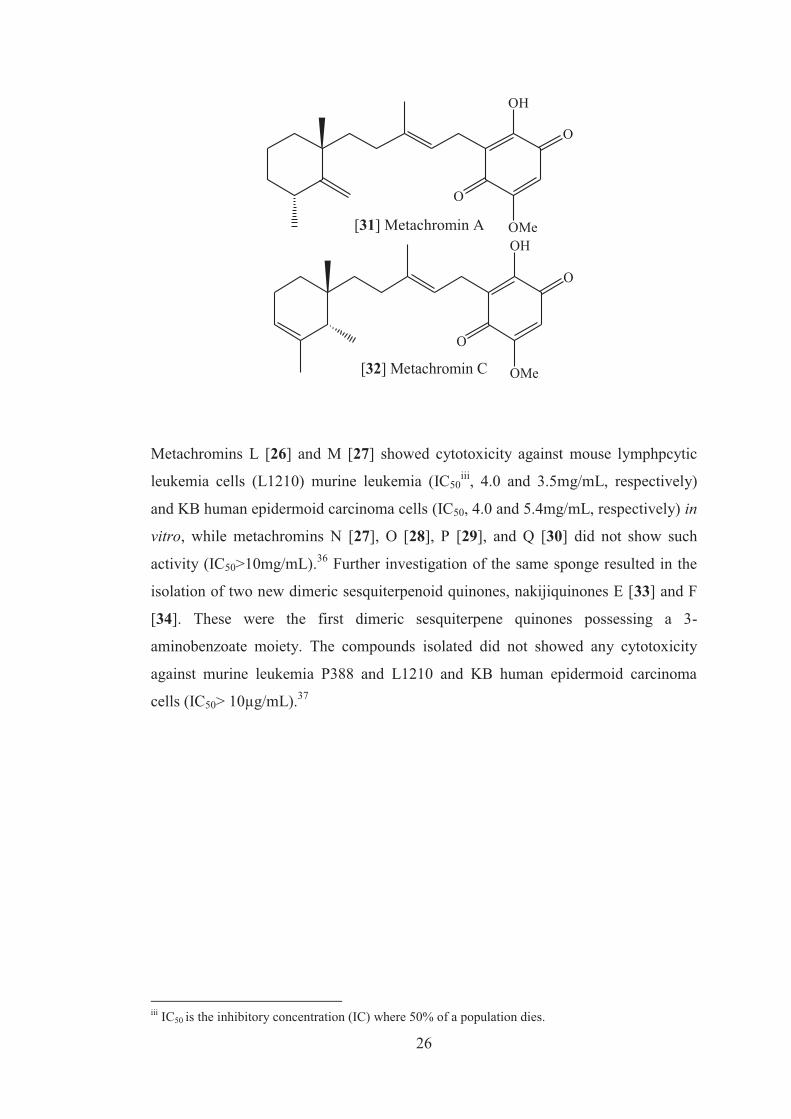
Metachromins L [26] and M [27] showed cytotoxicity against mouse lymphpcytic
leukemia cells (L1210) murine leukemia (IC50iii, 4.0 and 3.5mg/mL, respectively)
and KB human epidermoid carcinoma cells (IC50, 4.0 and 5.4mg/mL, respectively) in
vitro, while metachromins N [27], O [28], P [29], and Q [30] did not show such
activity (IC50>10mg/mL).36 Further investigation of the same sponge resulted in the
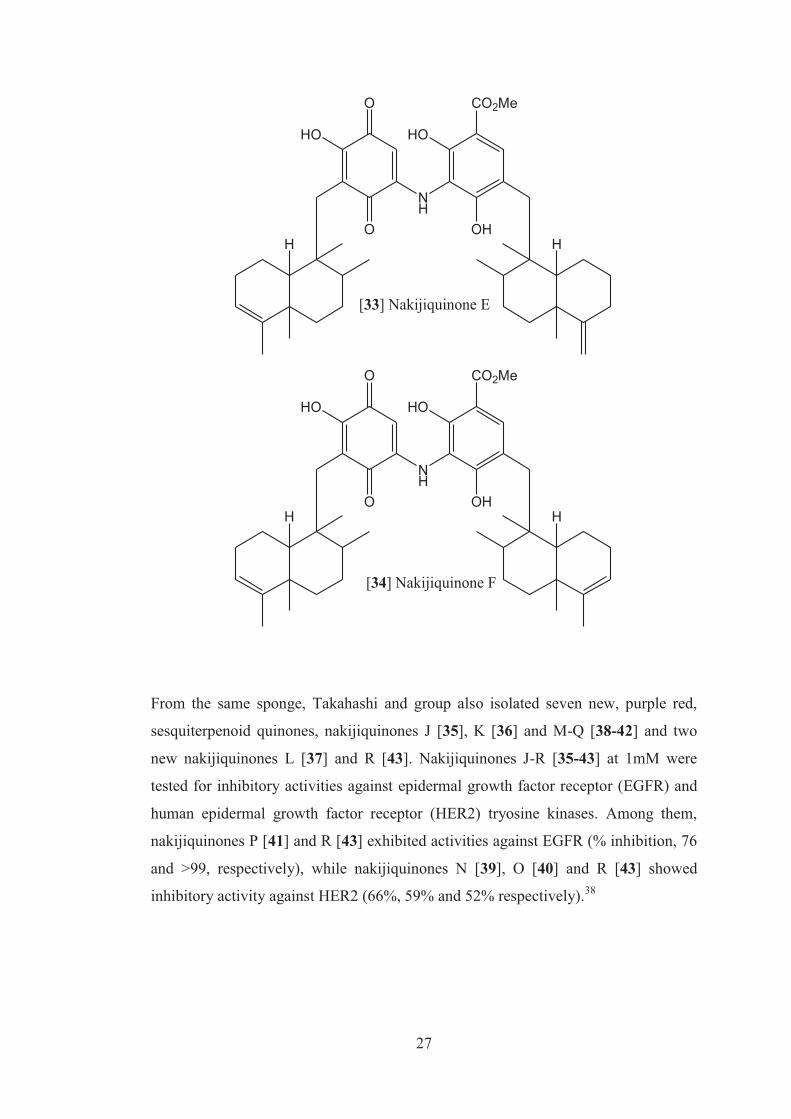
isolation of two new dimeric sesquiterpenoid quinones, nakijiquinones E [33] and F
[34]. These were the first dimeric sesquiterpene quinones possessing a 3-
aminobenzoate moiety. The compounds isolated did not showed any cytotoxicity
against murine leukemia P388 and L1210 and KB human epidermoid carcinoma
cells (IC50> 10µg/mL).37
iii IC50 is the inhibitory concentration (IC) where 50% of a population dies.
27
H
NH
HO
O CO2Me
OH
HOHO
[33] Nakijiquinone E
H
NH
HO
O CO2Me
OH
HOHO
[34] Nakijiquinone F
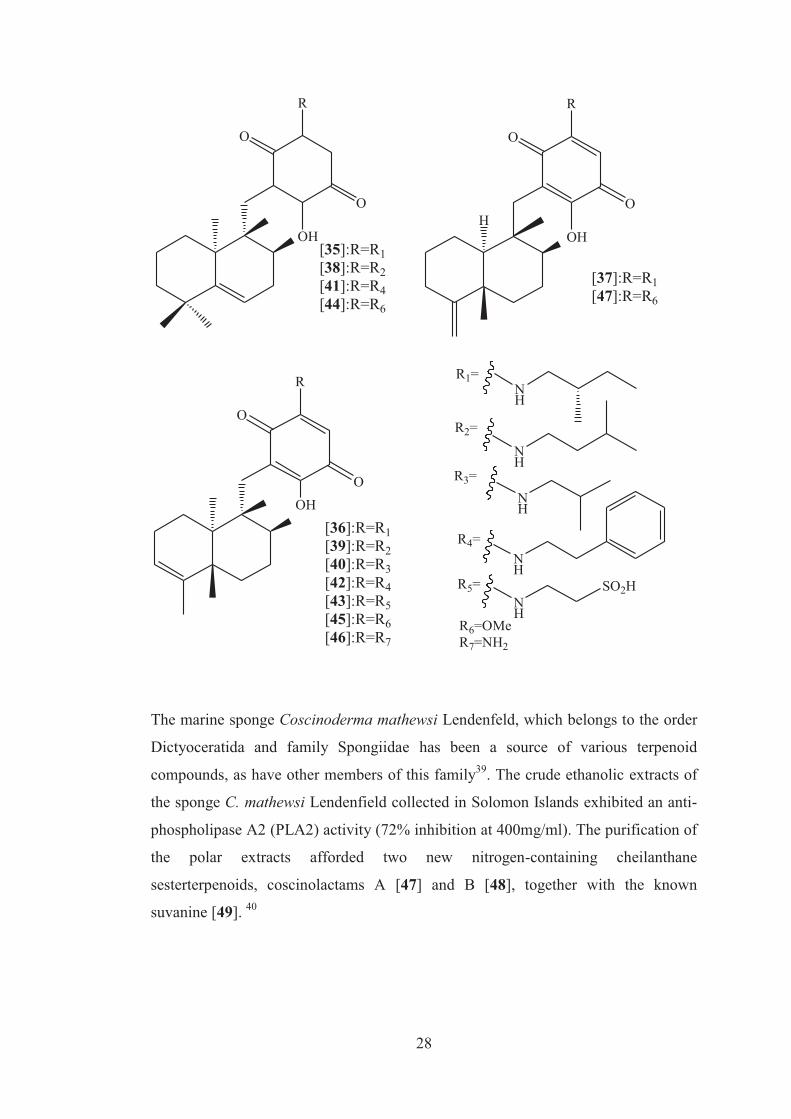
From the same sponge, Takahashi and group also isolated seven new, purple red,
sesquiterpenoid quinones, nakijiquinones J [35], K [36] and M-Q [38-42] and two
new nakijiquinones L [37] and R [43]. Nakijiquinones J-R [35-43] at 1mM were
tested for inhibitory activities against epidermal growth factor receptor (EGFR) and
human epidermal growth factor receptor (HER2) tryosine kinases. Among them,
nakijiquinones P [41] and R [43] exhibited activities against EGFR (% inhibition, 76
and >99, respectively), while nakijiquinones N [39], O [40] and R [43] showed
inhibitory activity against HER2 (66%, 59% and 52% respectively).38
28
O
O
R
OH
O
O
R
OH
[35]:R=R1[38]:R=R2[41]:R=R4[44]:R=R6
[36]:R=R1[39]:R=R2[40]:R=R3[42]:R=R4[43]:R=R5[45]:R=R6[46]:R=R7
R1=NH
NH
NH
NH
NH
SO2H
R6=OMeR7=NH2
R2=
R3=
R4=
R5=
OH
O
O
R
H
[37]:R=R1[47]:R=R6
The marine sponge Coscinoderma mathewsi Lendenfeld, which belongs to the order
Dictyoceratida and family Spongiidae has been a source of various terpenoid
compounds, as have other members of this family39. The crude ethanolic extracts of
the sponge C. mathewsi Lendenfield collected in Solomon Islands exhibited an anti-
phospholipase A2 (PLA2) activity (72% inhibition at 400mg/ml). The purification of
the polar extracts afforded two new nitrogen-containing cheilanthane
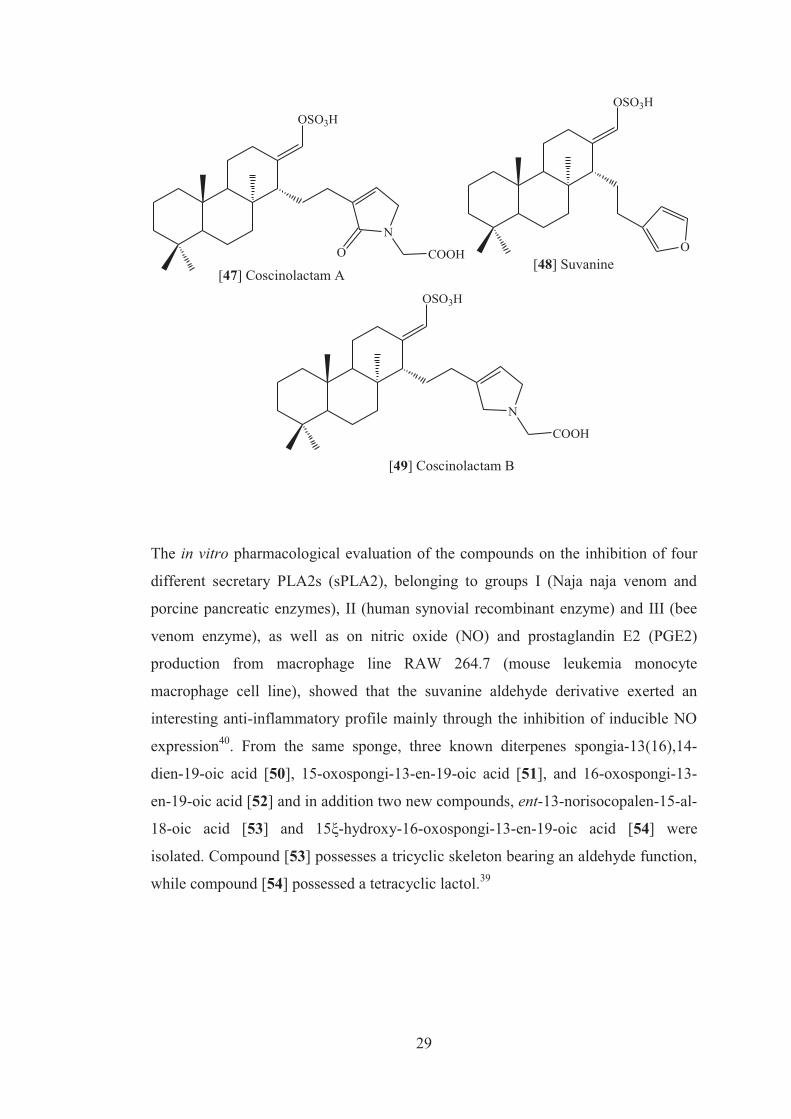
sesterterpenoids, coscinolactams A [47] and B [48], together with the known
suvanine [49]. 40
29
OSO3H
NO COOH
[47] Coscinolactam A
OSO3H
O[48] Suvanine
OSO3H
N
COOH
[49] Coscinolactam B
The in vitro pharmacological evaluation of the compounds on the inhibition of four
different secretary PLA2s (sPLA2), belonging to groups I (Naja naja venom and
porcine pancreatic enzymes), II (human synovial recombinant enzyme) and III (bee
venom enzyme), as well as on nitric oxide (NO) and prostaglandin E2 (PGE2)
production from macrophage line RAW 264.7 (mouse leukemia monocyte
macrophage cell line), showed that the suvanine aldehyde derivative exerted an
interesting anti-inflammatory profile mainly through the inhibition of inducible NO
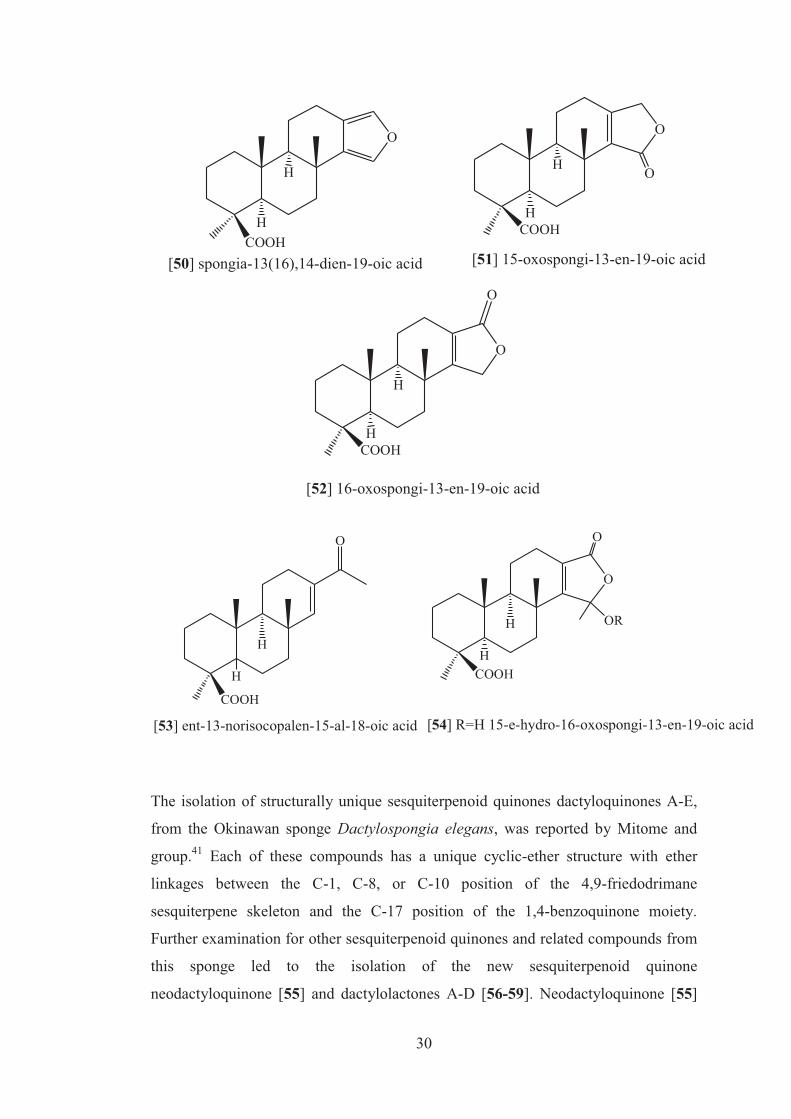
expression40. From the same sponge, three known diterpenes spongia-13(16),14-
dien-19-oic acid [50], 15-oxospongi-13-en-19-oic acid [51], and 16-oxospongi-13-
en-19-oic acid [52] and in addition two new compounds, ent-13-norisocopalen-15-al-
18-oic acid [53] and 15ξ-hydroxy-16-oxospongi-13-en-19-oic acid [54] were
isolated. Compound [53] possesses a tricyclic skeleton bearing an aldehyde function,
while compound [54] possessed a tetracyclic lactol.39
30
O
COOHH
H
O
O
HCOOH
H
O
HCOOH
H
O
[50] spongia-13(16),14-dien-19-oic acid [51] 15-oxospongi-13-en-19-oic acid
[52] 16-oxospongi-13-en-19-oic acid
COOH
H
O
O
COOH
HH
H
O
OR
[53] ent-13-norisocopalen-15-al-18-oic acid [54] R=H 15-e-hydro-16-oxospongi-13-en-19-oic acid
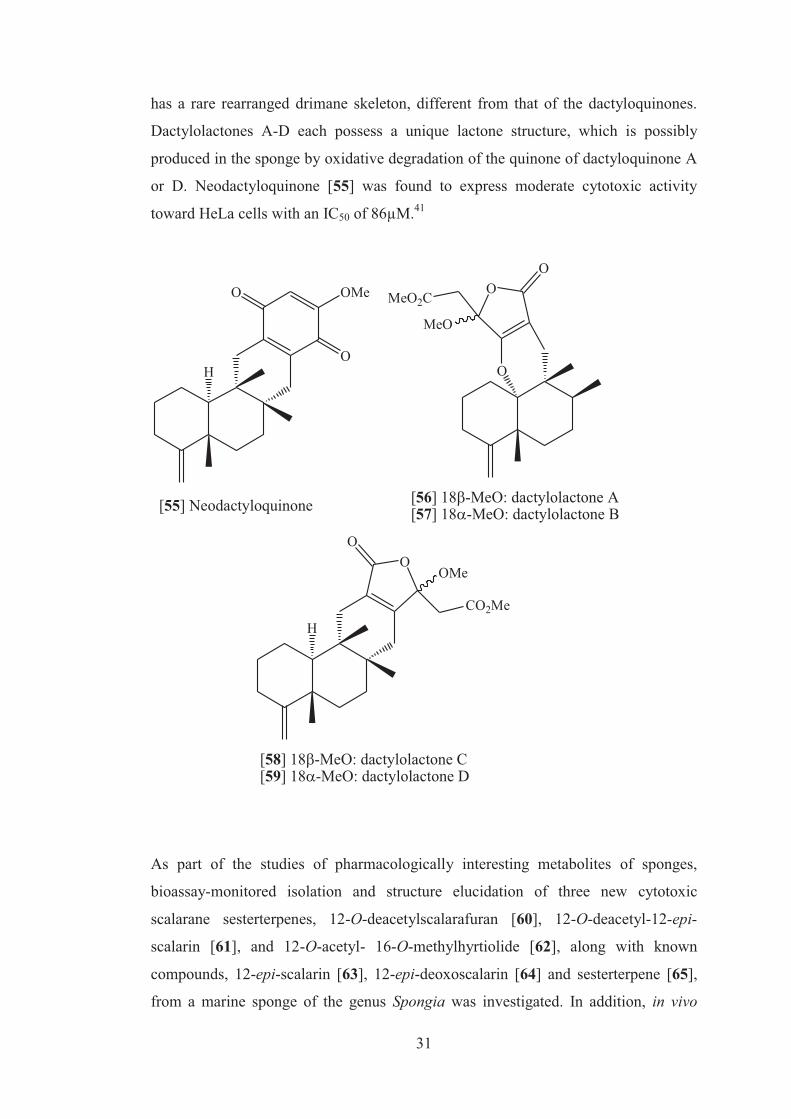
The isolation of structurally unique sesquiterpenoid quinones dactyloquinones A-E,
from the Okinawan sponge Dactylospongia elegans, was reported by Mitome and
group.41 Each of these compounds has a unique cyclic-ether structure with ether
linkages between the C-1, C-8, or C-10 position of the 4,9-friedodrimane
sesquiterpene skeleton and the C-17 position of the 1,4-benzoquinone moiety.
Further examination for other sesquiterpenoid quinones and related compounds from
this sponge led to the isolation of the new sesquiterpenoid quinone
neodactyloquinone [55] and dactylolactones A-D [56-59]. Neodactyloquinone [55]
31
has a rare rearranged drimane skeleton, different from that of the dactyloquinones.
Dactylolactones A-D each possess a unique lactone structure, which is possibly
produced in the sponge by oxidative degradation of the quinone of dactyloquinone A
or D. Neodactyloquinone [55] was found to express moderate cytotoxic activity
toward HeLa cells with an IC50 of 86µM.41
HO
O OMe
[55] Neodactyloquinone
O
OO
MeO
MeO2C
[56] 18�-MeO: dactylolactone A [57] 18�-MeO: dactylolactone B
H
OO
CO2Me
OMe
[58] 18�-MeO: dactylolactone C [59] 18�-MeO: dactylolactone D
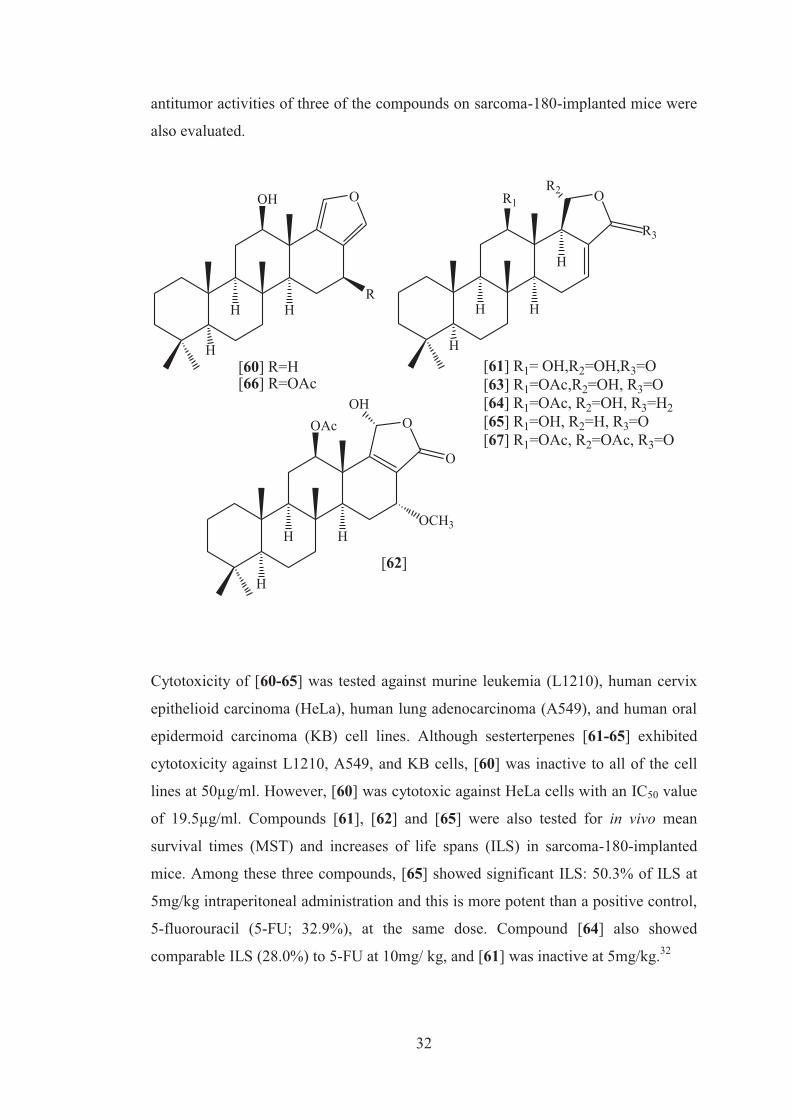
As part of the studies of pharmacologically interesting metabolites of sponges,
bioassay-monitored isolation and structure elucidation of three new cytotoxic
scalarane sesterterpenes, 12-O-deacetylscalarafuran [60], 12-O-deacetyl-12-epi-
scalarin [61], and 12-O-acetyl- 16-O-methylhyrtiolide [62], along with known
compounds, 12-epi-scalarin [63], 12-epi-deoxoscalarin [64] and sesterterpene [65],
from a marine sponge of the genus Spongia was investigated. In addition, in vivo
32
antitumor activities of three of the compounds on sarcoma-180-implanted mice were
also evaluated.
OOH
R
H
H H
[60] R=H[66] R=OAc
OR1
H
H H
H
R2
R3
[61] R1= OH,R2=OH,R3=O[63] R1=OAc,R2=OH, R3=O[64] R1=OAc, R2=OH, R3=H2[65] R1=OH, R2=H, R3=O[67] R1=OAc, R2=OAc, R3=O
O
O
OAc
H
H H
OH
OCH3
[62]
Cytotoxicity of [60-65] was tested against murine leukemia (L1210), human cervix
epithelioid carcinoma (HeLa), human lung adenocarcinoma (A549), and human oral
epidermoid carcinoma (KB) cell lines. Although sesterterpenes [61-65] exhibited
cytotoxicity against L1210, A549, and KB cells, [60] was inactive to all of the cell
lines at 50µg/ml. However, [60] was cytotoxic against HeLa cells with an IC50 value
of 19.5µg/ml. Compounds [61], [62] and [65] were also tested for in vivo mean
survival times (MST) and increases of life spans (ILS) in sarcoma-180-implanted
mice. Among these three compounds, [65] showed significant ILS: 50.3% of ILS at
5mg/kg intraperitoneal administration and this is more potent than a positive control,
5-fluorouracil (5-FU; 32.9%), at the same dose. Compound [64] also showed
comparable ILS (28.0%) to 5-FU at 10mg/ kg, and [61] was inactive at 5mg/kg.32
33
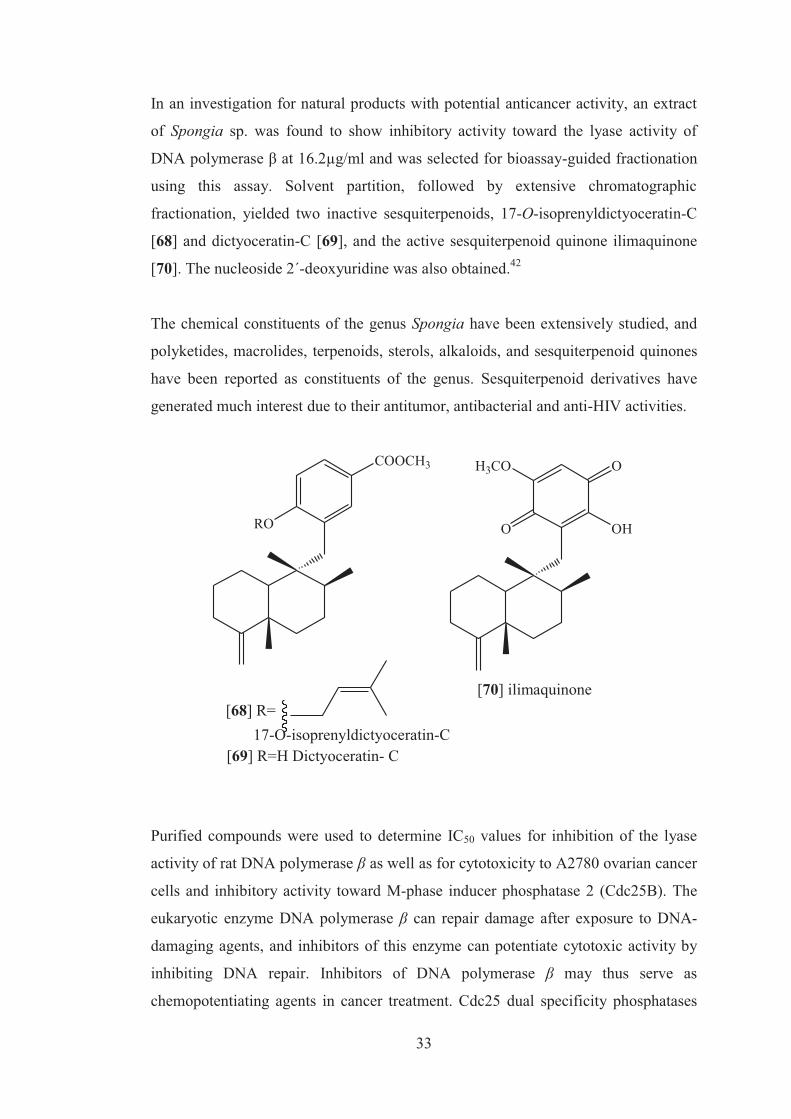
In an investigation for natural products with potential anticancer activity, an extract
of Spongia sp. was found to show inhibitory activity toward the lyase activity of
DNA polymerase β at 16.2µg/ml and was selected for bioassay-guided fractionation
using this assay. Solvent partition, followed by extensive chromatographic
fractionation, yielded two inactive sesquiterpenoids, 17-O-isoprenyldictyoceratin-C
[68] and dictyoceratin-C [69], and the active sesquiterpenoid quinone ilimaquinone
[70]. The nucleoside 2΄-deoxyuridine was also obtained.42
The chemical constituents of the genus Spongia have been extensively studied, and
polyketides, macrolides, terpenoids, sterols, alkaloids, and sesquiterpenoid quinones
have been reported as constituents of the genus. Sesquiterpenoid derivatives have
generated much interest due to their antitumor, antibacterial and anti-HIV activities.
RO
COOCH3
O
OH3CO
OH
[68] R=
[69] R=H Dictyoceratin- C
[70] ilimaquinone
17-O-isoprenyldictyoceratin-C
Purified compounds were used to determine IC50 values for inhibition of the lyase
activity of rat DNA polymerase β as well as for cytotoxicity to A2780 ovarian cancer
cells and inhibitory activity toward M-phase inducer phosphatase 2 (Cdc25B). The
eukaryotic enzyme DNA polymerase β can repair damage after exposure to DNA-
damaging agents, and inhibitors of this enzyme can potentiate cytotoxic activity by
inhibiting DNA repair. Inhibitors of DNA polymerase β may thus serve as
chemopotentiating agents in cancer treatment. Cdc25 dual specificity phosphatases
34
play central roles in cell proliferation by removing the inhibitory phosphates from the
ATP-binding site Tyr and/or Thr of the Cdk, thus activating cell cycle specific
Cdk/cyclin complexes. Inhibitors of Cdc25 are thus attractive candidates for potential
anticancer drugs. Compounds [68] and [69] and 2΄-deoxyuridine were inactive in all
three assays at the highest concentrations tested, but compound [70] was active as an
inhibitor of the lyase activity of DNA polymerase β, with an IC50 value of 45.2µM. It
was also weakly active as an inhibitor of Cdc25B, with an IC50 of 92µM, which is a
property shared by some other para quinones. Compound [70] has been reported to
have micromolar cytotoxicity to P-388, KB-16, and A-549 cells, and consistent with
this, it also showed moderate cytotoxicity to A2780 cells with an IC50 of 10.9µM.42
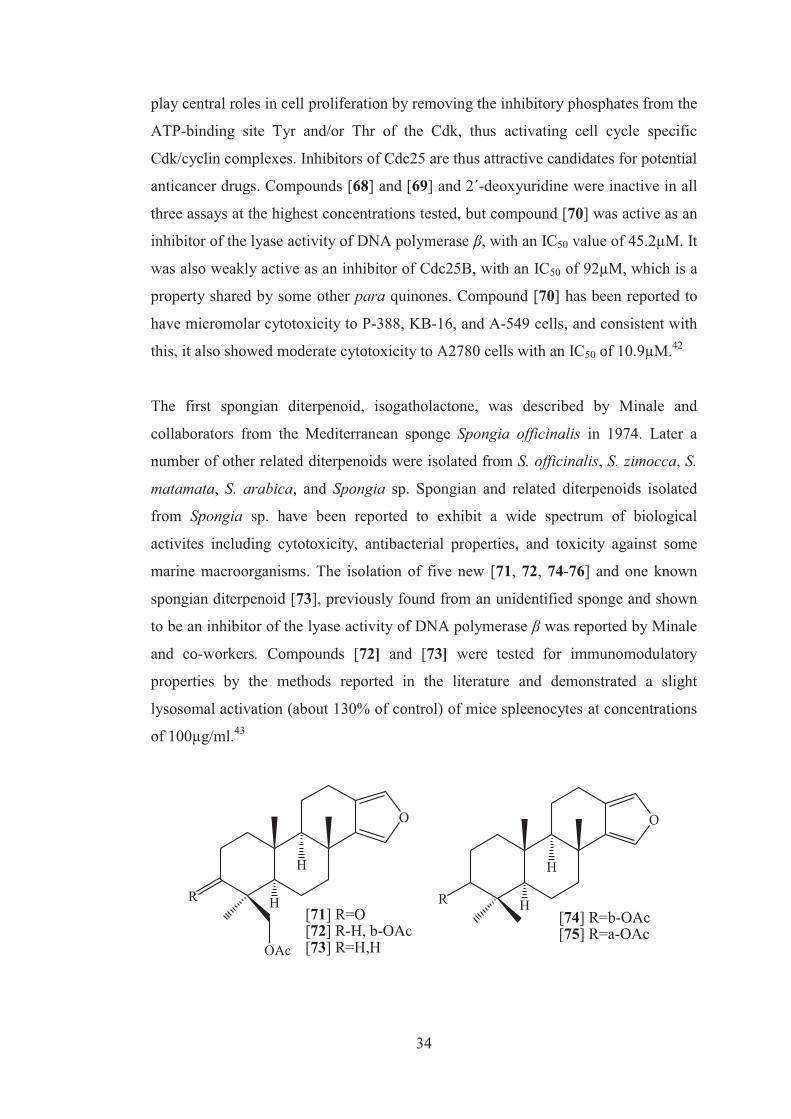
The first spongian diterpenoid, isogatholactone, was described by Minale and
collaborators from the Mediterranean sponge Spongia officinalis in 1974. Later a
number of other related diterpenoids were isolated from S. officinalis, S. zimocca, S.
matamata, S. arabica, and Spongia sp. Spongian and related diterpenoids isolated
from Spongia sp. have been reported to exhibit a wide spectrum of biological
activites including cytotoxicity, antibacterial properties, and toxicity against some
marine macroorganisms. The isolation of five new [71, 72, 74-76] and one known
spongian diterpenoid [73], previously found from an unidentified sponge and shown
to be an inhibitor of the lyase activity of DNA polymerase β was reported by Minale
and co-workers. Compounds [72] and [73] were tested for immunomodulatory
properties by the methods reported in the literature and demonstrated a slight
lysosomal activation (about 130% of control) of mice spleenocytes at concentrations
of 100µg/ml.43
O
H
R
OAc
H
O
H
R H[71] R=O[72] R-H, b-OAc[73] R=H,H
[74] R=b-OAc[75] R=a-OAc
35
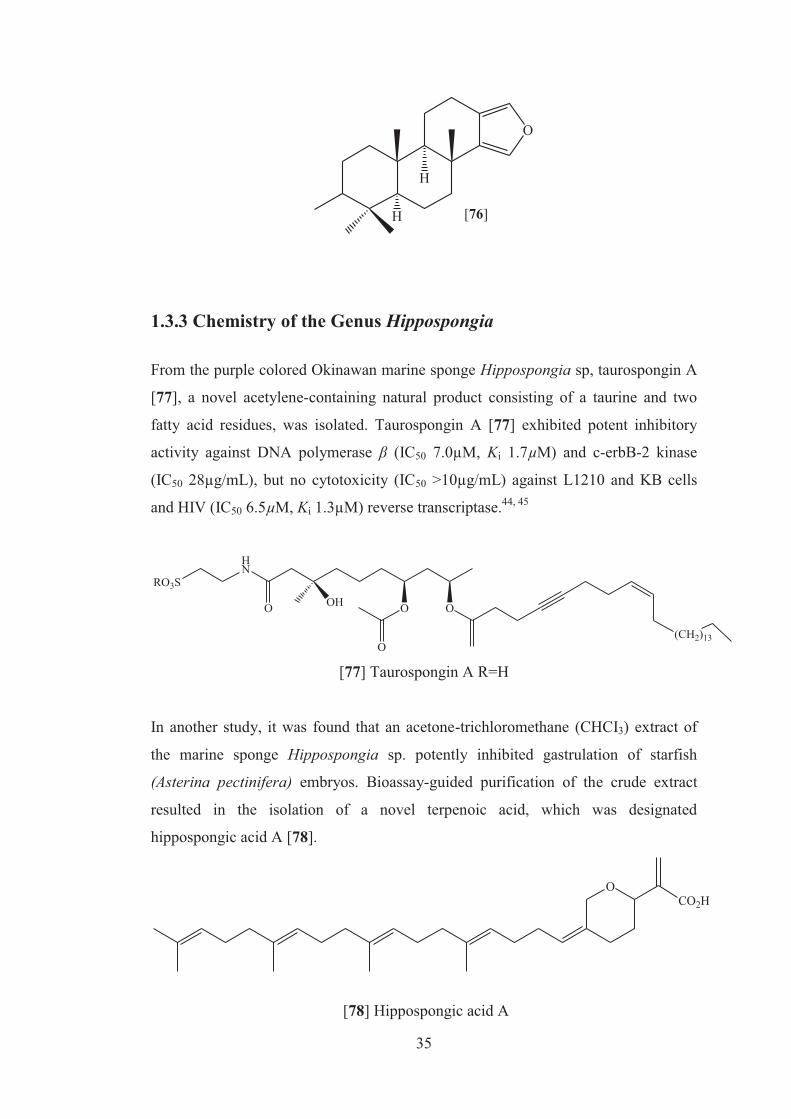
O
H
H [76]
1.3.3 Chemistry of the Genus Hippospongia From the purple colored Okinawan marine sponge Hippospongia sp, taurospongin A
[77], a novel acetylene-containing natural product consisting of a taurine and two
fatty acid residues, was isolated. Taurospongin A [77] exhibited potent inhibitory
activity against DNA polymerase β (IC50 7.0µM, Ki 1.7µM) and c-erbB-2 kinase
(IC50 28µg/mL), but no cytotoxicity (IC50 >10µg/mL) against L1210 and KB cells
and HIV (IC50 6.5µM, Ki 1.3µM) reverse transcriptase.44, 45
RO3S
HN
O OH O O
O(CH2)13
[77] Taurospongin A R=H
In another study, it was found that an acetone-trichloromethane (CHCI3) extract of
the marine sponge Hippospongia sp. potently inhibited gastrulation of starfish
(Asterina pectinifera) embryos. Bioassay-guided purification of the crude extract
resulted in the isolation of a novel terpenoic acid, which was designated
hippospongic acid A [78].
OCO2H
[78] Hippospongic acid A
36
When fertilized starfish eggs were cultured from fertilization in the presence of
hippospongic acid A at a concentration of 14µmol/l or greater, they blastulated
normally after passing through a rapid cleavage period, and hatched on schedule; the
gastrulation was selectively inhibited, however. Furthermore, hippospongic acid A
affected neither fertilization of starfish gametes nor early embryonic development of
fertilized eggs up to the pre-gastrula stage even at the concentration of 1l0µmol/l.46
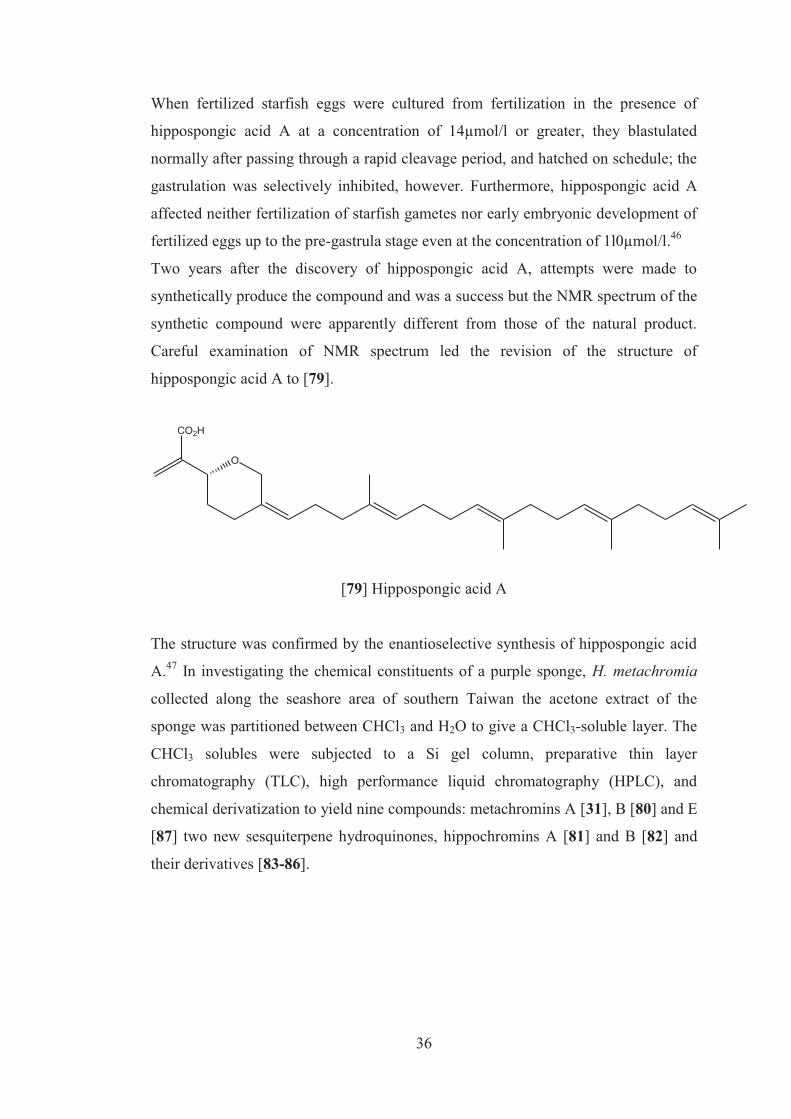
Two years after the discovery of hippospongic acid A, attempts were made to
synthetically produce the compound and was a success but the NMR spectrum of the
synthetic compound were apparently different from those of the natural product.
Careful examination of NMR spectrum led the revision of the structure of
hippospongic acid A to [79].
CO2H
O
[79] Hippospongic acid A
The structure was confirmed by the enantioselective synthesis of hippospongic acid
A.47 In investigating the chemical constituents of a purple sponge, H. metachromia
collected along the seashore area of southern Taiwan the acetone extract of the
sponge was partitioned between CHCl3 and H2O to give a CHCl3-soluble layer. The
CHCl3 solubles were subjected to a Si gel column, preparative thin layer
chromatography (TLC), high performance liquid chromatography (HPLC), and
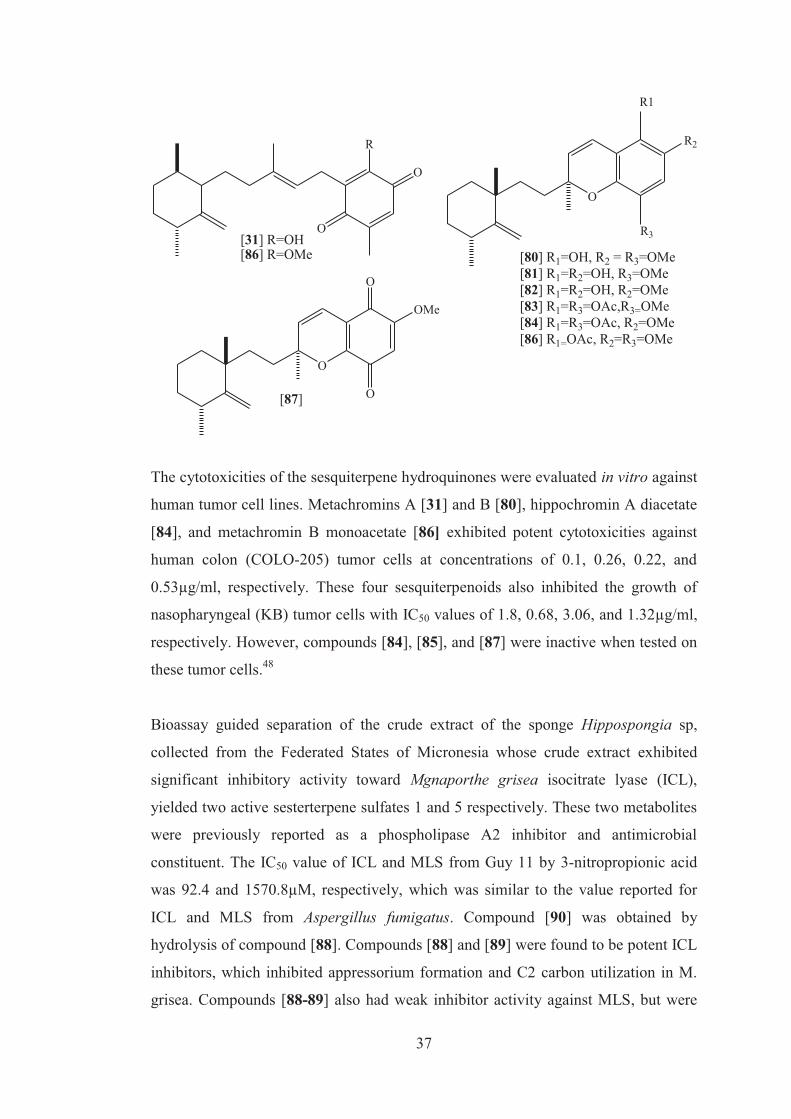
chemical derivatization to yield nine compounds: metachromins A [31], B [80] and E
[87] two new sesquiterpene hydroquinones, hippochromins A [81] and B [82] and
their derivatives [83-86].
37
R
O
O[31] R=OH[86] R=OMe
O
R2
R1
R3
[80] R1=OH, R2 = R3=OMe[81] R1=R2=OH, R3=OMe[82] R1=R2=OH, R2=OMe[83] R1=R3=OAc,R3=OMe[84] R1=R3=OAc, R2=OMe[86] R1=OAc, R2=R3=OMe
O
OMe
O
O[87]
The cytotoxicities of the sesquiterpene hydroquinones were evaluated in vitro against
human tumor cell lines. Metachromins A [31] and B [80], hippochromin A diacetate
[84], and metachromin B monoacetate [86] exhibited potent cytotoxicities against
human colon (COLO-205) tumor cells at concentrations of 0.1, 0.26, 0.22, and
0.53µg/ml, respectively. These four sesquiterpenoids also inhibited the growth of
nasopharyngeal (KB) tumor cells with IC50 values of 1.8, 0.68, 3.06, and 1.32µg/ml,
respectively. However, compounds [84], [85], and [87] were inactive when tested on
these tumor cells.48
Bioassay guided separation of the crude extract of the sponge Hippospongia sp,
collected from the Federated States of Micronesia whose crude extract exhibited
significant inhibitory activity toward Mgnaporthe grisea isocitrate lyase (ICL),
yielded two active sesterterpene sulfates 1 and 5 respectively. These two metabolites
were previously reported as a phospholipase A2 inhibitor and antimicrobial
constituent. The IC50 value of ICL and MLS from Guy 11 by 3-nitropropionic acid
was 92.4 and 1570.8µM, respectively, which was similar to the value reported for
ICL and MLS from Aspergillus fumigatus. Compound [90] was obtained by
hydrolysis of compound [88]. Compounds [88] and [89] were found to be potent ICL
inhibitors, which inhibited appressorium formation and C2 carbon utilization in M.
grisea. Compounds [88-89] also had weak inhibitor activity against MLS, but were
38
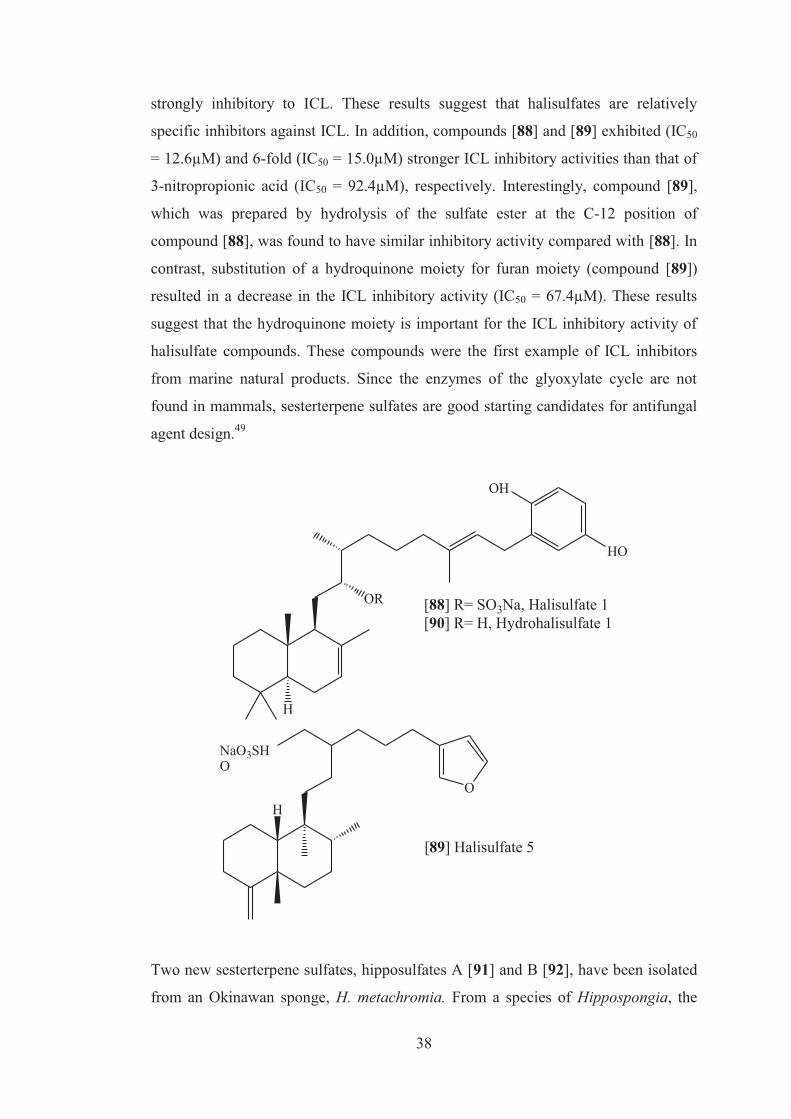
strongly inhibitory to ICL. These results suggest that halisulfates are relatively
specific inhibitors against ICL. In addition, compounds [88] and [89] exhibited (IC50
= 12.6µM) and 6-fold (IC50 = 15.0µM) stronger ICL inhibitory activities than that of
3-nitropropionic acid (IC50 = 92.4µM), respectively. Interestingly, compound [89],
which was prepared by hydrolysis of the sulfate ester at the C-12 position of
compound [88], was found to have similar inhibitory activity compared with [88]. In
contrast, substitution of a hydroquinone moiety for furan moiety (compound [89])
resulted in a decrease in the ICL inhibitory activity (IC50 = 67.4µM). These results
suggest that the hydroquinone moiety is important for the ICL inhibitory activity of
halisulfate compounds. These compounds were the first example of ICL inhibitors
from marine natural products. Since the enzymes of the glyoxylate cycle are not
found in mammals, sesterterpene sulfates are good starting candidates for antifungal
agent design.49
OH
HO
OR
H
[88] R= SO3Na, Halisulfate 1[90] R= H, Hydrohalisulfate 1
HO
NaO3SHO
[89] Halisulfate 5
Two new sesterterpene sulfates, hipposulfates A [91] and B [92], have been isolated
from an Okinawan sponge, H. metachromia. From a species of Hippospongia, the
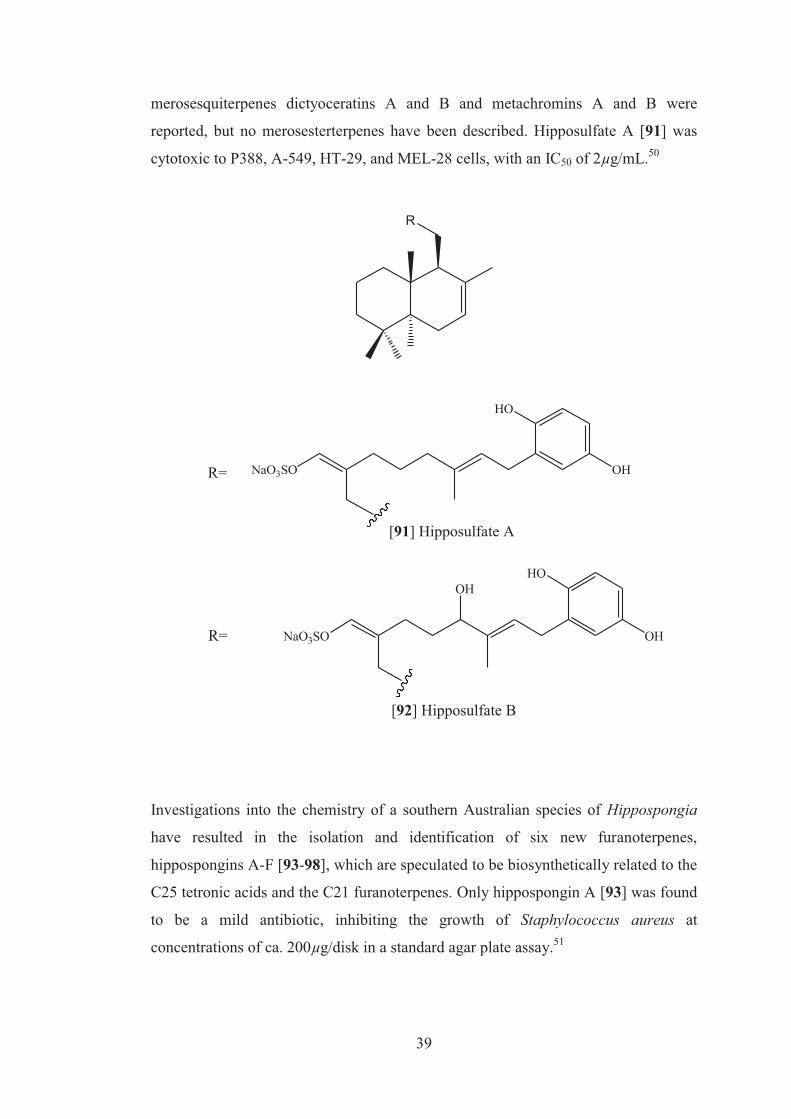
39
merosesquiterpenes dictyoceratins A and B and metachromins A and B were
reported, but no merosesterterpenes have been described. Hipposulfate A [91] was
cytotoxic to P388, A-549, HT-29, and MEL-28 cells, with an IC50 of 2µg/mL.50
R
NaO3SO OH
HO
R=
[91] Hipposulfate A
NaO3SO OH
HOOH
R=
[92] Hipposulfate B
Investigations into the chemistry of a southern Australian species of Hippospongia
have resulted in the isolation and identification of six new furanoterpenes,
hippospongins A-F [93-98], which are speculated to be biosynthetically related to the
C25 tetronic acids and the C21 furanoterpenes. Only hippospongin A [93] was found
to be a mild antibiotic, inhibiting the growth of Staphylococcus aureus at
concentrations of ca. 200µg/disk in a standard agar plate assay.51
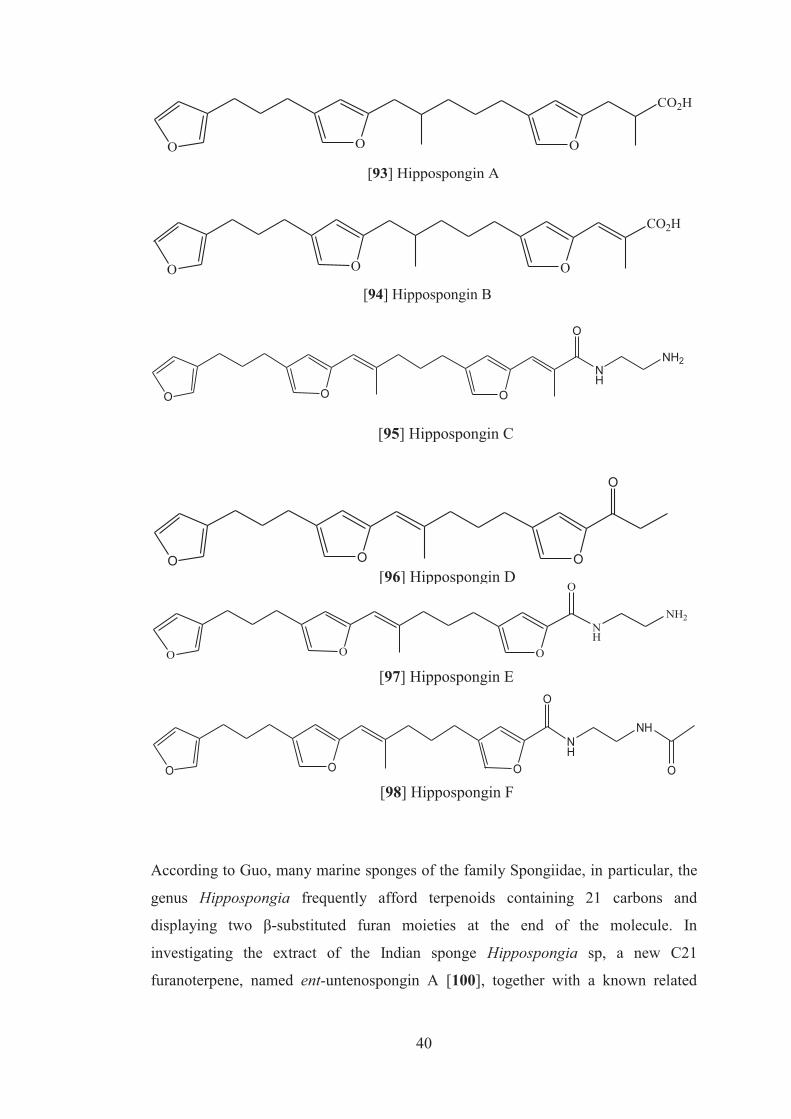
40
CO2H
O O O
[93] Hippospongin A
CO2H
O O O
[94] Hippospongin B
O O O
O
NH
NH2
O O O
O
NH
O O O
O
NH2
NH
O O O
O
NH
O
According to Guo, many marine sponges of the family Spongiidae, in particular, the
genus Hippospongia frequently afford terpenoids containing 21 carbons and
displaying two β-substituted furan moieties at the end of the molecule. In
investigating the extract of the Indian sponge Hippospongia sp, a new C21
furanoterpene, named ent-untenospongin A [100], together with a known related
[95] Hippospongin C
[96] Hippospongin D
[98] Hippospongin F
[97] Hippospongin E
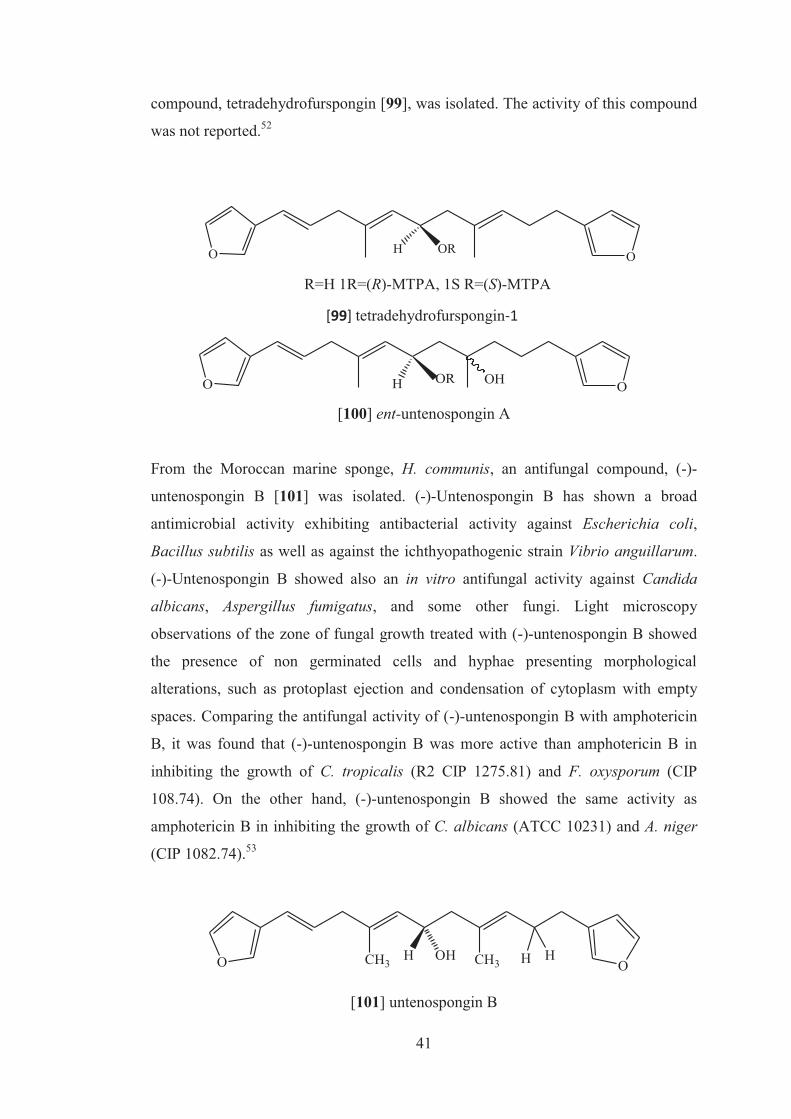
41
compound, tetradehydrofurspongin [99], was isolated. The activity of this compound
was not reported.52
O OH OR
R=H 1R=(R)-MTPA, 1S R=(S)-MTPA [99] tetradehydrofurspongin-1
O OH OR OH
[100] ent-untenospongin A
From the Moroccan marine sponge, H. communis, an antifungal compound, (-)-
untenospongin B [101] was isolated. (-)-Untenospongin B has shown a broad
antimicrobial activity exhibiting antibacterial activity against Escherichia coli,
Bacillus subtilis as well as against the ichthyopathogenic strain Vibrio anguillarum.
(-)-Untenospongin B showed also an in vitro antifungal activity against Candida
albicans, Aspergillus fumigatus, and some other fungi. Light microscopy
observations of the zone of fungal growth treated with (-)-untenospongin B showed
the presence of non germinated cells and hyphae presenting morphological
alterations, such as protoplast ejection and condensation of cytoplasm with empty
spaces. Comparing the antifungal activity of (-)-untenospongin B with amphotericin
B, it was found that (-)-untenospongin B was more active than amphotericin B in
inhibiting the growth of C. tropicalis (R2 CIP 1275.81) and F. oxysporum (CIP
108.74). On the other hand, (-)-untenospongin B showed the same activity as
amphotericin B in inhibiting the growth of C. albicans (ATCC 10231) and A. niger
(CIP 1082.74).53
O CH3 CH3 H HO
H OH
[101] untenospongin B
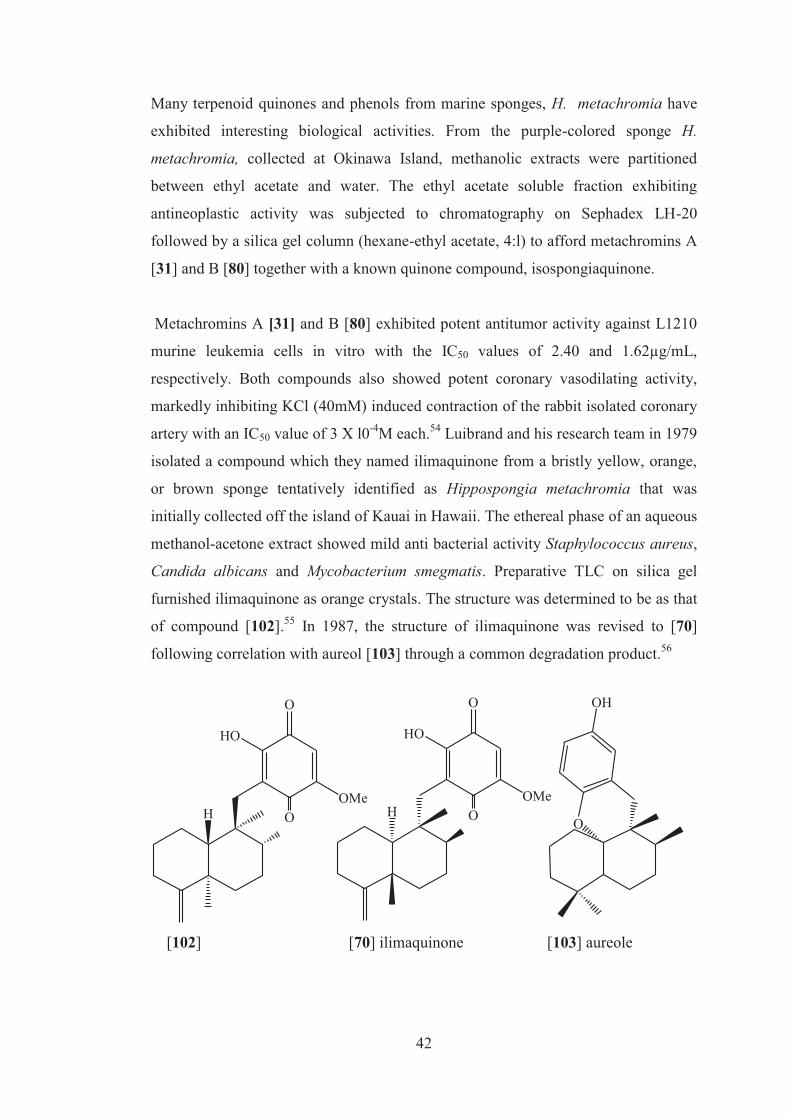
42
Many terpenoid quinones and phenols from marine sponges, H. metachromia have
exhibited interesting biological activities. From the purple-colored sponge H.
metachromia, collected at Okinawa Island, methanolic extracts were partitioned
between ethyl acetate and water. The ethyl acetate soluble fraction exhibiting
antineoplastic activity was subjected to chromatography on Sephadex LH-20
followed by a silica gel column (hexane-ethyl acetate, 4:l) to afford metachromins A
[31] and B [80] together with a known quinone compound, isospongiaquinone.
Metachromins A [31] and B [80] exhibited potent antitumor activity against L1210
murine leukemia cells in vitro with the IC50 values of 2.40 and 1.62µg/mL,
respectively. Both compounds also showed potent coronary vasodilating activity,
markedly inhibiting KCl (40mM) induced contraction of the rabbit isolated coronary
artery with an IC50 value of 3 X l0-4M each.54 Luibrand and his research team in 1979
isolated a compound which they named ilimaquinone from a bristly yellow, orange,
or brown sponge tentatively identified as Hippospongia metachromia that was
initially collected off the island of Kauai in Hawaii. The ethereal phase of an aqueous
methanol-acetone extract showed mild anti bacterial activity Staphylococcus aureus,
Candida albicans and Mycobacterium smegmatis. Preparative TLC on silica gel
furnished ilimaquinone as orange crystals. The structure was determined to be as that
of compound [102].55 In 1987, the structure of ilimaquinone was revised to [70]
following correlation with aureol [103] through a common degradation product.56
H
O
O
HO
OMeH
O
O
HO
OMe
O
OH
[102] [70] ilimaquinone [103] aureole
43
CHAPTER 2 METHODOLOGY
2.1 General Procedure The 1H NMR and 13C NMR spectra were recorded on a 400MHz and 125MHz
Varian spectrometer respectively while the 2D NMR spectra were recorded on a 400;
100MHz instrument. The NMR experiments for compound 1 were conducted in
CDCl3 and for compounds 2 and 3 they were conducted in CD3OD. The chemical
shifts are given on a δ (ppm) scale and were referenced to the residual solvent signals
(CDCl3; δH = 7.26ppm, δC = 77.0ppm and CD3OD; δH = 3.31ppm, δC = 49.0ppm).
The following abbreviations were recorded in the spectra: s = singlet, d = doublet, t =
triplet, q = quartet, m = multiplet, dd = doublet of doublets, bs = broad singlet, bd =
broad doublet. The MS spectra were recorded on a LTQ Orbitrap Discovery LC-
MS/MS spectrophotometer from Thermo Scientific. NMR measurements and LC-
MS analysis were done at University of Aberdeen, Scotland, United Kingdom while
all the other analyses were done at USP, Suva, Fiji. IR spectra were recorded with a
Perkin-Elmer spectrum 100 FT-IR spectrophotometer using KBr disc. UV spectra
were recorded with a Perkin-Elmer Lambda 25 UV/Vis spectrometer. The melting
point apparatus was used to take the melting point. Normal phase- thin layer
chromatography (TLC) was carried on Merck silica gel 60 F254 aluminum sheets
while Reverse Phase TLC was carried on Macherey-Nagel precoated TLC plates RP-
18W/UV254. TLC was visualized under the UV lamp at 254nm. Flash Column
Chromatography was carried out using Silica gel grade 922, 200-323 mesh as the
packing and n-hexane and ethyl acetate were used as the solvent system in a step-
wise gradient system for normal phase. For reverse phase vacuum liquid
chromatography (VLC), Bakerbond octadecyl (C18) 40µm prep LC packing was used
as the stationary phase with methanol-water as the solvent system. High Performance
Liquid Chromatography (HPLC) was carried on a Waters 515 pump connected to a
Waters 2487 dual λ absorbance detector set at 254nm and the signals were recorded
on a Dual channel recorder. An Alltech Econosil C18 250 x 4.6mm column was used
for analytical HPLC while an Alltech Econosil C18 250 x 10mm column was used for
semi-prep HPLC work. All the solvents used for HPLC were of HPLC grade
whereas solvents for extraction, TLC and FCC were of analytical grade.
44
2.2 Isolation of bioactive compounds
2.2.1 Collection and identification of the specimen
The animal material was collected near Kia Island off Labasa, Fiji (16° 10' 57S and
179° 03' 11E). The sample was abundant at 10-25m on coral/rock at walls. The
specimen was brown grey in color with the texture being rough and hard. It was
porous with plenty of oscules ranging from 1-7mm in diameter. The animal was
identified as a sponge, belonging to the Genus Hippospongia, by Mary Kay Harper, a
visiting taxonomist from the University of Utah, USA. A voucher specimen was also
deposited at the Marine Reference Collection; USP with the ID, FJ05-097. The
sample was stored at -20°C prior to workup.
2.2.2 Extraction, isolation and purification
This project was divided into three stages: stage 1 was extraction and solvent
partitioning, stage 2 involved the use of chromatographic techniques (such as column
chromatography, TLC and HPLC) to isolate the active compound(s) while the third
stage was to purify, check the purity and to get spectral data to characterize the active
compound(s). At each step, the activity of the extracts was tested using the Brine
Shrimp Assay as a guide to isolate the active principle. Thus this project used the
bioassay guided fractionation approach to isolate the active principles.
2.2.3 Extraction and solvent partitioning
The sponge was successively extracted three times with methanol (MeOH) and once
with dichloromethane (DCM) at room temperature. The extracts were combined and
the solvent removed under reduced pressure to yield 23g of the crude extract. A
portion of this crude extract (10g) was dissolved in MeOH and diluted with water
and partitioned (3x) with DCM in a 1L separating funnel. DCM was evaporated
45
under reduced pressure and the residue was re-dissolved in 90% aqueous MeOH and
was partitioned against n-hexane until the n-hexane layer was colorless. Hexane was
removed under reduced pressure and the residue as FH while the MeOH fraction was
adjusted to 50% aqueous MeOH and was extracted three times with DCM. MeOH
and DCM were also evaporated under reduced pressure and labeled as FM and FD
respectively. The water fraction was extracted with secondary butanol, which was
then rotovaped and the residue was named WB. Each of these fractions was tested
for Brine Shrimp Bioassay. The summary of the isolation protocol is given below
(Figure 2-1).
2.2.4 Chromatography and purification
2.2.4.1 Isolation of Compound 1
The brine shrimp active hexane fraction (FJ05-097FH) (1.59g) was subjected to
normal phase step-wise gradient flash column chromatography (Silica gel grade
922,200-325 mesh) with hexane-ethyl acetate gradient as eluant (hexane with
increasing amount of ethyl acetate) to afford 11 sub-fractions. All these fractions
were tested for activity against brine shrimps. The brine shrimp active sub-fraction 4
(FJ05-097FHF4) (500mg), eluted with 80% hexane-ethyl acetate was then subjected
to reverse phase High Performance Liquid Chromatography (RP-HPLC) on an
analytical column, Econosil C18 10µ, length 250mm and ID 4.6mm, using a mixture
of 80% acetonitrile-water as the mobile phase which gave optimum resolution. The
flow rate of the pump was set at 1ml/min. Having determined the mobile phase,
semi-prep HPLC was carried out on an Alltech Econosil C18 250 x 10mm column
with the flow rate at 3ml/min. The active principle FJ05-15-200FHF4H4 was
collected at the retention time of 15.5min.
The DCM fraction, FJ05-097 (0.497g), was also active to brine shrimp; therefore a
similar procedure as above was carried out to isolate the active principle. This
fraction was subjected to normal phase flash column chromatography and fraction 1
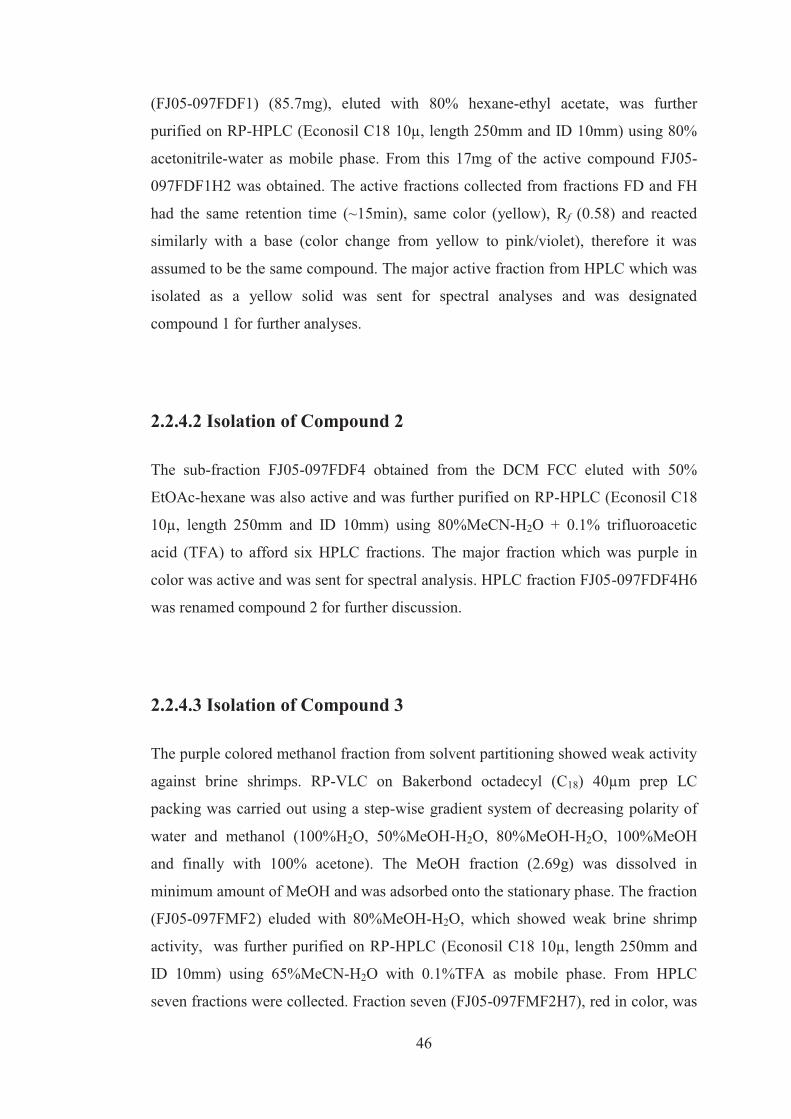
46
(FJ05-097FDF1) (85.7mg), eluted with 80% hexane-ethyl acetate, was further
purified on RP-HPLC (Econosil C18 10µ, length 250mm and ID 10mm) using 80%
acetonitrile-water as mobile phase. From this 17mg of the active compound FJ05-
097FDF1H2 was obtained. The active fractions collected from fractions FD and FH
had the same retention time (~15min), same color (yellow), Rf (0.58) and reacted
similarly with a base (color change from yellow to pink/violet), therefore it was
assumed to be the same compound. The major active fraction from HPLC which was
isolated as a yellow solid was sent for spectral analyses and was designated
compound 1 for further analyses.
2.2.4.2 Isolation of Compound 2 The sub-fraction FJ05-097FDF4 obtained from the DCM FCC eluted with 50%
EtOAc-hexane was also active and was further purified on RP-HPLC (Econosil C18
10µ, length 250mm and ID 10mm) using 80%MeCN-H2O + 0.1% trifluoroacetic
acid (TFA) to afford six HPLC fractions. The major fraction which was purple in
color was active and was sent for spectral analysis. HPLC fraction FJ05-097FDF4H6
was renamed compound 2 for further discussion.
2.2.4.3 Isolation of Compound 3 The purple colored methanol fraction from solvent partitioning showed weak activity
against brine shrimps. RP-VLC on Bakerbond octadecyl (C18) 40µm prep LC
packing was carried out using a step-wise gradient system of decreasing polarity of
water and methanol (100%H2O, 50%MeOH-H2O, 80%MeOH-H2O, 100%MeOH
and finally with 100% acetone). The MeOH fraction (2.69g) was dissolved in
minimum amount of MeOH and was adsorbed onto the stationary phase. The fraction
(FJ05-097FMF2) eluded with 80%MeOH-H2O, which showed weak brine shrimp
activity, was further purified on RP-HPLC (Econosil C18 10µ, length 250mm and
ID 10mm) using 65%MeCN-H2O with 0.1%TFA as mobile phase. From HPLC
seven fractions were collected. Fraction seven (FJ05-097FMF2H7), red in color, was
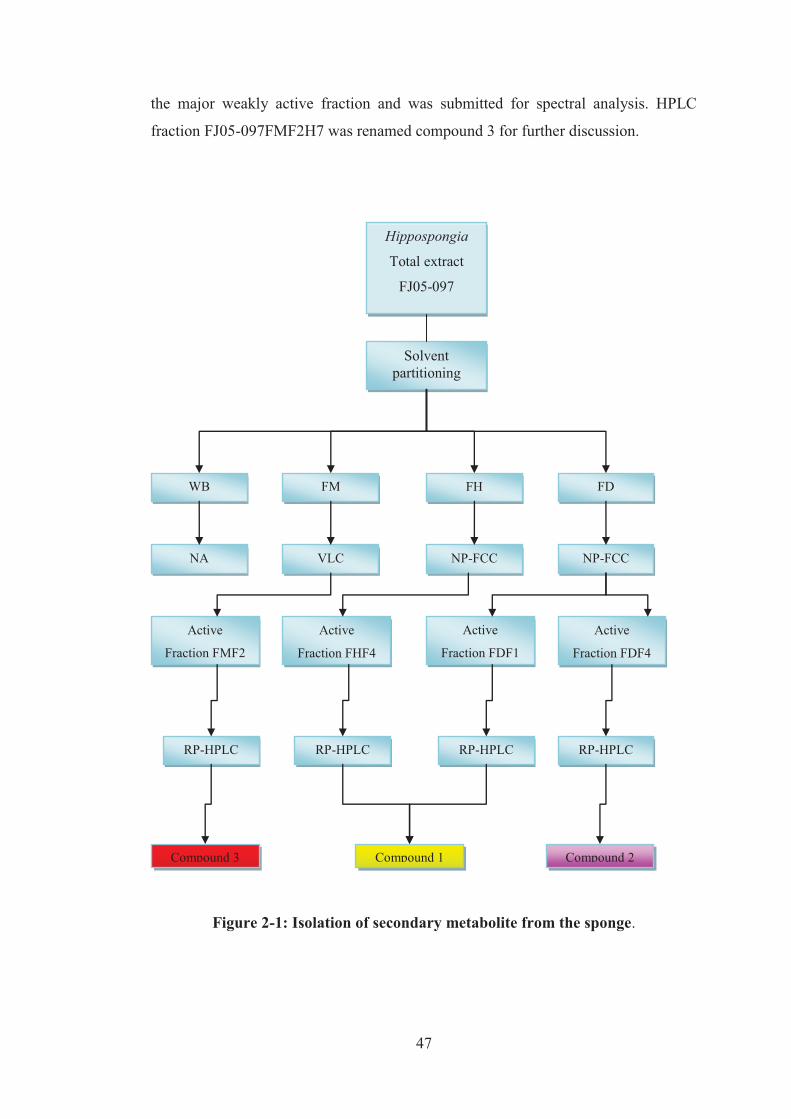
47
the major weakly active fraction and was submitted for spectral analysis. HPLC
fraction FJ05-097FMF2H7 was renamed compound 3 for further discussion.
Figure 2-1: Isolation of secondary metabolite from the sponge.
WB FM
Solvent partitioning
FD
Hippospongia
Total extract
FJ05-097
VLC NA NP-FCC NP-FCC
Active
Fraction FMF2
Active
Fraction FHF4
Active
Fraction FDF1
Active
Fraction FDF4
RP-HPLC RP-HPLC RP-HPLC RP-HPLC
Compound 1 Compound 2 Compound 3
FH
48
2.3 Bioassay
2.3.1 Brine shrimp bioassay
Brine shrimp bioassay is a simple method utilizing brine shrimp (Artemia salina) for
natural product research. This method is rapid, reliable, inexpensive and convenient
as an in-house general bioassay tool. Brine shrimps have been previously utilized in
various bioassay systems such as analysis of pesticide residue, mycotoxins,
morphine-like compounds and toxicants in marine environments.57 It has been
reported that the brine shrimp larvae can tolerate up to 11% of acetonitrile,
dimethylformamide, dimethylsulfoxide, ethanol, 2-propanol, methanol and
tetrahydrofuran.58
2.3.2 Hatching the eggs
The Golden fish Artemia cysts, brine shrimp eggs were obtained from Golden Ocean
Aquasupply Enterprise, Taiwan. Approximately 100mg of brine shrimp eggs were
weighed out and placed in a 250ml beaker. A volume of 200ml filtered seawater
(FSW) was added to it. An aerator was connected to the beaker to provide sufficient
aeration and to keep the eggs in circulation. The beaker was covered with aluminum
foil and was allowed to stand for 48 hours. A light source was also provided to keep
the surroundings warm. After 48 hrs the eggs hatched and were ready for the
bioassay.
2.3.3 Preparation of samples
The test samples were dissolved in appropriate amounts of FSW and if the sample
was not soluble in FSW it was dissolved in 10% of total volume of
dimethylsulfoxide (DMSO) and topped up with FSW. Once the first test
concentration was ready, serial dilutions were carried to prepare another two sets of
49
test concentrations. For instance, to prepare a first test concentration (highest
concentration of the sample in the 96-well plate) of 4000ppm, 8mg of the sample was
weighed in an eppendorf tube and dissolved in 1ml of FSW. The concentration of
this sample would be 8000ppm or 8mg/ml. To do serial dilutions, 500µl of this
sample would be transferred to another eppendorf tube which already had 500µl of
FSW diluting the sample by half (4000ppm) and so forth.
2.3.4 Cytotoxicity assay
The brine shrimp bioassay was carried out in 96-well plates and the tests were done
in triplicates. Approximately 7-14 adult shrimps, together with 100µl of filtered sea
water were pipetted out into each well. To these wells 100µl of the test sample was
added whereby further diluting the sample by 50%. Once all the samples were added
in the well, it was covered with a lid and the results were recorded after 24 hrs using
a light microscope. FSW was used as the negative control. The results were recorded
as number of dead shrimps over total number of brine shrimps in a particular well.
From these results, LD50iv of the samples were calculated to determine the toxicity of
the samples using the Reed Muench method.59 According to this method, a plot of
the number of the accumulated survivors and the number of accumulated deaths on
the same axes (number of animals vs. log dose) against log dose is constructed. The
two curves will cross at the dosage (i.e. log dose) where the number of survivors is
equal to the number of deaths. The intersection point is the dose that will kill 50% of
the animal and is known as LD50.
iv LD50: Lethal dosage where 50% of a population dies.
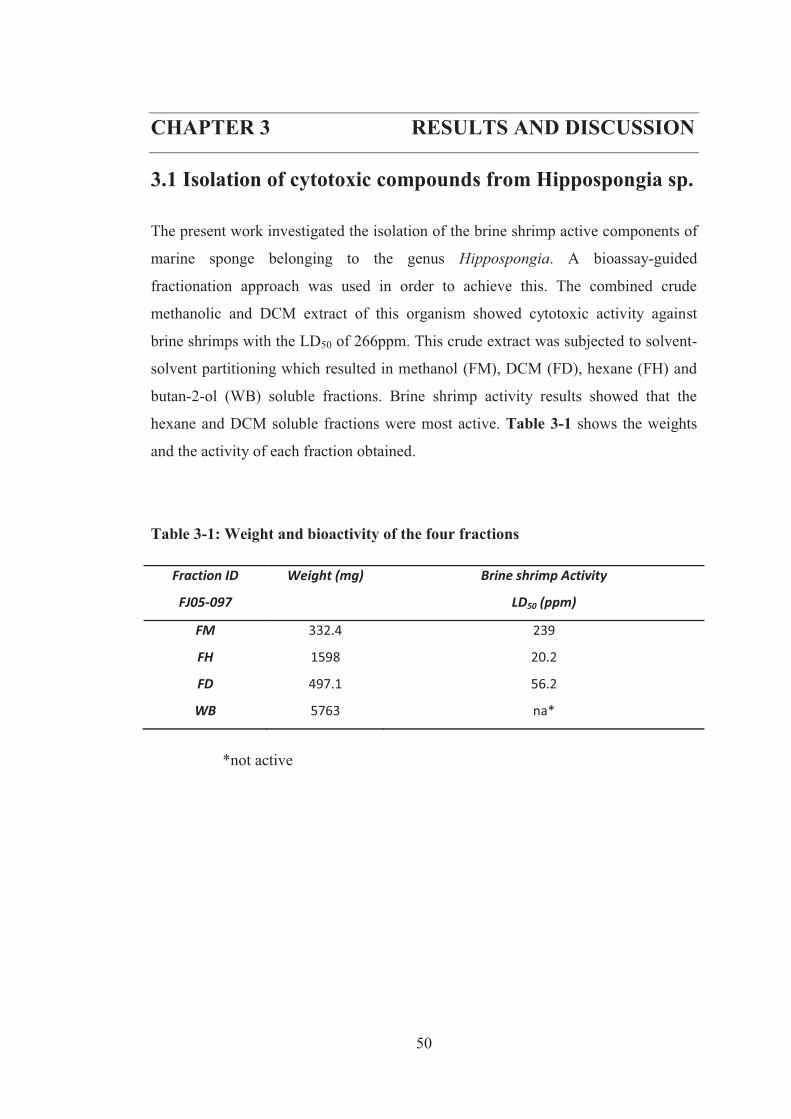
50
CHAPTER 3 RESULTS AND DISCUSSION
3.1 Isolation of cytotoxic compounds from Hippospongia sp. The present work investigated the isolation of the brine shrimp active components of
marine sponge belonging to the genus Hippospongia. A bioassay-guided
fractionation approach was used in order to achieve this. The combined crude
methanolic and DCM extract of this organism showed cytotoxic activity against
brine shrimps with the LD50 of 266ppm. This crude extract was subjected to solvent-
solvent partitioning which resulted in methanol (FM), DCM (FD), hexane (FH) and
butan-2-ol (WB) soluble fractions. Brine shrimp activity results showed that the
hexane and DCM soluble fractions were most active. Table 3-1 shows the weights
and the activity of each fraction obtained.
Table 3-1: Weight and bioactivity of the four fractions
Fraction ID
FJ05-097
Weight (mg) Brine shrimp Activity
LD50 (ppm)
FM 332.4 239
FH 1598 20.2
FD 497.1 56.2
WB 5763 na*
*not active
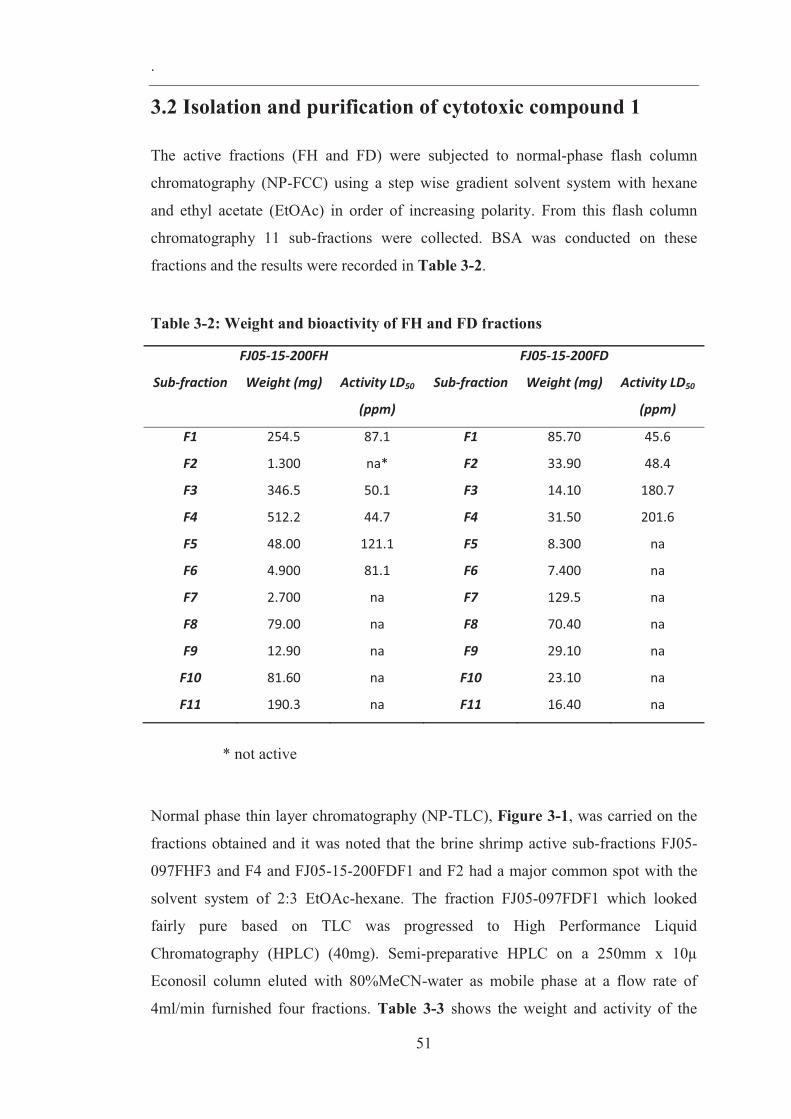
.
51
3.2 Isolation and purification of cytotoxic compound 1
The active fractions (FH and FD) were subjected to normal-phase flash column
chromatography (NP-FCC) using a step wise gradient solvent system with hexane
and ethyl acetate (EtOAc) in order of increasing polarity. From this flash column
chromatography 11 sub-fractions were collected. BSA was conducted on these
fractions and the results were recorded in Table 3-2.
Table 3-2: Weight and bioactivity of FH and FD fractions
FJ05-15-200FH FJ05-15-200FD
Sub-fraction Weight (mg) Activity LD50
(ppm)
Sub-fraction Weight (mg) Activity LD50
(ppm)
F1 254.5 87.1 F1 85.70 45.6
F2 1.300 na* F2 33.90 48.4
F3 346.5 50.1 F3 14.10 180.7
F4 512.2 44.7 F4 31.50 201.6
F5 48.00 121.1 F5 8.300 na
F6 4.900 81.1 F6 7.400 na
F7 2.700 na F7 129.5 na
F8 79.00 na F8 70.40 na
F9 12.90 na F9 29.10 na
F10 81.60 na F10 23.10 na
F11 190.3 na F11 16.40 na
* not active
Normal phase thin layer chromatography (NP-TLC), Figure 3-1, was carried on the
fractions obtained and it was noted that the brine shrimp active sub-fractions FJ05-
097FHF3 and F4 and FJ05-15-200FDF1 and F2 had a major common spot with the
solvent system of 2:3 EtOAc-hexane. The fraction FJ05-097FDF1 which looked
fairly pure based on TLC was progressed to High Performance Liquid
Chromatography (HPLC) (40mg). Semi-preparative HPLC on a 250mm x 10µ
Econosil column eluted with 80%MeCN-water as mobile phase at a flow rate of
4ml/min furnished four fractions. Table 3-3 shows the weight and activity of the
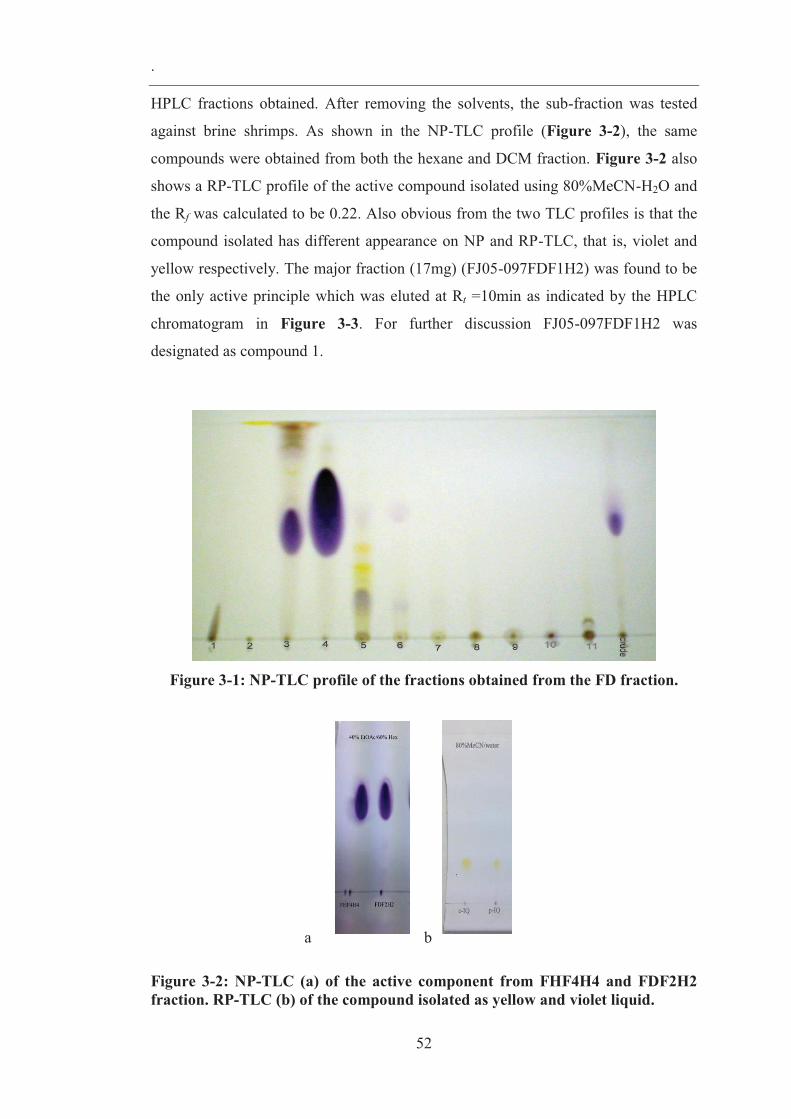
.
52
b
HPLC fractions obtained. After removing the solvents, the sub-fraction was tested
against brine shrimps. As shown in the NP-TLC profile (Figure 3-2), the same
compounds were obtained from both the hexane and DCM fraction. Figure 3-2 also
shows a RP-TLC profile of the active compound isolated using 80%MeCN-H2O and
the Rf was calculated to be 0.22. Also obvious from the two TLC profiles is that the
compound isolated has different appearance on NP and RP-TLC, that is, violet and
yellow respectively. The major fraction (17mg) (FJ05-097FDF1H2) was found to be
the only active principle which was eluted at Rt =10min as indicated by the HPLC
chromatogram in Figure 3-3. For further discussion FJ05-097FDF1H2 was
designated as compound 1.
Figure 3-1: NP-TLC profile of the fractions obtained from the FD fraction.
Figure 3-2: NP-TLC (a) of the active component from FHF4H4 and FDF2H2 fraction. RP-TLC (b) of the compound isolated as yellow and violet liquid.
a
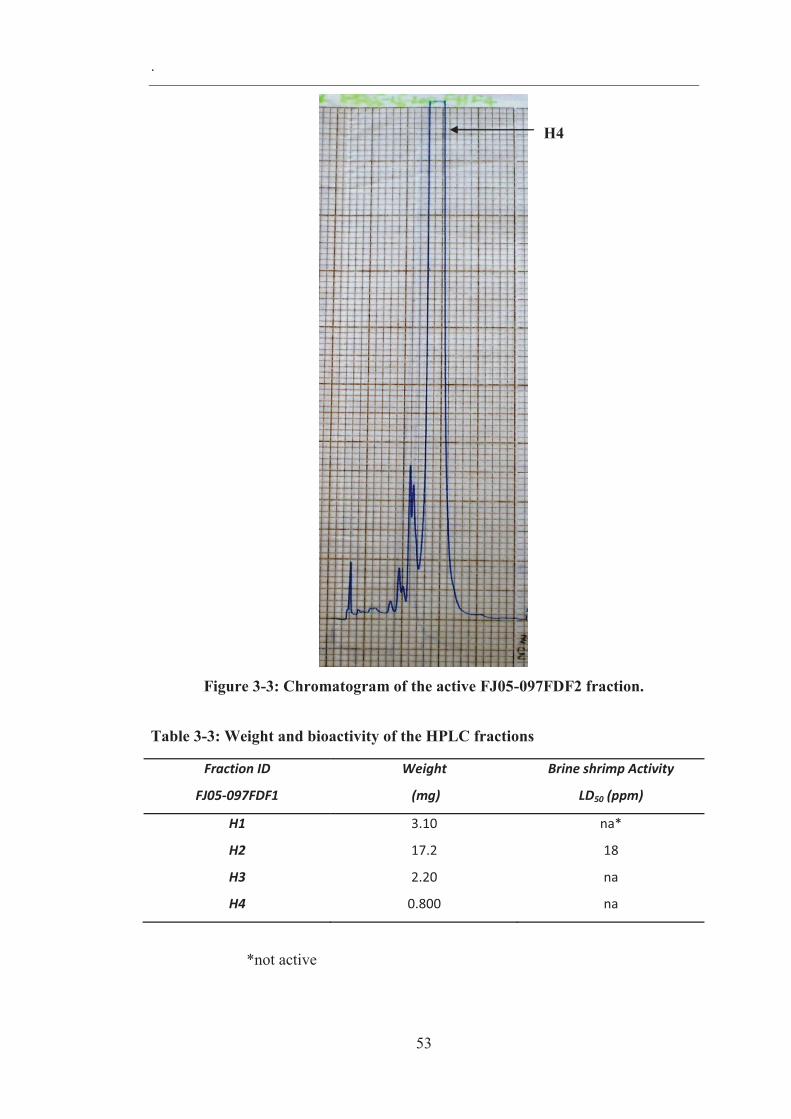
.
53
Figure 3-3: Chromatogram of the active FJ05-097FDF2 fraction.
Table 3-3: Weight and bioactivity of the HPLC fractions
Fraction ID
FJ05-097FDF1
Weight
(mg)
Brine shrimp Activity
LD50 (ppm)
H1 3.10 na*
H2 17.2 18
H3 2.20 na
H4 0.800 na
*not active
H4
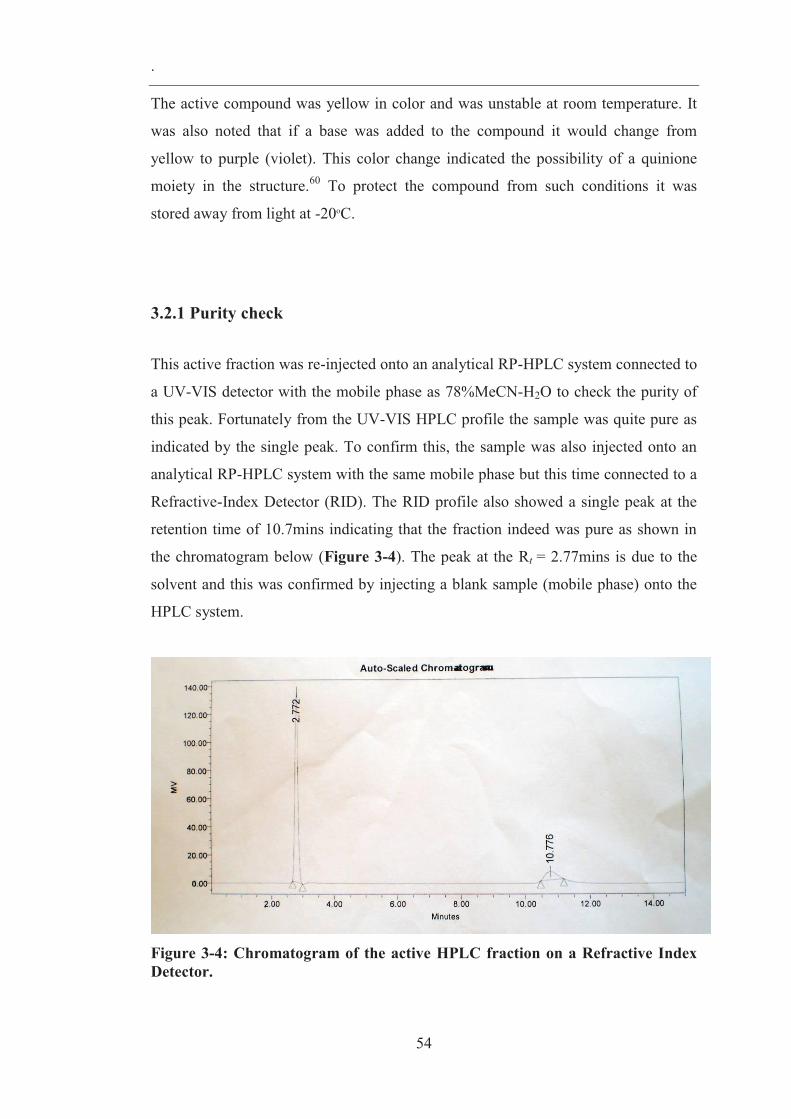
.
54
The active compound was yellow in color and was unstable at room temperature. It
was also noted that if a base was added to the compound it would change from
yellow to purple (violet). This color change indicated the possibility of a quinione
moiety in the structure.60 To protect the compound from such conditions it was
stored away from light at -20oC.
3.2.1 Purity check
This active fraction was re-injected onto an analytical RP-HPLC system connected to
a UV-VIS detector with the mobile phase as 78%MeCN-H2O to check the purity of
this peak. Fortunately from the UV-VIS HPLC profile the sample was quite pure as
indicated by the single peak. To confirm this, the sample was also injected onto an
analytical RP-HPLC system with the same mobile phase but this time connected to a
Refractive-Index Detector (RID). The RID profile also showed a single peak at the
retention time of 10.7mins indicating that the fraction indeed was pure as shown in
the chromatogram below (Figure 3-4). The peak at the Rt = 2.77mins is due to the
solvent and this was confirmed by injecting a blank sample (mobile phase) onto the
HPLC system.
Figure 3-4: Chromatogram of the active HPLC fraction on a Refractive Index Detector.
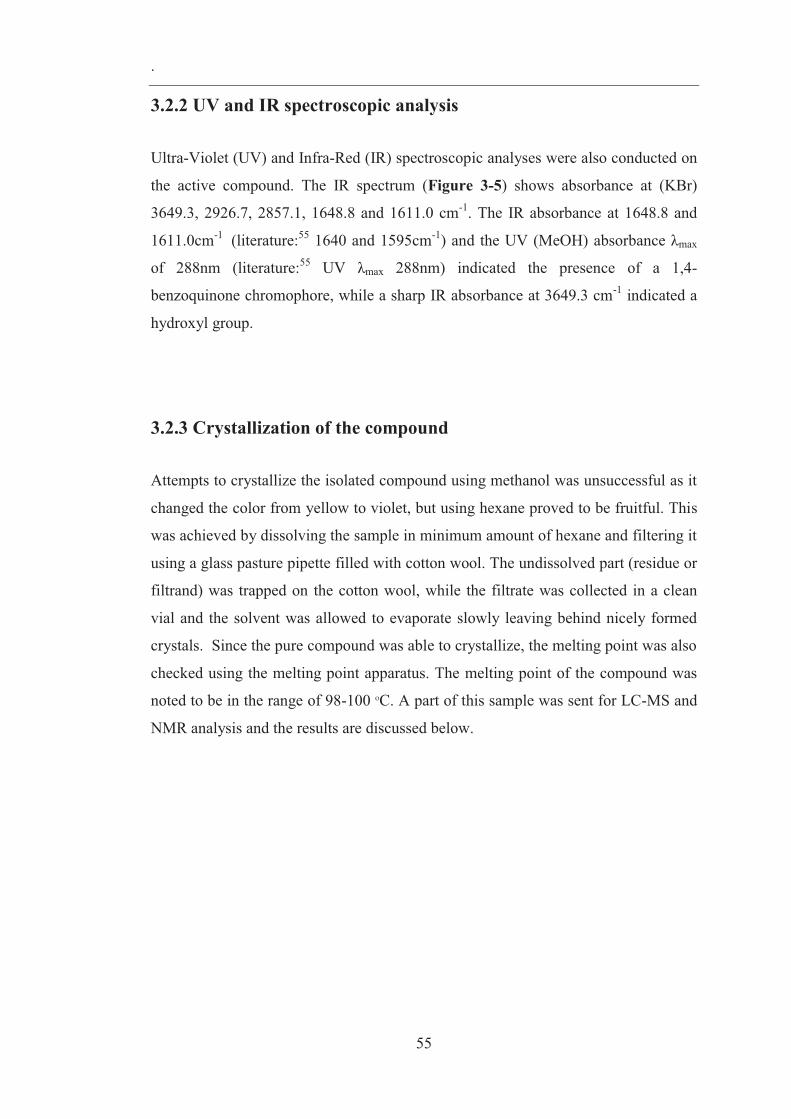
.
55
3.2.2 UV and IR spectroscopic analysis
Ultra-Violet (UV) and Infra-Red (IR) spectroscopic analyses were also conducted on
the active compound. The IR spectrum (Figure 3-5) shows absorbance at (KBr)
3649.3, 2926.7, 2857.1, 1648.8 and 1611.0 cm-1. The IR absorbance at 1648.8 and
1611.0cm-1 (literature:55 1640 and 1595cm-1) and the UV (MeOH) absorbance λmax
of 288nm (literature:55 UV λmax 288nm) indicated the presence of a 1,4-
benzoquinone chromophore, while a sharp IR absorbance at 3649.3 cm-1 indicated a
hydroxyl group.
3.2.3 Crystallization of the compound
Attempts to crystallize the isolated compound using methanol was unsuccessful as it
changed the color from yellow to violet, but using hexane proved to be fruitful. This
was achieved by dissolving the sample in minimum amount of hexane and filtering it
using a glass pasture pipette filled with cotton wool. The undissolved part (residue or
filtrand) was trapped on the cotton wool, while the filtrate was collected in a clean
vial and the solvent was allowed to evaporate slowly leaving behind nicely formed
crystals. Since the pure compound was able to crystallize, the melting point was also
checked using the melting point apparatus. The melting point of the compound was
noted to be in the range of 98-100 �C. A part of this sample was sent for LC-MS and
NMR analysis and the results are discussed below.
56
Fi
gure
3-5
: IR
spec
trum
(KB
r) o
f the
act
ive
com
poun
d 1
4000
.036
0032
0028
0024
0020
0018
0016
0014
0012
0010
0080
060
045
0.0
49.9
0
50.5
51.0
51.5
52.0
52.5
53.0
53.5
54.0
54.5
55.0
55.5
56.0
56.5
57.0
57.5
58.0
58.5
58.7
4
cm-1
%T
36
49.3
5
2926
.77
1611
.01
1380
.17
1226
.02
3840
.65
2857
.14
2362
.63
2340
.65
1648
.84
1454
.07 13
47.0
71316
.90
1201
.68
1050
.79
1034
.3389
1.6883
4.07
795.
66
718.
84
57
3.2.4 LC-MS and NMR data of compound 1
The active compound 1 (FJ05-097FDF2H2), isolated as a yellow solids, gave a
molecular ion peak [M+H+] at 359.22 m/z (Figure 3-6). Based on this mass the
molecular formulas were generated using the Xcalibur® 2.0.7 SPI software and
tabulated in Table 3-4. From Table 3-4 the most realistic molecular formula was
choosen to be the first molecular formula which was C22H31O4. Since the moelcular
ion peak at 359.22m/z is for [M+H]+ the actual mass of the compound would be
358.22 and hence the molecular formula would correspond to C22H30O4. From this
formula the double bond equivalence was calculated to be eight using Equation 3-1.
The NMR data obtained for this compound was tabulated in Table 3-5. The 1H NMR
spectrum illustrated three methyl signals: two singlet (s) tertiary methyls (3H) and
one doublet (d) secondary methyl (3H) at 0.90, 1.07 and 0.95ppm respectively, one
singlet methoxy group (OCH3) at 3.89ppm, a singlet at 5.89ppm for a olefinic proton,
a double singlet (ds) at 4.71/4.68ppm for two protons, a broad singlet (br s) for the
hydroxyl group (OH) and a AB quartet at 2.61/2.50ppm for the two methylene
protons (Figure 3-21). The carbon NMR (13C NMR) in Figure 3-22, showed two
carbonyl signals (182.8 and 182.6ppm), 2 x C=O, and six olefinic carbons (161.8,
153.6, 153.4, 117.7, 105.8, 102.1ppm), 3 x C=C, which accounted for five out of
eight degrees of unsaturation which pointed towards a tricyclic compound.
dbe= [(2(C)+2)-H]/2
Equation 3-1: Calculation of double bond equivalence.
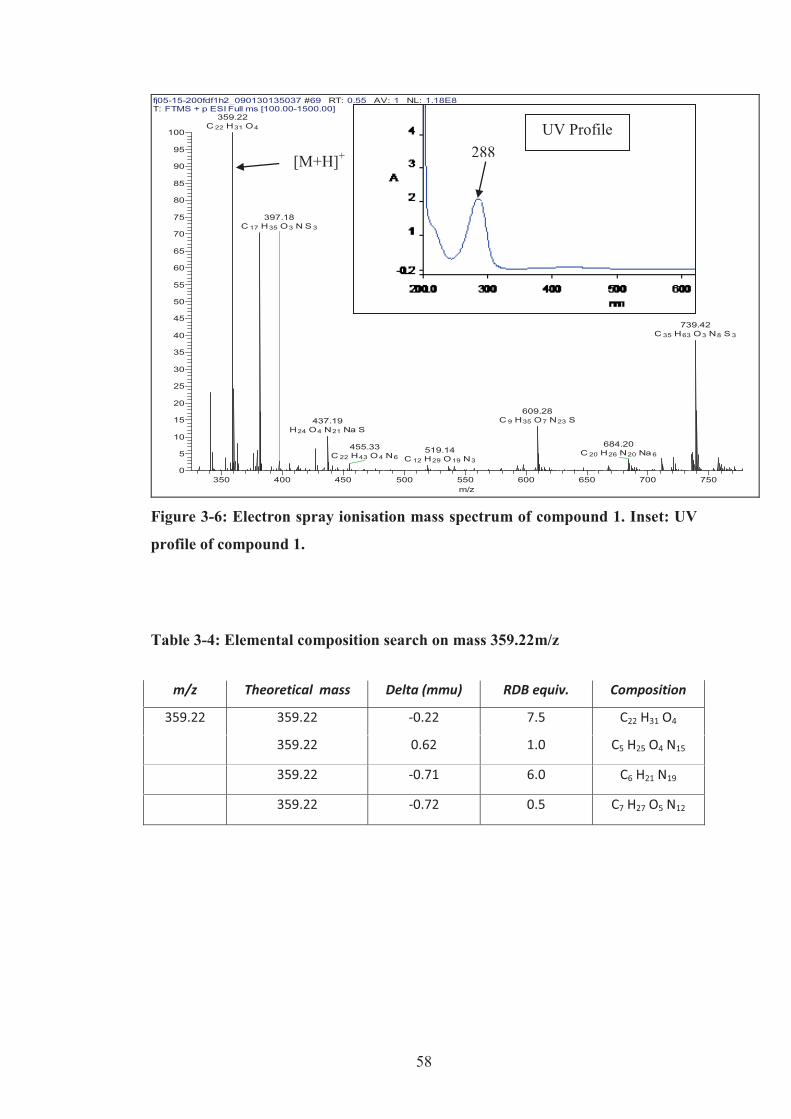
58
[M+H]+
fj05-15-200fdf1h2_090130135037 #69 RT: 0.55 AV: 1 NL: 1.18E8T: FTMS + p ESI Full ms [100.00-1500.00]
350 400 450 500 550 600 650 700 750m/z
0
5
10
15
20
25
30
35
40
45
50
55
60
65
70
75
80
85
90
95
100
359.22C 22 H31 O4
739.42C 35 H63 O3 N8 S 3
609.28C 9 H35 O7 N23 S437.19
H24 O4 N21 Na S
684.20C 20 H26 N20 Na 6
397.18C 17 H35 O3 N S 3
455.33C 22 H43 O4 N6
519.14C 12 H29 O19 N3
Figure 3-6: Electron spray ionisation mass spectrum of compound 1. Inset: UV
profile of compound 1.
Table 3-4: Elemental composition search on mass 359.22m/z
m/z Theoretical mass Delta (mmu) RDB equiv. Composition
359.22 359.22 -0.22 7.5 C22 H31 O4
359.22 0.62 1.0 C5 H25 O4 N15
359.22 -0.71 6.0 C6 H21 N19
359.22 -0.72 0.5 C7 H27 O5 N12
UV Profile 288
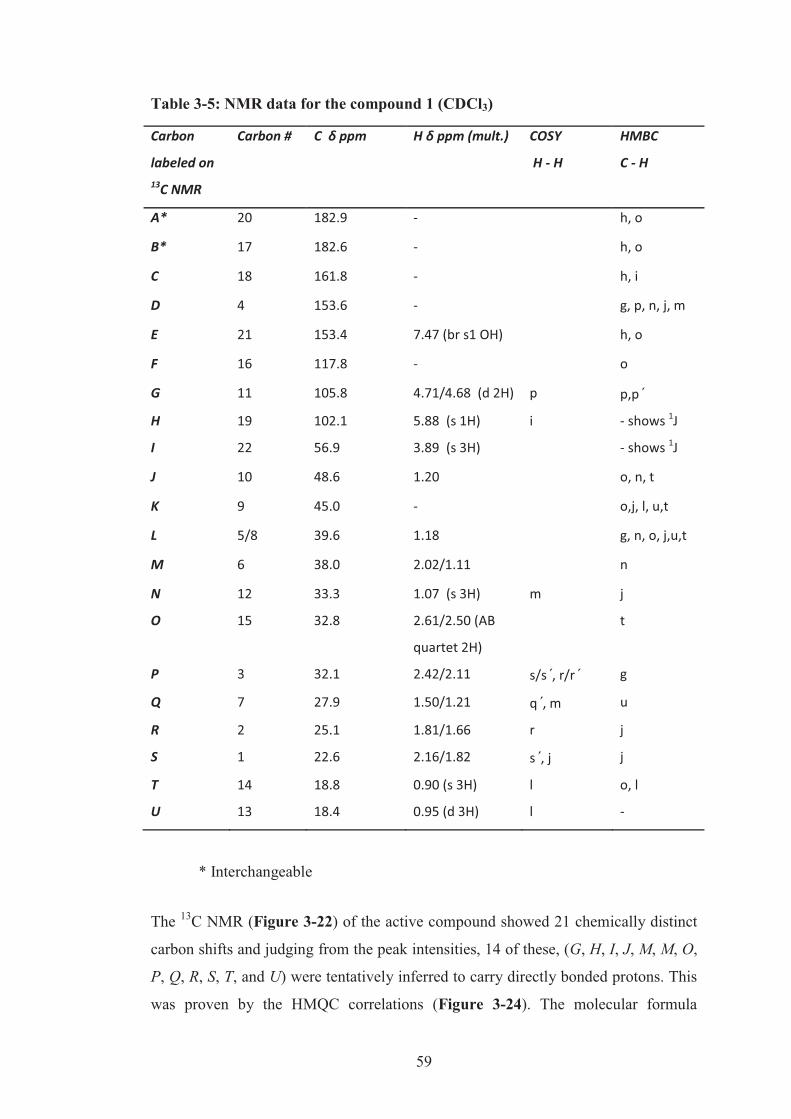
59
Table 3-5: NMR data for the compound 1 (CDCl3)
Carbon
labeled on 13C NMR
Carbon # C δ ppm H δ ppm (mult.) COSY
H - H
HMBC
C - H
A* 20 182.9 - h, o
B* 17 182.6 - h, o
C 18 161.8 - h, i
D 4 153.6 - g, p, n, j, m
E 21 153.4 7.47 (br s1 OH) h, o
F 16 117.8 - o
G 11 105.8 4.71/4.68 (d 2H) p p,p΄
H 19 102.1 5.88 (s 1H) i - shows 1J
I 22 56.9 3.89 (s 3H) - shows 1J
J 10 48.6 1.20 o, n, t
K 9 45.0 - o,j, l, u,t
L 5/8 39.6 1.18 g, n, o, j,u,t
M 6 38.0 2.02/1.11 n
N 12 33.3 1.07 (s 3H) m j
O 15 32.8 2.61/2.50 (AB
quartet 2H)
t
P 3 32.1 2.42/2.11 s/s΄, r/r΄ g
Q 7 27.9 1.50/1.21 q΄, m u
R 2 25.1 1.81/1.66 r j
S 1 22.6 2.16/1.82 s΄, j j
T 14 18.8 0.90 (s 3H) l o, l
U 13 18.4 0.95 (d 3H) l -
* Interchangeable
The 13C NMR (Figure 3-22) of the active compound showed 21 chemically distinct
carbon shifts and judging from the peak intensities, 14 of these, (G, H, I, J, M, M, O,
P, Q, R, S, T, and U) were tentatively inferred to carry directly bonded protons. This
was proven by the HMQC correlations (Figure 3-24). The molecular formula
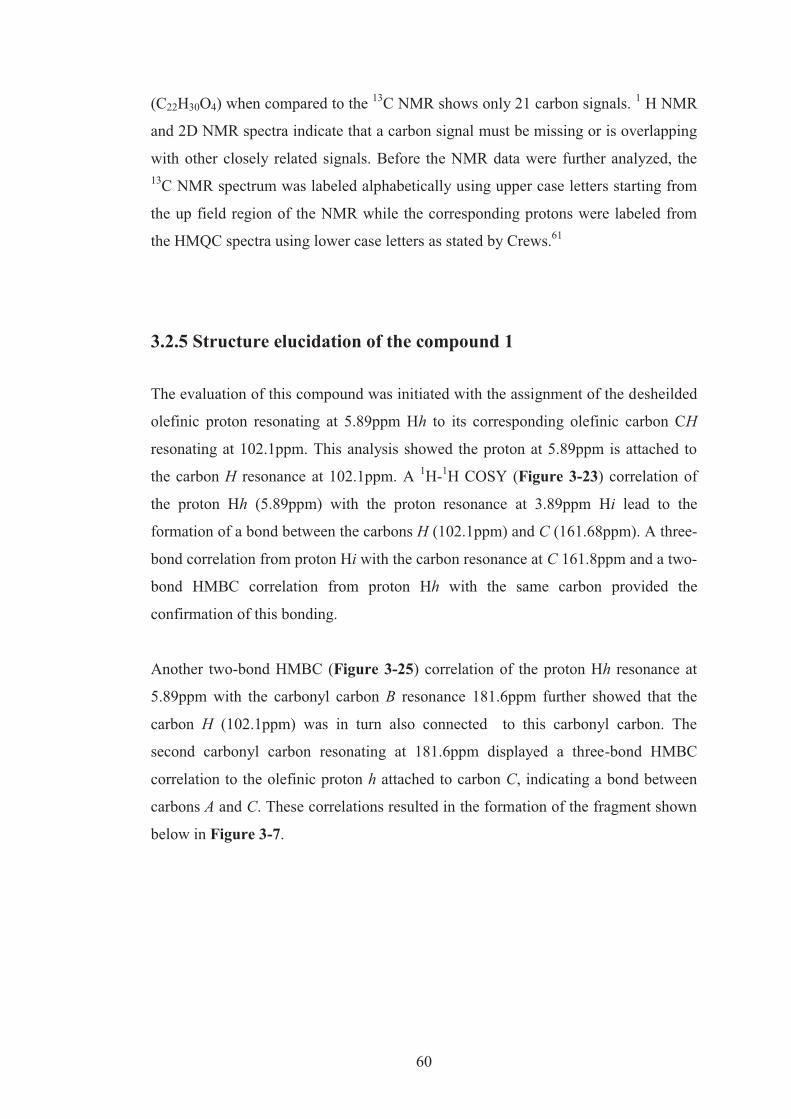
60
(C22H30O4) when compared to the 13C NMR shows only 21 carbon signals. 1 H NMR
and 2D NMR spectra indicate that a carbon signal must be missing or is overlapping
with other closely related signals. Before the NMR data were further analyzed, the 13C NMR spectrum was labeled alphabetically using upper case letters starting from
the up field region of the NMR while the corresponding protons were labeled from
the HMQC spectra using lower case letters as stated by Crews.61
3.2.5 Structure elucidation of the compound 1
The evaluation of this compound was initiated with the assignment of the desheilded
olefinic proton resonating at 5.89ppm Hh to its corresponding olefinic carbon CH
resonating at 102.1ppm. This analysis showed the proton at 5.89ppm is attached to
the carbon H resonance at 102.1ppm. A 1H-1H COSY (Figure 3-23) correlation of
the proton Hh (5.89ppm) with the proton resonance at 3.89ppm Hi lead to the
formation of a bond between the carbons H (102.1ppm) and C (161.68ppm). A three-
bond correlation from proton Hi with the carbon resonance at C 161.8ppm and a two-
bond HMBC correlation from proton Hh with the same carbon provided the
confirmation of this bonding.
Another two-bond HMBC (Figure 3-25) correlation of the proton Hh resonance at
5.89ppm with the carbonyl carbon B resonance 181.6ppm further showed that the
carbon H (102.1ppm) was in turn also connected to this carbonyl carbon. The
second carbonyl carbon resonating at 181.6ppm displayed a three-bond HMBC
correlation to the olefinic proton h attached to carbon C, indicating a bond between
carbons A and C. These correlations resulted in the formation of the fragment shown
below in Figure 3-7.
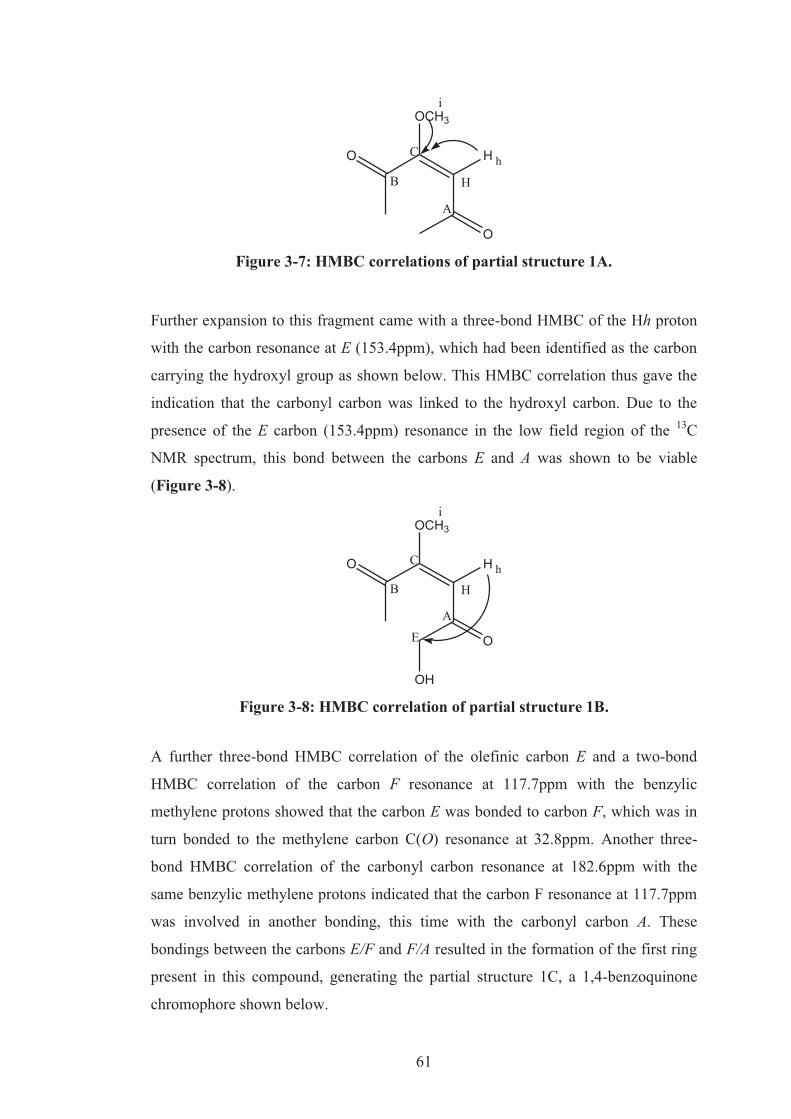
61
OCH3
O
O
H
A
B
C
Hh
i
Figure 3-7: HMBC correlations of partial structure 1A.
Further expansion to this fragment came with a three-bond HMBC of the Hh proton
with the carbon resonance at E (153.4ppm), which had been identified as the carbon
carrying the hydroxyl group as shown below. This HMBC correlation thus gave the
indication that the carbonyl carbon was linked to the hydroxyl carbon. Due to the
presence of the E carbon (153.4ppm) resonance in the low field region of the 13C
NMR spectrum, this bond between the carbons E and A was shown to be viable
(Figure 3-8).
OCH3
O
O
H
A
B
C
Hh
i
OH
E
Figure 3-8: HMBC correlation of partial structure 1B.
A further three-bond HMBC correlation of the olefinic carbon E and a two-bond
HMBC correlation of the carbon F resonance at 117.7ppm with the benzylic
methylene protons showed that the carbon E was bonded to carbon F, which was in
turn bonded to the methylene carbon C(O) resonance at 32.8ppm. Another three-
bond HMBC correlation of the carbonyl carbon resonance at 182.6ppm with the
same benzylic methylene protons indicated that the carbon F resonance at 117.7ppm
was involved in another bonding, this time with the carbonyl carbon A. These
bondings between the carbons E/F and F/A resulted in the formation of the first ring
present in this compound, generating the partial structure 1C, a 1,4-benzoquinone
chromophore shown below.
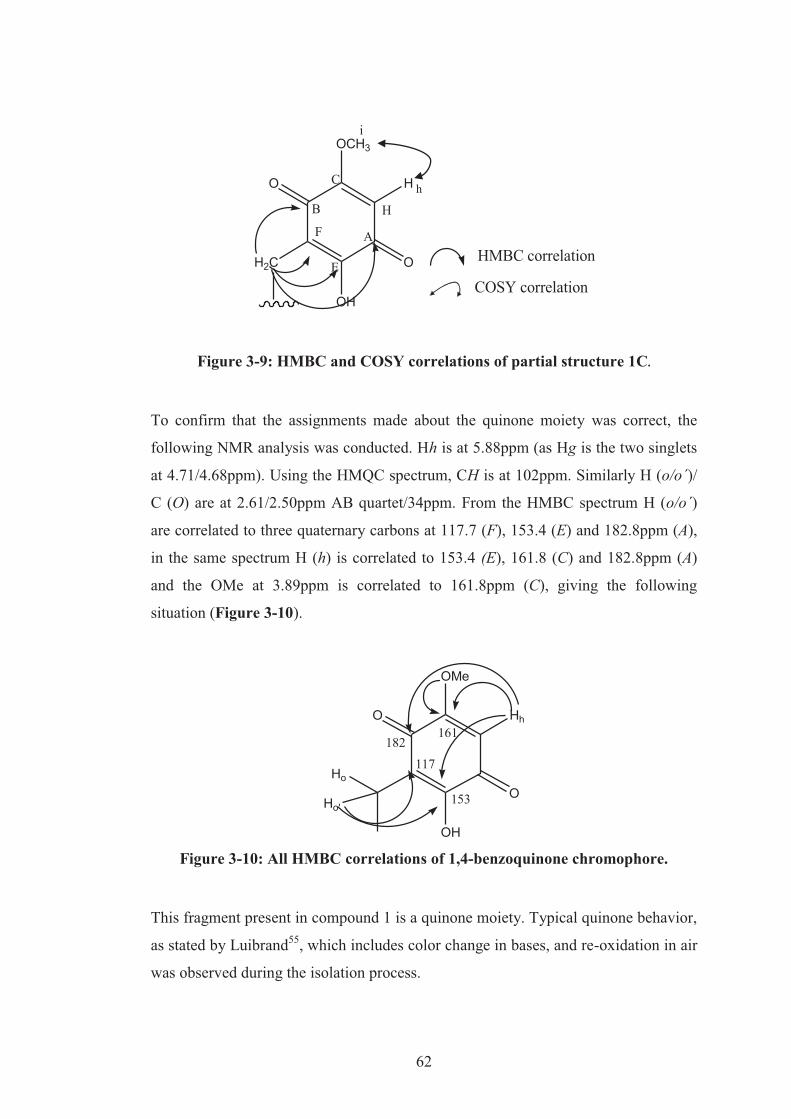
62
OCH3
O
O
H
A
B
C
Hh
i
OH
E
F
H2C HMBC correlation
COSY correlation
Figure 3-9: HMBC and COSY correlations of partial structure 1C.
To confirm that the assignments made about the quinone moiety was correct, the
following NMR analysis was conducted. Hh is at 5.88ppm (as Hg is the two singlets
at 4.71/4.68ppm). Using the HMQC spectrum, CH is at 102ppm. Similarly H (o/o΄)/
C (O) are at 2.61/2.50ppm AB quartet/34ppm. From the HMBC spectrum H (o/o΄)
are correlated to three quaternary carbons at 117.7 (F), 153.4 (E) and 182.8ppm (A),
in the same spectrum H (h) is correlated to 153.4 (E), 161.8 (C) and 182.8ppm (A)
and the OMe at 3.89ppm is correlated to 161.8ppm (C), giving the following
situation (Figure 3-10).
O
O
OMe
Hh
Ho
Ho'
OH
117
153
161182
Figure 3-10: All HMBC correlations of 1,4-benzoquinone chromophore.
This fragment present in compound 1 is a quinone moiety. Typical quinone behavior,
as stated by Luibrand55, which includes color change in bases, and re-oxidation in air
was observed during the isolation process.
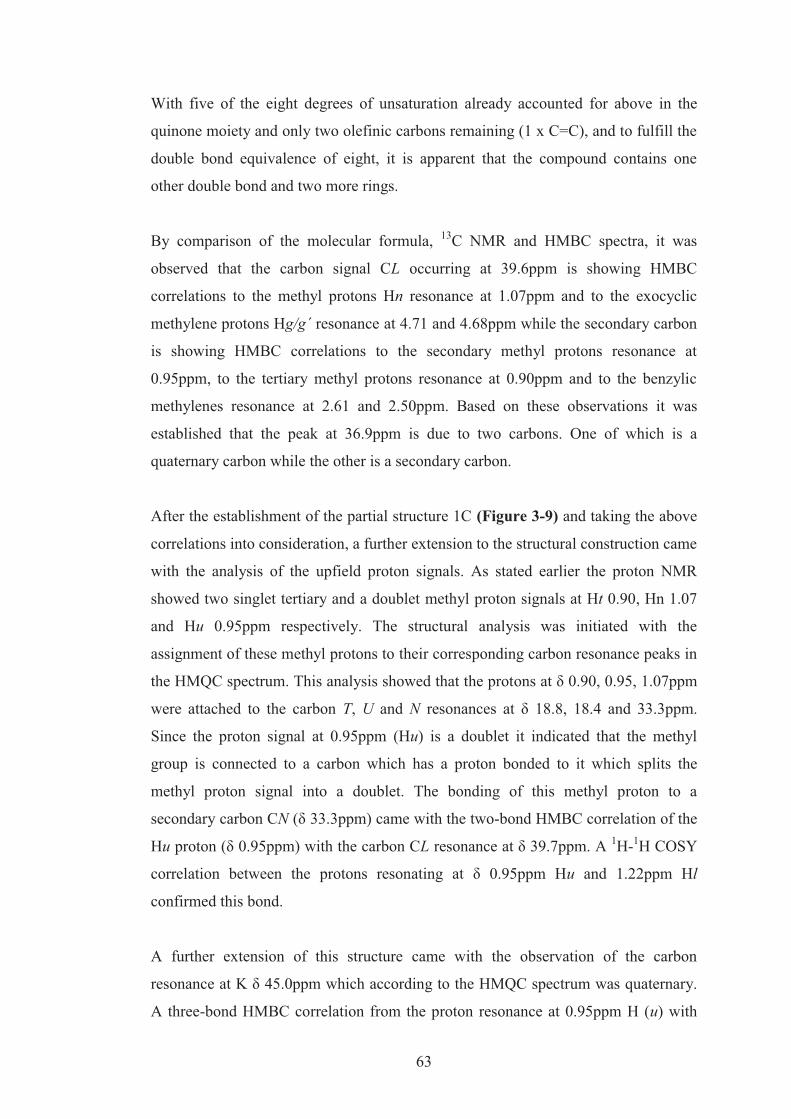
63
With five of the eight degrees of unsaturation already accounted for above in the
quinone moiety and only two olefinic carbons remaining (1 x C=C), and to fulfill the
double bond equivalence of eight, it is apparent that the compound contains one
other double bond and two more rings.
By comparison of the molecular formula, 13C NMR and HMBC spectra, it was
observed that the carbon signal CL occurring at 39.6ppm is showing HMBC
correlations to the methyl protons Hn resonance at 1.07ppm and to the exocyclic
methylene protons Hg/g΄ resonance at 4.71 and 4.68ppm while the secondary carbon
is showing HMBC correlations to the secondary methyl protons resonance at
0.95ppm, to the tertiary methyl protons resonance at 0.90ppm and to the benzylic
methylenes resonance at 2.61 and 2.50ppm. Based on these observations it was
established that the peak at 36.9ppm is due to two carbons. One of which is a
quaternary carbon while the other is a secondary carbon.
After the establishment of the partial structure 1C (Figure 3-9) and taking the above
correlations into consideration, a further extension to the structural construction came
with the analysis of the upfield proton signals. As stated earlier the proton NMR
showed two singlet tertiary and a doublet methyl proton signals at Ht 0.90, Hn 1.07
and Hu 0.95ppm respectively. The structural analysis was initiated with the
assignment of these methyl protons to their corresponding carbon resonance peaks in
the HMQC spectrum. This analysis showed that the protons at δ 0.90, 0.95, 1.07ppm
were attached to the carbon T, U and N resonances at δ 18.8, 18.4 and 33.3ppm.
Since the proton signal at 0.95ppm (Hu) is a doublet it indicated that the methyl
group is connected to a carbon which has a proton bonded to it which splits the
methyl proton signal into a doublet. The bonding of this methyl proton to a
secondary carbon CN (δ 33.3ppm) came with the two-bond HMBC correlation of the
Hu proton (δ 0.95ppm) with the carbon CL resonance at δ 39.7ppm. A 1H-1H COSY
correlation between the protons resonating at δ 0.95ppm Hu and 1.22ppm Hl
confirmed this bond.
A further extension of this structure came with the observation of the carbon
resonance at K δ 45.0ppm which according to the HMQC spectrum was quaternary.
A three-bond HMBC correlation from the proton resonance at 0.95ppm H (u) with
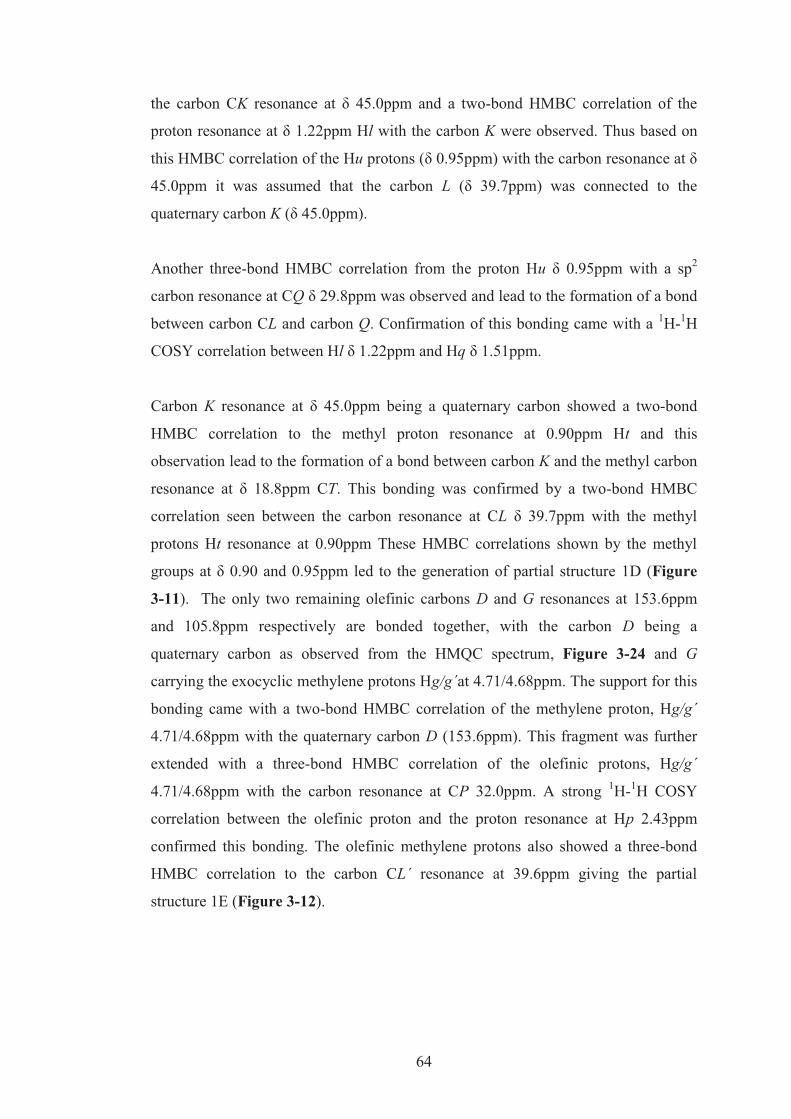
64
the carbon CK resonance at δ 45.0ppm and a two-bond HMBC correlation of the
proton resonance at δ 1.22ppm Hl with the carbon K were observed. Thus based on
this HMBC correlation of the Hu protons (δ 0.95ppm) with the carbon resonance at δ
45.0ppm it was assumed that the carbon L (δ 39.7ppm) was connected to the
quaternary carbon K (δ 45.0ppm).
Another three-bond HMBC correlation from the proton Hu δ 0.95ppm with a sp2
carbon resonance at CQ δ 29.8ppm was observed and lead to the formation of a bond
between carbon CL and carbon Q. Confirmation of this bonding came with a 1H-1H
COSY correlation between Hl δ 1.22ppm and Hq δ 1.51ppm.
Carbon K resonance at δ 45.0ppm being a quaternary carbon showed a two-bond
HMBC correlation to the methyl proton resonance at 0.90ppm Ht and this
observation lead to the formation of a bond between carbon K and the methyl carbon
resonance at δ 18.8ppm CT. This bonding was confirmed by a two-bond HMBC
correlation seen between the carbon resonance at CL δ 39.7ppm with the methyl
protons Ht resonance at 0.90ppm These HMBC correlations shown by the methyl
groups at δ 0.90 and 0.95ppm led to the generation of partial structure 1D (Figure
3-11). The only two remaining olefinic carbons D and G resonances at 153.6ppm
and 105.8ppm respectively are bonded together, with the carbon D being a
quaternary carbon as observed from the HMQC spectrum, Figure 3-24 and G
carrying the exocyclic methylene protons Hg/g΄at 4.71/4.68ppm. The support for this
bonding came with a two-bond HMBC correlation of the methylene proton, Hg/g΄
4.71/4.68ppm with the quaternary carbon D (153.6ppm). This fragment was further
extended with a three-bond HMBC correlation of the olefinic protons, Hg/g΄
4.71/4.68ppm with the carbon resonance at CP 32.0ppm. A strong 1H-1H COSY
correlation between the olefinic proton and the proton resonance at Hp 2.43ppm
confirmed this bonding. The olefinic methylene protons also showed a three-bond
HMBC correlation to the carbon CL΄ resonance at 39.6ppm giving the partial
structure 1E (Figure 3-12).
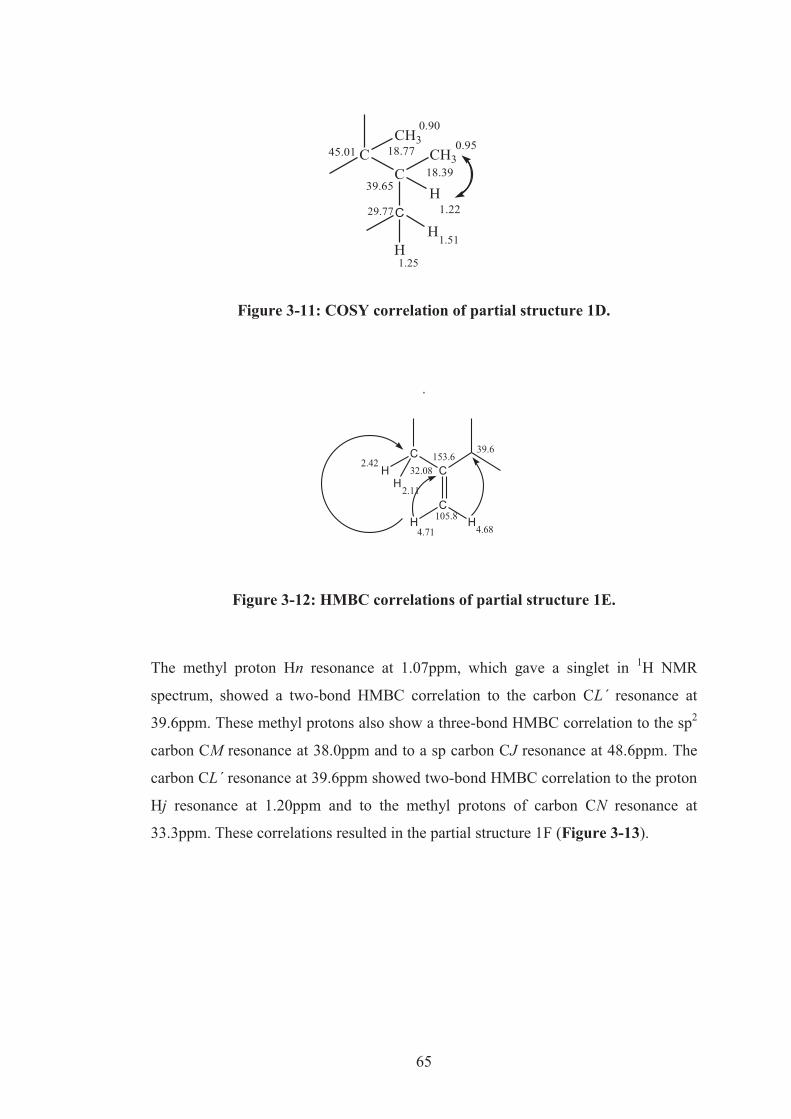
65
CCH3
CH
18.39
0.95
1.22
39.65
CCH3
45.01
0.90
18.77
29.77
1.51H
H1.25
Figure 3-11: COSY correlation of partial structure 1D.
.
C
CH H
CH
H
153.6
105.8
39.6
32.08
4.71 4.68
2.42
2.11
Figure 3-12: HMBC correlations of partial structure 1E.
The methyl proton Hn resonance at 1.07ppm, which gave a singlet in 1H NMR
spectrum, showed a two-bond HMBC correlation to the carbon CL΄ resonance at
39.6ppm. These methyl protons also show a three-bond HMBC correlation to the sp2
carbon CM resonance at 38.0ppm and to a sp carbon CJ resonance at 48.6ppm. The
carbon CL΄ resonance at 39.6ppm showed two-bond HMBC correlation to the proton
Hj resonance at 1.20ppm and to the methyl protons of carbon CN resonance at
33.3ppm. These correlations resulted in the partial structure 1F (Figure 3-13).
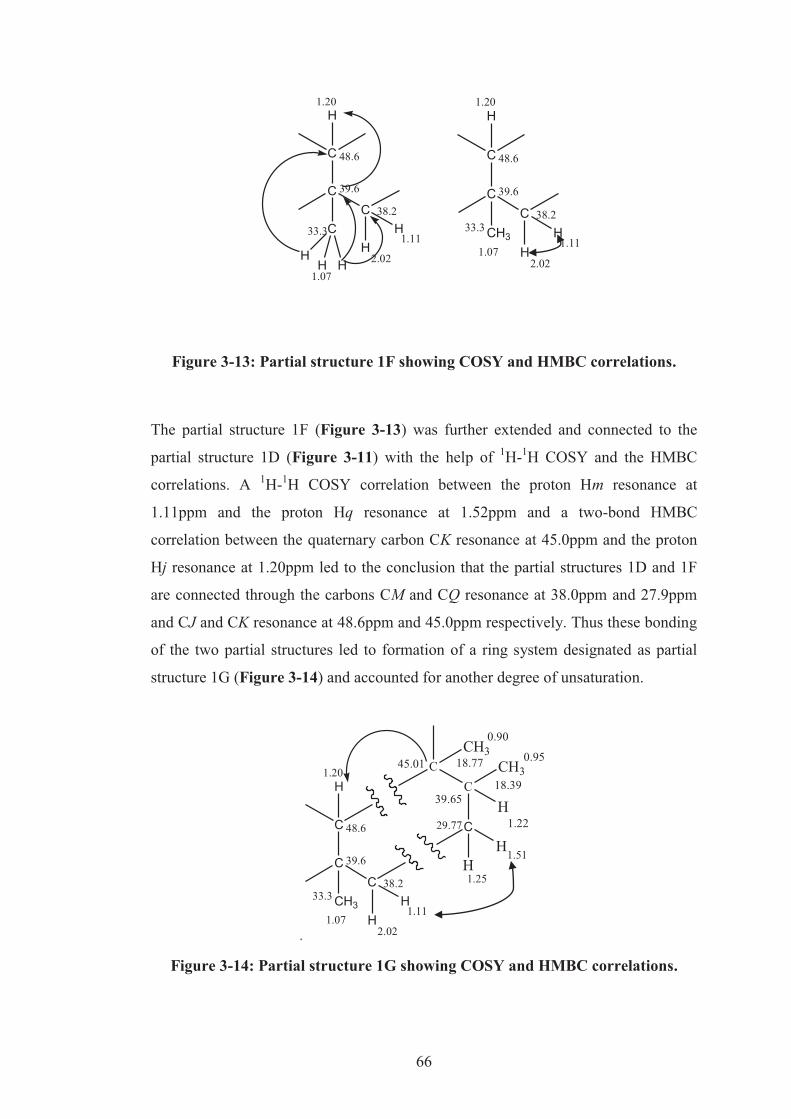
66
CC
C
CH
H
H1.20
48.6
39.6
33.3
38.2
1.11
2.02HH H
1.07
CC
C
CH3
HH
H1.20
48.6
39.6
33.338.2
1.11
2.021.07
Figure 3-13: Partial structure 1F showing COSY and HMBC correlations.
The partial structure 1F (Figure 3-13) was further extended and connected to the
partial structure 1D (Figure 3-11) with the help of 1H-1H COSY and the HMBC
correlations. A 1H-1H COSY correlation between the proton Hm resonance at
1.11ppm and the proton Hq resonance at 1.52ppm and a two-bond HMBC
correlation between the quaternary carbon CK resonance at 45.0ppm and the proton
Hj resonance at 1.20ppm led to the conclusion that the partial structures 1D and 1F
are connected through the carbons CM and CQ resonance at 38.0ppm and 27.9ppm
and CJ and CK resonance at 48.6ppm and 45.0ppm respectively. Thus these bonding
of the two partial structures led to formation of a ring system designated as partial
structure 1G (Figure 3-14) and accounted for another degree of unsaturation.
.
CC
C
CH3
HH
H1.20
48.6
39.6
33.338.2
1.11
2.021.07
CCH3
CH
18.39
0.95
1.22
39.65
CCH3
45.01
0.90
18.77
29.77
1.51H
H1.25
Figure 3-14: Partial structure 1G showing COSY and HMBC correlations.
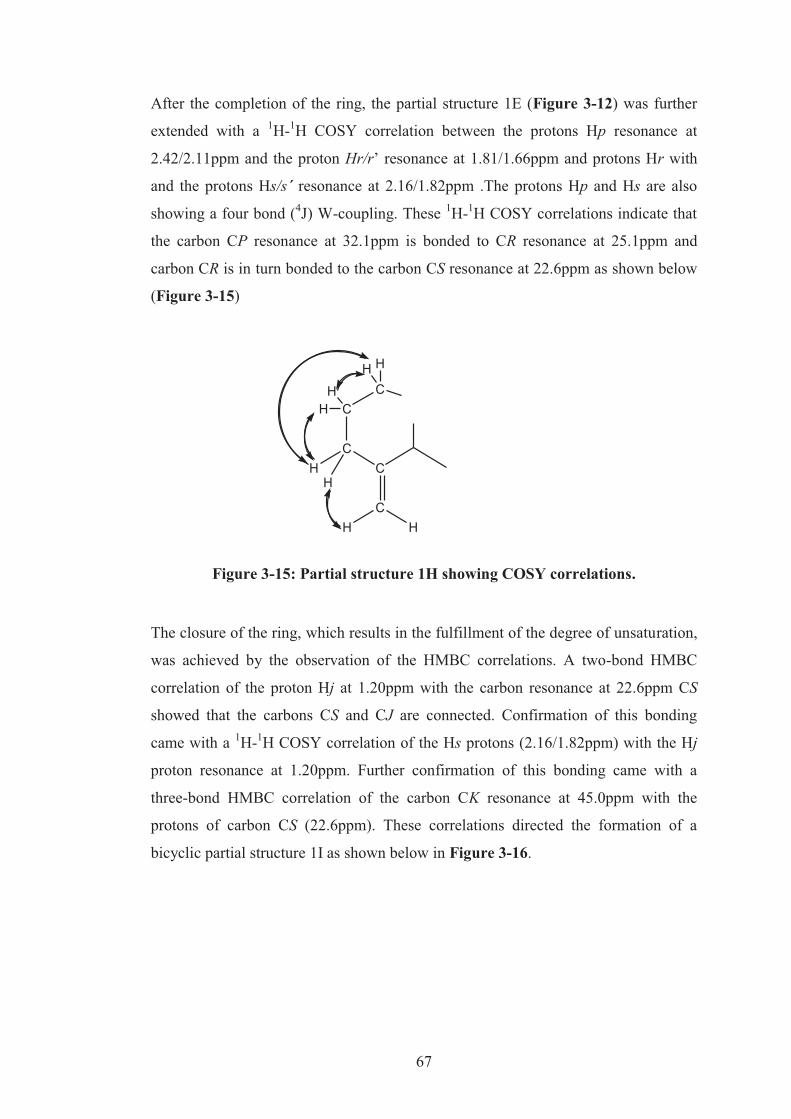
67
After the completion of the ring, the partial structure 1E (Figure 3-12) was further
extended with a 1H-1H COSY correlation between the protons Hp resonance at
2.42/2.11ppm and the proton Hr/r’ resonance at 1.81/1.66ppm and protons Hr with
and the protons Hs/s΄ resonance at 2.16/1.82ppm .The protons Hp and Hs are also
showing a four bond (4J) W-coupling. These 1H-1H COSY correlations indicate that
the carbon CP resonance at 32.1ppm is bonded to CR resonance at 25.1ppm and
carbon CR is in turn bonded to the carbon CS resonance at 22.6ppm as shown below
(Figure 3-15)
C
CH H
C
C
HH
HCH
H H
Figure 3-15: Partial structure 1H showing COSY correlations.
The closure of the ring, which results in the fulfillment of the degree of unsaturation,
was achieved by the observation of the HMBC correlations. A two-bond HMBC
correlation of the proton Hj at 1.20ppm with the carbon resonance at 22.6ppm CS
showed that the carbons CS and CJ are connected. Confirmation of this bonding
came with a 1H-1H COSY correlation of the Hs protons (2.16/1.82ppm) with the Hj
proton resonance at 1.20ppm. Further confirmation of this bonding came with a
three-bond HMBC correlation of the carbon CK resonance at 45.0ppm with the
protons of carbon CS (22.6ppm). These correlations directed the formation of a
bicyclic partial structure 1I as shown below in Figure 3-16.
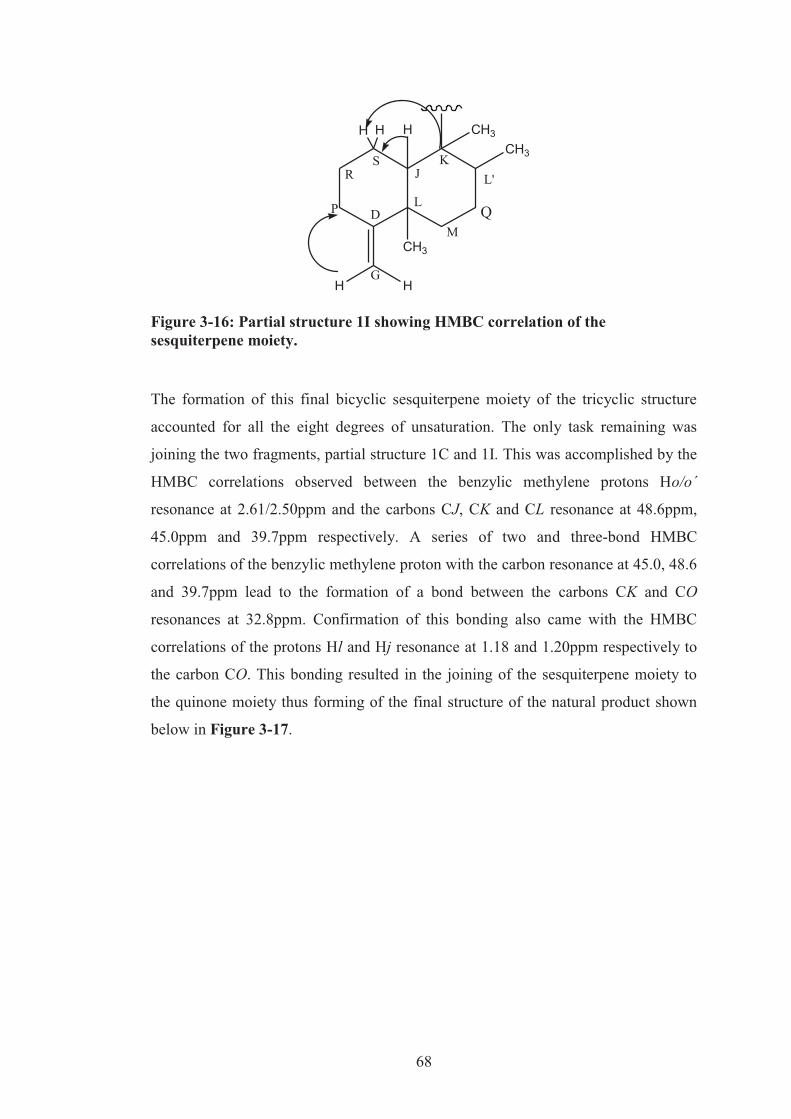
68
CH3
CH3
CH3H
D
GH H
L
MQ
L'K
JS
P
R
H H
Figure 3-16: Partial structure 1I showing HMBC correlation of the sesquiterpene moiety.
The formation of this final bicyclic sesquiterpene moiety of the tricyclic structure
accounted for all the eight degrees of unsaturation. The only task remaining was
joining the two fragments, partial structure 1C and 1I. This was accomplished by the
HMBC correlations observed between the benzylic methylene protons Ho/o΄
resonance at 2.61/2.50ppm and the carbons CJ, CK and CL resonance at 48.6ppm,
45.0ppm and 39.7ppm respectively. A series of two and three-bond HMBC
correlations of the benzylic methylene proton with the carbon resonance at 45.0, 48.6
and 39.7ppm lead to the formation of a bond between the carbons CK and CO
resonances at 32.8ppm. Confirmation of this bonding also came with the HMBC
correlations of the protons Hl and Hj resonance at 1.18 and 1.20ppm respectively to
the carbon CO. This bonding resulted in the joining of the sesquiterpene moiety to
the quinone moiety thus forming of the final structure of the natural product shown
below in Figure 3-17.
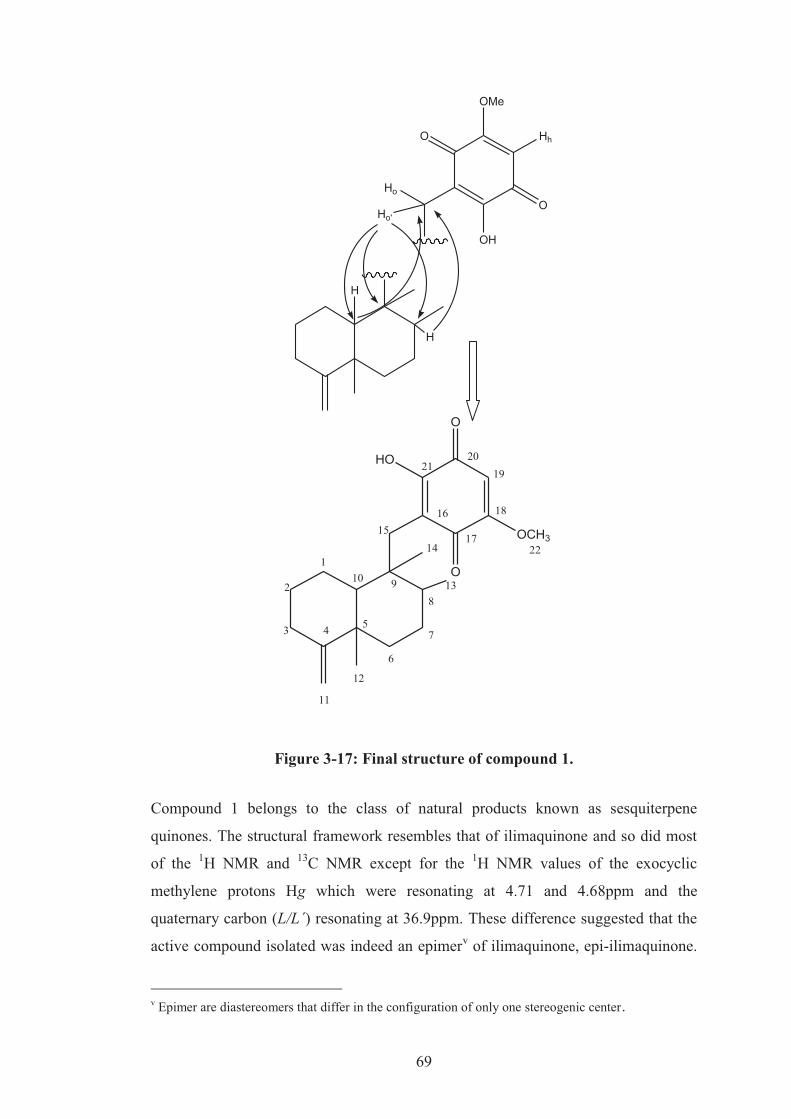
69
O
O
OMe
Hh
Ho
Ho'
OH
H
H
O
O
OCH3
HO
1
2
3 4 5
6
7
8910
11
12
13
1415
16
17
18
1920
21
22
Figure 3-17: Final structure of compound 1.
Compound 1 belongs to the class of natural products known as sesquiterpene
quinones. The structural framework resembles that of ilimaquinone and so did most
of the 1H NMR and 13C NMR except for the 1H NMR values of the exocyclic
methylene protons Hg which were resonating at 4.71 and 4.68ppm and the
quaternary carbon (L/L΄) resonating at 36.9ppm. These difference suggested that the
active compound isolated was indeed an epimerv of ilimaquinone, epi-ilimaquinone.
v Epimer are diastereomers that differ in the configuration of only one stereogenic center.
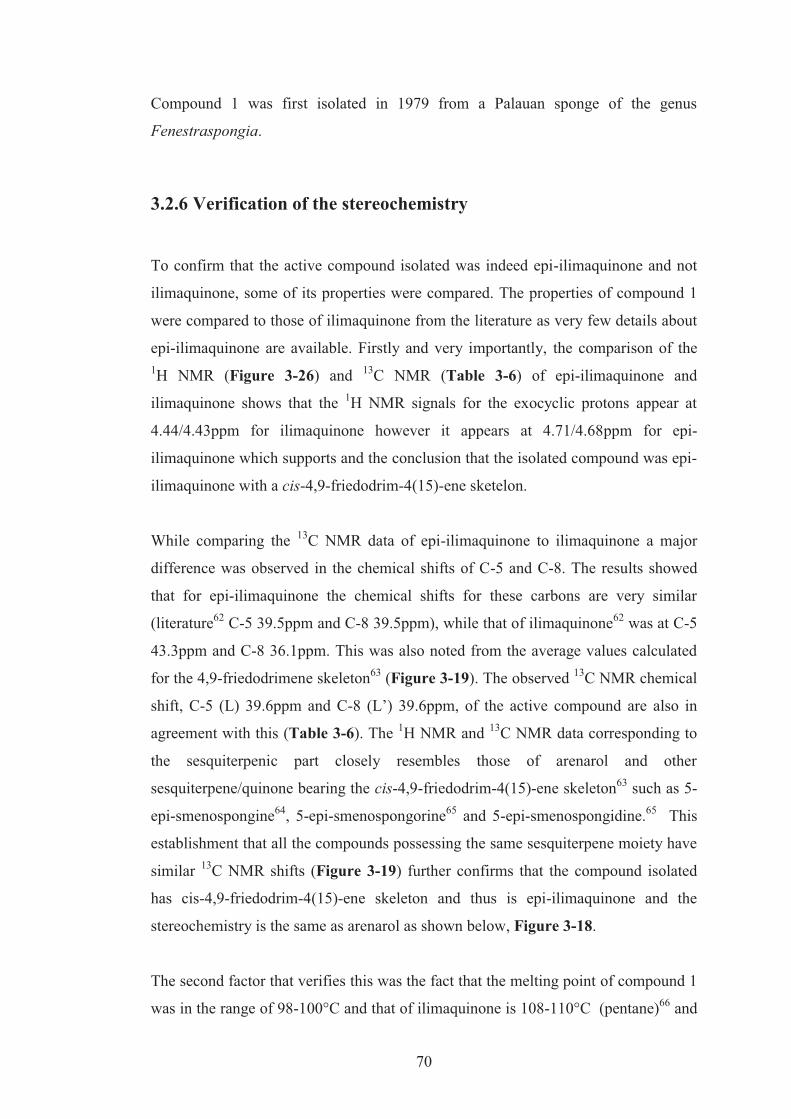
70
Compound 1 was first isolated in 1979 from a Palauan sponge of the genus
Fenestraspongia.
3.2.6 Verification of the stereochemistry
To confirm that the active compound isolated was indeed epi-ilimaquinone and not
ilimaquinone, some of its properties were compared. The properties of compound 1
were compared to those of ilimaquinone from the literature as very few details about
epi-ilimaquinone are available. Firstly and very importantly, the comparison of the 1H NMR (Figure 3-26) and 13C NMR (Table 3-6) of epi-ilimaquinone and
ilimaquinone shows that the 1H NMR signals for the exocyclic protons appear at
4.44/4.43ppm for ilimaquinone however it appears at 4.71/4.68ppm for epi-
ilimaquinone which supports and the conclusion that the isolated compound was epi-
ilimaquinone with a cis-4,9-friedodrim-4(15)-ene sketelon.
While comparing the 13C NMR data of epi-ilimaquinone to ilimaquinone a major
difference was observed in the chemical shifts of C-5 and C-8. The results showed
that for epi-ilimaquinone the chemical shifts for these carbons are very similar
(literature62 C-5 39.5ppm and C-8 39.5ppm), while that of ilimaquinone62 was at C-5
43.3ppm and C-8 36.1ppm. This was also noted from the average values calculated
for the 4,9-friedodrimene skeleton63 (Figure 3-19). The observed 13C NMR chemical
shift, C-5 (L) 39.6ppm and C-8 (L’) 39.6ppm, of the active compound are also in
agreement with this (Table 3-6). The 1H NMR and 13C NMR data corresponding to
the sesquiterpenic part closely resembles those of arenarol and other
sesquiterpene/quinone bearing the cis-4,9-friedodrim-4(15)-ene skeleton63 such as 5-
epi-smenospongine64, 5-epi-smenospongorine65 and 5-epi-smenospongidine.65 This
establishment that all the compounds possessing the same sesquiterpene moiety have
similar 13C NMR shifts (Figure 3-19) further confirms that the compound isolated
has cis-4,9-friedodrim-4(15)-ene skeleton and thus is epi-ilimaquinone and the
stereochemistry is the same as arenarol as shown below, Figure 3-18.
The second factor that verifies this was the fact that the melting point of compound 1
was in the range of 98-100°C and that of ilimaquinone is 108-110°C (pentane)66 and
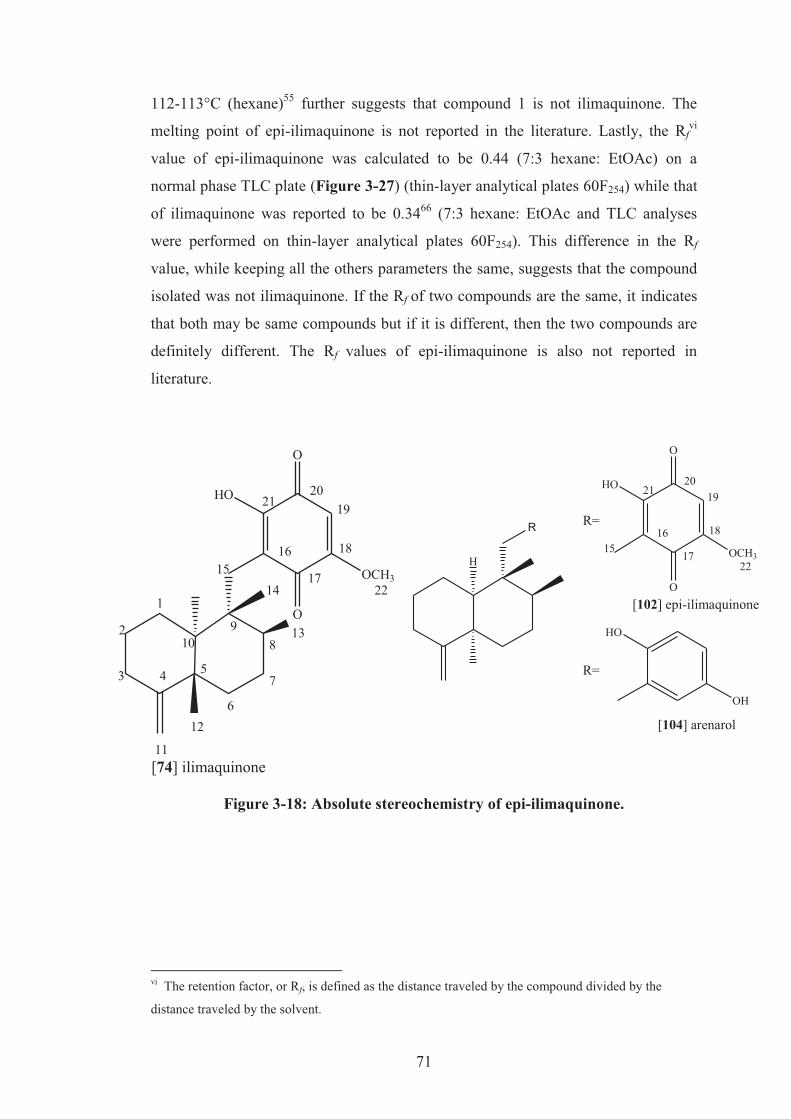
71
112-113°C (hexane)55 further suggests that compound 1 is not ilimaquinone. The
melting point of epi-ilimaquinone is not reported in the literature. Lastly, the Rfvi
value of epi-ilimaquinone was calculated to be 0.44 (7:3 hexane: EtOAc) on a
normal phase TLC plate (Figure 3-27) (thin-layer analytical plates 60F254) while that
of ilimaquinone was reported to be 0.3466 (7:3 hexane: EtOAc and TLC analyses
were performed on thin-layer analytical plates 60F254). This difference in the Rf
value, while keeping all the others parameters the same, suggests that the compound
isolated was not ilimaquinone. If the Rf of two compounds are the same, it indicates
that both may be same compounds but if it is different, then the two compounds are
definitely different. The Rf values of epi-ilimaquinone is also not reported in
literature.
H
R R=
O
O
OCH3
HO
1516
17
18
1920
21
22
R=
HO
OH
[104] arenarol
[102] epi-ilimaquinone
Figure 3-18: Absolute stereochemistry of epi-ilimaquinone.
vi The retention factor, or Rf, is defined as the distance traveled by the compound divided by the
distance traveled by the solvent.
O
O
OCH3
HO
1
2
3 4 5
6
7
89
10
11
12
13
1415
16
17
18
1920
21
22
[74] ilimaquinone
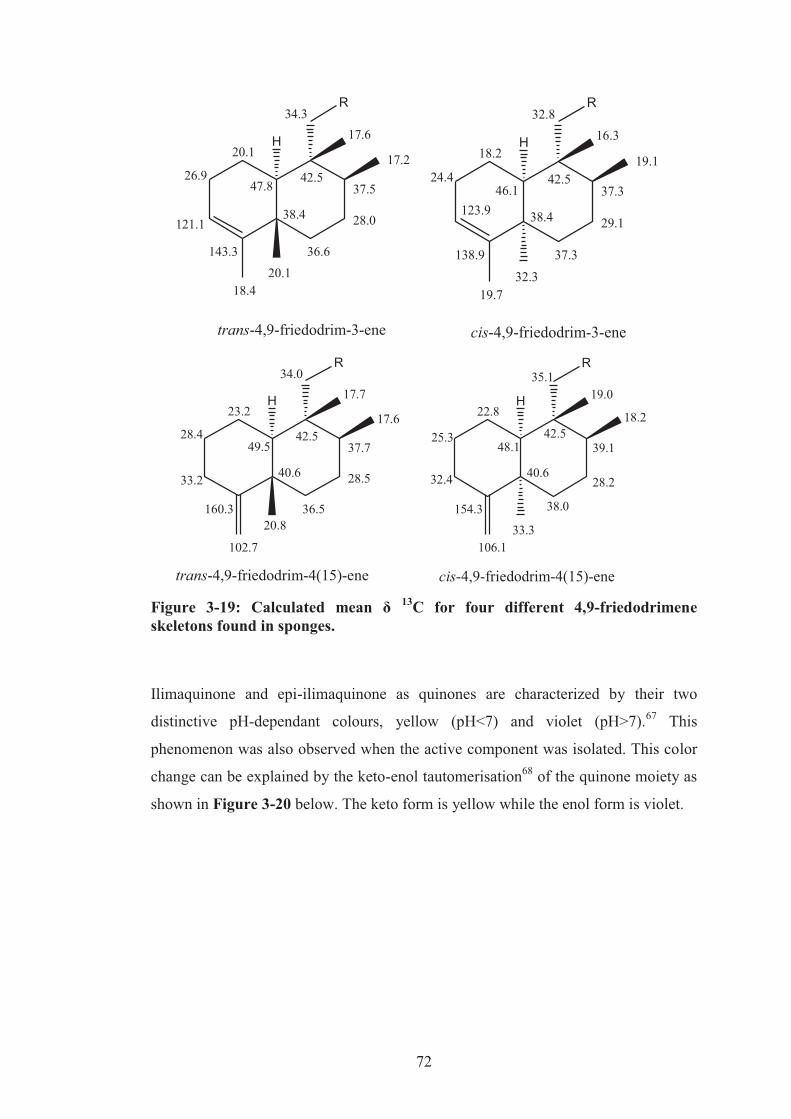
72
H
R34.3
17.6
17.2
37.5
28.0
42.5
38.4
36.620.1
18.4
143.3
121.1
26.9
20.1
trans-4,9-friedodrim-3-ene
47.8
H
R32.8
16.3
19.1
37.3
29.1
42.5
38.4
37.332.3
19.7
138.9
24.4
18.2
cis-4,9-friedodrim-3-ene
46.1123.9
H
34.017.7
17.6
37.7
28.5
42.5
40.6
36.520.8
102.7
160.3
33.2
28.4
23.2
trans-4,9-friedodrim-4(15)-ene
R
49.5
H
35.119.0
18.2
39.1
28.2
42.5
40.6
38.0
33.3106.1
154.3
32.4
25.3
22.8
cis-4,9-friedodrim-4(15)-ene
R
48.1
Figure 3-19: Calculated mean δ 13C for four different 4,9-friedodrimene skeletons found in sponges.
Ilimaquinone and epi-ilimaquinone as quinones are characterized by their two
distinctive pH-dependant colours, yellow (pH<7) and violet (pH>7).67 This
phenomenon was also observed when the active component was isolated. This color
change can be explained by the keto-enol tautomerisation68 of the quinone moiety as
shown in Figure 3-20 below. The keto form is yellow while the enol form is violet.
73
H
ilimaquinone
H
epi-ilimaquinone
OH
O
O
OMe
+ H
- H OH
O
HO
OMe
-H +H
+ H - H
OH
O
HO
OMe
-H
+H
O
O
HO
OMe
H Figure 3-20: Tautomerisation of epi-ilimaquinone and ilimaquinone.
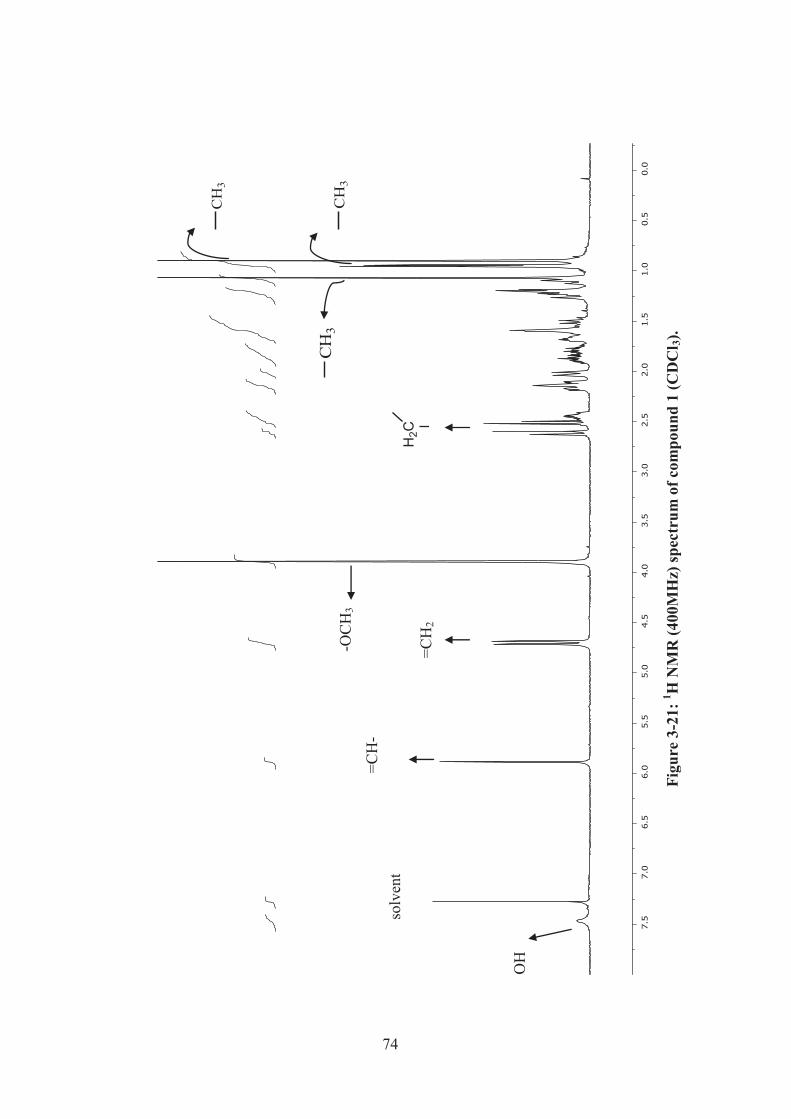
74
OH
-OC
H3
Fi
gure
3-2
1: 1 H
NM
R (4
00M
Hz)
spec
trum
of c
ompo
und
1 (C
DC
l 3).
solv
ent
=CH
-
=CH
2 H
2C
CH
3
CH
3
CH
3
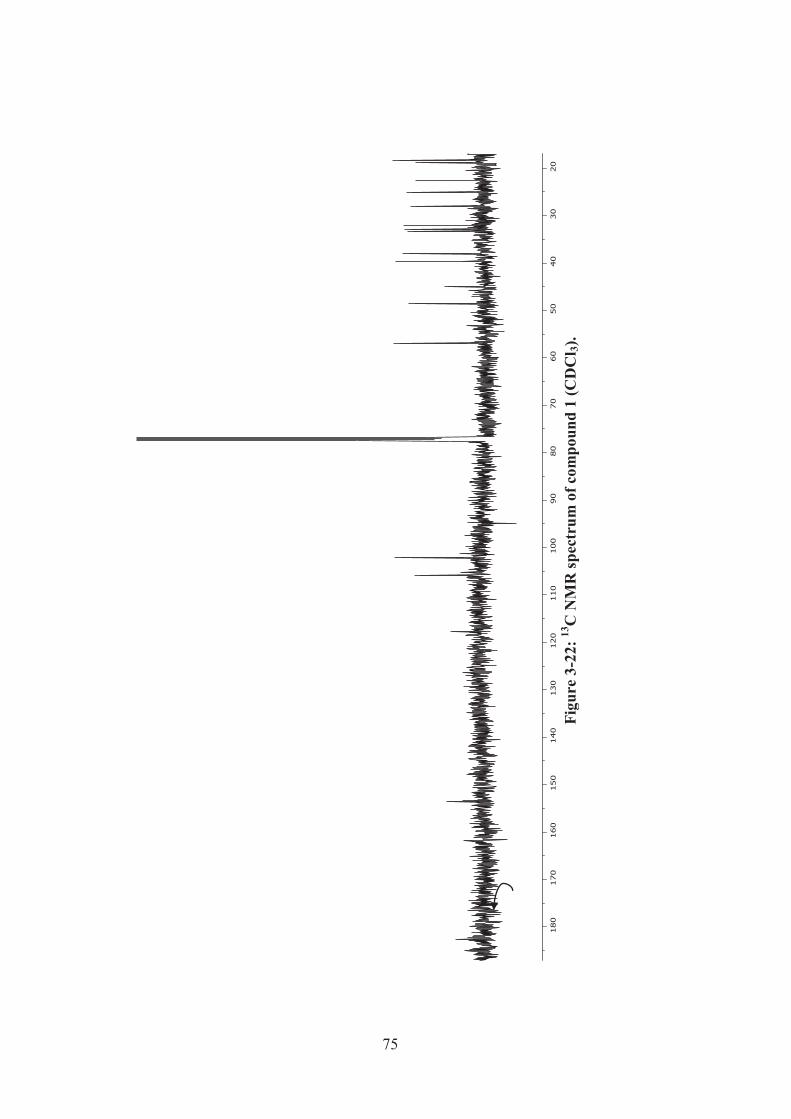
75
Fi
gure
3-2
2: 13
C N
MR
spec
trum
of c
ompo
und
1 (C
DC
l 3).
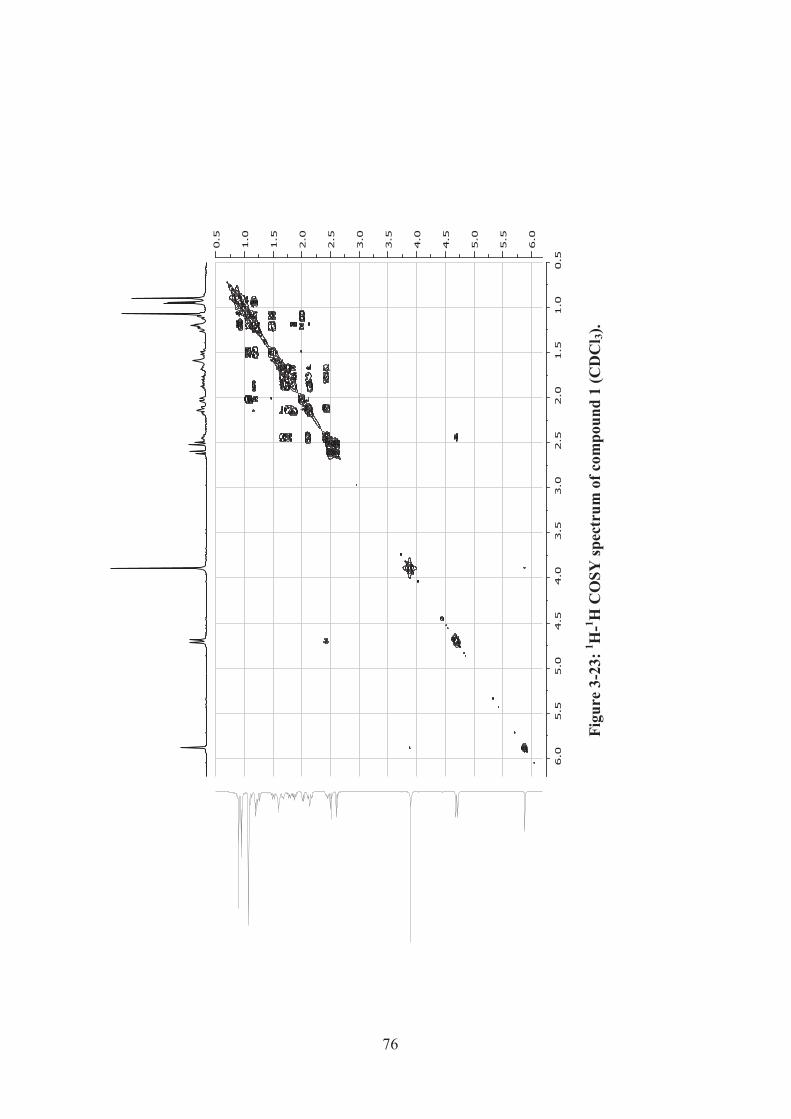
76
Figu
re 3
-23:
1 H-1 H
CO
SY sp
ectr
um o
f com
poun
d 1
(CD
Cl 3)
.
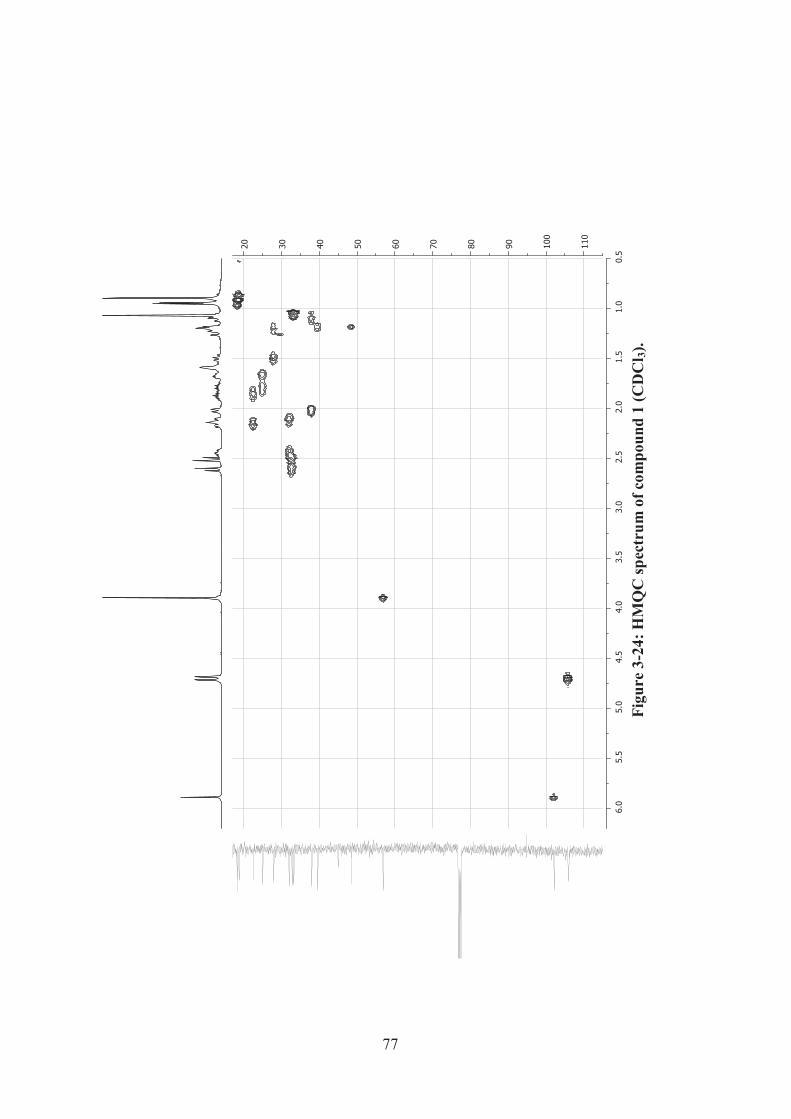
77
Fi
gure
3-2
4: H
MQ
C sp
ectr
um o
f com
poun
d 1
(CD
Cl 3)
.
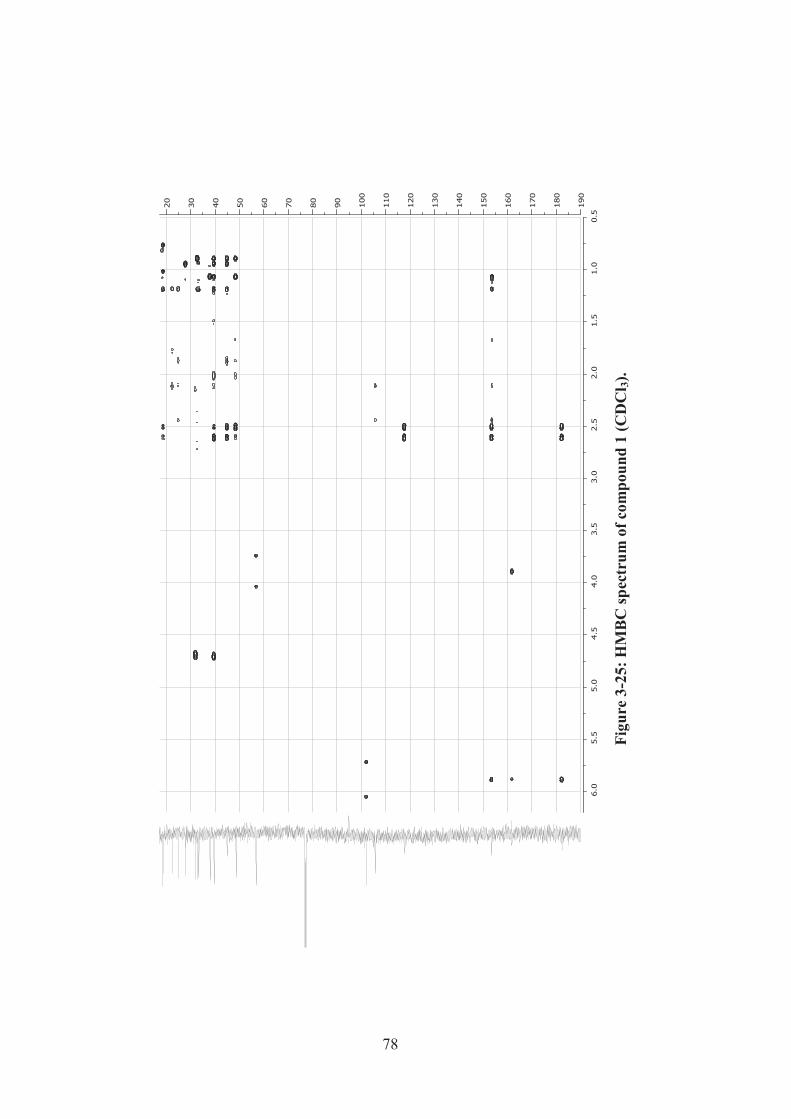
78
Fi
gure
3-2
5: H
MB
C sp
ectr
um o
f com
poun
d 1
(CD
Cl 3)
.
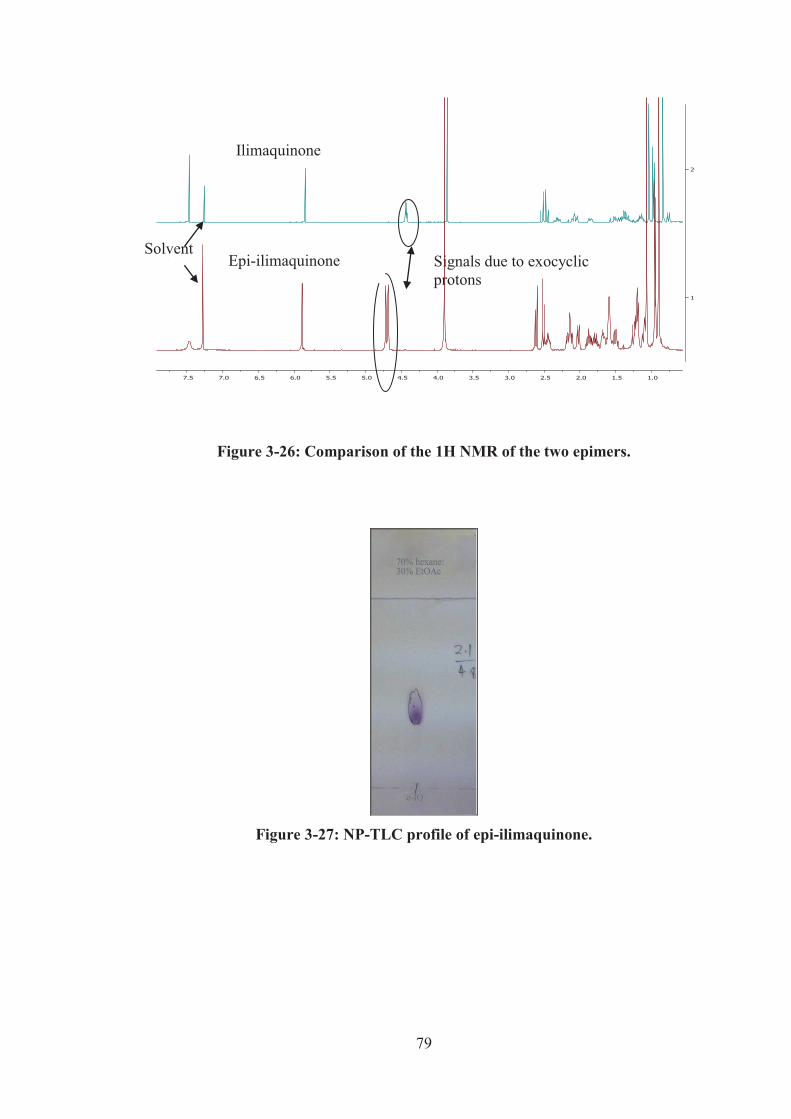
79
Solvent k Signals due to exocyclic
protons
Figure 3-26: Comparison of the 1H NMR of the two epimers.
Figure 3-27: NP-TLC profile of epi-ilimaquinone.
Ilimaquinone
Epi-ilimaquinone
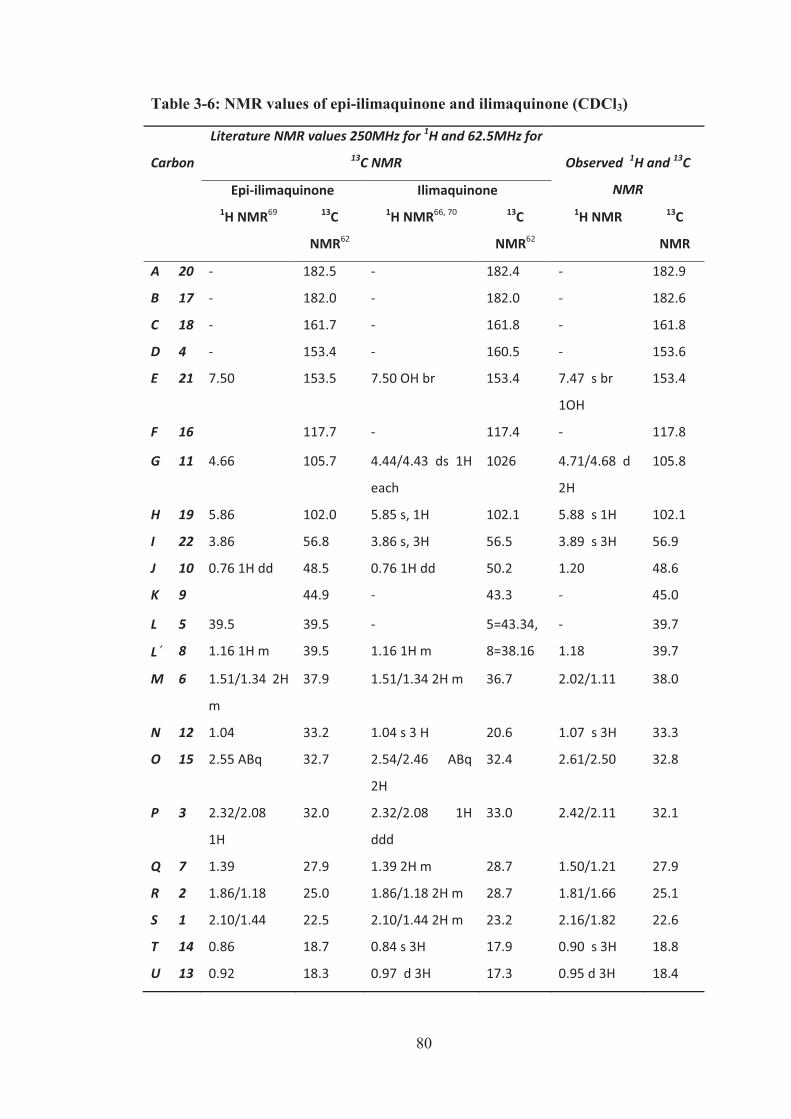
80
Table 3-6: NMR values of epi-ilimaquinone and ilimaquinone (CDCl3)
Carbon
Literature NMR values 250MHz for 1H and 62.5MHz for 13C NMR
Observed 1H and 13C
NMR Epi-ilimaquinone Ilimaquinone 1H NMR69 13C
NMR62
1H NMR66, 70 13C
NMR62
1H NMR 13C
NMR
A 20 - 182.5 - 182.4 - 182.9
B 17 - 182.0 - 182.0 - 182.6
C 18 - 161.7 - 161.8 - 161.8
D 4 - 153.4 - 160.5 - 153.6
E 21 7.50 153.5 7.50 OH br 153.4 7.47 s br
1OH
153.4
F 16 117.7 - 117.4 - 117.8
G 11 4.66 105.7 4.44/4.43 ds 1H
each
1026 4.71/4.68 d
2H
105.8
H 19 5.86 102.0 5.85 s, 1H 102.1 5.88 s 1H 102.1
I 22 3.86 56.8 3.86 s, 3H 56.5 3.89 s 3H 56.9
J 10 0.76 1H dd 48.5 0.76 1H dd 50.2 1.20 48.6
K 9 44.9 - 43.3 - 45.0
L 5 39.5 39.5 - 5=43.34, - 39.7
L΄ 8 1.16 1H m 39.5 1.16 1H m 8=38.16 1.18 39.7
M 6 1.51/1.34 2H
m
37.9 1.51/1.34 2H m 36.7 2.02/1.11 38.0
N 12 1.04 33.2 1.04 s 3 H 20.6 1.07 s 3H 33.3
O 15 2.55 ABq 32.7 2.54/2.46 ABq
2H
32.4 2.61/2.50 32.8
P 3 2.32/2.08
1H
32.0 2.32/2.08 1H
ddd
33.0 2.42/2.11 32.1
Q 7 1.39 27.9 1.39 2H m 28.7 1.50/1.21 27.9
R 2 1.86/1.18 25.0 1.86/1.18 2H m 28.7 1.81/1.66 25.1
S 1 2.10/1.44 22.5 2.10/1.44 2H m 23.2 2.16/1.82 22.6
T 14 0.86 18.7 0.84 s 3H 17.9 0.90 s 3H 18.8
U 13 0.92 18.3 0.97 d 3H 17.3 0.95 d 3H 18.4
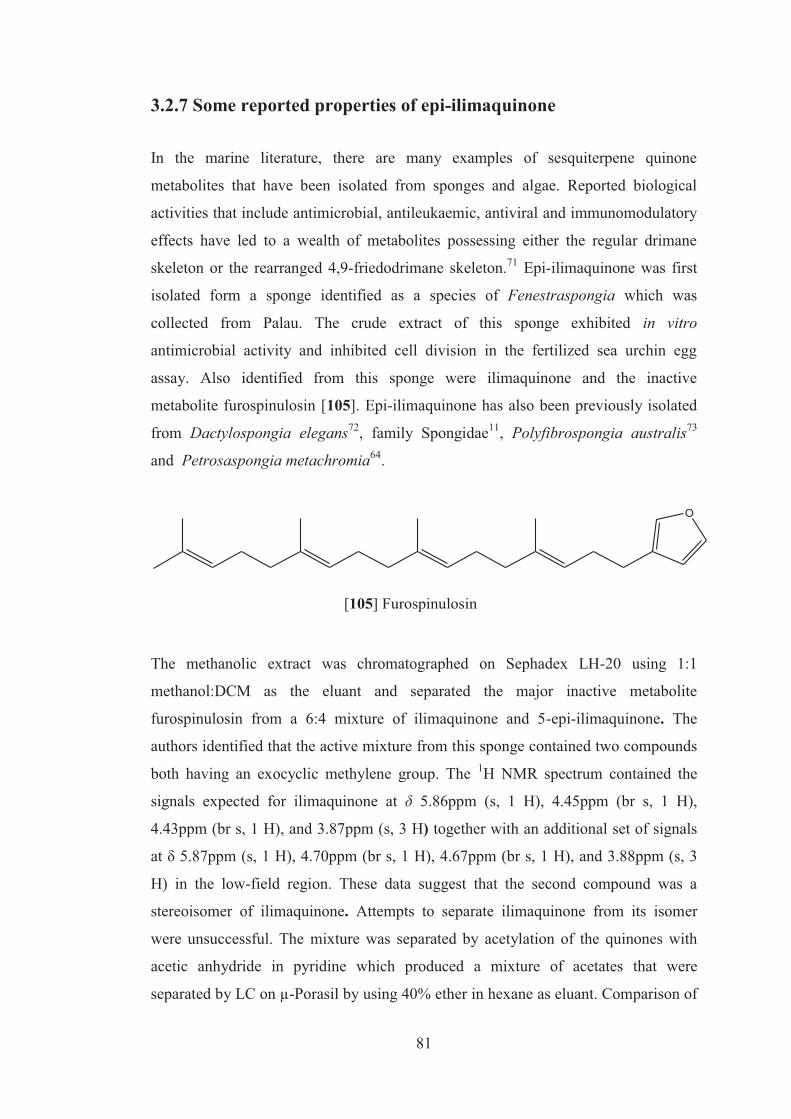
81
3.2.7 Some reported properties of epi-ilimaquinone
In the marine literature, there are many examples of sesquiterpene quinone
metabolites that have been isolated from sponges and algae. Reported biological
activities that include antimicrobial, antileukaemic, antiviral and immunomodulatory
effects have led to a wealth of metabolites possessing either the regular drimane
skeleton or the rearranged 4,9-friedodrimane skeleton.71 Epi-ilimaquinone was first
isolated form a sponge identified as a species of Fenestraspongia which was
collected from Palau. The crude extract of this sponge exhibited in vitro
antimicrobial activity and inhibited cell division in the fertilized sea urchin egg
assay. Also identified from this sponge were ilimaquinone and the inactive
metabolite furospinulosin [105]. Epi-ilimaquinone has also been previously isolated
from Dactylospongia elegans72, family Spongidae11, Polyfibrospongia australis73
and Petrosaspongia metachromia64.
O
[105] Furospinulosin
The methanolic extract was chromatographed on Sephadex LH-20 using 1:1
methanol:DCM as the eluant and separated the major inactive metabolite
furospinulosin from a 6:4 mixture of ilimaquinone and 5-epi-ilimaquinone. The
authors identified that the active mixture from this sponge contained two compounds
both having an exocyclic methylene group. The 1H NMR spectrum contained the
signals expected for ilimaquinone at δ 5.86ppm (s, 1 H), 4.45ppm (br s, 1 H),
4.43ppm (br s, 1 H), and 3.87ppm (s, 3 H) together with an additional set of signals
at δ 5.87ppm (s, 1 H), 4.70ppm (br s, 1 H), 4.67ppm (br s, 1 H), and 3.88ppm (s, 3
H) in the low-field region. These data suggest that the second compound was a
stereoisomer of ilimaquinone. Attempts to separate ilimaquinone from its isomer
were unsuccessful. The mixture was separated by acetylation of the quinones with
acetic anhydride in pyridine which produced a mixture of acetates that were
separated by LC on µ-Porasil by using 40% ether in hexane as eluant. Comparison of
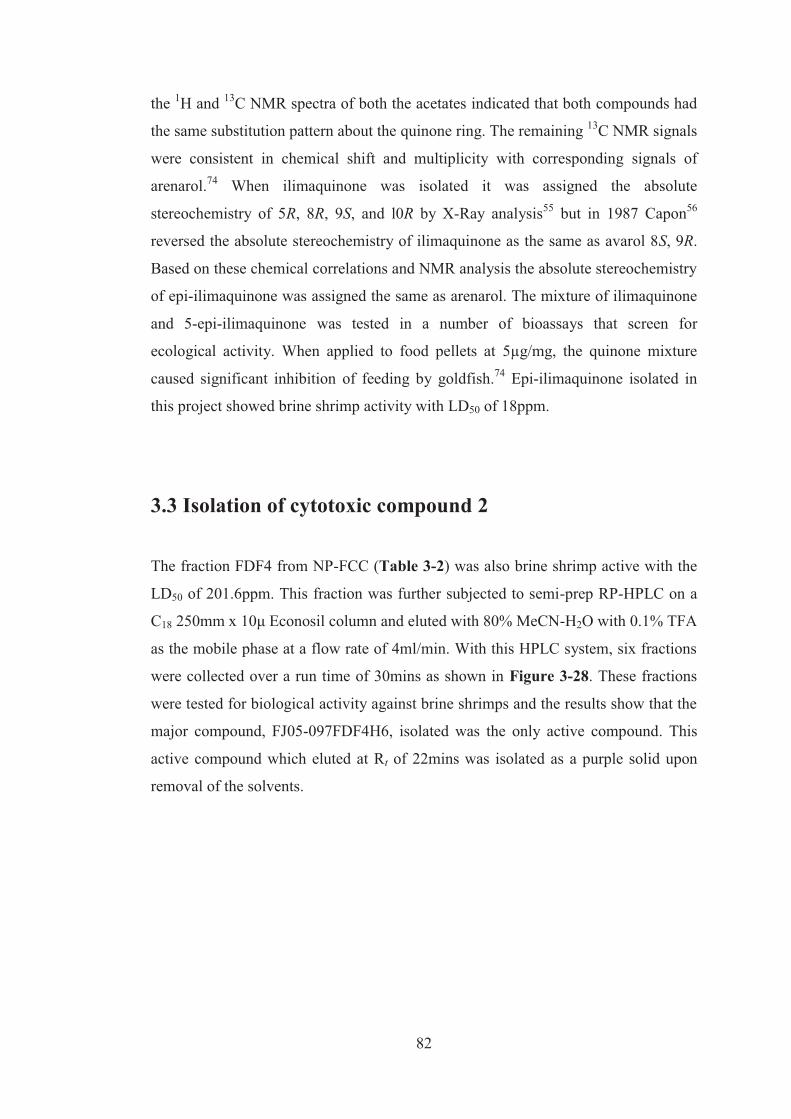
82
the 1H and 13C NMR spectra of both the acetates indicated that both compounds had
the same substitution pattern about the quinone ring. The remaining 13C NMR signals
were consistent in chemical shift and multiplicity with corresponding signals of
arenarol.74 When ilimaquinone was isolated it was assigned the absolute
stereochemistry of 5R, 8R, 9S, and l0R by X-Ray analysis55 but in 1987 Capon56
reversed the absolute stereochemistry of ilimaquinone as the same as avarol 8S, 9R.
Based on these chemical correlations and NMR analysis the absolute stereochemistry
of epi-ilimaquinone was assigned the same as arenarol. The mixture of ilimaquinone
and 5-epi-ilimaquinone was tested in a number of bioassays that screen for
ecological activity. When applied to food pellets at 5µg/mg, the quinone mixture
caused significant inhibition of feeding by goldfish.74 Epi-ilimaquinone isolated in
this project showed brine shrimp activity with LD50 of 18ppm.
3.3 Isolation of cytotoxic compound 2
The fraction FDF4 from NP-FCC (Table 3-2) was also brine shrimp active with the
LD50 of 201.6ppm. This fraction was further subjected to semi-prep RP-HPLC on a
C18 250mm x 10μ Econosil column and eluted with 80% MeCN-H2O with 0.1% TFA
as the mobile phase at a flow rate of 4ml/min. With this HPLC system, six fractions
were collected over a run time of 30mins as shown in Figure 3-28. These fractions
were tested for biological activity against brine shrimps and the results show that the
major compound, FJ05-097FDF4H6, isolated was the only active compound. This
active compound which eluted at Rt of 22mins was isolated as a purple solid upon
removal of the solvents.
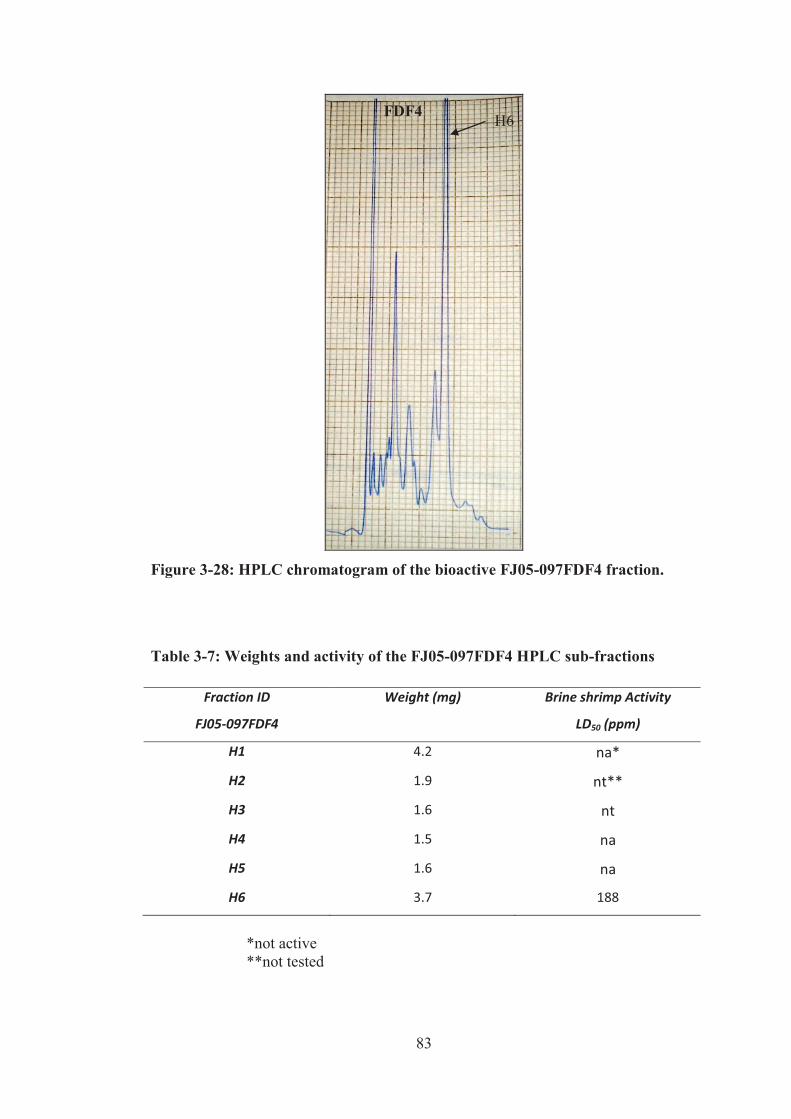
83
Figure 3-28: HPLC chromatogram of the bioactive FJ05-097FDF4 fraction.
Table 3-7: Weights and activity of the FJ05-097FDF4 HPLC sub-fractions
Fraction ID
FJ05-097FDF4
Weight (mg) Brine shrimp Activity
LD50 (ppm)
H1 4.2 na*
H2 1.9 nt**
H3 1.6 nt
H4 1.5 na
H5 1.6 na
H6 3.7 188
*not active **not tested
FDF4 H6
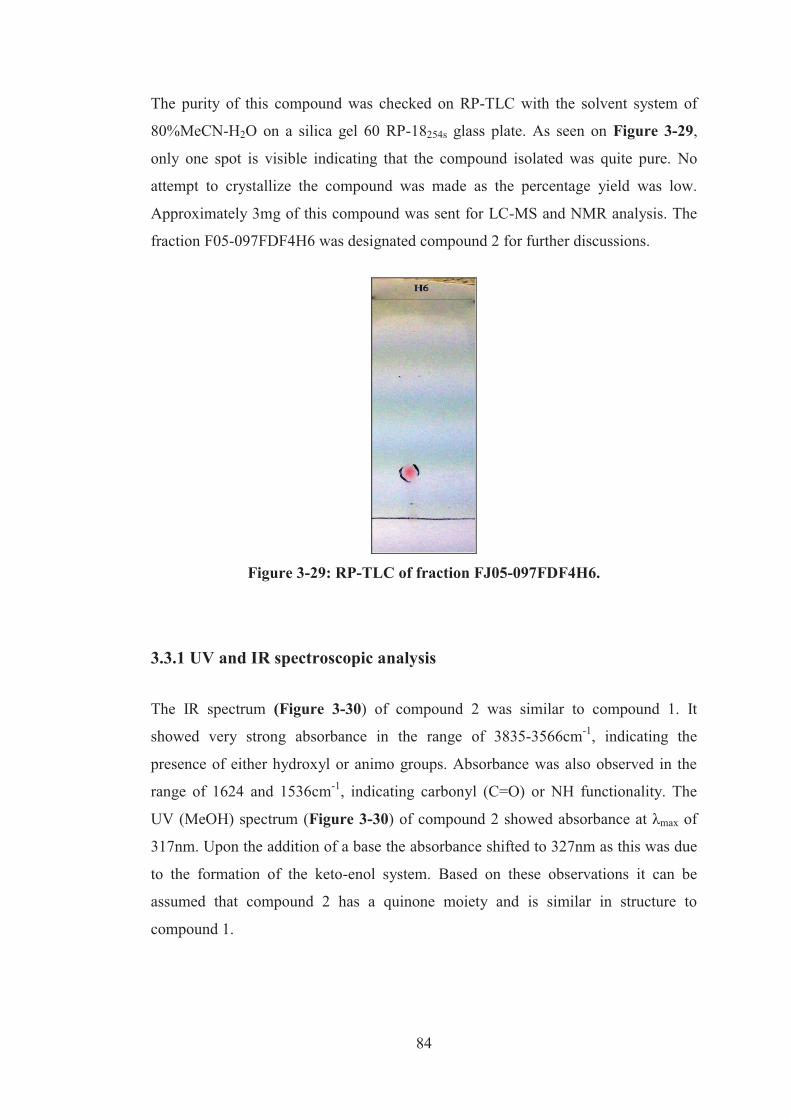
84
The purity of this compound was checked on RP-TLC with the solvent system of
80%MeCN-H2O on a silica gel 60 RP-18254s glass plate. As seen on Figure 3-29,
only one spot is visible indicating that the compound isolated was quite pure. No
attempt to crystallize the compound was made as the percentage yield was low.
Approximately 3mg of this compound was sent for LC-MS and NMR analysis. The
fraction F05-097FDF4H6 was designated compound 2 for further discussions.
Figure 3-29: RP-TLC of fraction FJ05-097FDF4H6.
3.3.1 UV and IR spectroscopic analysis
The IR spectrum (Figure 3-30) of compound 2 was similar to compound 1. It
showed very strong absorbance in the range of 3835-3566cm-1, indicating the
presence of either hydroxyl or animo groups. Absorbance was also observed in the
range of 1624 and 1536cm-1, indicating carbonyl (C=O) or NH functionality. The
UV (MeOH) spectrum (Figure 3-30) of compound 2 showed absorbance at λmax of
317nm. Upon the addition of a base the absorbance shifted to 327nm as this was due
to the formation of the keto-enol system. Based on these observations it can be
assumed that compound 2 has a quinone moiety and is similar in structure to
compound 1.
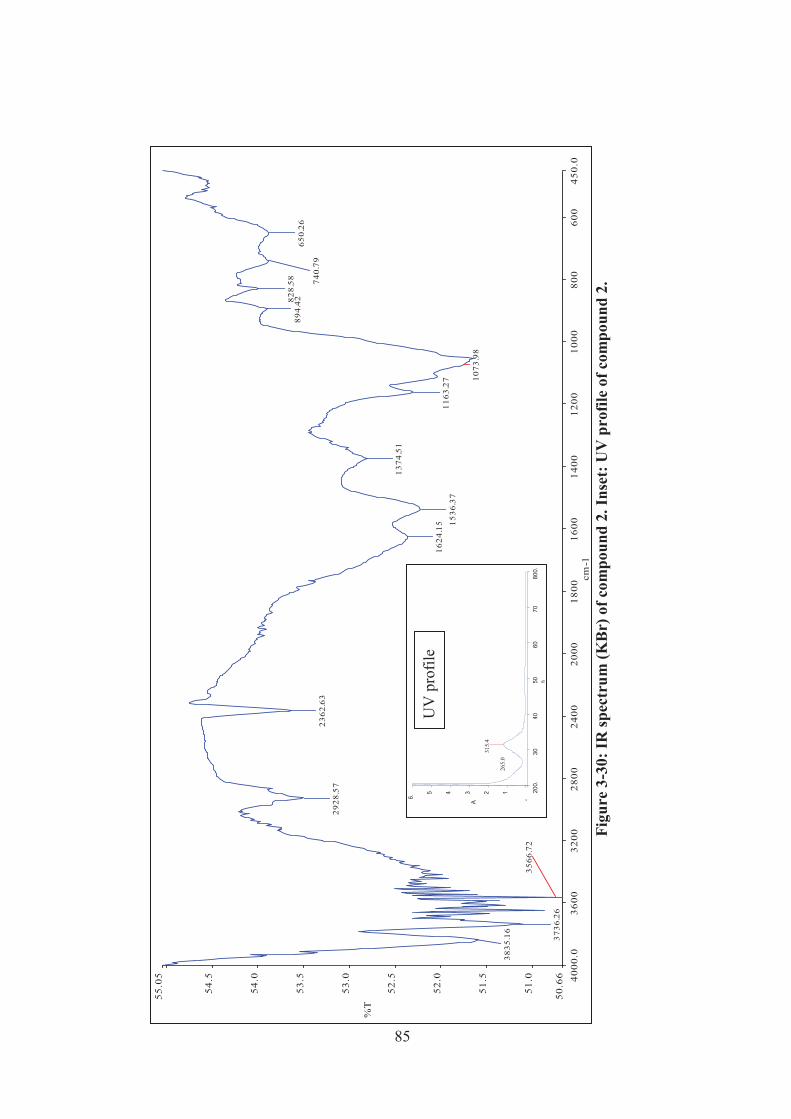
85
200.
3040
5060
7080
0.-
12345
6.
n
A
315.
4
265.
0
UV
pro
file
Figu
re 3
-30:
IR sp
ectr
um (K
Br)
of c
ompo
und
2. In
set:
UV
pro
file
of c
ompo
und
2.
4000
.036
0032
0028
0024
0020
0018
0016
0014
0012
0010
0080
060
045
0.0
50.6
6
51.0
51.5
52.0
52.5
53.0
53.5
54.0
54.5
55.0
5
cm-1
%T
3566
.72
1073
.98
650.
26
740.
79
828.
5889
4.42
1163
.27
1374
.51
1536
.37
1624
.15
2362
.63
2928
.57
3736
.26
3835
.16
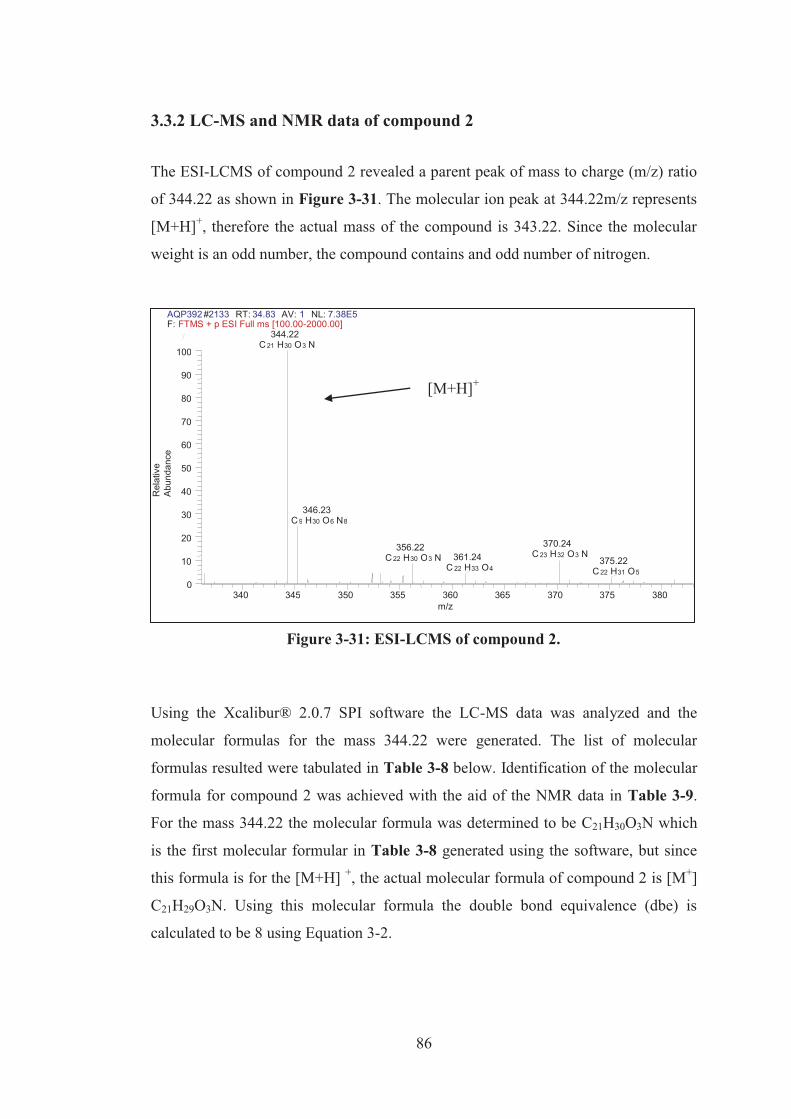
86
3.3.2 LC-MS and NMR data of compound 2
The ESI-LCMS of compound 2 revealed a parent peak of mass to charge (m/z) ratio
of 344.22 as shown in Figure 3-31. The molecular ion peak at 344.22m/z represents
[M+H]+, therefore the actual mass of the compound is 343.22. Since the molecular
weight is an odd number, the compound contains and odd number of nitrogen.
Using the Xcalibur® 2.0.7 SPI software the LC-MS data was analyzed and the
molecular formulas for the mass 344.22 were generated. The list of molecular
formulas resulted were tabulated in Table 3-8 below. Identification of the molecular
formula for compound 2 was achieved with the aid of the NMR data in Table 3-9.
For the mass 344.22 the molecular formula was determined to be C21H30O3N which
is the first molecular formular in Table 3-8 generated using the software, but since
this formula is for the [M+H] +, the actual molecular formula of compound 2 is [M+]
C21H29O3N. Using this molecular formula the double bond equivalence (dbe) is
calculated to be 8 using Equation 3-2.
AQP392 # 2133 RT: 34.83 AV: 1 NL: 7.38E5 F: FTMS + p ESI Full ms [100.00-2000.00]
340 345 350 355 360 365 370 375 380 m/z
0 10 20 30 40 50 60 70 80 90
100 344.22
C 21 H 30 O 3 N
370.24 C 23 H 32 O 3 N 356.22
C 22 H 30 O 3 N 361.24 C 22 H 33 O 4 375.22
C 22 H 31 O 5
346.23 C 9 H 30 O 6 N 8
[M+H]+
Rel
ativ
e A
bund
ance
Figure 3-31: ESI-LCMS of compound 2.
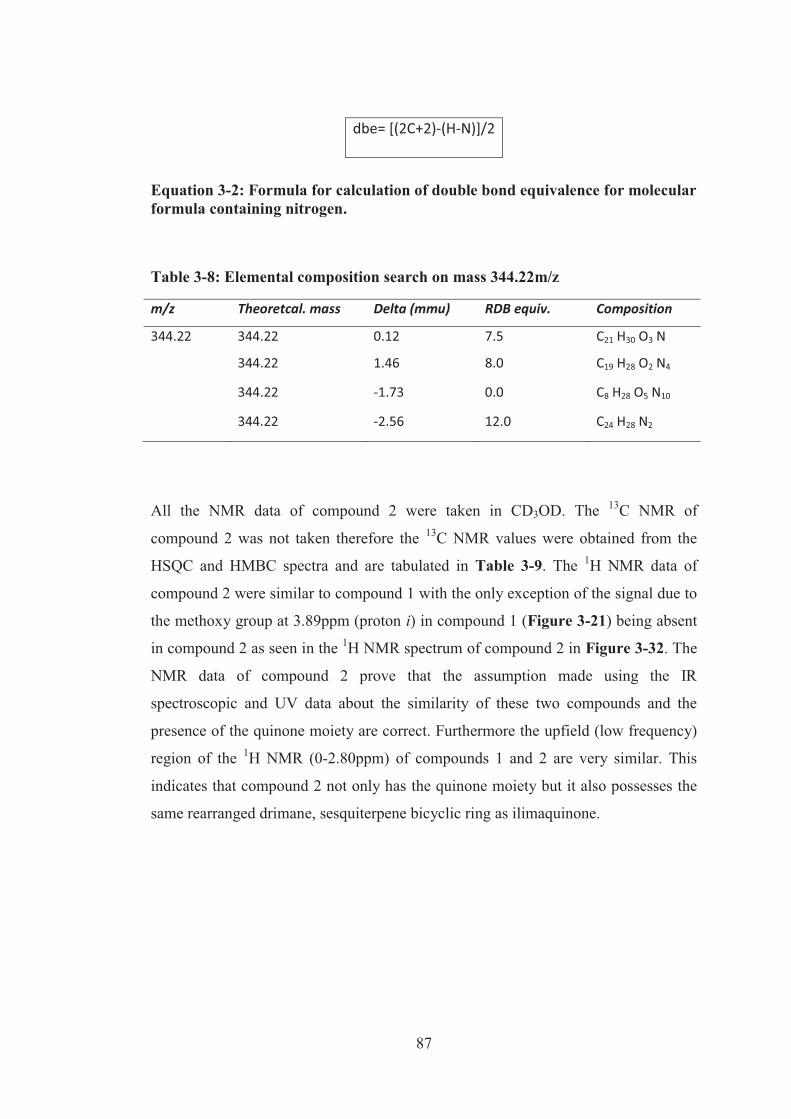
87
Equation 3-2: Formula for calculation of double bond equivalence for molecular formula containing nitrogen.
Table 3-8: Elemental composition search on mass 344.22m/z
m/z Theoretcal. mass Delta (mmu) RDB equiv. Composition
344.22 344.22 0.12 7.5 C21 H30 O3 N
344.22 1.46 8.0 C19 H28 O2 N4
344.22 -1.73 0.0 C8 H28 O5 N10
344.22 -2.56 12.0 C24 H28 N2
All the NMR data of compound 2 were taken in CD3OD. The 13C NMR of
compound 2 was not taken therefore the 13C NMR values were obtained from the
HSQC and HMBC spectra and are tabulated in Table 3-9. The 1H NMR data of
compound 2 were similar to compound 1 with the only exception of the signal due to
the methoxy group at 3.89ppm (proton i) in compound 1 (Figure 3-21) being absent
in compound 2 as seen in the 1H NMR spectrum of compound 2 in Figure 3-32. The
NMR data of compound 2 prove that the assumption made using the IR
spectroscopic and UV data about the similarity of these two compounds and the
presence of the quinone moiety are correct. Furthermore the upfield (low frequency)
region of the 1H NMR (0-2.80ppm) of compounds 1 and 2 are very similar. This
indicates that compound 2 not only has the quinone moiety but it also possesses the
same rearranged drimane, sesquiterpene bicyclic ring as ilimaquinone.
dbe= [(2C+2)-(H-N)]/2
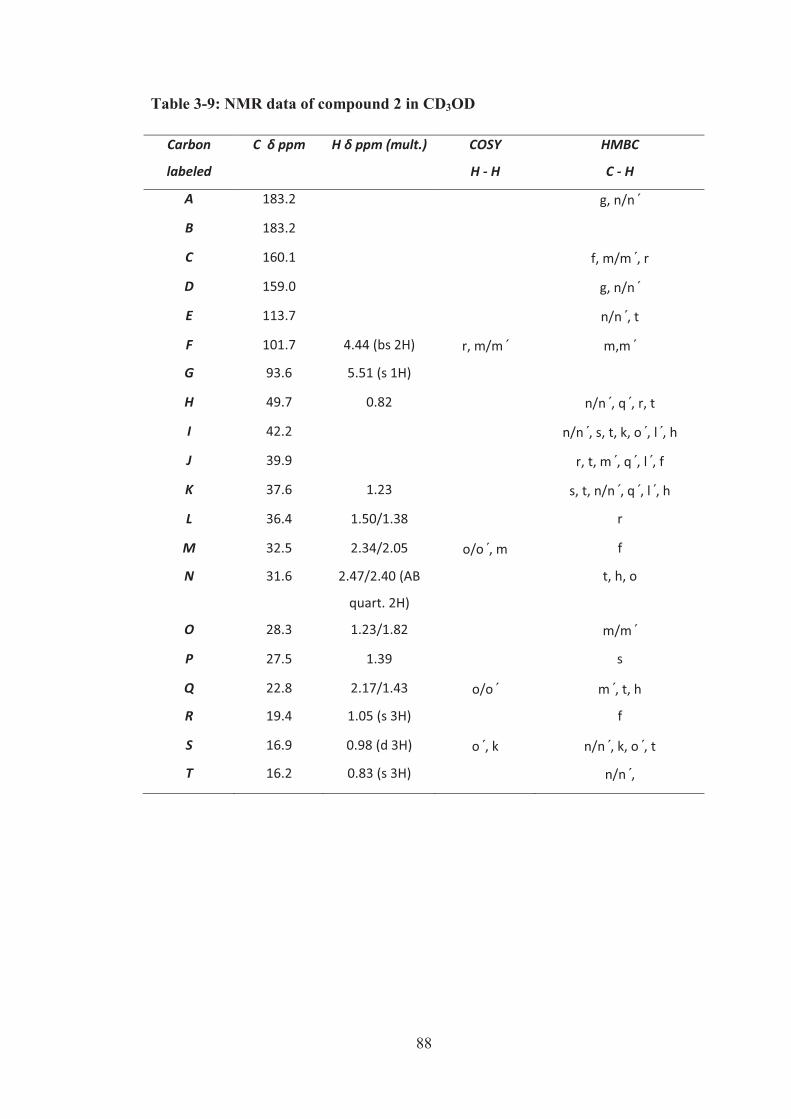
88
Table 3-9: NMR data of compound 2 in CD3OD
Carbon
labeled
C δ ppm H δ ppm (mult.) COSY
H - H
HMBC
C - H
A 183.2 g, n/n΄
B 183.2
C 160.1 f, m/m΄, r
D 159.0 g, n/n΄
E 113.7 n/n΄, t
F 101.7 4.44 (bs 2H) r, m/m΄ m,m΄
G 93.6 5.51 (s 1H)
H 49.7 0.82 n/n΄, q΄, r, t
I 42.2 n/n΄, s, t, k, o΄, l΄, h
J 39.9 r, t, m΄, q΄, l΄, f
K 37.6 1.23 s, t, n/n΄, q΄, l΄, h
L 36.4 1.50/1.38 r
M 32.5 2.34/2.05 o/o΄, m f
N 31.6 2.47/2.40 (AB
quart. 2H)
t, h, o
O 28.3 1.23/1.82 m/m΄
P 27.5 1.39 s
Q 22.8 2.17/1.43 o/o΄ m΄, t, h
R 19.4 1.05 (s 3H) f
S 16.9 0.98 (d 3H) o΄, k n/n΄, k, o΄, t
T 16.2 0.83 (s 3H) n/n΄,
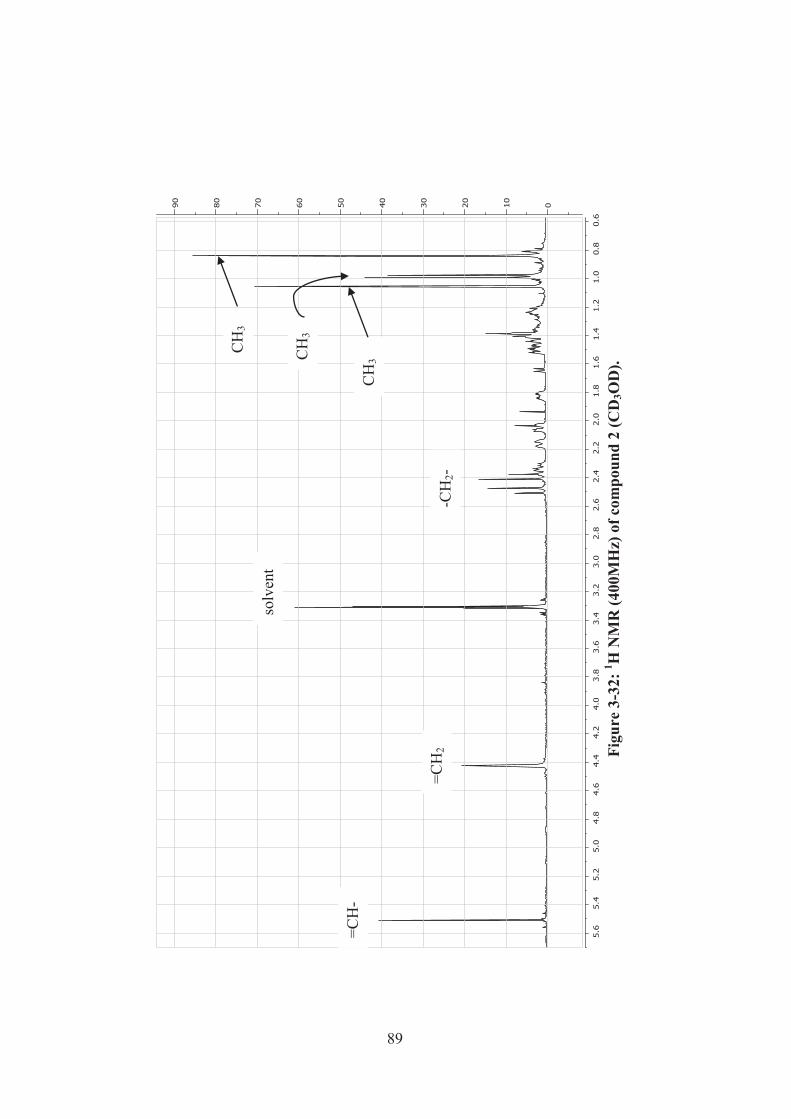
89
Fi
gure
3-3
2: 1 H
NM
R (4
00M
Hz)
of c
ompo
und
2 (C
D3O
D).
=CH
-
=CH
2
CH
3
CH
3
-CH
2-
solv
ent
CH
3
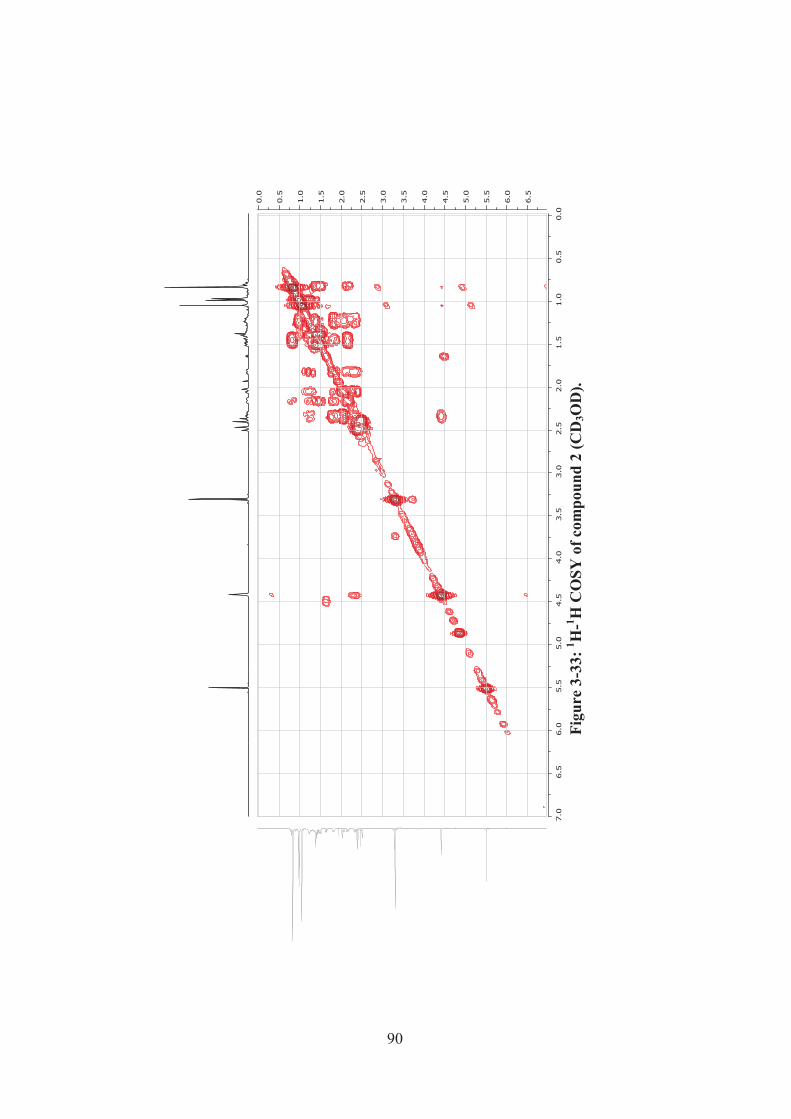
90
Fi
gure
3-3
3: 1 H
-1 H C
OSY
of c
ompo
und
2 (C
D3O
D).
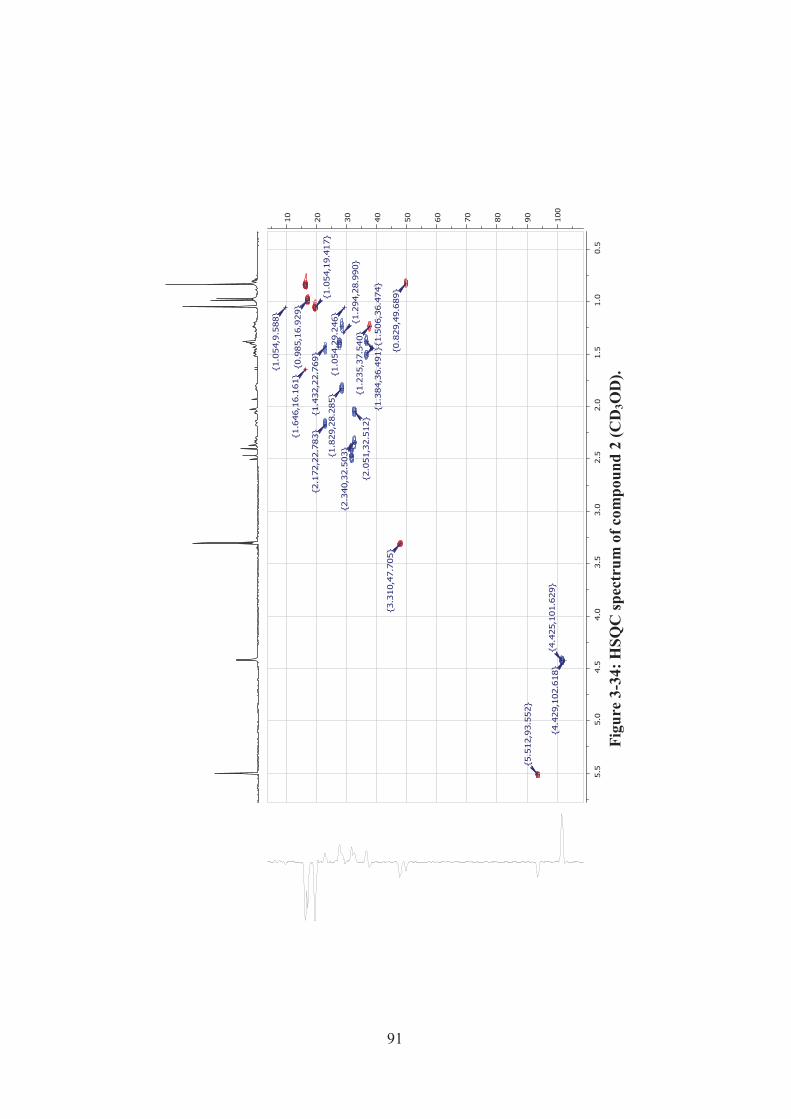
91
Fi
gure
3-3
4: H
SQC
spec
trum
of c
ompo
und
2 (C
D3O
D).
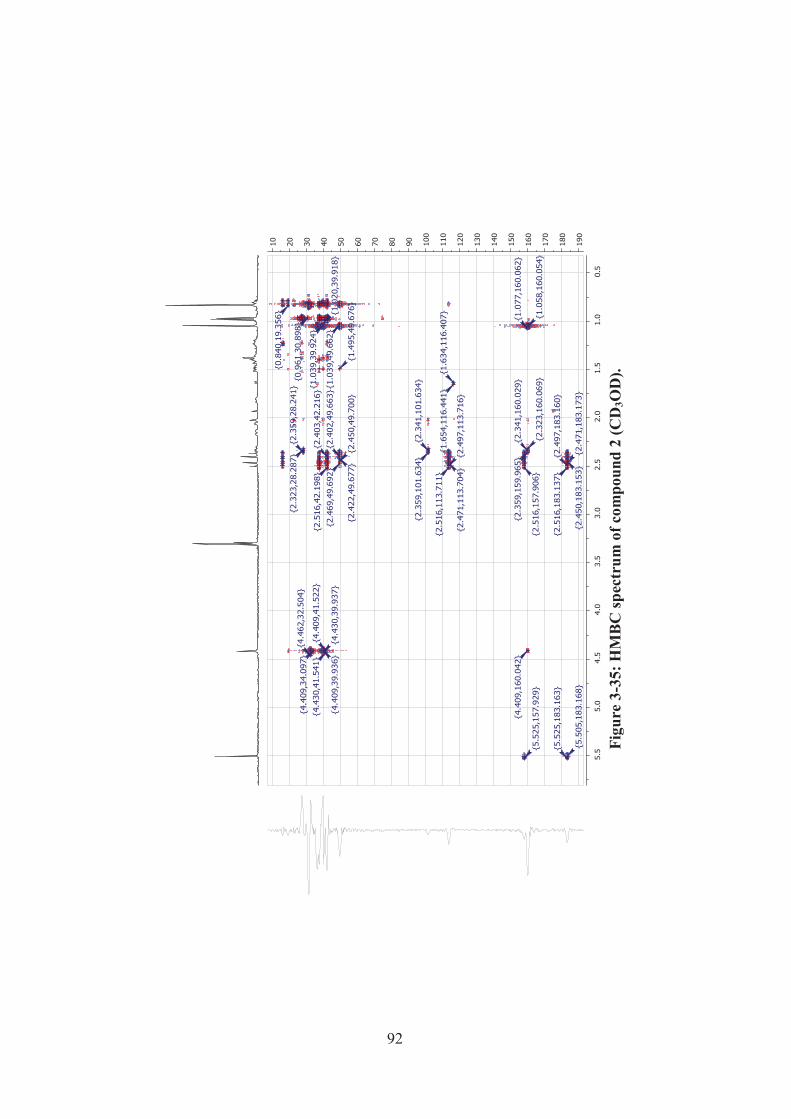
92
Fi
gure
3-3
5: H
MB
C sp
ectr
um o
f com
poun
d 2
(CD
3OD
).
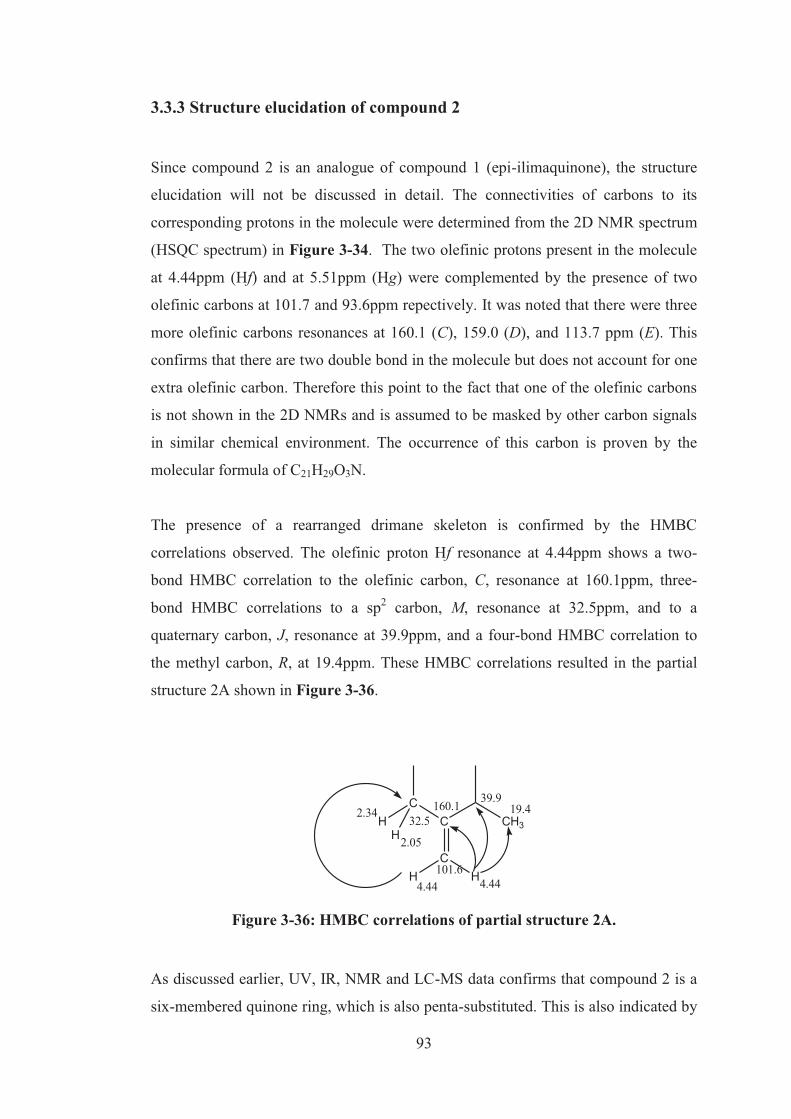
93
3.3.3 Structure elucidation of compound 2
Since compound 2 is an analogue of compound 1 (epi-ilimaquinone), the structure
elucidation will not be discussed in detail. The connectivities of carbons to its
corresponding protons in the molecule were determined from the 2D NMR spectrum
(HSQC spectrum) in Figure 3-34. The two olefinic protons present in the molecule
at 4.44ppm (Hf) and at 5.51ppm (Hg) were complemented by the presence of two
olefinic carbons at 101.7 and 93.6ppm repectively. It was noted that there were three
more olefinic carbons resonances at 160.1 (C), 159.0 (D), and 113.7 ppm (E). This
confirms that there are two double bond in the molecule but does not account for one
extra olefinic carbon. Therefore this point to the fact that one of the olefinic carbons
is not shown in the 2D NMRs and is assumed to be masked by other carbon signals
in similar chemical environment. The occurrence of this carbon is proven by the
molecular formula of C21H29O3N.
The presence of a rearranged drimane skeleton is confirmed by the HMBC
correlations observed. The olefinic proton Hf resonance at 4.44ppm shows a two-
bond HMBC correlation to the olefinic carbon, C, resonance at 160.1ppm, three-
bond HMBC correlations to a sp2 carbon, M, resonance at 32.5ppm, and to a
quaternary carbon, J, resonance at 39.9ppm, and a four-bond HMBC correlation to
the methyl carbon, R, at 19.4ppm. These HMBC correlations resulted in the partial
structure 2A shown in Figure 3-36.
C
CH H
CCH3H
H
160.1
101.6
39.9
32.5
4.44 4.44
2.34
2.05
19.4
Figure 3-36: HMBC correlations of partial structure 2A.
As discussed earlier, UV, IR, NMR and LC-MS data confirms that compound 2 is a
six-membered quinone ring, which is also penta-substituted. This is also indicated by
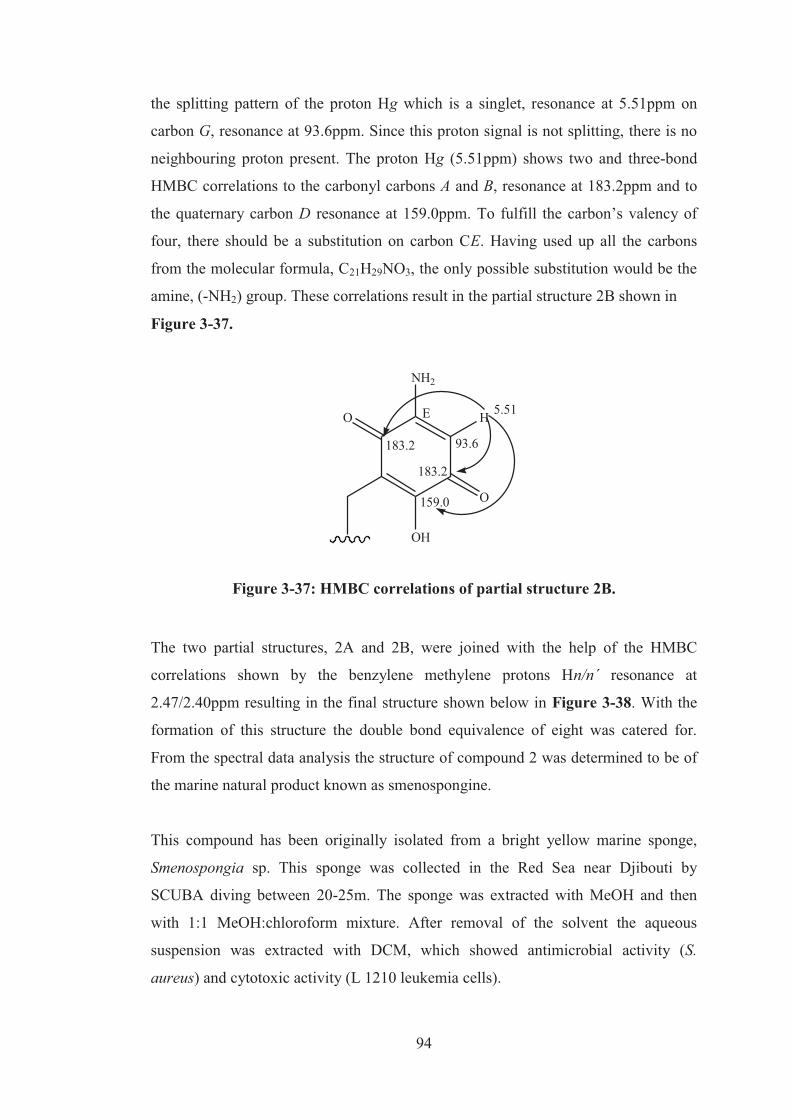
94
the splitting pattern of the proton Hg which is a singlet, resonance at 5.51ppm on
carbon G, resonance at 93.6ppm. Since this proton signal is not splitting, there is no
neighbouring proton present. The proton Hg (5.51ppm) shows two and three-bond
HMBC correlations to the carbonyl carbons A and B, resonance at 183.2ppm and to
the quaternary carbon D resonance at 159.0ppm. To fulfill the carbon’s valency of
four, there should be a substitution on carbon CE. Having used up all the carbons
from the molecular formula, C21H29NO3, the only possible substitution would be the
amine, (-NH2) group. These correlations result in the partial structure 2B shown in
Figure 3-37.
O
O
NH2
OH
H
183.2
183.2
93.6
159.0
5.51E
Figure 3-37: HMBC correlations of partial structure 2B.
The two partial structures, 2A and 2B, were joined with the help of the HMBC
correlations shown by the benzylene methylene protons Hn/n΄ resonance at
2.47/2.40ppm resulting in the final structure shown below in Figure 3-38. With the
formation of this structure the double bond equivalence of eight was catered for.
From the spectral data analysis the structure of compound 2 was determined to be of
the marine natural product known as smenospongine.
This compound has been originally isolated from a bright yellow marine sponge,
Smenospongia sp. This sponge was collected in the Red Sea near Djibouti by
SCUBA diving between 20-25m. The sponge was extracted with MeOH and then
with 1:1 MeOH:chloroform mixture. After removal of the solvent the aqueous
suspension was extracted with DCM, which showed antimicrobial activity (S.
aureus) and cytotoxic activity (L 1210 leukemia cells).
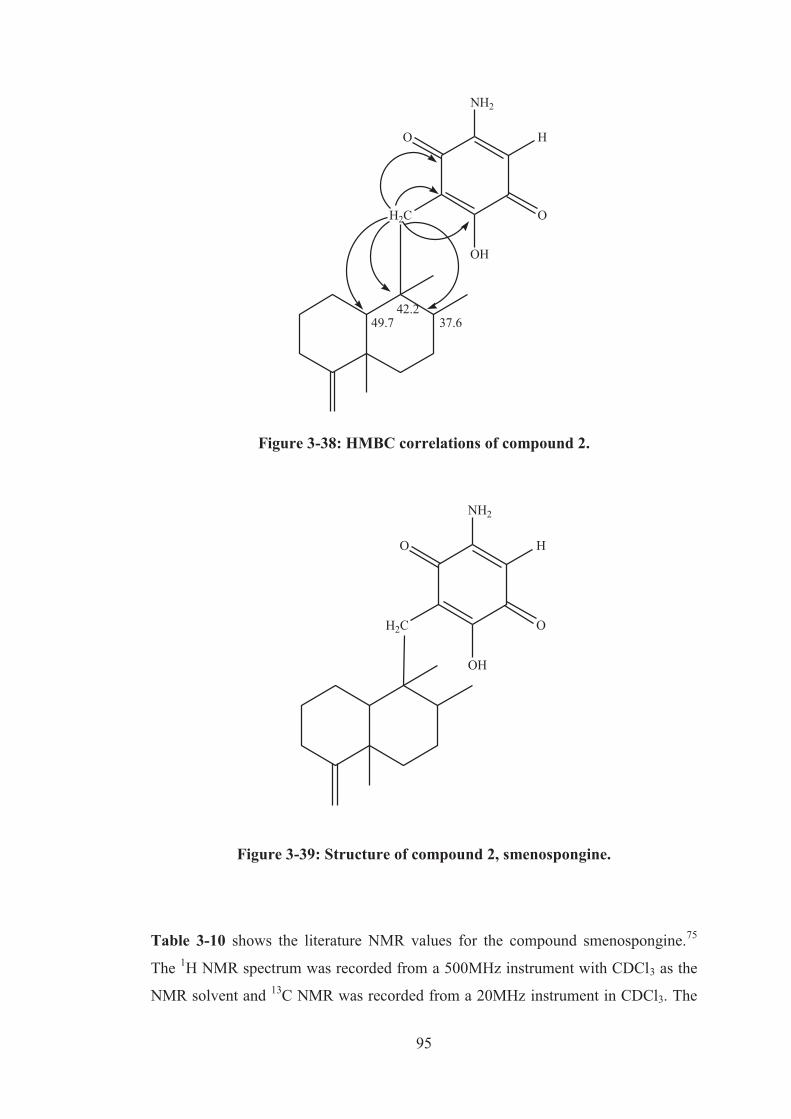
95
O
OH
O
NH2
H2C
H
49.7 37.642.2
Figure 3-38: HMBC correlations of compound 2.
O
OH
O
NH2
H2C
H
Figure 3-39: Structure of compound 2, smenospongine.
Table 3-10 shows the literature NMR values for the compound smenospongine.75
The 1H NMR spectrum was recorded from a 500MHz instrument with CDCl3 as the
NMR solvent and 13C NMR was recorded from a 20MHz instrument in CDCl3. The
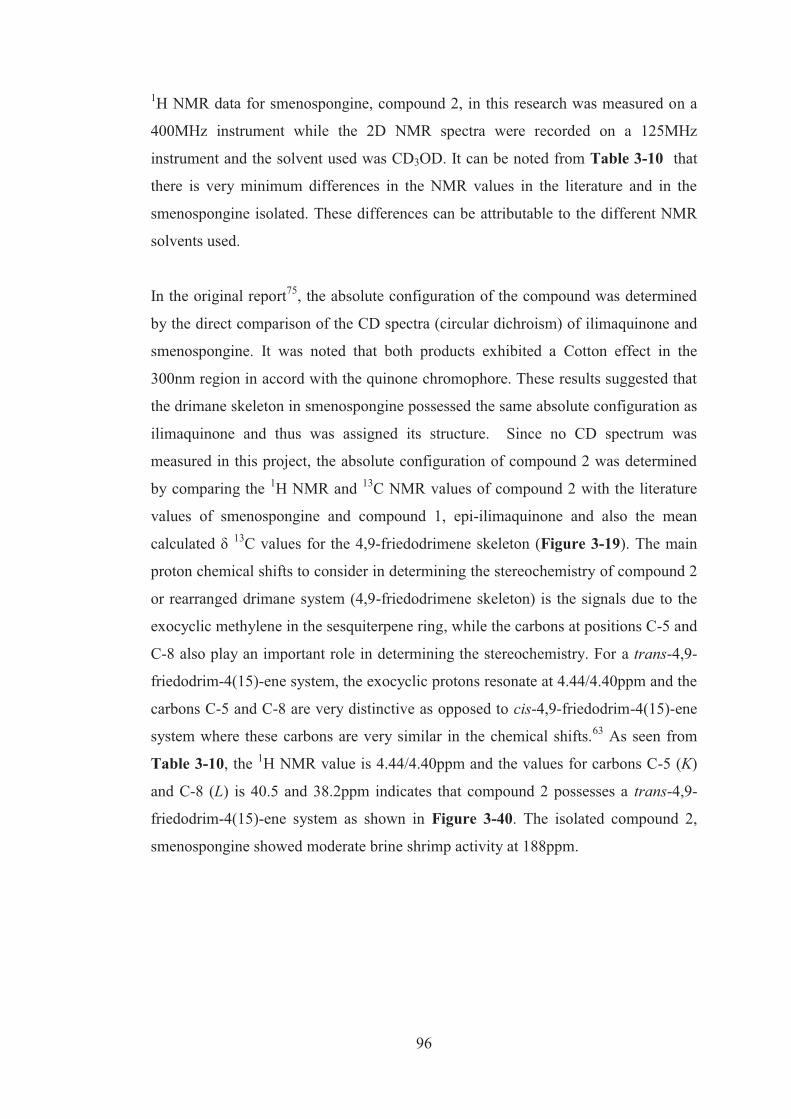
96
1H NMR data for smenospongine, compound 2, in this research was measured on a
400MHz instrument while the 2D NMR spectra were recorded on a 125MHz
instrument and the solvent used was CD3OD. It can be noted from Table 3-10 that
there is very minimum differences in the NMR values in the literature and in the
smenospongine isolated. These differences can be attributable to the different NMR
solvents used.
In the original report75, the absolute configuration of the compound was determined
by the direct comparison of the CD spectra (circular dichroism) of ilimaquinone and
smenospongine. It was noted that both products exhibited a Cotton effect in the
300nm region in accord with the quinone chromophore. These results suggested that
the drimane skeleton in smenospongine possessed the same absolute configuration as
ilimaquinone and thus was assigned its structure. Since no CD spectrum was
measured in this project, the absolute configuration of compound 2 was determined
by comparing the 1H NMR and 13C NMR values of compound 2 with the literature
values of smenospongine and compound 1, epi-ilimaquinone and also the mean
calculated δ 13C values for the 4,9-friedodrimene skeleton (Figure 3-19). The main
proton chemical shifts to consider in determining the stereochemistry of compound 2
or rearranged drimane system (4,9-friedodrimene skeleton) is the signals due to the
exocyclic methylene in the sesquiterpene ring, while the carbons at positions C-5 and
C-8 also play an important role in determining the stereochemistry. For a trans-4,9-
friedodrim-4(15)-ene system, the exocyclic protons resonate at 4.44/4.40ppm and the
carbons C-5 and C-8 are very distinctive as opposed to cis-4,9-friedodrim-4(15)-ene
system where these carbons are very similar in the chemical shifts.63 As seen from
Table 3-10, the 1H NMR value is 4.44/4.40ppm and the values for carbons C-5 (K)
and C-8 (L) is 40.5 and 38.2ppm indicates that compound 2 possesses a trans-4,9-
friedodrim-4(15)-ene system as shown in Figure 3-40. The isolated compound 2,
smenospongine showed moderate brine shrimp activity at 188ppm.
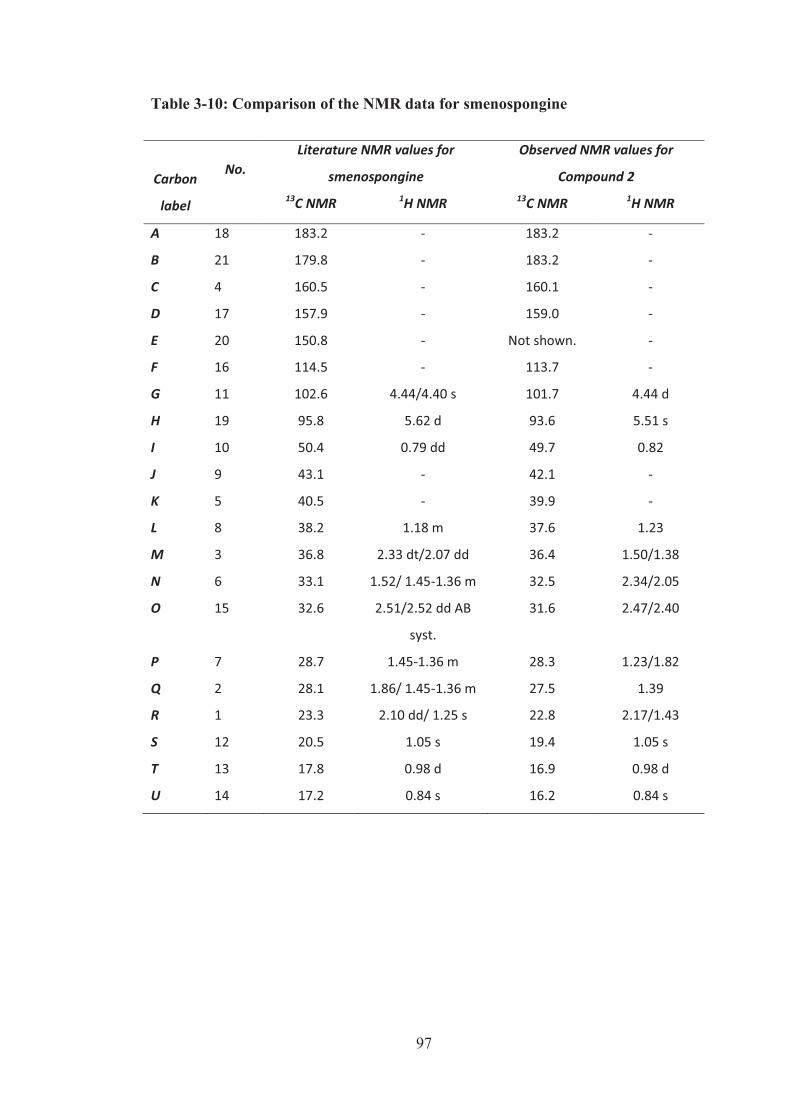
97
Table 3-10: Comparison of the NMR data for smenospongine
Carbon
label
No.
Literature NMR values for
smenospongine
Observed NMR values for
Compound 2 13C NMR 1H NMR 13C NMR 1H NMR
A 18 183.2 - 183.2 -
B 21 179.8 - 183.2 -
C 4 160.5 - 160.1 -
D 17 157.9 - 159.0 -
E 20 150.8 - Not shown. -
F 16 114.5 - 113.7 -
G 11 102.6 4.44/4.40 s 101.7 4.44 d
H 19 95.8 5.62 d 93.6 5.51 s
I 10 50.4 0.79 dd 49.7 0.82
J 9 43.1 - 42.1 -
K 5 40.5 - 39.9 -
L 8 38.2 1.18 m 37.6 1.23
M 3 36.8 2.33 dt/2.07 dd 36.4 1.50/1.38
N 6 33.1 1.52/ 1.45-1.36 m 32.5 2.34/2.05
O 15 32.6 2.51/2.52 dd AB
syst.
31.6 2.47/2.40
P 7 28.7 1.45-1.36 m 28.3 1.23/1.82
Q 2 28.1 1.86/ 1.45-1.36 m 27.5 1.39
R 1 23.3 2.10 dd/ 1.25 s 22.8 2.17/1.43
S 12 20.5 1.05 s 19.4 1.05 s
T 13 17.8 0.98 d 16.9 0.98 d
U 14 17.2 0.84 s 16.2 0.84 s
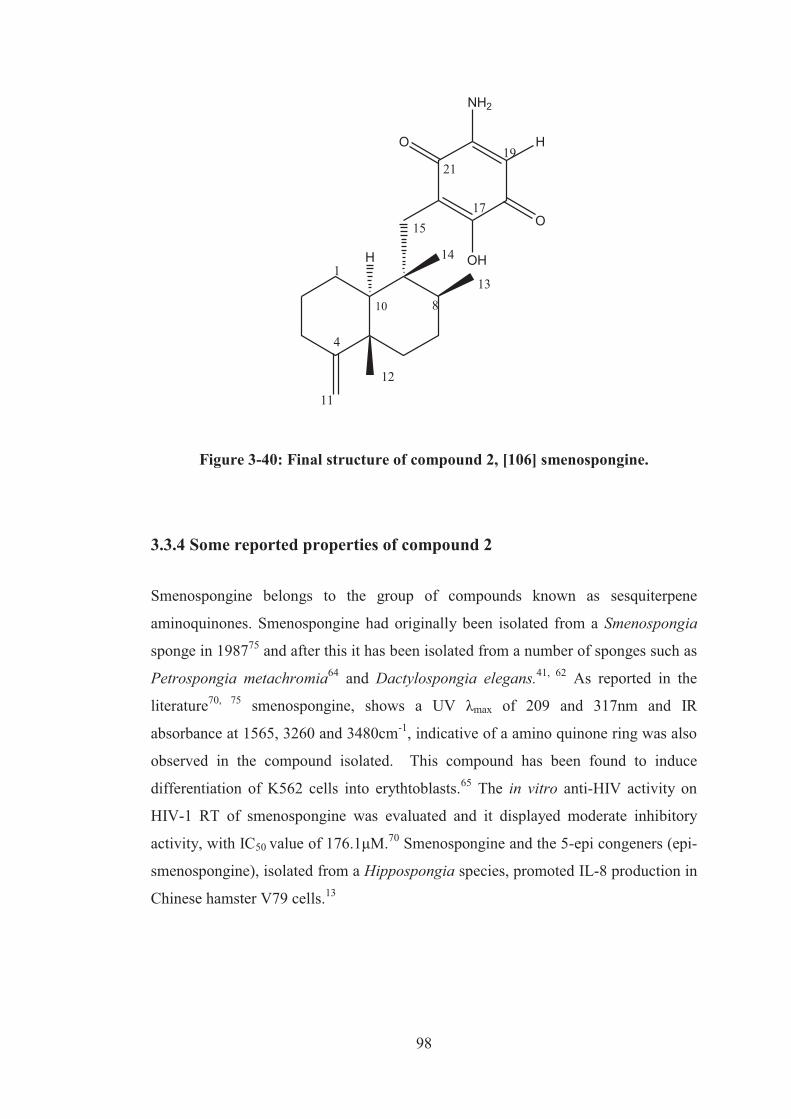
98
O
O
NH2
H
H OH1
4
12
813
14
10
1517
1921
11
Figure 3-40: Final structure of compound 2, [106] smenospongine.
3.3.4 Some reported properties of compound 2
Smenospongine belongs to the group of compounds known as sesquiterpene
aminoquinones. Smenospongine had originally been isolated from a Smenospongia
sponge in 198775 and after this it has been isolated from a number of sponges such as
Petrospongia metachromia64 and Dactylospongia elegans.41, 62 As reported in the
literature70, 75 smenospongine, shows a UV λmax of 209 and 317nm and IR
absorbance at 1565, 3260 and 3480cm-1, indicative of a amino quinone ring was also
observed in the compound isolated. This compound has been found to induce
differentiation of K562 cells into erythtoblasts.65 The in vitro anti-HIV activity on
HIV-1 RT of smenospongine was evaluated and it displayed moderate inhibitory
activity, with IC50 value of 176.1μM.70 Smenospongine and the 5-epi congeners (epi-
smenospongine), isolated from a Hippospongia species, promoted IL-8 production in
Chinese hamster V79 cells.13
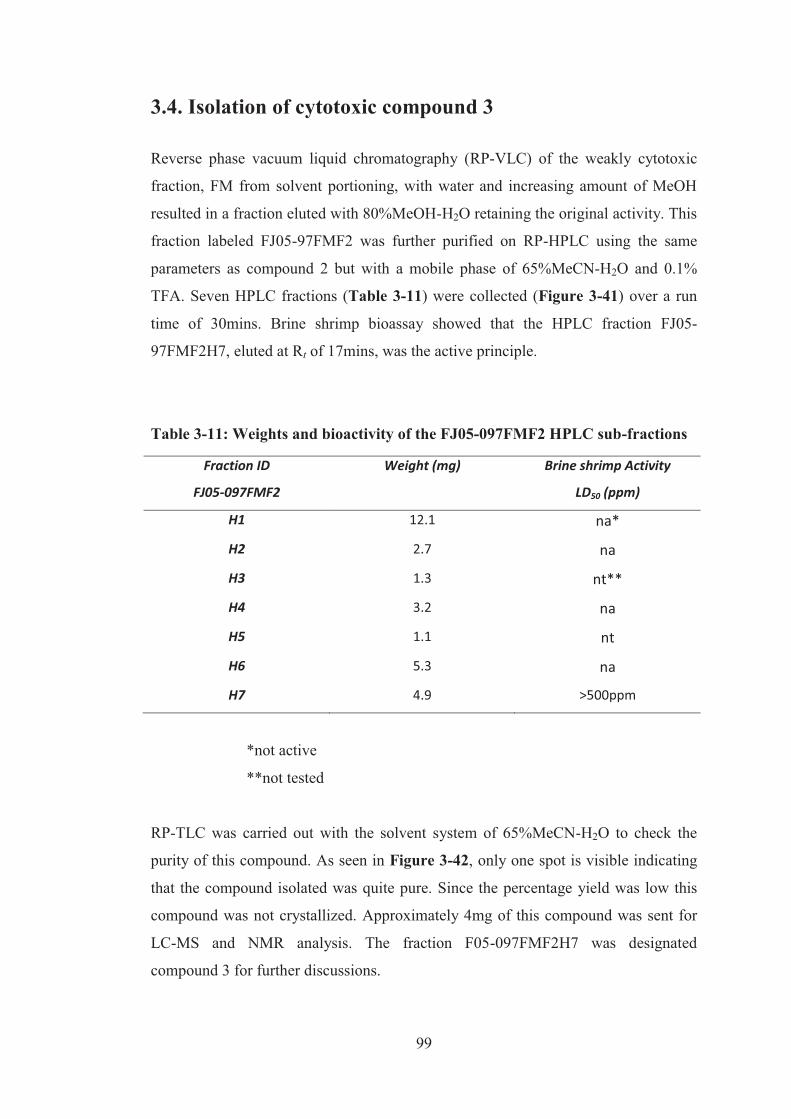
99
3.4. Isolation of cytotoxic compound 3 Reverse phase vacuum liquid chromatography (RP-VLC) of the weakly cytotoxic
fraction, FM from solvent portioning, with water and increasing amount of MeOH
resulted in a fraction eluted with 80%MeOH-H2O retaining the original activity. This
fraction labeled FJ05-97FMF2 was further purified on RP-HPLC using the same
parameters as compound 2 but with a mobile phase of 65%MeCN-H2O and 0.1%
TFA. Seven HPLC fractions (Table 3-11) were collected (Figure 3-41) over a run
time of 30mins. Brine shrimp bioassay showed that the HPLC fraction FJ05-
97FMF2H7, eluted at Rt of 17mins, was the active principle.
Table 3-11: Weights and bioactivity of the FJ05-097FMF2 HPLC sub-fractions
Fraction ID
FJ05-097FMF2
Weight (mg) Brine shrimp Activity
LD50 (ppm)
H1 12.1 na*
H2 2.7 na
H3 1.3 nt**
H4 3.2 na
H5 1.1 nt
H6 5.3 na
H7 4.9 >500ppm
*not active
**not tested
RP-TLC was carried out with the solvent system of 65%MeCN-H2O to check the
purity of this compound. As seen in Figure 3-42, only one spot is visible indicating
that the compound isolated was quite pure. Since the percentage yield was low this
compound was not crystallized. Approximately 4mg of this compound was sent for
LC-MS and NMR analysis. The fraction F05-097FMF2H7 was designated
compound 3 for further discussions.
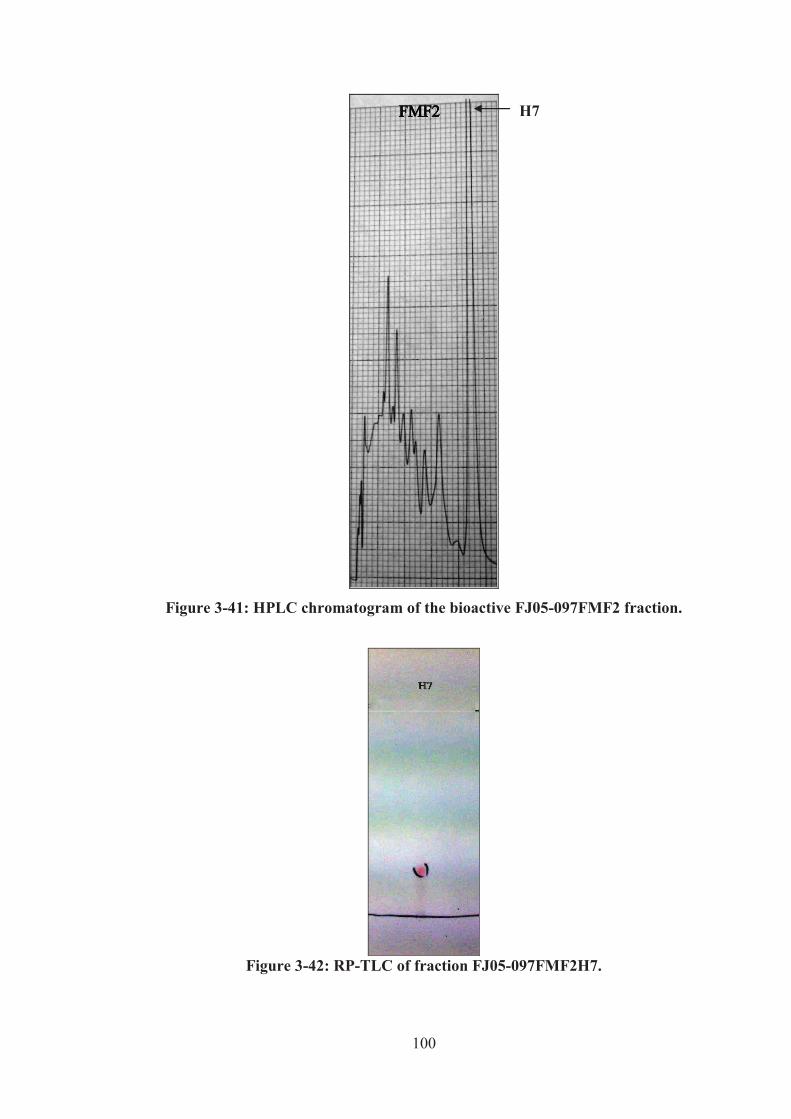
100
Figure 3-41: HPLC chromatogram of the bioactive FJ05-097FMF2 fraction.
Figure 3-42: RP-TLC of fraction FJ05-097FMF2H7.
H7
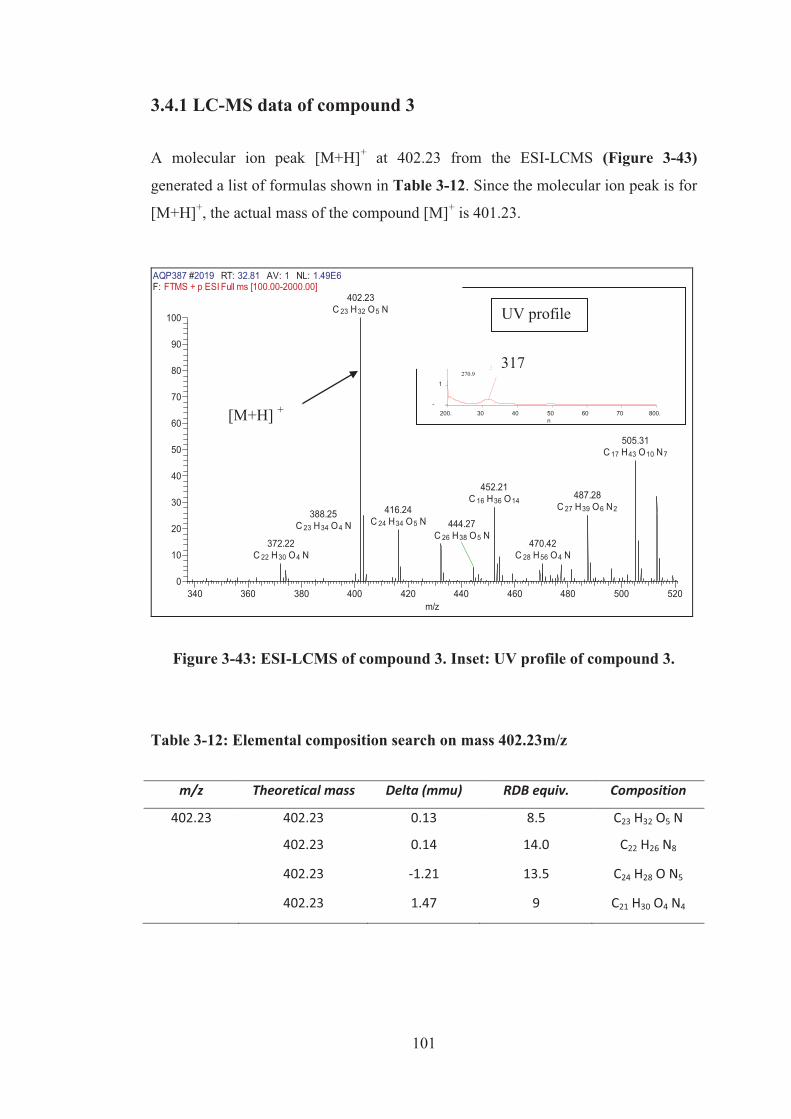
101
200. 30 40 50 60 70 800.-
1
2
3
4
5
6.
n
A
317.8270.9
UV profile
317
3.4.1 LC-MS data of compound 3
A molecular ion peak [M+H]+ at 402.23 from the ESI-LCMS (Figure 3-43)
generated a list of formulas shown in Table 3-12. Since the molecular ion peak is for
[M+H]+, the actual mass of the compound [M]+ is 401.23.
AQP387 #2019 RT: 32.81 AV: 1 NL: 1.49E6F: FTMS + p ESI Full ms [100.00-2000.00]
340 360 380 400 420 440 460 480 500 520m/z
0
10
20
30
40
50
60
70
80
90
100
402.23C 23 H32 O5 N
505.31C 17 H43 O10 N7
452.21C 16 H36 O14 487.28
C 27 H39 O6 N2416.24C 24 H34 O5 N
372.22C 22 H30 O4 N
470.42C 28 H56 O4 N
444.27C 26 H38 O5 N
388.25C 23 H34 O4 N
Figure 3-43: ESI-LCMS of compound 3. Inset: UV profile of compound 3.
Table 3-12: Elemental composition search on mass 402.23m/z
m/z Theoretical mass Delta (mmu) RDB equiv. Composition
402.23 402.23 0.13 8.5 C23 H32 O5 N
402.23 0.14 14.0 C22 H26 N8
402.23 -1.21 13.5 C24 H28 O N5
402.23 1.47 9 C21 H30 O4 N4
[M+H] +
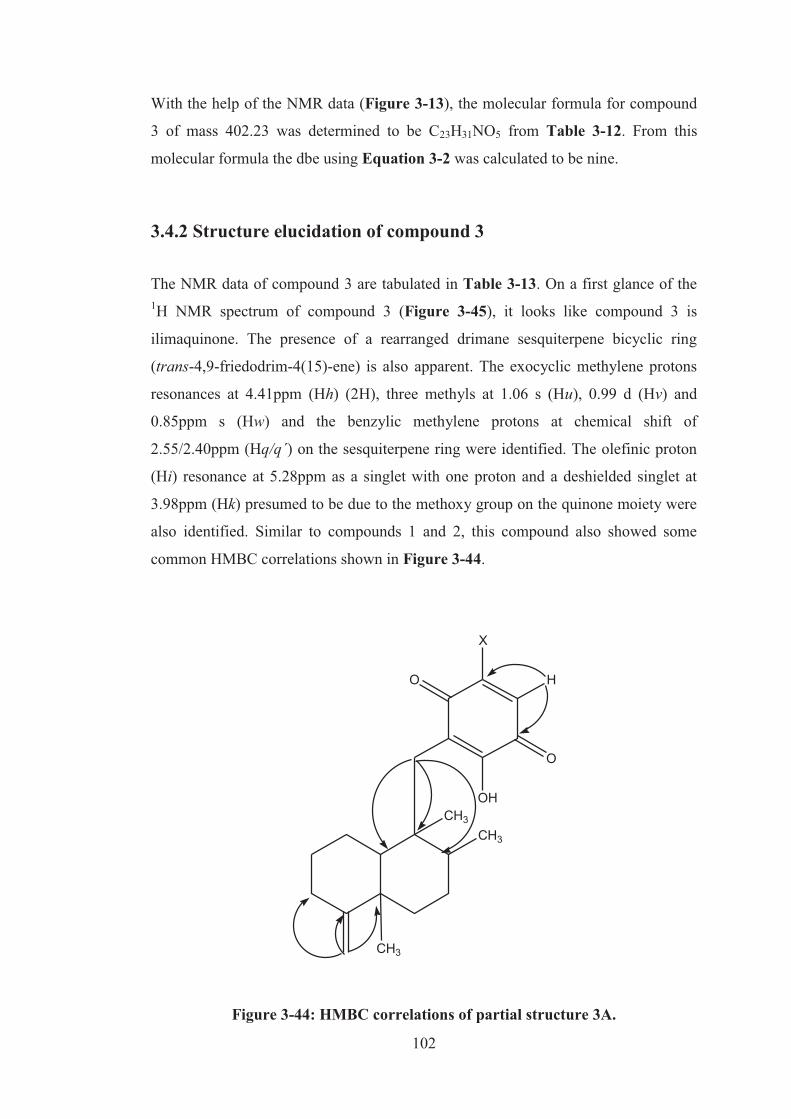
102
With the help of the NMR data (Figure 3-13), the molecular formula for compound
3 of mass 402.23 was determined to be C23H31NO5 from Table 3-12. From this
molecular formula the dbe using Equation 3-2 was calculated to be nine.
3.4.2 Structure elucidation of compound 3
The NMR data of compound 3 are tabulated in Table 3-13. On a first glance of the 1H NMR spectrum of compound 3 (Figure 3-45), it looks like compound 3 is
ilimaquinone. The presence of a rearranged drimane sesquiterpene bicyclic ring
(trans-4,9-friedodrim-4(15)-ene) is also apparent. The exocyclic methylene protons
resonances at 4.41ppm (Hh) (2H), three methyls at 1.06 s (Hu), 0.99 d (Hv) and
0.85ppm s (Hw) and the benzylic methylene protons at chemical shift of
2.55/2.40ppm (Hq/q΄) on the sesquiterpene ring were identified. The olefinic proton
(Hi) resonance at 5.28ppm as a singlet with one proton and a deshielded singlet at
3.98ppm (Hk) presumed to be due to the methoxy group on the quinone moiety were
also identified. Similar to compounds 1 and 2, this compound also showed some
common HMBC correlations shown in Figure 3-44.
CH3
CH3
CH3
O
O H
OH
X
Figure 3-44: HMBC correlations of partial structure 3A.
103
With the formation of the partial structure 3A (Figure 3-44) eight out of nine degrees
of unsaturation was fulfilled. On a closer examination of the 2D NMR data, namely
the HSQC (Figure 3-48) and HMBC (Figure 3-49) spectrum, it was revealed that
the singlet at 3.98ppm, (Hk), with its corresponding carbon (CK) resonance at
44.4ppm is not due to a methoxy group as previously assumed but was due to a
methylene group (–CH2-). The deshielded chemical shift indicate that this –CH2- is
attached to an electronegative atom or group. To investigate the structure of
compound 3 further, the HMBC spectrum (Figure 3-49) was used.
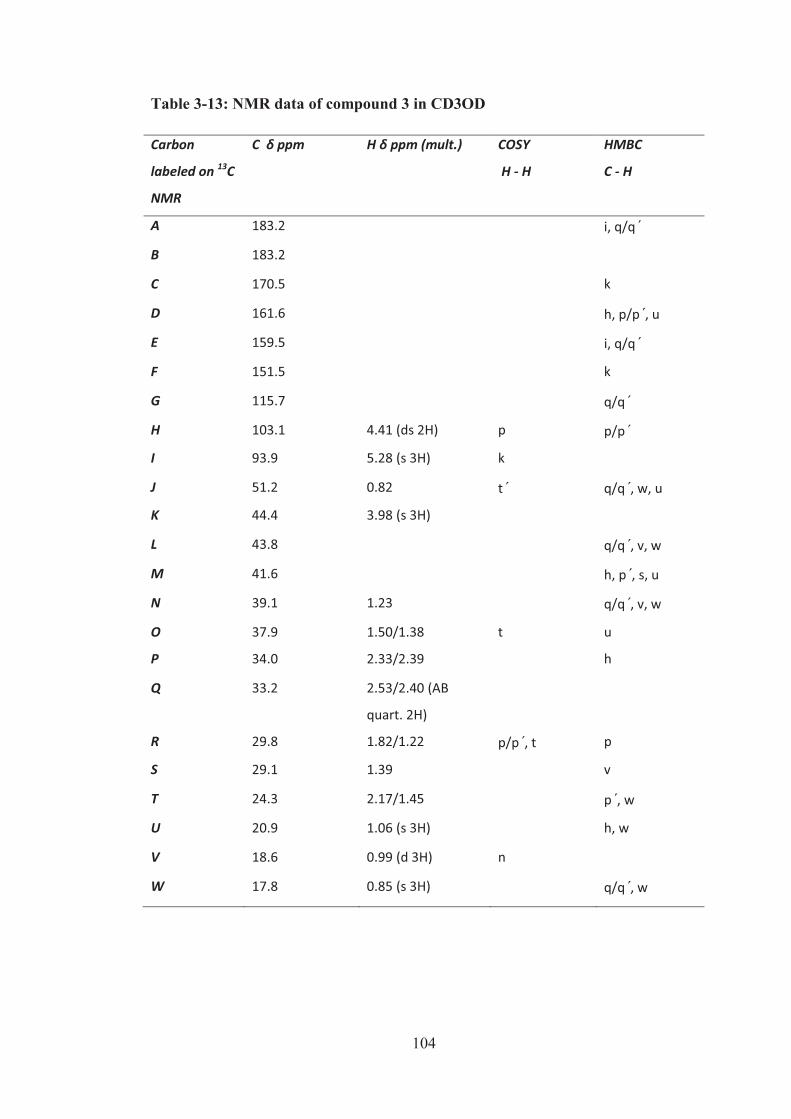
104
Table 3-13: NMR data of compound 3 in CD3OD
Carbon
labeled on 13C
NMR
C δ ppm H δ ppm (mult.) COSY
H - H
HMBC
C - H
A 183.2 i, q/q΄
B 183.2
C 170.5 k
D 161.6 h, p/p΄, u
E 159.5 i, q/q΄
F 151.5 k
G 115.7 q/q΄
H 103.1 4.41 (ds 2H) p p/p΄
I 93.9 5.28 (s 3H) k
J 51.2 0.82 t΄ q/q΄, w, u
K 44.4 3.98 (s 3H)
L 43.8 q/q΄, v, w
M 41.6 h, p΄, s, u
N 39.1 1.23 q/q΄, v, w
O 37.9 1.50/1.38 t u
P 34.0 2.33/2.39 h
Q 33.2 2.53/2.40 (AB
quart. 2H)
R 29.8 1.82/1.22 p/p΄, t p
S 29.1 1.39 v
T 24.3 2.17/1.45 p΄, w
U 20.9 1.06 (s 3H) h, w
V 18.6 0.99 (d 3H) n
W 17.8 0.85 (s 3H) q/q΄, w
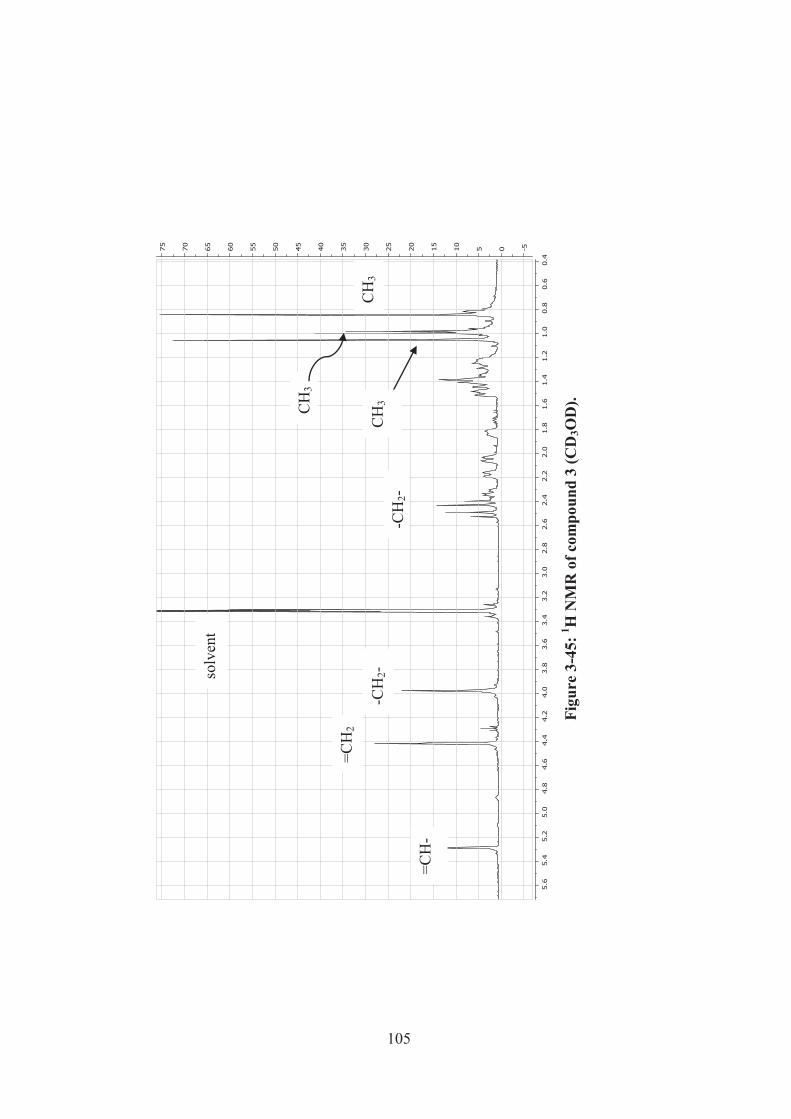
105
Fi
gure
3-4
5: 1 H
NM
R o
f com
poun
d 3
(CD
3OD
).
=CH
-
CH
3 -C
H2-
solv
ent
-CH
2-
=CH
2
CH
3
CH
3
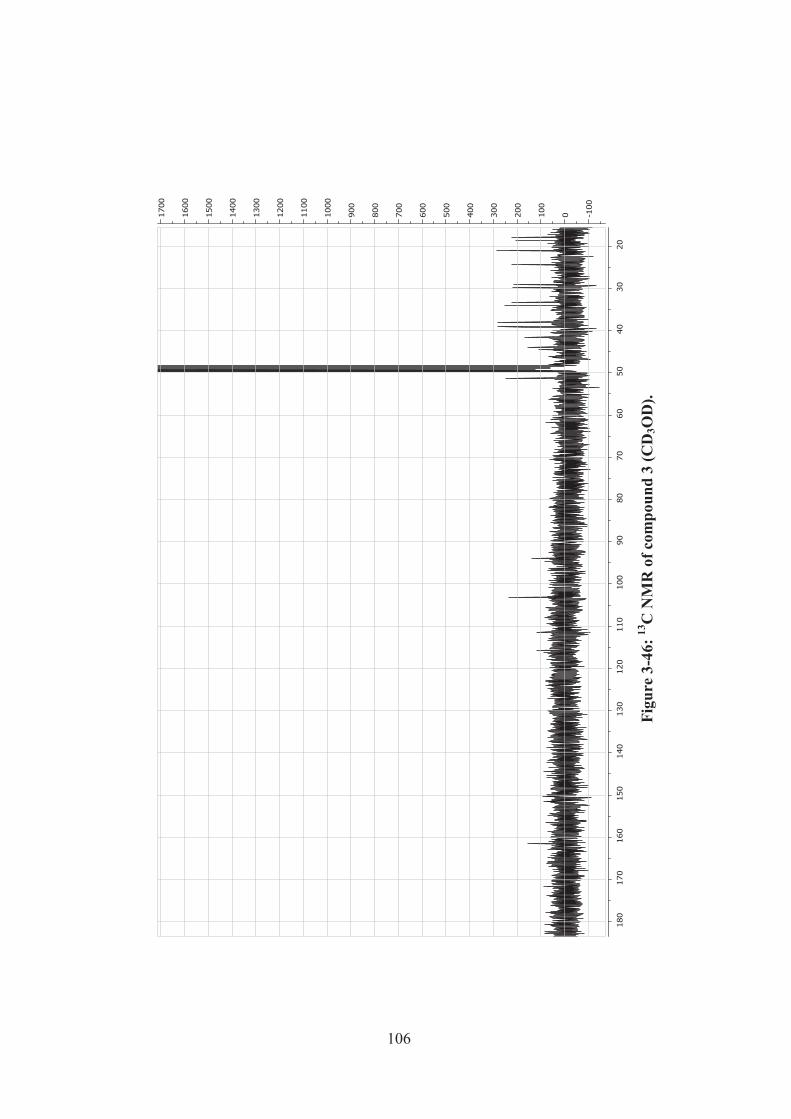
106
Fi
gure
3-4
6: 13
C N
MR
of c
ompo
und
3 (C
D3O
D).
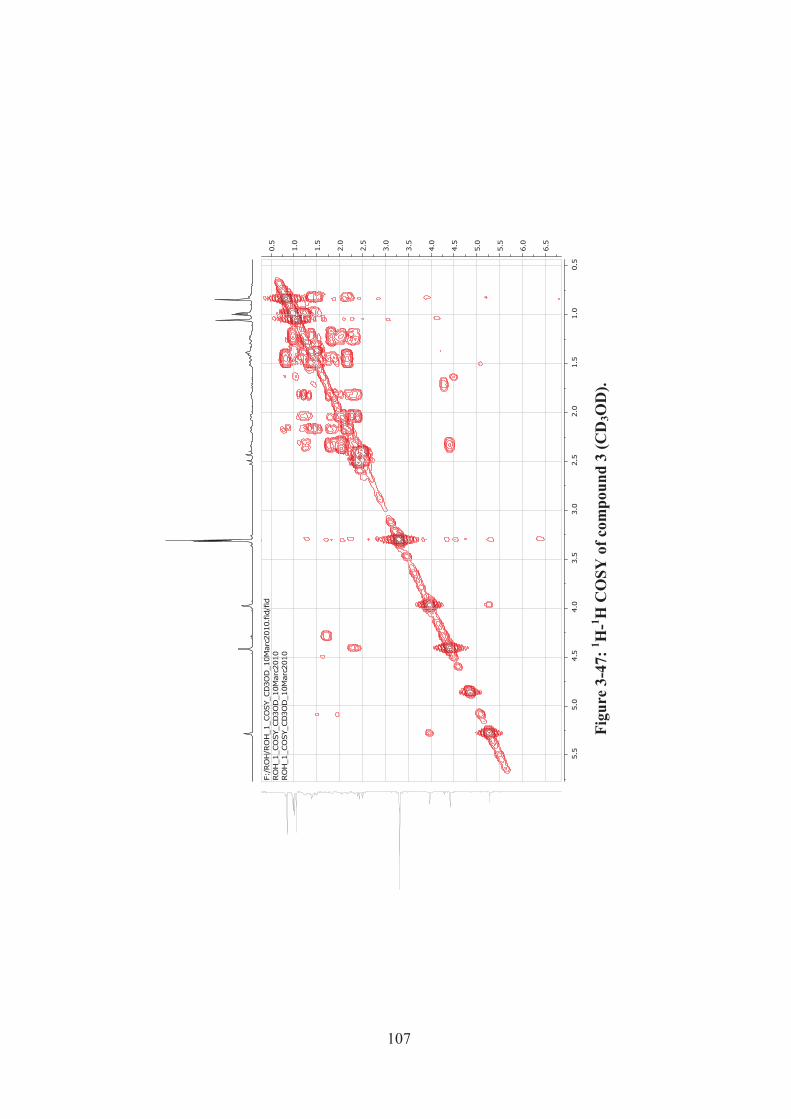
107
Fi
gure
3-4
7: 1 H
-1 H C
OSY
of c
ompo
und
3 (C
D3O
D).
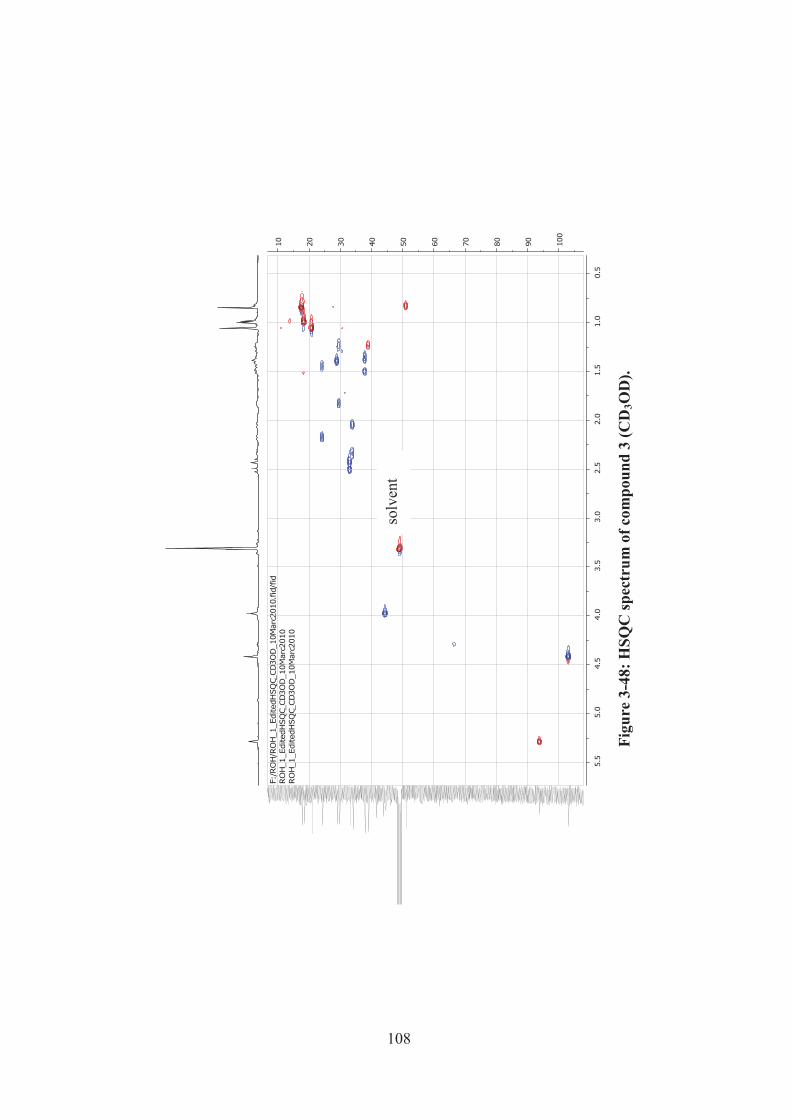
108
Fi
gure
3-4
8: H
SQC
spec
trum
of c
ompo
und
3 (C
D3O
D).
solv
ent
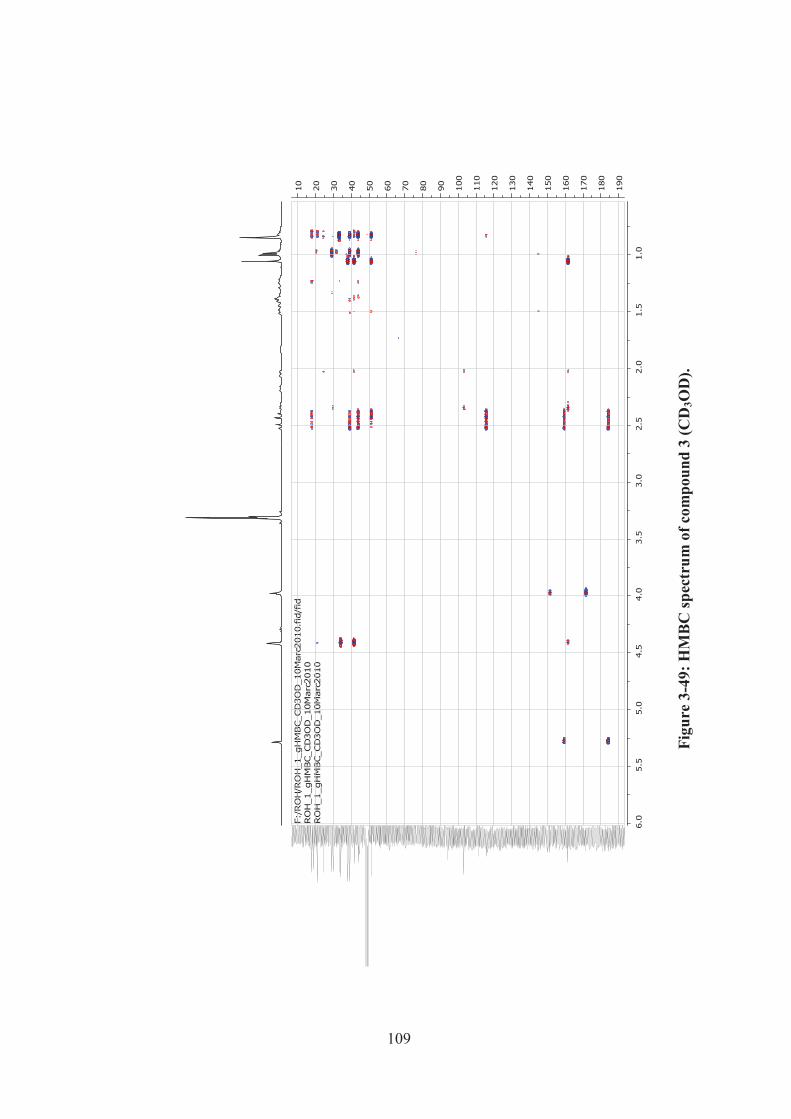
109
Figu
re 3
-49:
HM
BC
spec
trum
of c
ompo
und
3 (C
D3O
D).
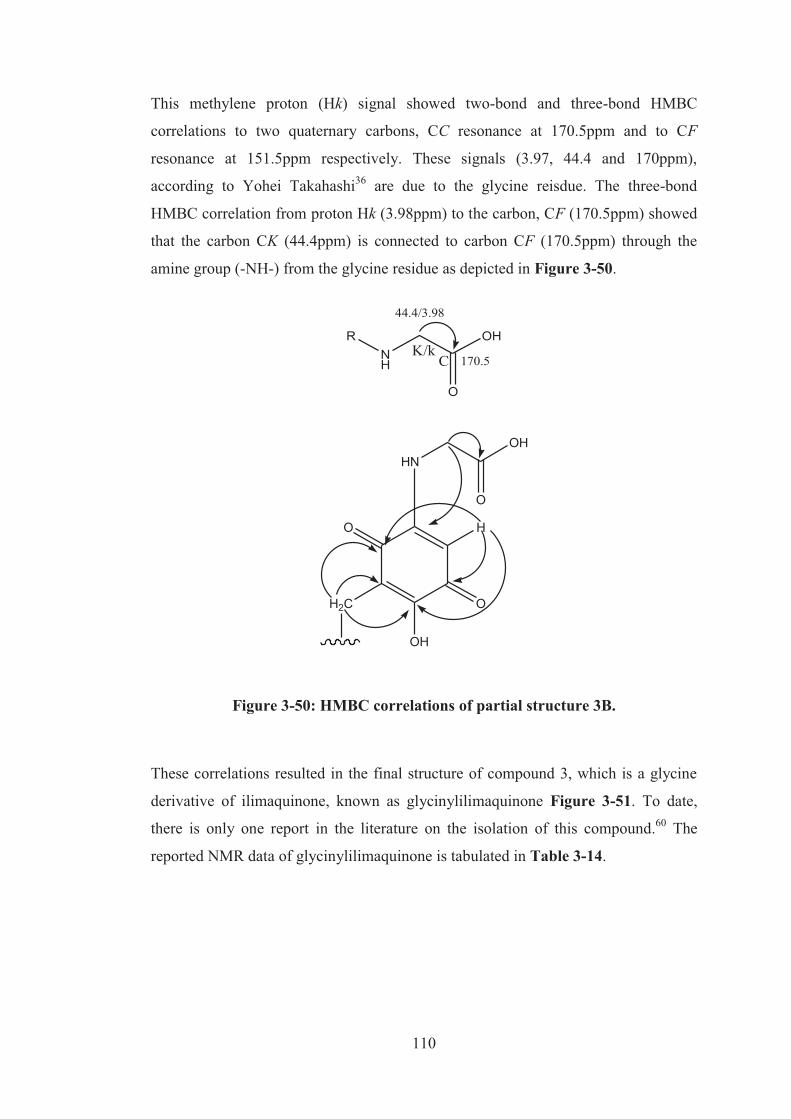
110
This methylene proton (Hk) signal showed two-bond and three-bond HMBC
correlations to two quaternary carbons, CC resonance at 170.5ppm and to CF
resonance at 151.5ppm respectively. These signals (3.97, 44.4 and 170ppm),
according to Yohei Takahashi36 are due to the glycine reisdue. The three-bond
HMBC correlation from proton Hk (3.98ppm) to the carbon, CF (170.5ppm) showed
that the carbon CK (44.4ppm) is connected to carbon CF (170.5ppm) through the
amine group (-NH-) from the glycine residue as depicted in Figure 3-50.
NH
OH
O
R
170.5
44.4/3.98
CK/k
O
OH
O
HNOH
H2C
O
H
Figure 3-50: HMBC correlations of partial structure 3B.
These correlations resulted in the final structure of compound 3, which is a glycine
derivative of ilimaquinone, known as glycinylilimaquinone Figure 3-51. To date,
there is only one report in the literature on the isolation of this compound.60 The
reported NMR data of glycinylilimaquinone is tabulated in Table 3-14.
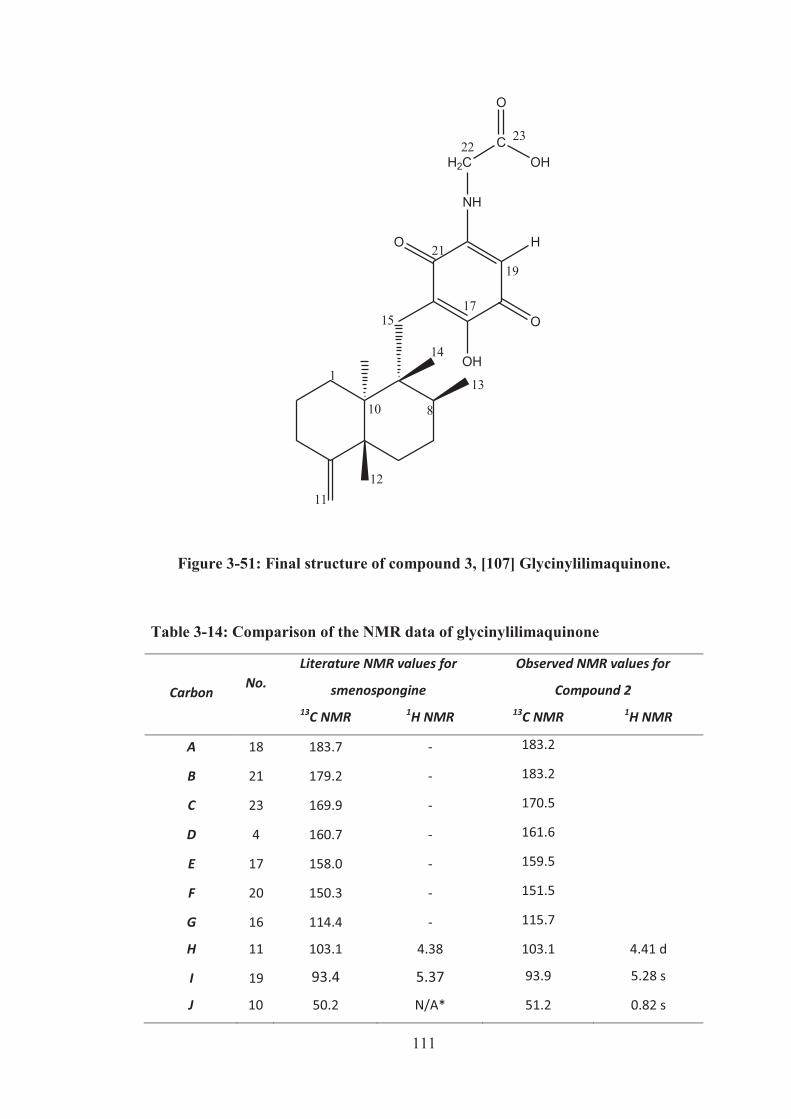
111
O
O
OH
NH
H
H2CC
O
OH
11
1
12
8
13
14
10
1517
1921
2223
Figure 3-51: Final structure of compound 3, [107] Glycinylilimaquinone.
Table 3-14: Comparison of the NMR data of glycinylilimaquinone
Carbon
No.
Literature NMR values for
smenospongine
Observed NMR values for
Compound 2 13C NMR 1H NMR 13C NMR 1H NMR
A 18 183.7 - 183.2
B 21 179.2 - 183.2
C 23 169.9 - 170.5
D 4 160.7 - 161.6
E 17 158.0 - 159.5
F 20 150.3 - 151.5
G 16 114.4 - 115.7
H 11 103.1 4.38 103.1 4.41 d
I 19 93.4 5.37 93.9 5.28 s
J 10 50.2 N/A* 51.2 0.82 s
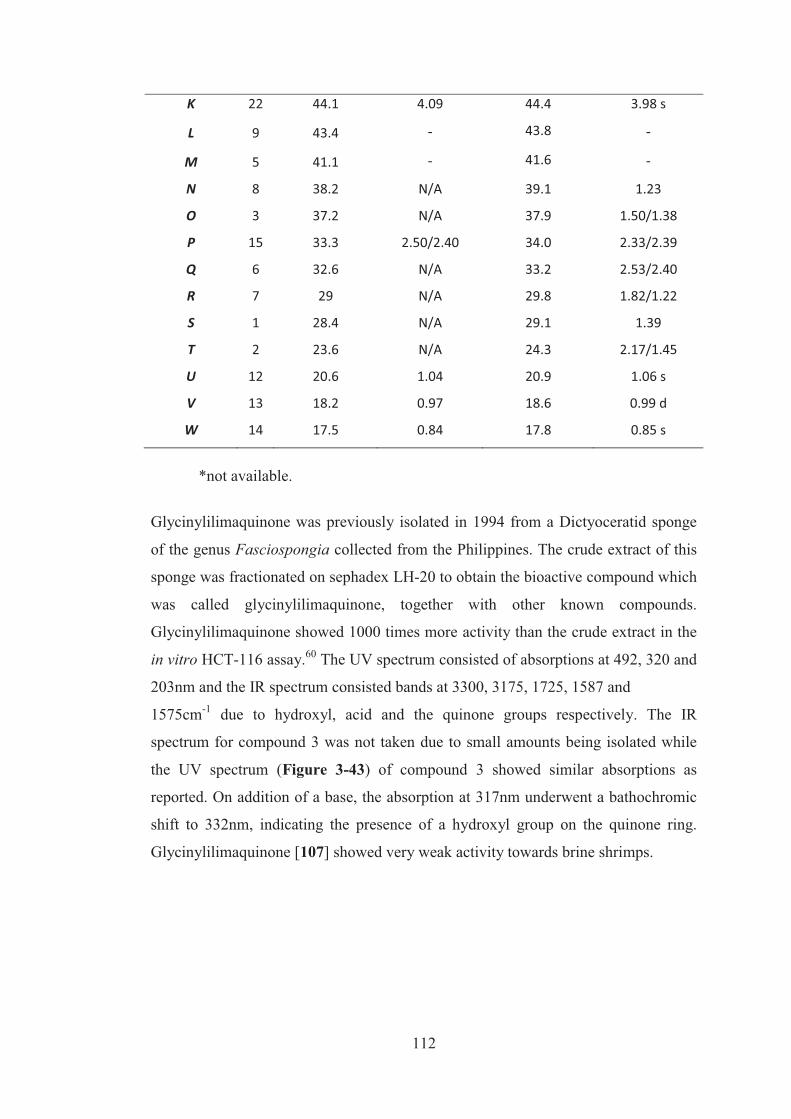
112
K 22 44.1 4.09 44.4 3.98 s
L 9 43.4 - 43.8 -
M 5 41.1 - 41.6 -
N 8 38.2 N/A 39.1 1.23
O 3 37.2 N/A 37.9 1.50/1.38
P 15 33.3 2.50/2.40 34.0 2.33/2.39
Q 6 32.6 N/A 33.2 2.53/2.40
R 7 29 N/A 29.8 1.82/1.22
S 1 28.4 N/A 29.1 1.39
T 2 23.6 N/A 24.3 2.17/1.45
U 12 20.6 1.04 20.9 1.06 s
V 13 18.2 0.97 18.6 0.99 d
W 14 17.5 0.84 17.8 0.85 s
*not available.
Glycinylilimaquinone was previously isolated in 1994 from a Dictyoceratid sponge
of the genus Fasciospongia collected from the Philippines. The crude extract of this
sponge was fractionated on sephadex LH-20 to obtain the bioactive compound which
was called glycinylilimaquinone, together with other known compounds.
Glycinylilimaquinone showed 1000 times more activity than the crude extract in the
in vitro HCT-116 assay.60 The UV spectrum consisted of absorptions at 492, 320 and
203nm and the IR spectrum consisted bands at 3300, 3175, 1725, 1587 and
1575cm-1 due to hydroxyl, acid and the quinone groups respectively. The IR
spectrum for compound 3 was not taken due to small amounts being isolated while
the UV spectrum (Figure 3-43) of compound 3 showed similar absorptions as
reported. On addition of a base, the absorption at 317nm underwent a bathochromic
shift to 332nm, indicating the presence of a hydroxyl group on the quinone ring.
Glycinylilimaquinone [107] showed very weak activity towards brine shrimps.
113
3.5 Sesquiterpene quinones and related compounds from sponge of
the order Dictyoceratida
The sesquiterpene quinones share a common drimane rearranged cis- or trans-
decalin ring varying at the relative position of the double bond at the C-4 carbon
and/or the stereochemical configuration about C-5. The C-9 position is decorated
with a variably hydroxylated or heteroatom-substituted benzoquinone side chain.76
Cis- or trans-decalin rings can be further divided into trans-4,9-friedodrim-3-ene,
cis-4,9-friedodrim-3-ene, trans-4,9-fridodrim-4(15)-ene and cis-4,9-fridodrim-4(15)-
ene as shown in Figure 3-19. Some examples of trans-decalin sesquiterpene
quinones/quinols similar in structure are avarol and avarone from Dysidea avara,
ilimaquinone from Hippospongia metachromia, isospongiaquinone from
Stelospongia conulata, the nakijiquinones from Spongia sp and bolinaquinone from
Dysidea sp while examples of cis-decalin sesquiterpene quinones/quinols would
include epi-smenoquinone, epi-smenospongidine, epi-smenospongorine and also epi-
ilimaquinone. All these compounds were isolated from the sponge belonging to the
order Dictyceratida, collected from different areas.77 According to Salmoun and co-
researchers the 13C chemical shifts of the carbon atoms of sesquiterpenic part are
very little influenced by the nature of the substituent at the junction of sesquiterpene
and quinone. Which lead them to calculate the mean chemical shift for all carbon
atoms for each skeleton (Figure 3-19).63 A great number of marine quinones and
hydroquinones are of considerable interest with regard to their diverse biological
activities. Furthermore, sesquiterpenes in which a decaline type unit and a quinoid
moiety are structurally associated, often exhibit pronouced cytotoxicity.78
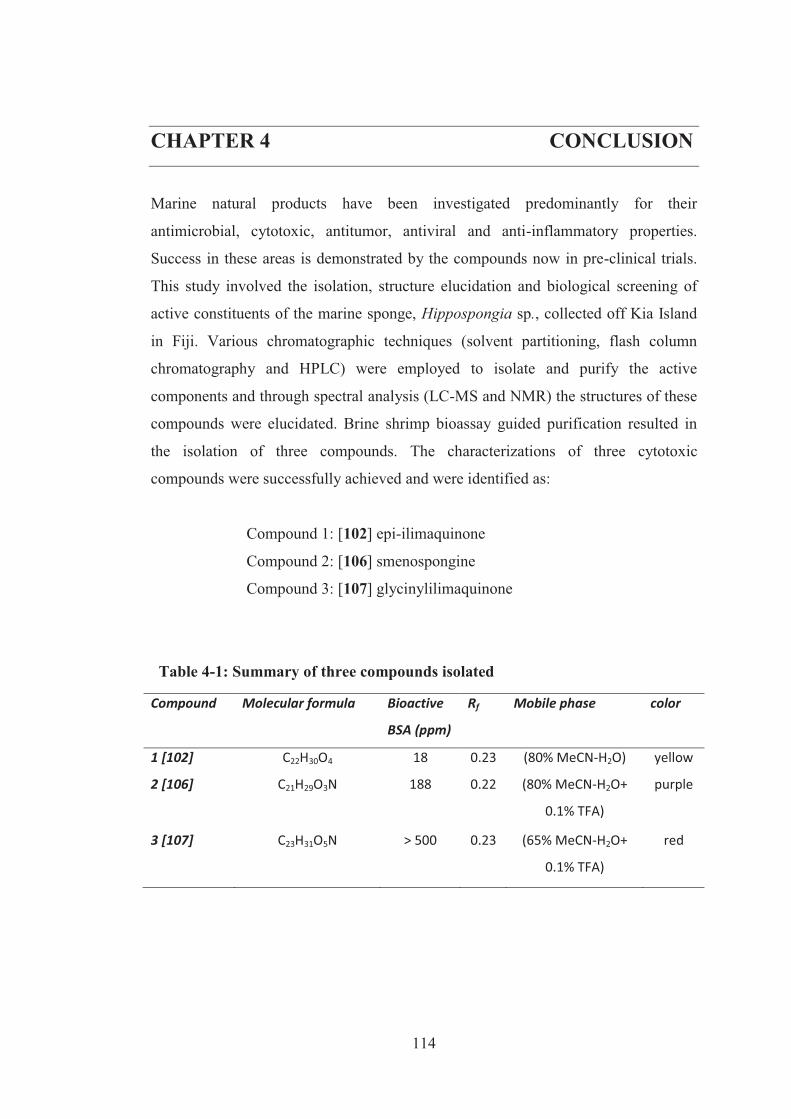
114
CHAPTER 4 CONCLUSION
Marine natural products have been investigated predominantly for their
antimicrobial, cytotoxic, antitumor, antiviral and anti-inflammatory properties.
Success in these areas is demonstrated by the compounds now in pre-clinical trials.
This study involved the isolation, structure elucidation and biological screening of
active constituents of the marine sponge, Hippospongia sp., collected off Kia Island
in Fiji. Various chromatographic techniques (solvent partitioning, flash column
chromatography and HPLC) were employed to isolate and purify the active
components and through spectral analysis (LC-MS and NMR) the structures of these
compounds were elucidated. Brine shrimp bioassay guided purification resulted in
the isolation of three compounds. The characterizations of three cytotoxic
compounds were successfully achieved and were identified as:
Compound 1: [102] epi-ilimaquinone
Compound 2: [106] smenospongine
Compound 3: [107] glycinylilimaquinone
Table 4-1: Summary of three compounds isolated
Compound Molecular formula Bioactive
BSA (ppm)
Rf Mobile phase color
1 [102] C22H30O4 18 0.23 (80% MeCN-H2O) yellow
2 [106] C21H29O3N 188 0.22
(80% MeCN-H2O+
0.1% TFA)
purple
3 [107] C23H31O5N > 500 0.23
(65% MeCN-H2O+
0.1% TFA)
red
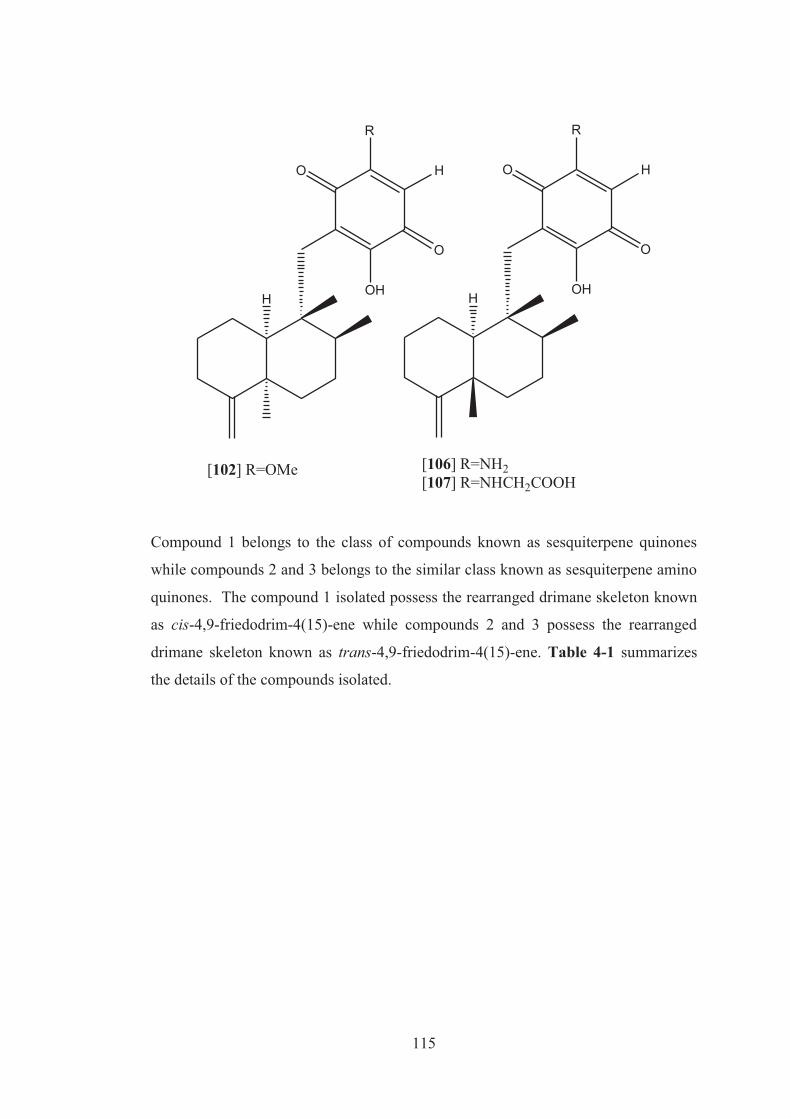
115
H
O
O
R
H
OH
[102] R=OMe
H
O
O
R
H
OH
[106] R=NH2[107] R=NHCH2COOH
Compound 1 belongs to the class of compounds known as sesquiterpene quinones
while compounds 2 and 3 belongs to the similar class known as sesquiterpene amino
quinones. The compound 1 isolated possess the rearranged drimane skeleton known
as cis-4,9-friedodrim-4(15)-ene while compounds 2 and 3 possess the rearranged
drimane skeleton known as trans-4,9-friedodrim-4(15)-ene. Table 4-1 summarizes
the details of the compounds isolated.
116
REFERENCES
1. Cragg, G. M.; Grothaus, P. G.; Newman, D. J., Impact of Natural Products on
Developing New Anti-Cancer Agents. Chem. Rev. 2009, 109, 3012-3043.
2. Nicolaou, K. C.; Chen, J. S.; Dalby, S. M., From nature to the laboratory and
into the clinic. Bioorg. Med. Chem. 2009, 17, 2290-2303.
3. Harvey, A. L., Natural products in drug discovery. Drug Discovery Today.
2008, 13, 894-901.
4. Kingston, D. G. I., Tubulin-Interactive Natural Products as Anticancer
Agents. J. Nat. Prod. 2009, 72, 507-515.
5. Chin, Y.-W.; Balunas, M. J.; Chai, H. B.; Kinghorn, A. D., Drug Discovery
From Natural Sources. The AAPS Journal 2006, 8, 239-253.
6. Lei, J.; Zhou, J., A Marine Natural Product Database. J. Chem. Inf. Comput.
Sci. 2002, 42, 742-748.
7. Folmer, F.; Jaspars, M.; Dicato, M.; Diederich, M., Marine natural products
as targeted modulators of the transcription factor NF-�B. Biochem. Pharmacol.
2008, 75, 603-617.
8. Jha, R. K.; Zi-rong, X., Biomedical Compounds from Marine organisms.
Mar. Drugs 2004, 2, 123-146.
9. Haefner, B., Drugs from the deep: marine natural products as drug
candidates. Drug Discovery Today 2003, 8, (12), 536-544.
10. Kijjoa, A.; Sawangwong, P., Drugs and Cosmetics from the Sea. Mar. Drugs
2004, 2, 72-82.
11. Skropeta, D., Deep-sea natural products. Nat. Prod. Rep. 2008, 25, 1131–
1166.
117
12. Blunt, J. W.; Copp, B. R.; Hu, W.-P.; Munro, M. H. G.; Northcotec, P. T.;
Prinsep, M. R., Marine natural products. Nat. Prod. Rep. 2008 25, 35–94.
13. Blunt, J. W.; Copp, B. R.; Munro, M. H. G.; Northcote, P. T.; Prinsep, M. R.,
Marine natural products. Nat. Prod. Rep. 2005, 22, 15-61.
14. Proksch, P.; Edrada-Ebel, R.; Ebel, R., Drugs from the Sea - Opportunities
and Obstacles. Mar. Drugs. 2003, 1, 5-17.
15. Glaser, K. B.; Mayer, A. M. S., A renaissance in marine pharmacology: From
preclinical curiosity to clinical reality. Biochem. Pharm. 2009, 78, 440-448.
16. Butler, M. S., Natural products to drugs: natural product-derived compounds
in clinical trials. Nat. Prod. Rep. 2008, 25, 475–516.
17. Bugni, T. S.; Harper, M. k.; McCulloch, M. W. B.; Reppart, J.; Ireland, C.
M., Fractionated marine invertebrate extract libraries for drug discovery. Molecules
2008, 13, 1372-1383.
18. Nobili, S.; Lippib, D.; Witortc, E.; Donninic, M.; Bausi, L.; Minia, E.;
Capacciolic, S., Natural compounds for cancer treatment and prevention. Pharmacol.
Res. 2009, 59, 365-378.
19. http://en.wikipedia.org/wiki/Orphan_drug. 24.08.09.
20. Molinski, T. F.; Dalisay, D. S.; Lievens, S. L.; Saludes, J. P., Drug
development from marine natural products. Nat. Rev. Drug Discovery 2009, 8, 69-
85.
21. Singh, R.; Sharma, M.; Joshi, P.; Rawat, D. S., Clinical Status of Anti-Cancer
Agents Derived from Marine Sources. Anti-Cancer Agents Med. Chem. 2008, 8, 603-
617.
22. Amador, M. L.; Jimeno, J.; Paz-Ares, L.; Cortes-Funes, H.; Hidalgo, M.,
Progress in the development and acquisition of anticancer agents from marine
sources. Ann. Oncology 2003, 14, 1607–1615.
118
23. Rawat, D. S.; Joshi, M. C.; Joshi, P.; Atheaya, H., Marine Peptides and
Related Compounds in Clinical Trial. Anti-Cancer Agents Med. Chem. 2006, 6, 33-
40.
24. Sashidhara, K. V.; White, K. N.; Crews, P., A Selective Account of Effective
Paradigms and Significant Outcomes in the Discovery of Inspirational Marine
Natural Products. J. Nat. Prod. 2009, 72, 588-603.
25. Blunt, J. W.; Copp, B. R.; Hu, W.-P.; Munro, M. H. G.; Northcotec, P. T.;
Prinsep, M. R., Marine natural products. Nat. Prod. Rep. 2009, 26, 170–244.
26. McClintock, J. B.; Baker, B. J., Marine Chemical Ecology. CRC Press:
Washington DC., 2001; p 10-14.
27. http://en.wikipedia.org/wiki/Sponge 21.03.2010.
28. http://cas.bellarmine.edu/tietjen/images/sponges.htm 21.03.2010.
29. http://zipcodezoo.com/Key/Animalia/Hippiospongia_Genus.asp. 28.03.2010.
30. Crews, P.; Bescansa, P., Sesterterpenes from a commonmarine sponge,
Hyrtios erecta. J. Nat. Prod. 1986, 49, 1041-1052.
31. Keyzers, R. A.; Northcote, P. T.; Davies-Coleman, M. T., Spongian
diterpenoids from marine sponges. Nat. Prod. Rep. 2006, 23, 321-334.
32. Tsukamoto, S.; Miura, S.; Soest, R. W. M. v.; Ohta, T., Three New Cytotoxic
Sesterterpenes from a Marine Sponge Spongia sp. J. Nat. Prod. 2003, 66, 438-440.
33. Roy, M. C.; Tanaka, J.; Voogd, N. d.; Higa, T., New Scalarane Class
Sesterterpenes from an Indonesian Sponge, Phyllospongia sp. J. Nat. Prod. 2002, 65,
1838-1842.
34. McCulloch, M. W. B.; Bugni, T. S.; Concepcion, G. P.; Coombs, G. S.;
Harper, M. K.; Kaur, S.; Mangalindan, G. C.; Mutizwa, M. M.; Veltri, C. A.;
Virshup, D. M.; Ireland, C. M., Carteriosulfonic Acids A-C, GSK-3ı Inhibitors from
a Carteriospongia sp. J. Nat. Prod. 2009, 72, 1651-1656.
119
35. Utkina, N. K.; Denisenko, V. A.; Scholokova, O. V.; Virovaya, M. V.;
Prokofeva, N. G., Cyclosmenospongine, a new sesquiterpenoid aminoquinone from
an Australian marine sponge Spongia sp. Tetrahedron Lett. 2003, 44, 101–102.
36. Takahashi, Y.; Kubota, T.; Fromontb, J.; Kobayashi, J., Metachromins L–Q,
new sesquiterpenoid quinones with an amino acid residue from sponge Spongia sp.
Tetrahedron 2007, 63, 8770–8773.
37. Takahashi, Y.; Kubota, T.; Kobayashi, J., Nakijiquinones E and F, new
dimeric ssequiterpenoid quinones from marine sponge. Bioorg. Med. Chem. 2009,
17, 2185-2188.
38. Takahashi, Y.; Ushio, M.; Kubota, T.; Yamamoto, S.; Fromont, J.;
Kobayashi, J., Nakijiquinones J-R, Sesquiterpenoid Quinones with an Amine
Residue from Okinawan Marine Sponges. J. Nat. Prod. 2010, 73, 467–471.
39. Hyosu, M.; Kimura, J., Two New Spongian Diterpenes from Coscinoderma
mathewsi. J. Nat. Prod. 2000, 63, 422-423.
40. Marino, S. D.; Festa, C.; D Auria, M. V.; Bourguet-Kondracki, M.-L.; Petek,
S.; Debitus, C.; Andres, R. M.; Terencio, M. C.; Paya, M.; Zampella, A.,
Coscinolactams A and B: new nitrogen-containing sesterterpenoids from the marine
sponge Coscinoderma mathewsi exerting anti-inflammatory properties
Tetrahedron 2009, 65, 2905-2909.
41. Mitome, H.; Nagasawa, T.; Miyaoka, H.; Yamada, Y.; Soest, R. W. M. v., A
New Sesquiterpenoid Quinone and Other Related Compounds from the Okinawan
Marine Sponge Dactylospongia elegans. J. Nat. Prod. 2003, 63, 46-50.
42. Cao, S.; Gao, Z.; Thomas, S. J.; Hecht, S. M.; Lazo, J. S.; Kingston, D. G. I.,
Marine Sesquiterpenoids that Inhibit the Lyase Activity of DNA Polymerase �
J. Nat. Prod. 2004, 67, 1716-1718.
43. Ponomarenko, L. P.; Kalinovsky, A. I.; Afiyatullov, S. S.; Pushilin, M. A.;
Gerasimenko, A. V.; Krasokhin, V. B.; Stonik, V. A., Spongian Diterpenoids from
the Sponge Spongia (Heterofibria) sp. J. Nat. Prod. 2007, 70, 1110-1113.
120
44. Nakao, Y.; Fusetani, N., Enzyme Inhibitors from Marine Invertebrates. J.
Nat. Prod. 2007, 70, 689-710.
45. Ishiyama, H.; Ishibashi, M.; Ogawa, A.; Yoshida, S.; Kobayashi, J.,
Taurospongin A, a Novel Acetylenic Fatty Acid Derivative Inhibiting DNA
Polymerase � and HIV Reverse Transcriptase from Sponge Hippospongia sp. J. Org.
Chem. 1997, 62, 3831-3836.
46. Ohta, S.; Uno, M.; Tokumasu, M.; Hiraga, Y.; Ikegami, S., Hippospongic
Acid A: An Unusual Triterpenoic Acid from a Marine Sponge, Hippospongia sp.,
Which Inhibits Gastrulation of Starfish Embryos. Tetrahedron Lett. 1996, 37, 7765-
7766.
47. Hioki, H.; Hamano, M.; Mimura, Y.; Kodama, M.; Ohta, S.; Yanai, M.;
Ikegami, S., Revised Structure, Synthesis and Absolute Configuration of
Hippospongic Acid A. Tetrahedron Lett. 1998, 39, 7745-7746.
48. Shen, Y.-C.; Chen, C.-Y.; Kuo, Y.-H., New Sesquiterpene Hydroquinones
from a Taiwanese Marine Sponge, Hippospongia metachromia. J. Nat. Prod. 2001,
64, 801-803.
49. Lee, H.-S.; Lee, T.-H.; Yang, S. H.; Shin, H. J.; Shin, J.; Oh, K.-B.,
Sesterterpene sulfates as isocitrate lyase inhibitors tropical sponge Hippospongia sp.
Bioorg. Med. Chem. 2007, 17, 2483-2486.
50. Musman, M.; Ohtani, I. I.; Nagaoka, D.; Tanaka, J.; Higa, T., Hipposulfates
A and B, New Sesterterpene Sulfates from an Okinawan Sponge, Hippospongia cf.
metachromia. J. Nat. Prod. 2001, 64, 350-352.
51. Rochfort, S. J.; Atkin, D.; Hobbs, L.; Capon, R. J., Hippospongins A-F: New
Furanoterpenes from a Southern Australian Marine Sponge Hippospongia sp. J. Nat.
Prod. 1996, 59, 1024-1028.
52. Guo, Y. W.; Trivellone, E., Ent-untenospongin A, a New C21 Furanoterpene
from the Indian Marine Sponge Hippospongia sp. Chin. Chem. Lett. 2000, 11, 327-
330.
121
53. Rifai, S.; Fassouane, A.; Kijjoa, A.; Soest, R. V., Antimicrobial Activity of
Untenospongin B, a Metabolite from the Marine Sponge Hippospongia communis
collected from the Atlantic Coast of Morocco Mar. Drugs 2004, 2, 147-153
54. Ishibashi, M.; Ohizumi, Y.; Cheng, J.-f.; Nakamura, H.; Hirata, Y.; Sasaki,
T.; Kobayashi, J. i., Metachromins A and B, Novel Antineoplastic Sesquiterpenoids
from the Okinawan Sponge Hippospongia c f. metachromia. J. Org. Chem. 1988, 53,
2855-2858.
55. Luibrand, R. T.; Erdman, T. R.; Vollmer, J. J.; Scheuer, P. J., Ilimaquinone, a
sesquiterpenoid quinone from a marine sponge. Tetrahedron 1979, 33, 609-612.
56. Capon, R. J.; MacLeod, J. K., Revision of the absolute stereochemistry of
ilimaquinone. J. Org. Chem. 1987, 52, (22), 5059-5060.
57. Meyer, B. N.; Ferrigni, N. R.; Putnam, J. E.; Jacobsen, L. B.; Nichols, D. E.;
Mclaughlin, J. L., Brine shrimp: A convenient general bioassay for active plant
constitutents. J. Med. Plant Res. 1982, 45, 31-34.
58. Blizzard, T. A.; Ruby, C. L.; M., M. H.; Reiser, F.; MN, F., Brine shrimp
(Artemia salina) as a convenient bioassay for avermectin analogs. J. Antibiot. 1989,
42, 1304.
59. Sam, T. W., Toxicity testing using the brine shrimp Artemia salina. 1999,
441-456.
60. Evans, T. P.; Corneil, L.; Peterson, R. W.; Faulkner, D. J., Isolation and
synthesis of a glycine derivative of ilimaquinone from Fasciospongia sp. Nat. Prod.
Lett. 1994, 4, 287-291.
61. Crews, P.; Rodriguez, J.; Jaspars, M., Organic structure analysis. Oxford
University Press: New York, 1998; p 184-194.
62. Rodriguez, J.; Quinoa, E.; Riguera, R.; Peters, B. M.; Abrell, L. M.; Crews,
P., The structures and stereochemistry of cytotoxic sesquiterpene quinones from
Dactylospongia elegans. Tetrahedron 1992, 48, 6667-6680.
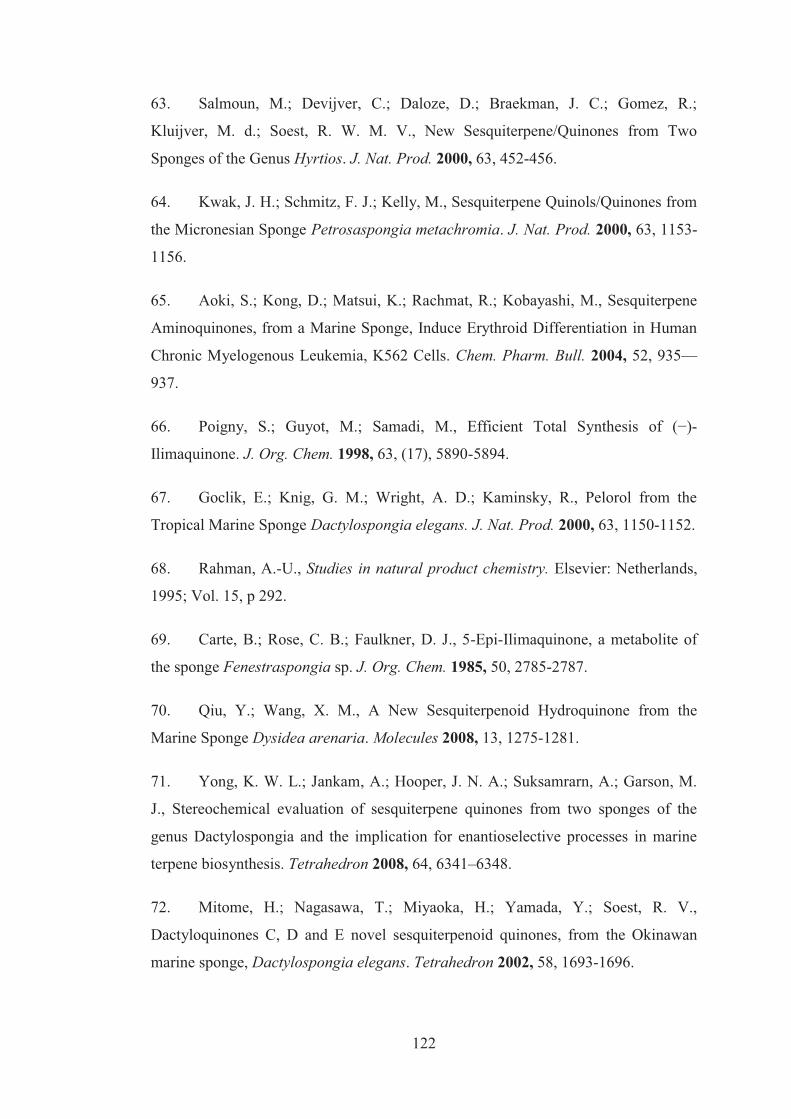
122
63. Salmoun, M.; Devijver, C.; Daloze, D.; Braekman, J. C.; Gomez, R.;
Kluijver, M. d.; Soest, R. W. M. V., New Sesquiterpene/Quinones from Two
Sponges of the Genus Hyrtios. J. Nat. Prod. 2000, 63, 452-456.
64. Kwak, J. H.; Schmitz, F. J.; Kelly, M., Sesquiterpene Quinols/Quinones from
the Micronesian Sponge Petrosaspongia metachromia. J. Nat. Prod. 2000, 63, 1153-
1156.
65. Aoki, S.; Kong, D.; Matsui, K.; Rachmat, R.; Kobayashi, M., Sesquiterpene
Aminoquinones, from a Marine Sponge, Induce Erythroid Differentiation in Human
Chronic Myelogenous Leukemia, K562 Cells. Chem. Pharm. Bull. 2004, 52, 935—
937.
66. Poigny, S.; Guyot, M.; Samadi, M., Efficient Total Synthesis of (−)-
Ilimaquinone. J. Org. Chem. 1998, 63, (17), 5890-5894.
67. Goclik, E.; Knig, G. M.; Wright, A. D.; Kaminsky, R., Pelorol from the
Tropical Marine Sponge Dactylospongia elegans. J. Nat. Prod. 2000, 63, 1150-1152.
68. Rahman, A.-U., Studies in natural product chemistry. Elsevier: Netherlands,
1995; Vol. 15, p 292.
69. Carte, B.; Rose, C. B.; Faulkner, D. J., 5-Epi-Ilimaquinone, a metabolite of
the sponge Fenestraspongia sp. J. Org. Chem. 1985, 50, 2785-2787.
70. Qiu, Y.; Wang, X. M., A New Sesquiterpenoid Hydroquinone from the
Marine Sponge Dysidea arenaria. Molecules 2008, 13, 1275-1281.
71. Yong, K. W. L.; Jankam, A.; Hooper, J. N. A.; Suksamrarn, A.; Garson, M.
J., Stereochemical evaluation of sesquiterpene quinones from two sponges of the
genus Dactylospongia and the implication for enantioselective processes in marine
terpene biosynthesis. Tetrahedron 2008, 64, 6341–6348.
72. Mitome, H.; Nagasawa, T.; Miyaoka, H.; Yamada, Y.; Soest, R. V.,
Dactyloquinones C, D and E novel sesquiterpenoid quinones, from the Okinawan
marine sponge, Dactylospongia elegans. Tetrahedron 2002, 58, 1693-1696.
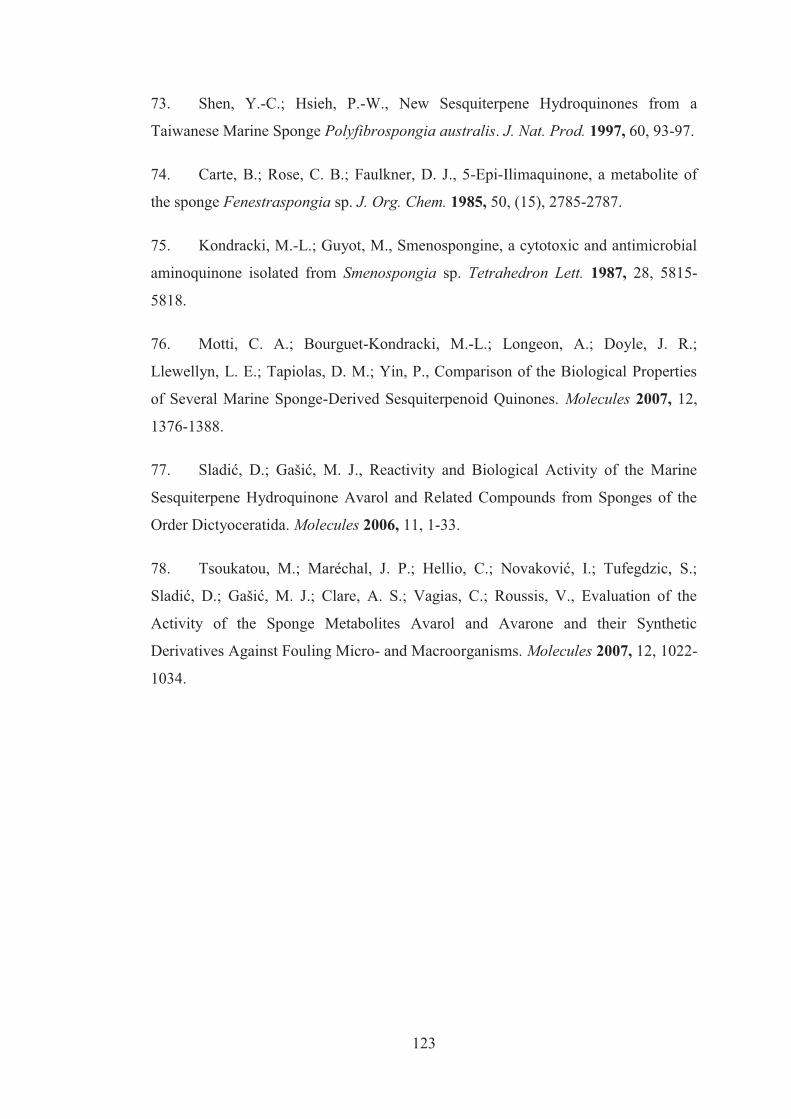
123
73. Shen, Y.-C.; Hsieh, P.-W., New Sesquiterpene Hydroquinones from a
Taiwanese Marine Sponge Polyfibrospongia australis. J. Nat. Prod. 1997, 60, 93-97.
74. Carte, B.; Rose, C. B.; Faulkner, D. J., 5-Epi-Ilimaquinone, a metabolite of
the sponge Fenestraspongia sp. J. Org. Chem. 1985, 50, (15), 2785-2787.
75. Kondracki, M.-L.; Guyot, M., Smenospongine, a cytotoxic and antimicrobial
aminoquinone isolated from Smenospongia sp. Tetrahedron Lett. 1987, 28, 5815-
5818.
76. Motti, C. A.; Bourguet-Kondracki, M.-L.; Longeon, A.; Doyle, J. R.;
Llewellyn, L. E.; Tapiolas, D. M.; Yin, P., Comparison of the Biological Properties
of Several Marine Sponge-Derived Sesquiterpenoid Quinones. Molecules 2007, 12,
1376-1388.
77. Sladić, D.; Gašić, M. J., Reactivity and Biological Activity of the Marine
Sesquiterpene Hydroquinone Avarol and Related Compounds from Sponges of the
Order Dictyoceratida. Molecules 2006, 11, 1-33.
78. Tsoukatou, M.; Maréchal, J. P.; Hellio, C.; Novaković, I.; Tufegdzic, S.;
Sladić, D.; Gašić, M. J.; Clare, A. S.; Vagias, C.; Roussis, V., Evaluation of the
Activity of the Sponge Metabolites Avarol and Avarone and their Synthetic
Derivatives Against Fouling Micro- and Macroorganisms. Molecules 2007, 12, 1022-
1034.
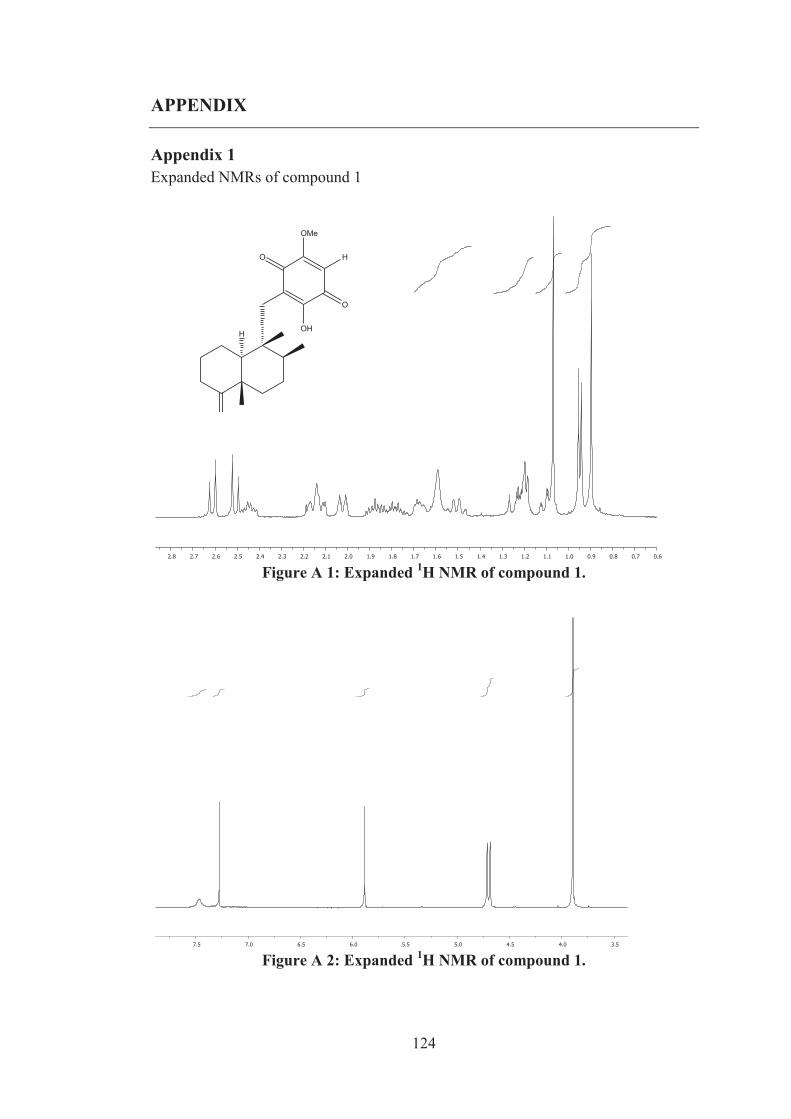
124
APPENDIX
Appendix 1 Expanded NMRs of compound 1
Figure A 1: Expanded 1H NMR of compound 1.
Figure A 2: Expanded 1H NMR of compound 1.
H
O
O
OMe
H
OH
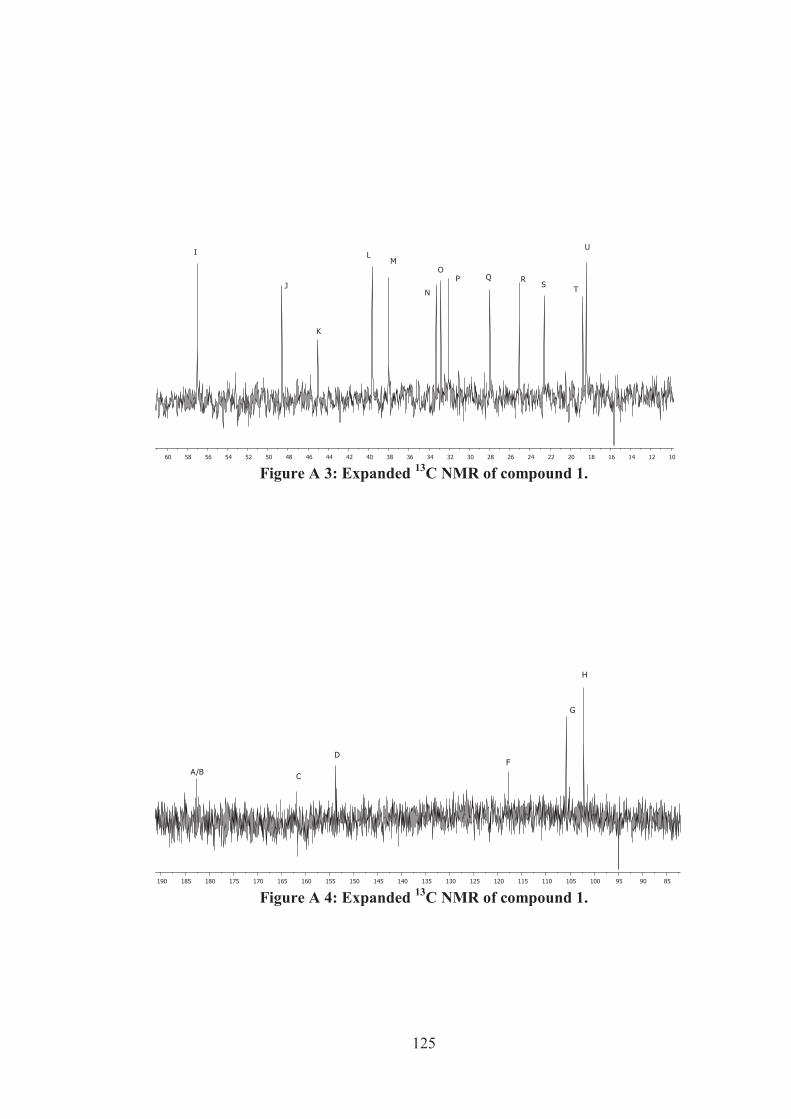
125
Figure A 3: Expanded 13C NMR of compound 1.
Figure A 4: Expanded 13C NMR of compound 1.
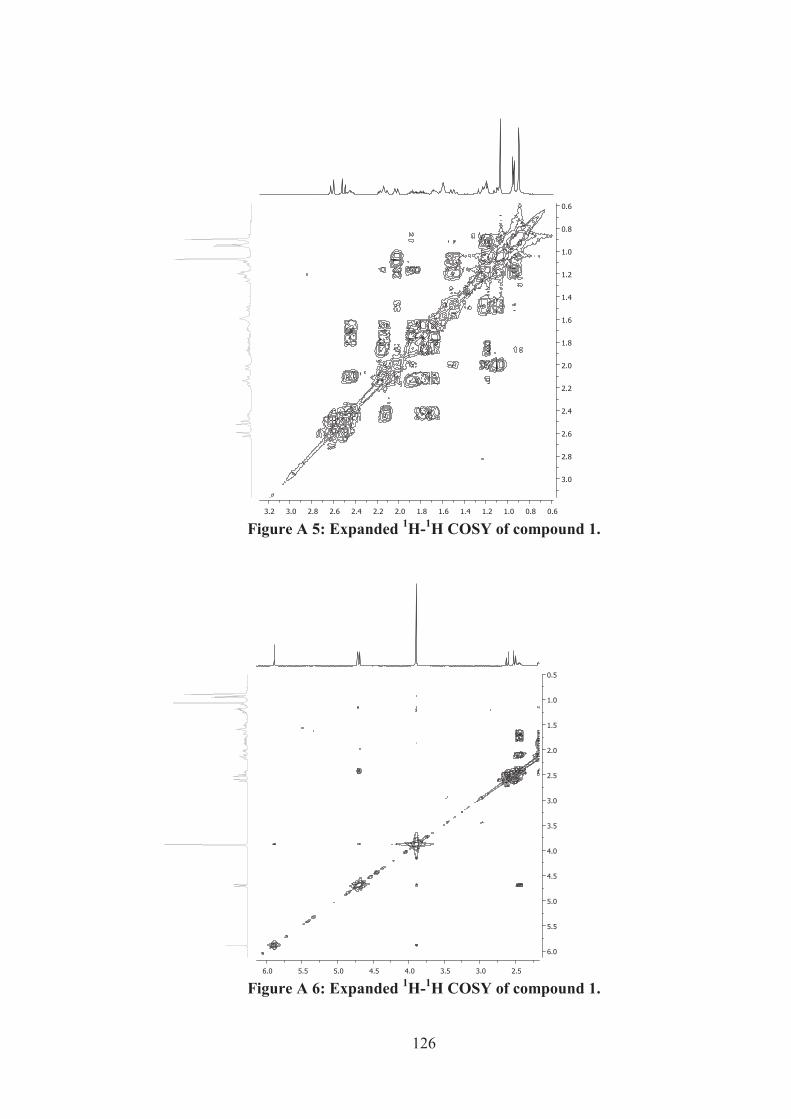
126
Figure A 5: Expanded 1H-1H COSY of compound 1.
Figure A 6: Expanded 1H-1H COSY of compound 1.
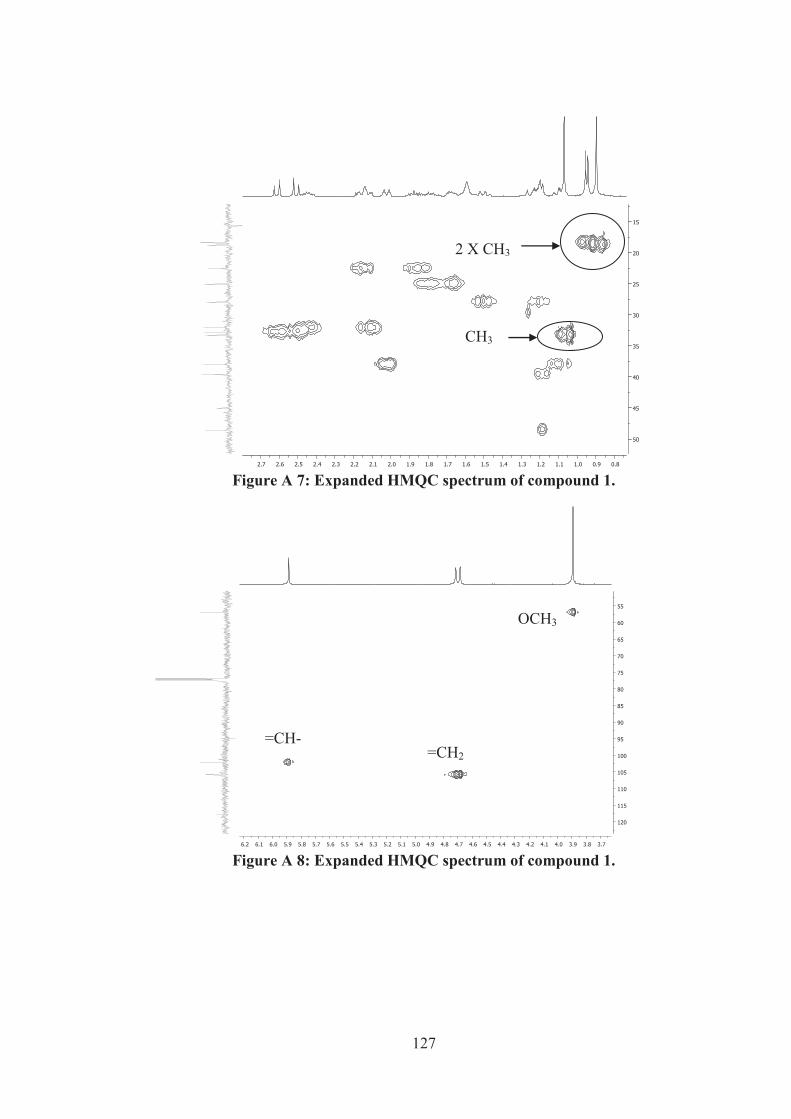
127
OCH3
Figure A 7: Expanded HMQC spectrum of compound 1.
Figure A 8: Expanded HMQC spectrum of compound 1.
2 X CH3
CH3
=CH- =CH2
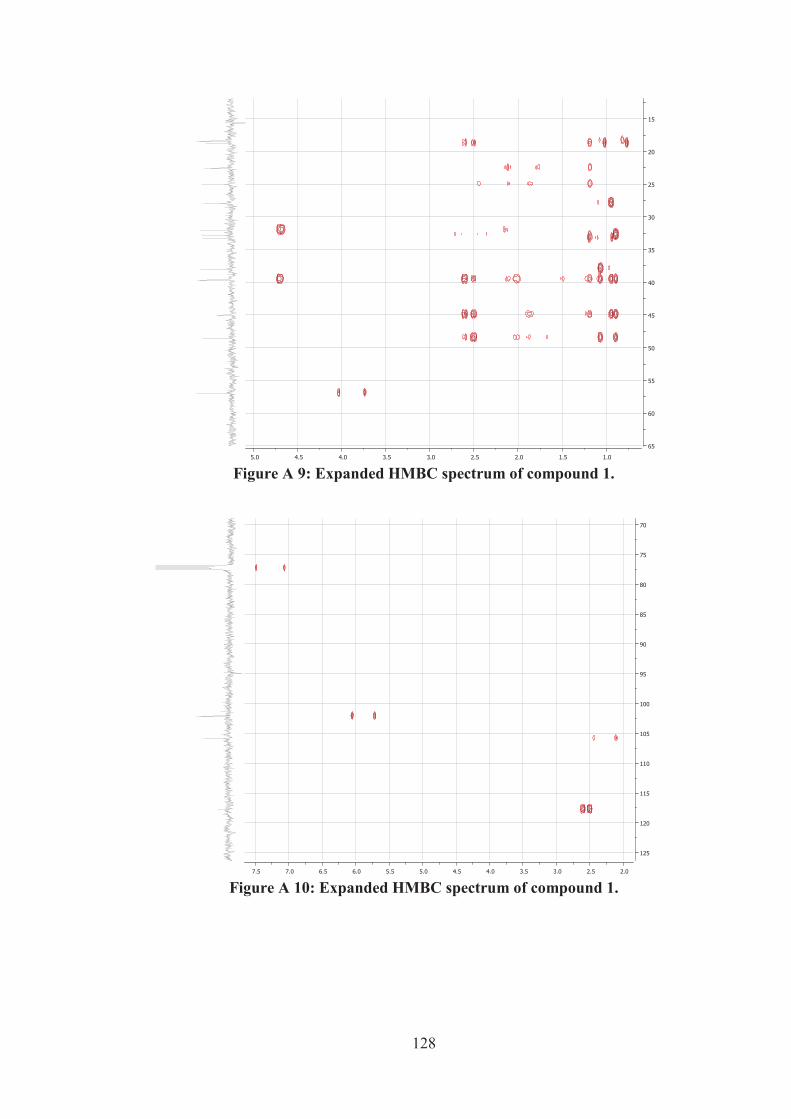
128
Figure A 9: Expanded HMBC spectrum of compound 1.
Figure A 10: Expanded HMBC spectrum of compound 1.
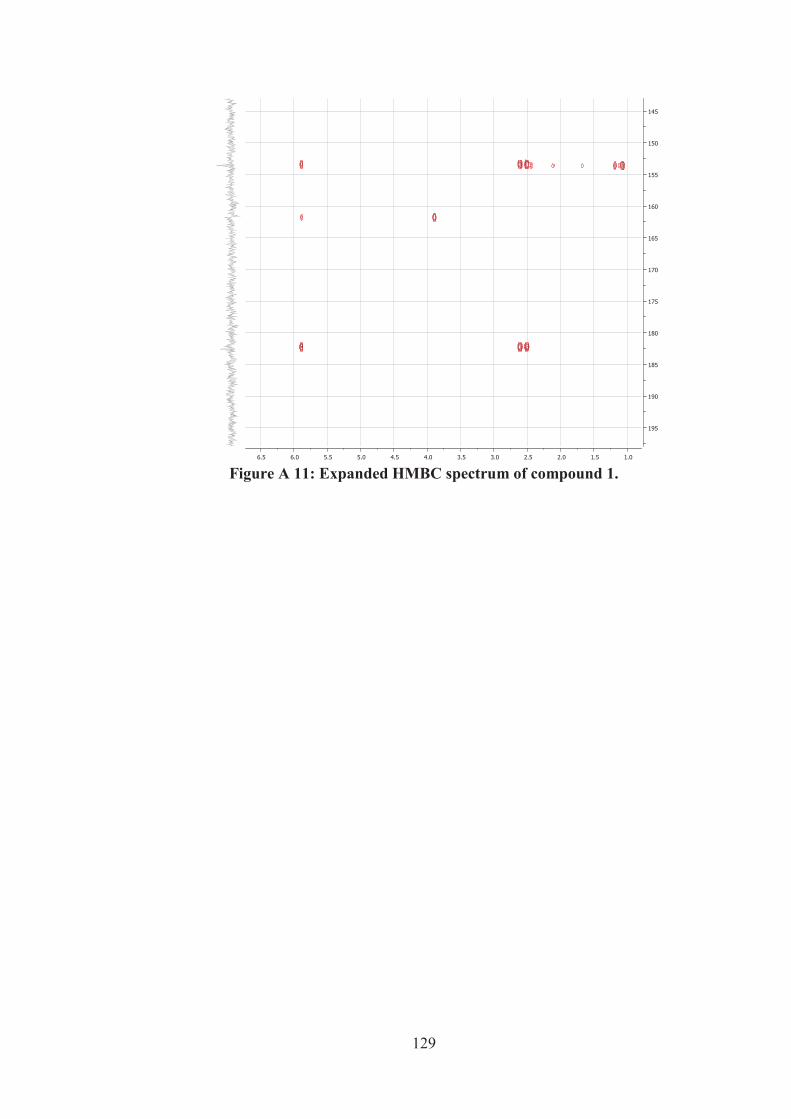
129
Figure A 11: Expanded HMBC spectrum of compound 1.
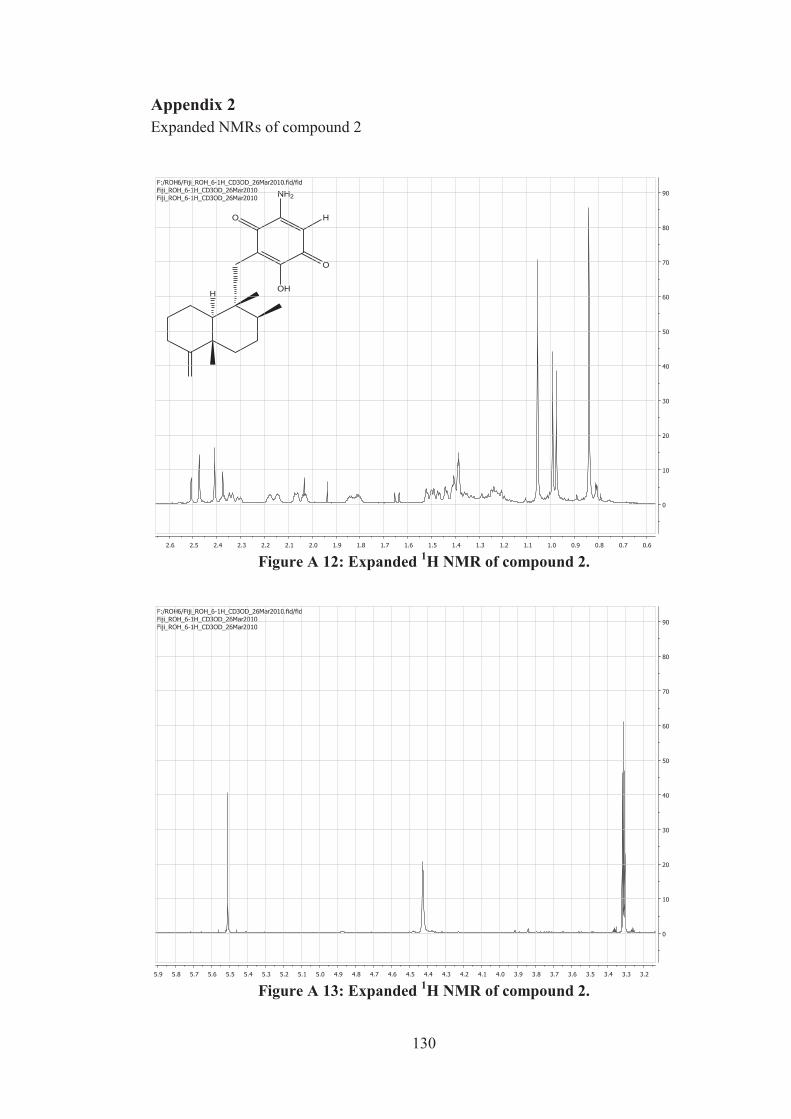
130
H
O
O
NH2
H
OH
Appendix 2 Expanded NMRs of compound 2
Figure A 12: Expanded 1H NMR of compound 2.
Figure A 13: Expanded 1H NMR of compound 2.
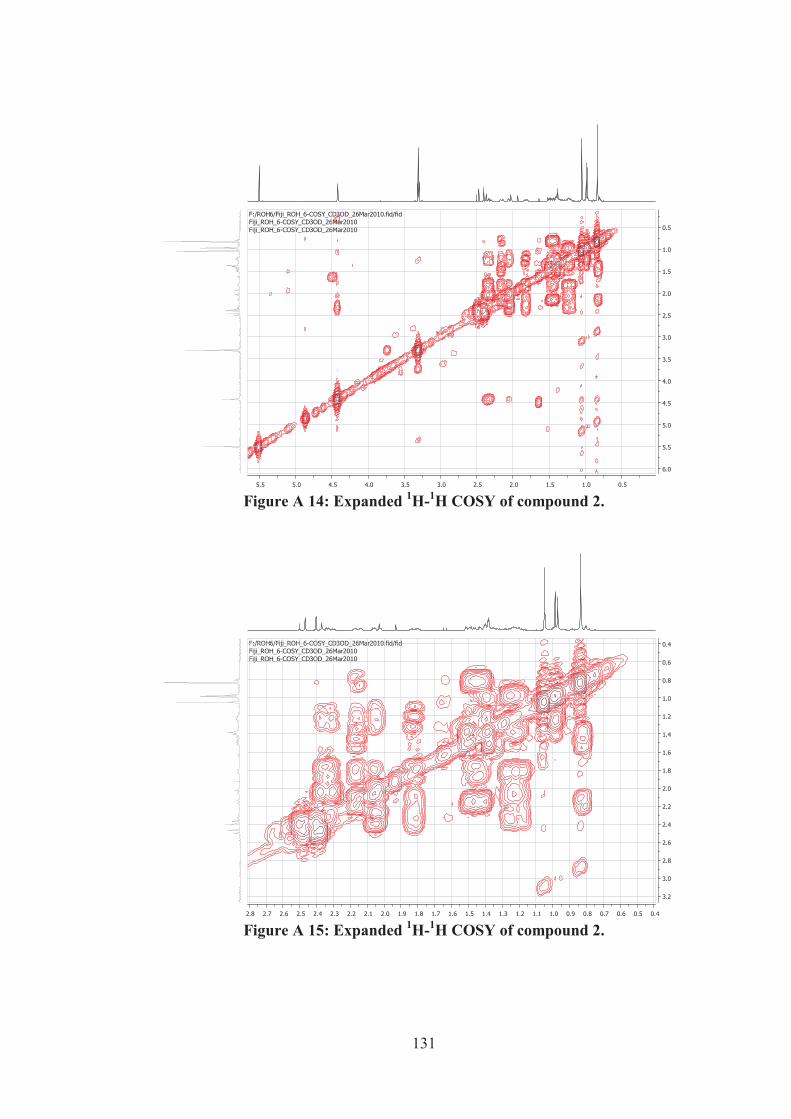
131
Figure A 14: Expanded 1H-1H COSY of compound 2.
Figure A 15: Expanded 1H-1H COSY of compound 2.
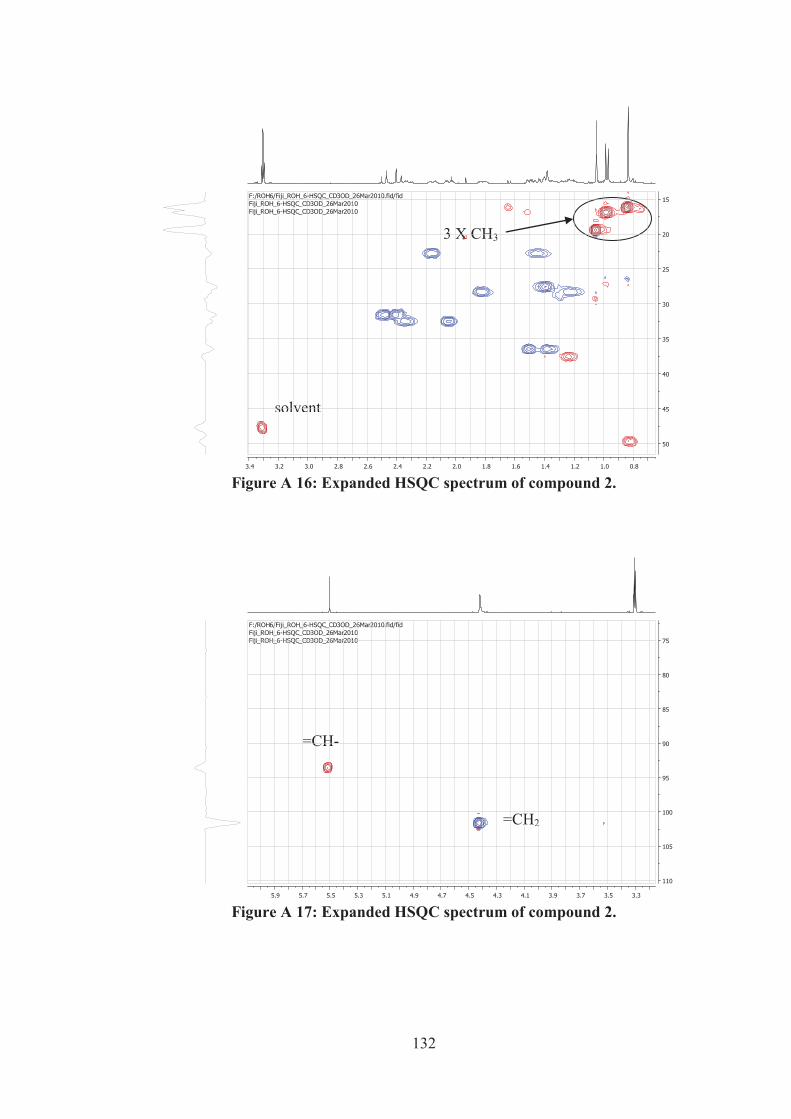
132
3 X CH3
solvent
=CH2
=CH-
Figure A 16: Expanded HSQC spectrum of compound 2.
Figure A 17: Expanded HSQC spectrum of compound 2.
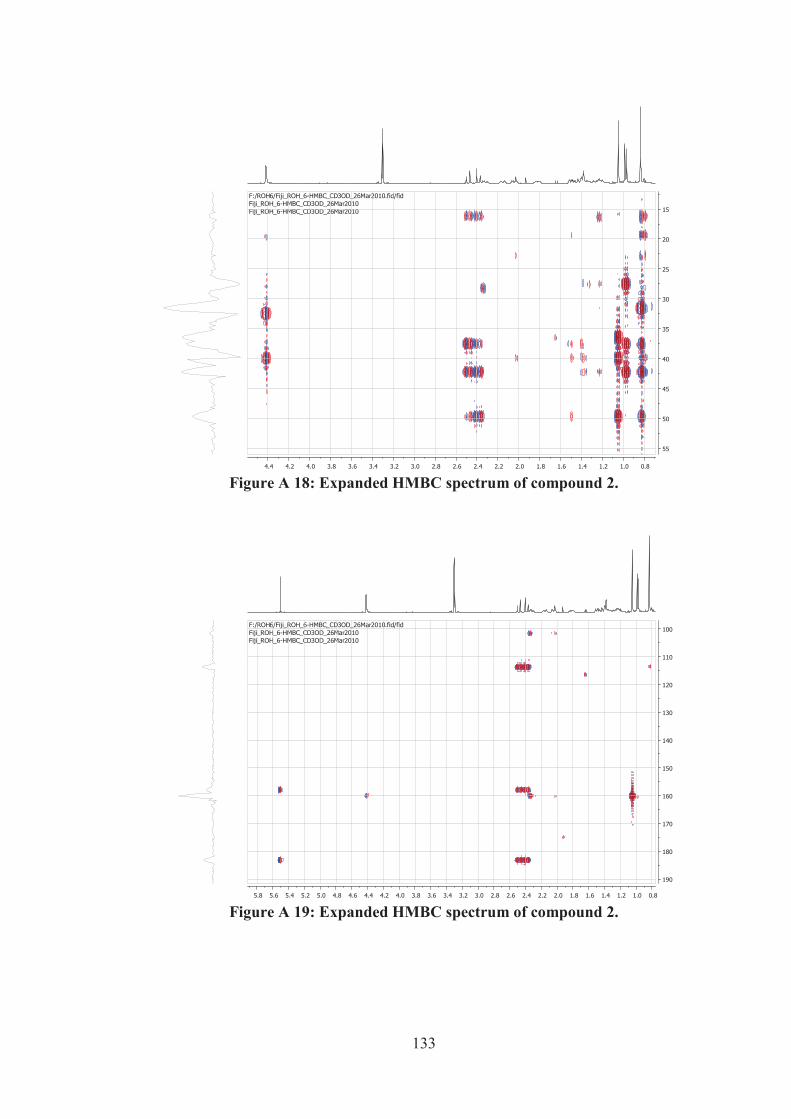
133
Figure A 18: Expanded HMBC spectrum of compound 2.
Figure A 19: Expanded HMBC spectrum of compound 2.
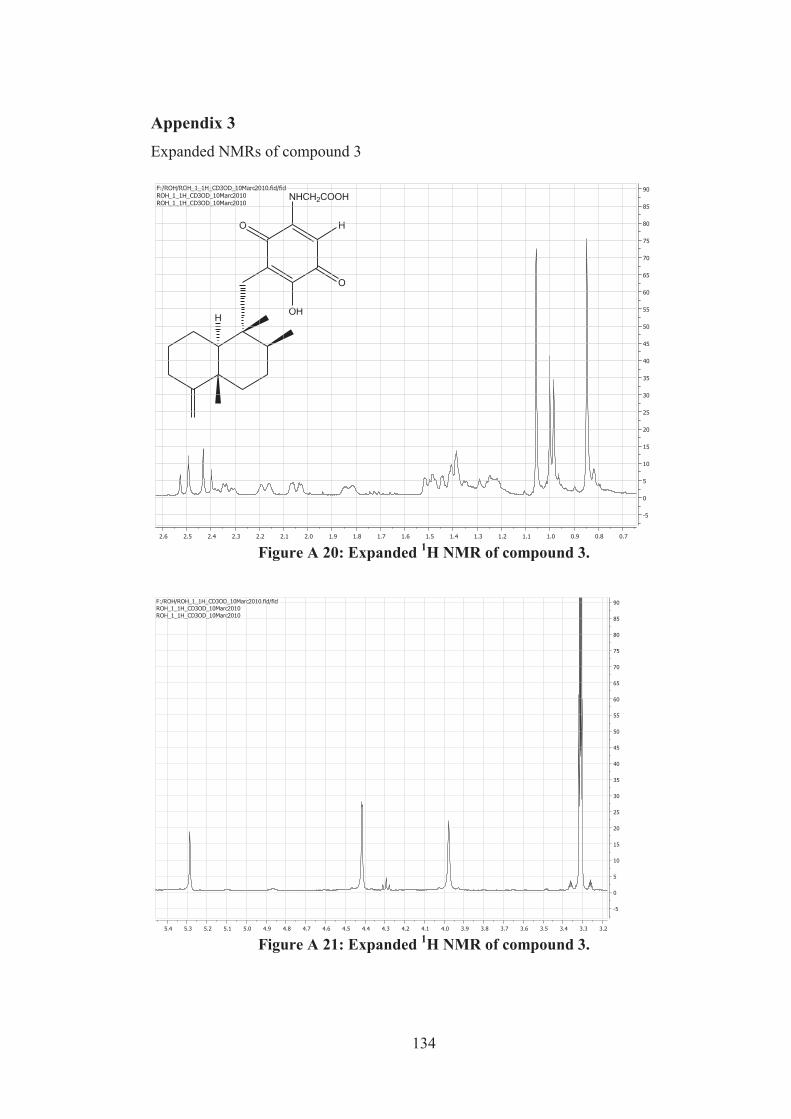
134
H
O
O
NHCH2COOH
H
OH
Appendix 3 Expanded NMRs of compound 3
Figure A 20: Expanded 1H NMR of compound 3.
Figure A 21: Expanded 1H NMR of compound 3.
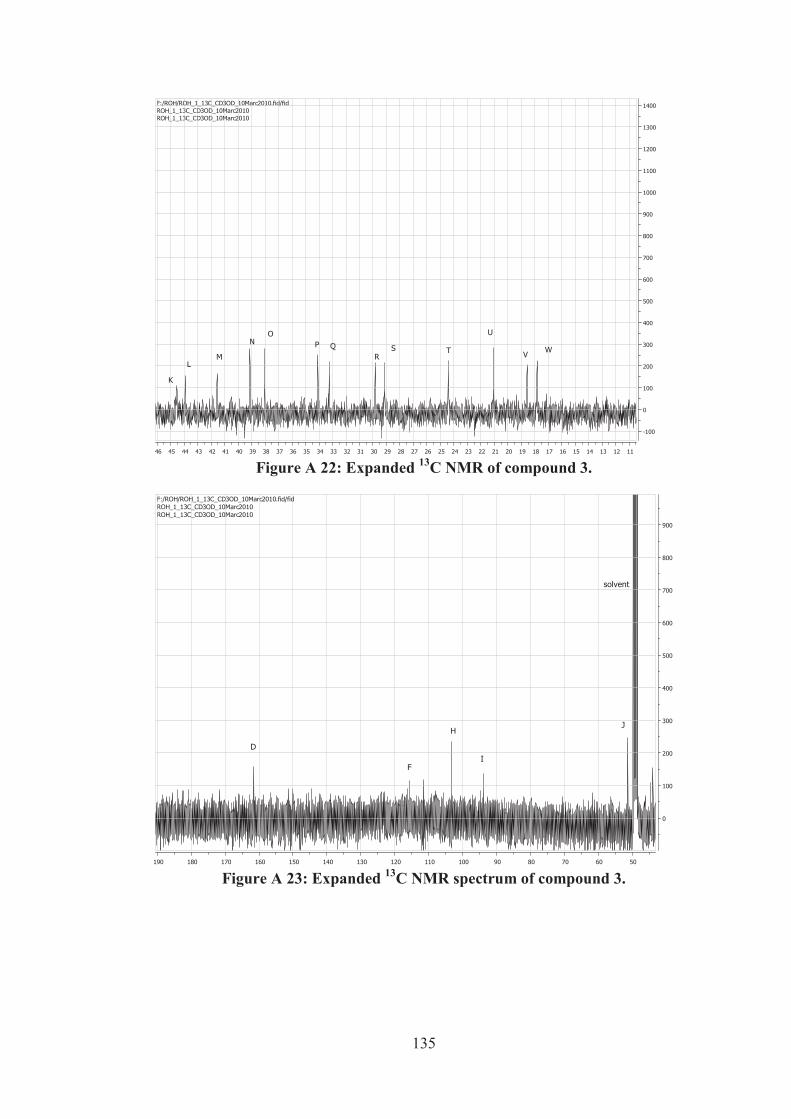
135
Figure A 22: Expanded 13C NMR of compound 3.
Figure A 23: Expanded 13C NMR spectrum of compound 3.
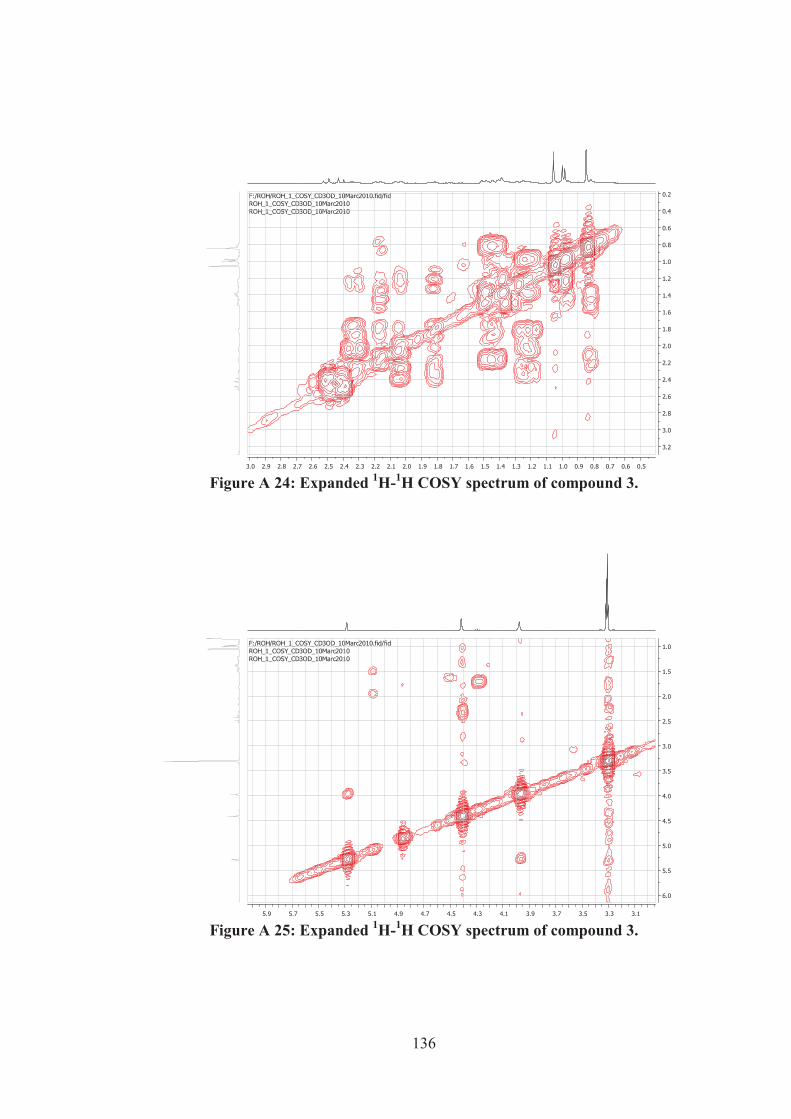
136
Figure A 24: Expanded 1H-1H COSY spectrum of compound 3.
Figure A 25: Expanded 1H-1H COSY spectrum of compound 3.
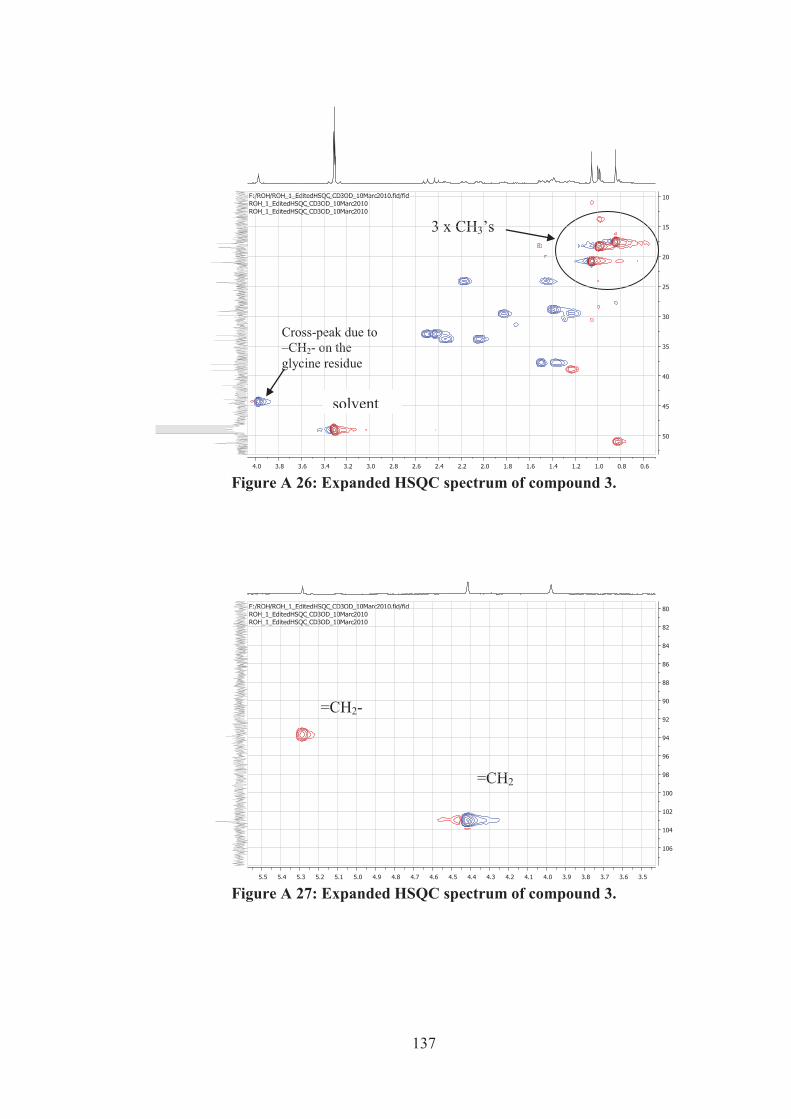
137
Cross-peak due to –CH2- on the glycine residue
3 x CH3’s
=CH2
=CH2-
Figure A 26: Expanded HSQC spectrum of compound 3.
Figure A 27: Expanded HSQC spectrum of compound 3.
solvent
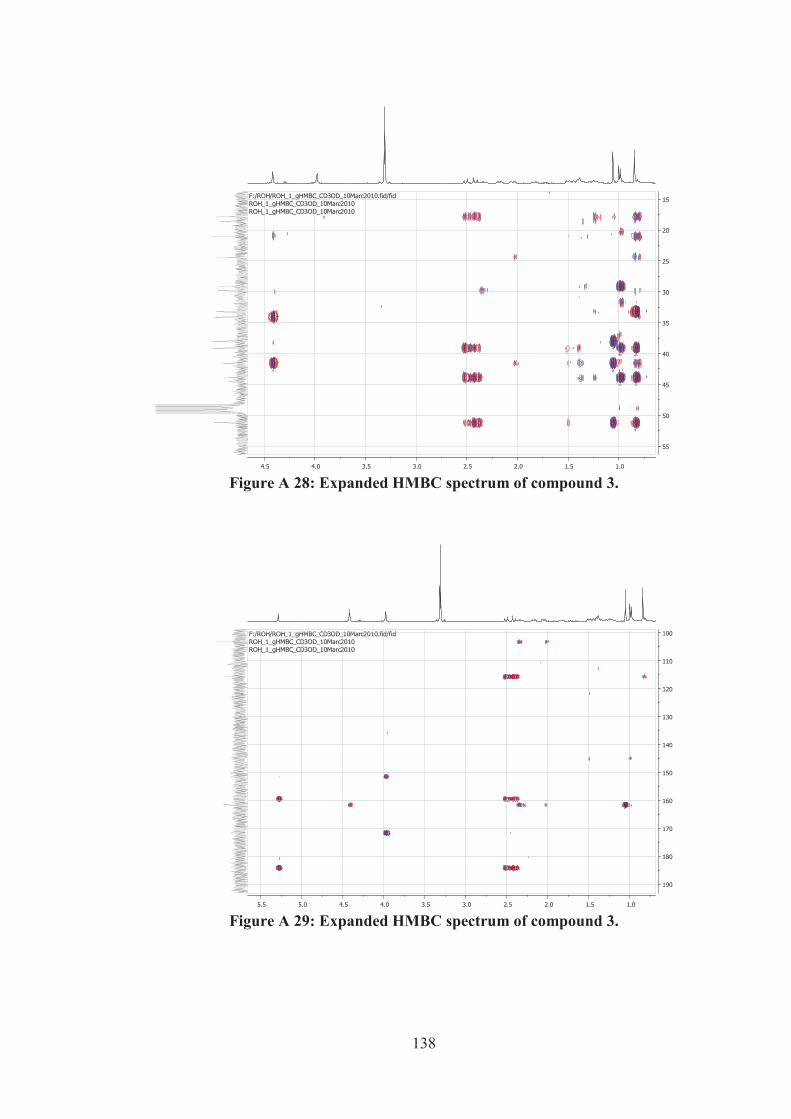
138
Figure A 28: Expanded HMBC spectrum of compound 3.
Figure A 29: Expanded HMBC spectrum of compound 3.
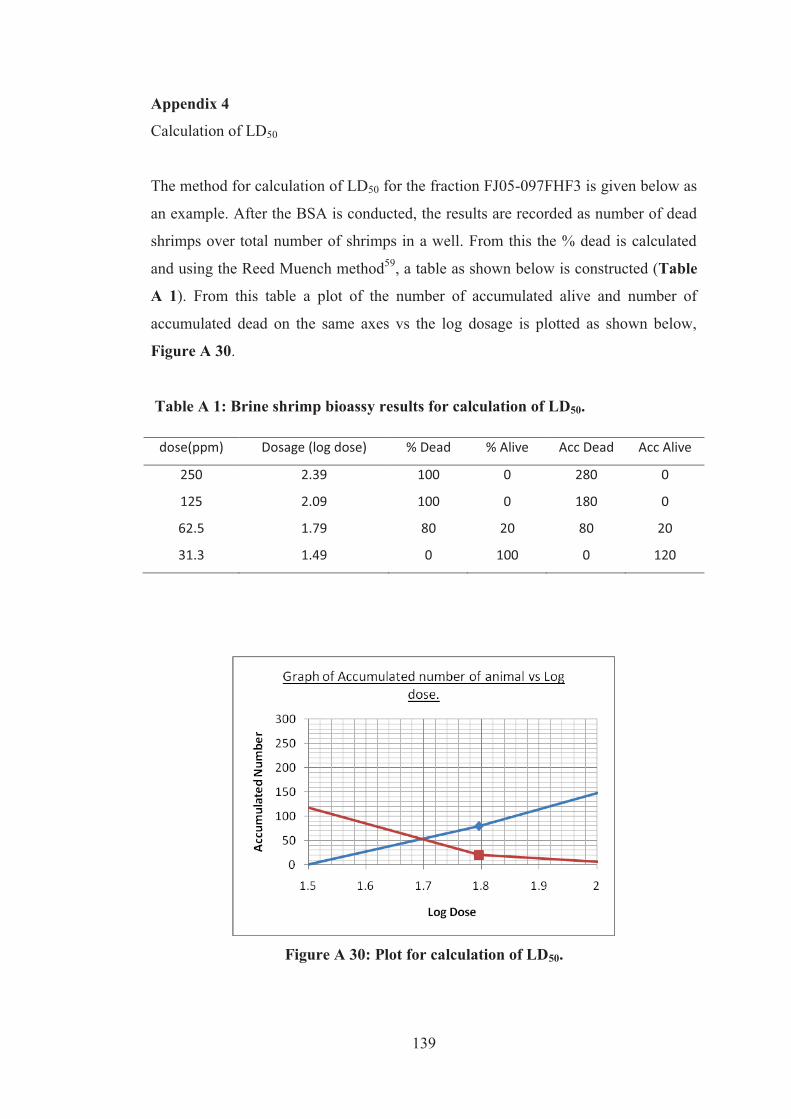
139
Appendix 4
Calculation of LD50
The method for calculation of LD50 for the fraction FJ05-097FHF3 is given below as
an example. After the BSA is conducted, the results are recorded as number of dead
shrimps over total number of shrimps in a well. From this the % dead is calculated
and using the Reed Muench method59, a table as shown below is constructed (Table
A 1). From this table a plot of the number of accumulated alive and number of
accumulated dead on the same axes vs the log dosage is plotted as shown below,
Figure A 30.
Table A 1: Brine shrimp bioassy results for calculation of LD50.
dose(ppm) Dosage (log dose) % Dead % Alive Acc Dead Acc Alive
250 2.39 100 0 280 0
125 2.09 100 0 180 0
62.5 1.79 80 20 80 20
31.3 1.49 0 100 0 120
Figure A 30: Plot for calculation of LD50.
140
The point of intersection (log dose) of the two lines is where the number of survivors
is equal to the number of dead animals; hence taking antilog of this value gives the
LD50 in ppm. For fraction FJ05-097FHF3 the point of intersection is 1.7 and antilog
gives the LD50 of 50.11ppm.