Embed Size (px)
Citation preview

A Reference numberISO 14644-1:1999(E)
INTERNATIONALSTANDARD
ISO14644-1
First edition1999-05-01
Cleanrooms and associated controlledenvironments —
Part 1:Classification of air cleanliness
Salles propres et environnements maîtrisés apparentés —
Partie 1: Classification de la propreté de l'air
COPYRIGHTED MATERIAL LICENSED TO NASA (nasa.gov users) (G2222)(137.78.215.178) ON Friday, June 18, 2004 FOR LICENSEE'S USE ONLY. SINGLE USER LICENSEONLY. COPYING AND NETWORKING PROHIBITED DOCUMENT PROVIDED BY USAINFO.COM.

ISO 14644-1:1999(E) © ISO
ii
Contents
Page
Foreword ......................................................................................................... iii
Introduction ..................................................................................................... iv
1 Scope ........................................................................................................ 1
2 Definitions .................................................................................................. 1
3 Classification ............................................................................................. 3
4 Demonstration of compliance .................................................................... 4
Annexes
Annex A (informative) Graphical illustration of the classes of Table 1 ............ 5
Annex B (normative) Determination of particulate cleanliness classificationusing a discrete-particle-counting, light-scattering instrument ...... 6
Annex C (normative) Statistical treatment of particle concentration data ..... 9
Annex D (informative) Worked examples of classification calculations ........ 10
Annex E (informative) Considerations for the counting and sizing of particlesoutside the size range applicable for classification ..................... 13
Annex F (informative) Sequential sampling procedure ................................ 15
Bibliography ................................................................................................... 18
Figures
Figure A.1 Graphical representation of ISO-class concentration limitsfor selected ISO classes ............................................................... 5
Figure F.1 Boundaries for pass or fail by the sequential samplingprocedure .................................................................................. 15
Tables
Table 1 Selected airborne particulate cleanliness classes forcleanrooms and clean zones ........................................................ 3
Table C.1 Student’s t distribution for the 95% upper confidence limit ........... 9
Table F.1 Upper and lower limits for time at which C observed countsshould arrive ............................................................................... 16
© ISO 1999
All rights reserved. Unless otherwise specified, no part of this publication may be reproduced or utilized in any form or by any means, electronicor mechanical, including photocopying and microfilm, without permission in writing from the publisher.
International Organization for StandardizationCase Postale 56 • CH-1211 Genève 20 • SwitzerlandInternet [email protected]
Printed in Switzerland
COPYRIGHTED MATERIAL LICENSED TO NASA (nasa.gov users) (G2222)(137.78.215.178) ON Friday, June 18, 2004 FOR LICENSEE'S USE ONLY. SINGLE USER LICENSE ONLY. COPYING ANDNETWORKING PROHIBITED DOCUMENT PROVIDED BY USAINFO.COM.
© ISO ISO 14644-1:1999(E)
iii
Foreword
ISO (the International Organization for Standardization) is a worldwide federation ofnational standards bodies (ISO member bodies). The work of preparing InternationalStandards is normally carried out through ISO technical committees. Each member bodyinterested in a subject for which a technical committee has been established has the rightto be represented on that committee. International organizations, governmental andnongovernmental, in liaison with ISO, also take part in the work. ISO collaborates closelywith the International Electrotechnical Commission (IEC) on all matters of electrotechnicalstandardization.
Draft International Standards adopted by the technical committees are circulated to themember bodies for voting. Publication as an International Standard requires approval byat least 75% of the member bodies casting a vote.
International Standard ISO 14644-1 was prepared by Technical Committee ISO/TC 209,Cleanrooms and associated controlled environments.
ISO 14644 consists of the following parts, under the general title Cleanrooms andassociated controlled environments:
— Part 1: Classification of air cleanliness
— Part 2: Specifications for testing and monitoring to prove continued compliancewith ISO 14644-1
— Part 3: Metrology and test methods
— Part 4: Design, construction and start-up
— Part 5: Operations
— Part 6: Terms and definitions
— Part 7: Enhanced clean devices
Users should note that the titles listed for parts 2 to 7 are working titles at the time of therelease of part 1. In the event that one or more of these parts are deleted from the workprogramme, the remaining parts may be renumbered.
Annexes B and C form an integral part of this part of ISO 14644. Annexes A, D, E, and Fare for information only.
COPYRIGHTED MATERIAL LICENSED TO NASA (nasa.gov users) (G2222)(137.78.215.178) ON Friday, June 18, 2004 FOR LICENSEE'S USE ONLY. SINGLE USER LICENSE ONLY. COPYING ANDNETWORKING PROHIBITED DOCUMENT PROVIDED BY USAINFO.COM.
Introduction
Cleanrooms and associated controlled environments provide for the control of airborneparticulate contamination to levels appropriate for accomplishing contamination-sensitiveactivities. Products and processes that benefit from the control of airborne contaminationinclude those in such industries as aerospace, microelectronics, pharmaceuticals, medicaldevices, food, and healthcare.
This part of ISO 14644 assigns ISO classification levels to be used for the specification ofair cleanliness in cleanrooms and associated controlled environments. It also prescribes thestandard method of testing as well as the procedure for determining the concentration ofairborne particles.
For classification purposes, this part of ISO 14644 is limited to a designated range ofconsidered particle sizes for determination of particle concentration limits. This part of ISO14644 also provides standard protocols for the determination and designation of cleanli-ness levels that are based on airborne concentrations of particles smaller or larger than thesize range designated for classification.
This part of ISO 14644 is one of a series of standards concerned with cleanrooms andcontamination control. Many factors besides airborne particulate cleanliness must beconsidered in the design, specification, operation, and control of cleanrooms and othercontrolled environments. These are covered in some detail in other parts of the InternationalStandards prepared by ISO/TC 209.
In some circumstances, relevant regulatory agencies may impose supplementary policiesor restrictions. In such situations, appropriate adaptations of the standard testing proce-dures may be required.
ISO 14644-1:1999(E) © ISO
ivCOPYRIGHTED MATERIAL LICENSED TO NASA (nasa.gov users) (G2222)(137.78.215.178) ON Friday, June 18, 2004 FOR LICENSEE'S USE ONLY. SINGLE USER LICENSE ONLY. COPYING ANDNETWORKING PROHIBITED DOCUMENT PROVIDED BY USAINFO.COM.
1
INTERNATIONAL STANDARD © ISO ISO 14644-1:1999(E)
1 Scope
This part of ISO 14644 covers the classification of air cleanli-ness in cleanrooms and associated controlled environmentsexclusively in terms of concentration of airborne particles.Only particle populations having cumulative distributions basedon threshold (lower limit) sizes ranging from 0,1 µm to 5 µm areconsidered for classification purposes.
This part of ISO 14644 does not provide for classification ofparticle populations that are outside of the specified particlesize range, 0,1 µm to 5 µm. Concentrations of ultrafine particles(particles smaller than 0,1 µm) and macroparticles (particleslarger than 5 µm) may be used to quantify these populations interms of U descriptors and M descriptors, respectively.
This part of ISO 14644 cannot be used to characterize thephysical, chemical, radiological, or viable nature of airborneparticles.
NOTE The actual distribution of particle concentrations within incre-mental size ranges normally is not predictable and typically is variableover time.
2 DefinitionsFor the purposes of this part of ISO 14644, the followingdefinitions apply.
2.1 General
2.1.1
cleanroomroom in which the concentration of airborne particles is con-trolled, and which is constructed and used in a manner tominimize the introduction, generation, and retention of parti-
cles inside the room, and in which other relevant parameters,e.g. temperature, humidity, and pressure, are controlled asnecessary
2.1.2
clean zonededicated space in which the concentration of airborne parti-cles is controlled, and which is constructed and used in amanner to minimize the introduction, generation, and retentionof particles inside the zone, and in which other relevantparameters, e.g. temperature, humidity, and pressure, arecontrolled as necessary
NOTE This zone may be open or enclosed and may or may not belocated within a cleanroom.
2.1.3
installationcleanroom or one or more clean zones, together with allassociated structures, air-treatment systems, services, andutilities
2.1.4
classificationlevel (or the process of specifying or determining the level) ofairborne particulate cleanliness applicable to a cleanroom orclean zone, expressed in terms of an ISO Class N, whichrepresents maximum allowable concentrations (in particlesper cubic metre of air) for considered sizes of particles
NOTE 1 The concentrations are determined by using equation (1)in 3.2.
NOTE 2 Classification in accordance with this International Stan-dard is limited to the range extending from ISO Class 1 through ISOClass 9.
NOTE 3 The considered particle sizes (lower threshold values)applicable for classification in accordance with this International
Cleanrooms and associated controlled environments —
Part 1:Classification of air cleanliness
COPYRIGHTED MATERIAL LICENSED TO NASA (nasa.gov users) (G2222)(137.78.215.178) ON Friday, June 18, 2004 FOR LICENSEE'S USE ONLY. SINGLE USER LICENSE ONLY. COPYING ANDNETWORKING PROHIBITED DOCUMENT PROVIDED BY USAINFO.COM.
ISO 14644-1:1999(E) © ISO
2
Standard are limited to the range from 0,1 µm through 5 µm. Aircleanliness may be described and specified (but not classified) interms of U descriptors or M descriptors (see 2.3.1 or 2.3.2) forconsidered threshold particle sizes that are outside of the rangecovered by classification.
NOTE 4 Intermediate ISO classification numbers may be speci-fied, with 0,1 the smallest permitted increment; i.e., the range ofintermediate ISO classes extends from ISO Class 1,1 through ISOClass 8,9.
NOTE 5 Classification may be specified or accomplished in any ofthree occupancy states (see 2.4).
2.2 Airborne particles
2.2.1
particlesolid or liquid object which, for purposes of classification of aircleanliness, falls within a cumulative distribution that is basedupon a threshold (lower limit) size in the range from 0,1 µm to5 µm
2.2.2
particle sizediameter of a sphere that produces a response, by a givenparticle-sizing instrument, that is equivalent to the responseproduced by the particle being measured
NOTE For discrete-particle-counting, light-scattering instruments,the equivalent optical diameter is used.
2.2.3
particle concentrationnumber of individual particles per unit volume of air
2.2.4
particle size distributioncumulative distribution of particle concentration as a function ofparticle size
2.2.5
ultrafine particleparticle with an equivalent diameter less than 0,1 µm
2.2.6
macroparticleparticle with an equivalent diameter greater than 5 µm
2.2.7
fibreparticle having an aspect (length-to-width) ratio of 10 or more
2.3 Descriptors
2.3.1
U descriptormeasured or specified concentration, of particles per cubicmetre of air, including the ultrafine particles
NOTE The U descriptor may be regarded as an upper limit for theaverages at sampling locations (or as an upper confidence limit,depending upon the number of sampling locations used to character-ize the cleanroom or clean zone). U descriptors cannot be used todefine airborne particulate cleanliness classes, but they may bequoted independently or in conjunction with airborne particulatecleanliness classes.
2.3.2
M descriptormeasured or specified concentration of macroparticles percubic metre of air, expressed in terms of the equivalentdiameter that is characteristic of the measurement methodused
NOTE The M descriptor may be regarded as an upper limit for theaverages at sampling locations (or as an upper confidence limit,depending upon the number of sampling locations used to character-ize the cleanroom or clean zone). M descriptors cannot be used todefine airborne particulate cleanliness classes, but they may bequoted independently or in conjunction with airborne particulatecleanliness classes.
2.4 Occupancy states
2.4.1
as-builtcondition where the installation is complete with all servicesconnected and functioning but with no production equipment,materials, or personnel present
2.4.2
at-restcondition where the installation is complete with equipmentinstalled and operating in a manner agreed upon by thecustomer and supplier, but with no personnel present
2.4.3
operationalcondition where the installation is functioning in the specifiedmanner, with the specified number of personnel present andworking in the manner agreed upon
COPYRIGHTED MATERIAL LICENSED TO NASA (nasa.gov users) (G2222)(137.78.215.178) ON Friday, June 18, 2004 FOR LICENSEE'S USE ONLY. SINGLE USER LICENSE ONLY. COPYING ANDNETWORKING PROHIBITED DOCUMENT PROVIDED BY USAINFO.COM.
© ISO ISO 14644-1:1999(E)
3
2.5 Roles
2.5.1
customerorganization, or the agent thereof, responsible for specifyingthe requirements of a cleanroom or clean zone
2.5.2
supplierorganization engaged to satisfy the specified requirements ofa cleanroom or clean zone
3 Classification
3.1 Occupancy state(s)The particulate cleanliness of air in a cleanroom or clean zoneshall be defined in one or more of three occupancy states, viz.“as-built”, “at-rest”, or “operational” (see 2.4).
NOTE It should be recognized that the “as-built” state is applicableto newly completed or newly modified cleanrooms or clean zones.Once testing in the “as-built” state is completed, further testing forcompliance will be performed in the “at-rest” or the “operational” state,or both.
3.2 Classification numberAirborne particulate cleanliness shall be designated by aclassification number, N. The maximum permitted concentra-tion of particles, Cn, for each considered particle size, D, isdetermined from the equation:
CDn
N= ×
100 1 2 08, ,
(1)
where
Cn is the maximum permitted concentration (in parti-cles per cubic metre of air) of airborne particles thatare equal to or larger than the considered particlesize. Cn is rounded to the nearest whole number,using no more than three significant figures.
N is the ISO classification number, which shall notexceed a value of 9. Intermediate ISO classificationnumbers may be specified, with 0,1 the smallestpermitted increment of N.
D is the considered particle size, in micrometres.
0,1 is a constant, with a dimension of micrometres.
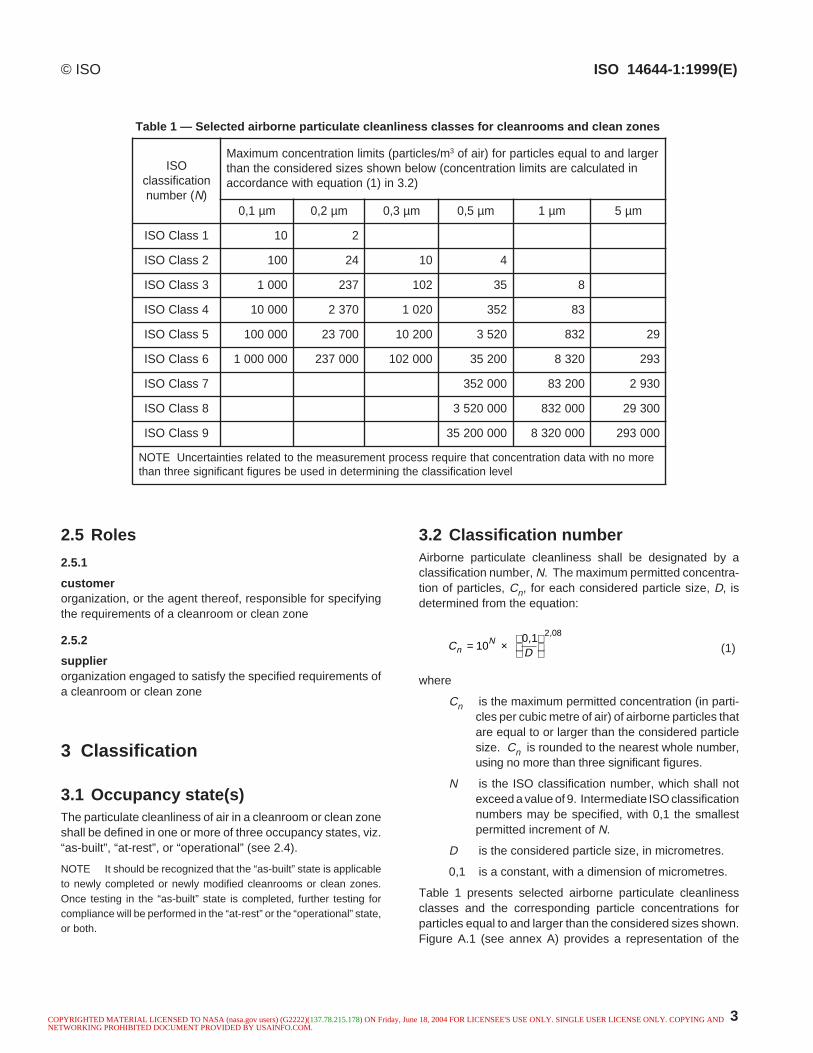
Table 1 presents selected airborne particulate cleanlinessclasses and the corresponding particle concentrations forparticles equal to and larger than the considered sizes shown.Figure A.1 (see annex A) provides a representation of the
OSInoitacifissalc
(rebmun N)
m/selcitrap(stimilnoitartnecnocmumixaM 3 regraldnaotlauqeselcitraprof)riafonidetaluclacerastimilnoitartnecnoc(wolebnwohssezisderedisnocehtnaht
)2.3ni)1(noitauqehtiwecnadrocca
1,0 µm 2,0 µm 3,0 µm 5,0 µm 1 µm 5 µm
1ssalCOSI 01 2
2ssalCOSI 001 42 01 4
3ssalCOSI 0001 732 201 53 8
4ssalCOSI 00001 0732 0201 253 38
5ssalCOSI 000001 00732 00201 0253 238 92
6ssalCOSI 0000001 000732 000201 00253 0238 392
7ssalCOSI 000253 00238 0392
8ssalCOSI 0000253 000238 00392
9ssalCOSI 00000253 0000238 000392
eromonhtiwatadnoitartnecnoctahteriuqerssecorptnemerusaemehtotdetalerseitniatrecnUETONlevelnoitacifissalcehtgninimretednidesuebserugiftnacifingiseerhtnaht
Table 1 — Selected airborne particulate cleanliness classes for cleanrooms and clean zones
COPYRIGHTED MATERIAL LICENSED TO NASA (nasa.gov users) (G2222)(137.78.215.178) ON Friday, June 18, 2004 FOR LICENSEE'S USE ONLY. SINGLE USER LICENSE ONLY. COPYING ANDNETWORKING PROHIBITED DOCUMENT PROVIDED BY USAINFO.COM.
ISO 14644-1:1999(E) © ISO
4
selected classes in graphical form. In case of dispute, theconcentration Cn as derived from equation (1) shall serve asthe standard value.
3.3 DesignationThe designation of airborne particulate cleanliness for clean-rooms and clean zones shall include:
a) the classification number, expressed as “ISO Class N ”;
b) the occupancy state to which the classification applies;
c) the considered particle size(s), and the related concen-tration(s), as determined by the classification equation (1)where each considered threshold particle size is in the rangefrom 0,1 µm through 5 µm.
Example designation:
ISO Class 4; operational state; considered sizes:
0,2 µm (2 370 particles/m3), 1 µm (83 particles/m3)
The considered particle size(s) for which the concentra-tion(s) will be measured shall be agreed upon by the custom-er and the supplier.
If measurements are to be made at more than one consideredparticle size, each larger particle diameter (e.g., D2) shall be atleast 1,5 times the next smaller particle diameter (e.g., D1).
e.g.: D2 ≥ 1,5 x D1
4 Demonstration of compliance
4.1 PrincipleCompliance with air cleanliness (ISO class) requirementsspecified by the customer is verified by performing specifiedtesting procedures and by providing specified documentationof the results and conditions of testing, as agreed upon by thecustomer and the supplier.
4.2 TestingThe reference test method for demonstrating compliance isgiven in annex B. An alternative method having comparableaccuracy may be specified, although if no method is specifiedor agreed upon, the reference method shall be used.
Tests performed to demonstrate compliance shall be con-ducted using calibrated instruments.
4.3 Airborne particle concentrationlimitsUpon completion of testing in accordance with 4.2, averageparticle concentrations and the 95% upper confidence limit
(when applicable) shall be calculated using equations shownin annex C.
Average particle concentration(s), calculated in accordancewith equation (C.1), shall not exceed the concentrationlimit(s) determined by use of equation (1) in 3.2, as specified[3.3 c)] for the considered size(s).
In addition, for situations in which the number of samplinglocations involved is at least two but not more than nine, thecalculation of 95% upper confidence limits in accordance withC.3 shall not exceed the concentration limits establishedabove.
NOTE Worked examples of classification calculations are providedin annex D.
Particle concentrations used for determination of conformanceto classification limits shall be measured by the same methodfor all considered particle sizes.
4.4 Test reportThe results from testing each cleanroom or clean zone shallbe recorded and submitted as a comprehensive report, alongwith a statement of compliance or noncompliance with thespecified designation of airborne particulate cleanliness clas-sification.
The test report shall include the following:
a) the name and address of the testing organization, and thedate on which the test was performed;
b) the number and year of publication of this part of ISO14644, i.e., ISO 14644-1: date of current issue;
c) a clear identification of the physical location of the clean-room or clean zone tested (including reference to adjacentareas if necessary), and specific designations for coordinatesof all sampling locations;
d) the specified designation criteria for the cleanroom or cleanzone, including the ISO classification, the relevant occupancystate(s), and the considered particle size(s);
e) details of the test method used, with any special conditionsrelating to the test or departures from the test method, andidentification of the test instrument and its current calibrationcertificate;
f) the test results, including particle concentration data for allsampling location coordinates.
NOTE If concentrations of ultrafine particles or macroparticles arequantified, as described in annex E, the pertinent information shouldbe included with the test report.
COPYRIGHTED MATERIAL LICENSED TO NASA (nasa.gov users) (G2222)(137.78.215.178) ON Friday, June 18, 2004 FOR LICENSEE'S USE ONLY. SINGLE USER LICENSE ONLY. COPYING ANDNETWORKING PROHIBITED DOCUMENT PROVIDED BY USAINFO.COM.

© ISO ISO 14664-1:1999(E)
5
Annex A(informative)
Graphical illustration of the classes of Table 1
Figure A.1 depicts the air cleanliness classes of Table 1 ingraphical form, for illustration purposes only. The ISO classesof Table 1 are shown as lines representing the classconcentration limits for the considered threshold particle sizes.They are based on calculations using equation (1) of 3.2 Asthe lines only approximate the class limits, they are not to beused to define the limits. Such determinations are made inaccordance with equation (1).
The classification lines shown on the graph may not beextrapolated beyond the solid circle symbols, whichindicate the minimum and maximum particle size limitsacceptable for each of the ISO classes shown.
The classification lines do not represent actual particle sizedistributions found in cleanrooms and clean zones.
Figure A.1 — Graphical representation of ISO-class concentration limits for selectedISO classes
NOTE 1 Cn represents the maximum permitted concentration (in particles per cubic metre of air) ofairborne particles equal to and larger than the considered particle size.
NOTE 2 N represents the specified ISO class number.
COPYRIGHTED MATERIAL LICENSED TO NASA (nasa.gov users) (G2222)(137.78.215.178) ON Friday, June 18, 2004 FOR LICENSEE'S USE ONLY. SINGLE USER LICENSE ONLY. COPYING ANDNETWORKING PROHIBITED DOCUMENT PROVIDED BY USAINFO.COM.

ISO 14644-1:1999(E) © ISO
6
Annex B(normative)
Determination of particulate cleanliness classification using adiscrete-particle-counting, light-scattering instrument
B.1 PrincipleA discrete-particle-counting, light-scattering instrument is usedto determine the concentration of airborne particles, equal toand larger than the specified sizes, at designated samplinglocations.
B.2 Apparatus requirements
B.2.1 Particle-counting instrumentDiscrete-particle counter (DPC), a light-scattering device hav-ing a means of displaying or recording the count and size ofdiscrete particles in air with a size discrimination capability todetect the total particle concentration in the appropriate par-ticle size ranges for the class under consideration, and asuitable sampling system.
B.2.2 Instrument calibrationThe instrument shall have a valid calibration certificate; thefrequency and method of calibration should be based oncurrent accepted practice.
B.3 Pretest conditionsB.3.1 Preparation for testingPrior to testing, verify that all aspects of the cleanroom or cleanzone that contribute to its operational integrity are completeand functioning in accordance with its performance specifica-tion.
Such pretesting may include, for example:
a) airflow volume or velocity tests;
b) air pressure difference test;
c) containment leakage test;
d) installed filter leakage test.
B.3.2 Pretest equipment setupPerform equipment setup and pretest calibration of the instru-ment in accordance with the manufacturer’s instructions.
B.4 SamplingB.4.1 Establishment of samplinglocationsB.4.1.1Derive the minimum number of sampling point locations fromequation (B.1):
N L = A (B.1)
where
NL is the minimum number of sampling locations(rounded up to a whole number).
A is the area of the cleanroom or clean zone in squaremetres.
NOTE In the case of unidirectional horizontal airflow, the area A maybe considered as the cross section of the moving air perpendicular tothe direction of the airflow.
B.4.1.2Ensure that the sampling locations are evenly distributedthroughout the area of the cleanroom or clean zone andpositioned at the height of the work activity.
If the customer specifies additional sampling locations, theirnumber and positions shall also be specified.
NOTE Such additional locations may be those considered critical,based on a risk analysis.
B.4.2 Establishment of single samplevolume per locationB.4.2.1At each sampling location, sample a sufficient volume of airthat a minimum of 20 particles would be detected if the particleconcentration for the largest considered particle size were atthe class limit for the designated ISO class.
The single sample volume Vs per location is determined byusing equation (B.2):
VCs
n m= ×
201 000
, (B.2)
COPYRIGHTED MATERIAL LICENSED TO NASA (nasa.gov users) (G2222)(137.78.215.178) ON Friday, June 18, 2004 FOR LICENSEE'S USE ONLY. SINGLE USER LICENSE ONLY. COPYING ANDNETWORKING PROHIBITED DOCUMENT PROVIDED BY USAINFO.COM.
© ISO ISO 14644-1:1999(E)
7
where
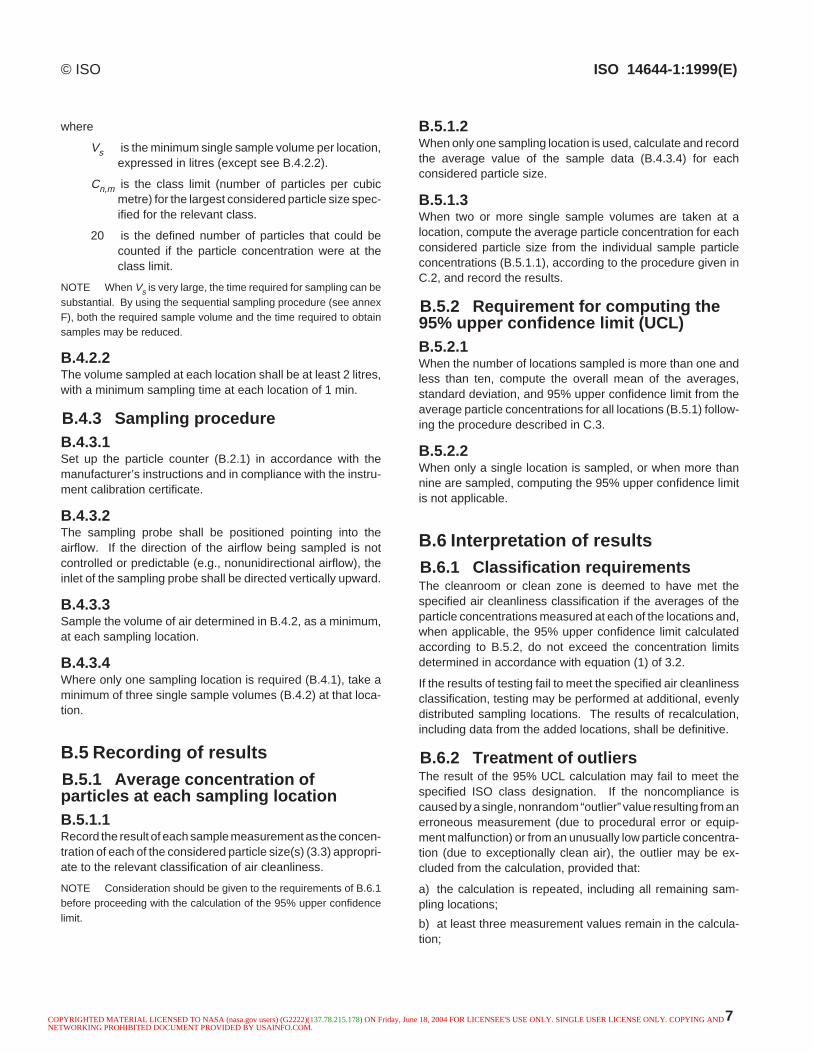
Vs is the minimum single sample volume per location,expressed in litres (except see B.4.2.2).
Cn,m is the class limit (number of particles per cubicmetre) for the largest considered particle size spec-ified for the relevant class.
20 is the defined number of particles that could becounted if the particle concentration were at theclass limit.
NOTE When Vs is very large, the time required for sampling can besubstantial. By using the sequential sampling procedure (see annexF), both the required sample volume and the time required to obtainsamples may be reduced.
B.4.2.2The volume sampled at each location shall be at least 2 litres,with a minimum sampling time at each location of 1 min.
B.4.3 Sampling procedureB.4.3.1Set up the particle counter (B.2.1) in accordance with themanufacturer’s instructions and in compliance with the instru-ment calibration certificate.
B.4.3.2The sampling probe shall be positioned pointing into theairflow. If the direction of the airflow being sampled is notcontrolled or predictable (e.g., nonunidirectional airflow), theinlet of the sampling probe shall be directed vertically upward.
B.4.3.3Sample the volume of air determined in B.4.2, as a minimum,at each sampling location.
B.4.3.4Where only one sampling location is required (B.4.1), take aminimum of three single sample volumes (B.4.2) at that loca-tion.
B.5 Recording of resultsB.5.1 Average concentration ofparticles at each sampling locationB.5.1.1Record the result of each sample measurement as the concen-tration of each of the considered particle size(s) (3.3) appropri-ate to the relevant classification of air cleanliness.
NOTE Consideration should be given to the requirements of B.6.1before proceeding with the calculation of the 95% upper confidencelimit.
B.5.1.2When only one sampling location is used, calculate and recordthe average value of the sample data (B.4.3.4) for eachconsidered particle size.
B.5.1.3When two or more single sample volumes are taken at alocation, compute the average particle concentration for eachconsidered particle size from the individual sample particleconcentrations (B.5.1.1), according to the procedure given inC.2, and record the results.
B.5.2 Requirement for computing the95% upper confidence limit (UCL)B.5.2.1When the number of locations sampled is more than one andless than ten, compute the overall mean of the averages,standard deviation, and 95% upper confidence limit from theaverage particle concentrations for all locations (B.5.1) follow-ing the procedure described in C.3.
B.5.2.2When only a single location is sampled, or when more thannine are sampled, computing the 95% upper confidence limitis not applicable.
B.6 Interpretation of resultsB.6.1 Classification requirementsThe cleanroom or clean zone is deemed to have met thespecified air cleanliness classification if the averages of theparticle concentrations measured at each of the locations and,when applicable, the 95% upper confidence limit calculatedaccording to B.5.2, do not exceed the concentration limitsdetermined in accordance with equation (1) of 3.2.
If the results of testing fail to meet the specified air cleanlinessclassification, testing may be performed at additional, evenlydistributed sampling locations. The results of recalculation,including data from the added locations, shall be definitive.
B.6.2 Treatment of outliersThe result of the 95% UCL calculation may fail to meet thespecified ISO class designation. If the noncompliance iscaused by a single, nonrandom “outlier” value resulting from anerroneous measurement (due to procedural error or equip-ment malfunction) or from an unusually low particle concentra-tion (due to exceptionally clean air), the outlier may be ex-cluded from the calculation, provided that:
a) the calculation is repeated, including all remaining sam-pling locations;
b) at least three measurement values remain in the calcula-tion;
COPYRIGHTED MATERIAL LICENSED TO NASA (nasa.gov users) (G2222)(137.78.215.178) ON Friday, June 18, 2004 FOR LICENSEE'S USE ONLY. SINGLE USER LICENSE ONLY. COPYING ANDNETWORKING PROHIBITED DOCUMENT PROVIDED BY USAINFO.COM.
ISO 14644-1:1999(E) © ISO
8
c) no more than one measurement value is excluded from thecalculation;
d) the suspected cause of the erroneous measurement or lowparticle concentration is documented and accepted by both thecustomer and supplier.
NOTE Widely divergent values for particle concentrations amongthe locations sampled may be reasonable and even intentional,depending on the nature of the application of the clean installationunder test.
COPYRIGHTED MATERIAL LICENSED TO NASA (nasa.gov users) (G2222)(137.78.215.178) ON Friday, June 18, 2004 FOR LICENSEE'S USE ONLY. SINGLE USER LICENSE ONLY. COPYING ANDNETWORKING PROHIBITED DOCUMENT PROVIDED BY USAINFO.COM.

© ISO ISO 14644-1:1999(E)
9
Annex C(normative)
Statistical treatment of particle concentration data
C.1 RationaleThis statistical analysis considers only random errors (lack ofprecision), not errors of a nonrandom nature (e.g. bias associ-ated with erroneous calibration).
C.2 Algorithm for computation ofaverage particle concentration at alocation ( xi)When multiple samples are taken at a location, equation (C.1)shall be used to determine the average particle concentrationat the location. Calculation of the average particle concentra-tion shall be performed for each sampling location at which twoor more samples have been taken.
xx x x
nii i i n=
+ + +, , ,1 2 K(C.1)
where
xi is the average particle concentration at location i,representing any location.
xi,1 to xi,n are the particle concentrations of the indi-vidual samples.
n is the number of samples taken at location i.
C.3 Algorithms for computation of95% upper confidence limitC.3.1 PrincipleThis procedure is applicable only if the number of samplinglocations is more than one and less than ten. In such circum-stances, this procedure shall be used in addition to the algo-rithm of equation (C.1).
C.3.2 Overall mean of the averages ( x )Using equation (C.2), determine the overall (grand) mean ofthe averages.
xx x x
mi i i m=
+ + +( ), , ,1 2 K(C.2)
where
x is the overall mean of the location averages.
xi,1 to xi,m are individual location averages, determinedby using equation (C.1).
–
=
m is the number of individual location averages.
All individual location averages are equally weighted, regard-less of the number of samples taken at any given location.
C.3.3 Standard deviation of thelocation averages ( s)Using equation (C.3), determine the standard deviation of thelocation averages.
sx x x x x x
m
i i i m=
( ) + ( ) + + ( )( )
, , ,– – –
–
1
2
2
2 2
1
K(C.3)
where
s is the standard deviation of the location averages.
C.3.4 95% upper confidence limit (UCL)for the overall meanUsing equation (C.4), determine the 95% upper confidencelimit for the overall mean.
95 0 95% .UCL = +
x ts
m(C.4)
where
t0,95 represents the 95th percentile (quantile) of the tdistribution, with m–1 degrees of freedom.
Values of the Student’s t distribution (t0,95) for the 95% UCLare given in Table C.1. Alternatively, Student’s t distributionsprovided in statistical computer programmes are also accept-able.
Table C.1 — Student’s t distribution for the 95%upper confidence limit
forebmuNlaudividni
segareva(m) 2 3 4 5 6 9-7
t 3,6 9,2 4,2 1,2 0,2 9,1
=
–––––
– –
,
...
...
...
COPYRIGHTED MATERIAL LICENSED TO NASA (nasa.gov users) (G2222)(137.78.215.178) ON Friday, June 18, 2004 FOR LICENSEE'S USE ONLY. SINGLE USER LICENSE ONLY. COPYING ANDNETWORKING PROHIBITED DOCUMENT PROVIDED BY USAINFO.COM.
ISO 14644-1:1999(E) © ISO
10
Therefore the minimum number of sampling locations is nineand, as the number of sampling locations is less than ten, thecalculation of the 95% UCL according to annex C is applicable.
D.1.5The single sample volume, Vs , is calculated in litres in accor-dance with equation (B.2) (see B.4.2.1):
VCs
n m
= ×
= ×
=
201 000
203 517
1 000
5 69
,
, litres
(D.4)
The result is greater than 2 litres, and the sample volumeselected was 28 litres over a period of 1 min (a flow ratecommonly available in discrete-particle-counting light-scatter-ing instruments).
This selection was based on:
a) Vs >2 litres (see B.4.2.2)
b) Cn,m >20 particles/m3 (see B.4.2.1)
c) Sampling time ≥ 1 min (see B.4.2.2)
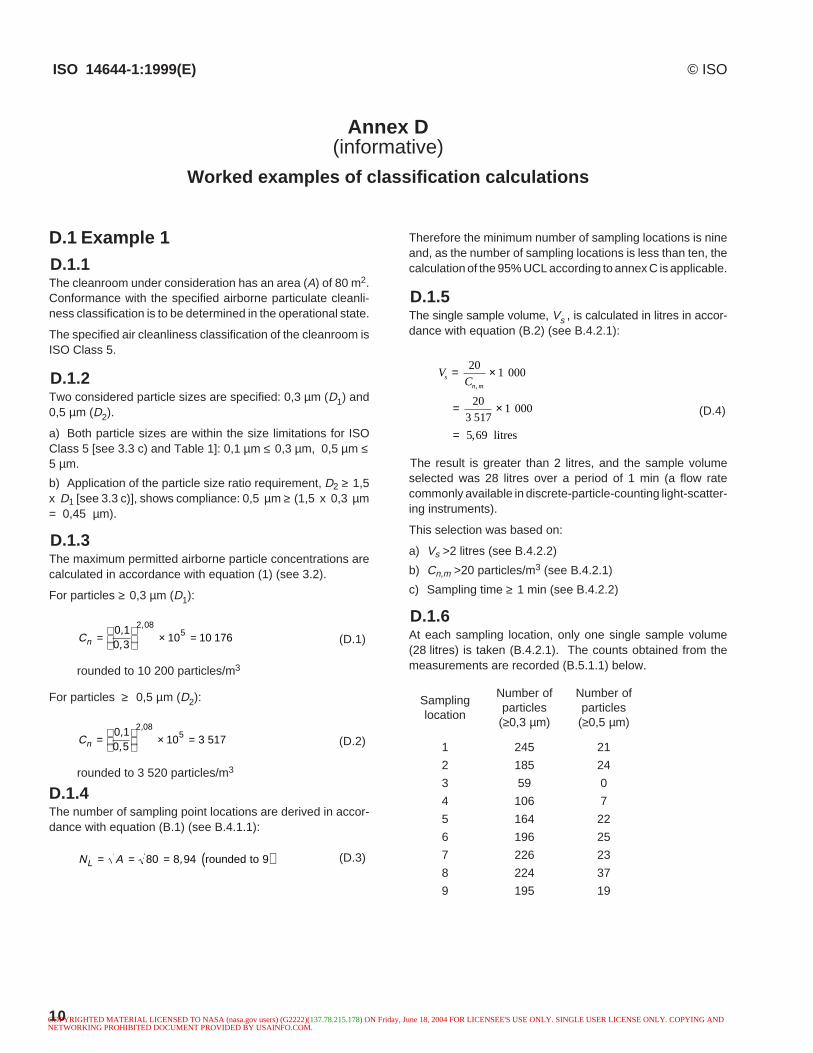
D.1.6At each sampling location, only one single sample volume(28 litres) is taken (B.4.2.1). The counts obtained from themeasurements are recorded (B.5.1.1) below.
Annex D(informative)
Worked examples of classification calculations
D.1 Example 1D.1.1The cleanroom under consideration has an area (A) of 80 m2.Conformance with the specified airborne particulate cleanli-ness classification is to be determined in the operational state.
The specified air cleanliness classification of the cleanroom isISO Class 5.
D.1.2Two considered particle sizes are specified: 0,3 µm (D1) and0,5 µm (D2).
a) Both particle sizes are within the size limitations for ISOClass 5 [see 3.3 c) and Table 1]: 0,1 µm ≤ 0,3 µm, 0,5 µm ≤5 µm.
b) Application of the particle size ratio requirement, D2 ≥ 1,5x D1 [see 3.3 c)], shows compliance: 0,5 µm ≥ (1,5 x 0,3 µm= 0,45 µm).
D.1.3The maximum permitted airborne particle concentrations arecalculated in accordance with equation (1) (see 3.2).
For particles ≥ 0,3 µm (D1):
Cn =
× =0 10 3
10 10 1762 08
5,,
,
(D.1)
rounded to 10 200 particles/m3
For particles ≥ 0,5 µm (D2):
Cn =
× =0 10 5
10 3 5172 08
5,,
,
(D.2)
rounded to 3 520 particles/m3
D.1.4The number of sampling point locations are derived in accor-dance with equation (B.1) (see B.4.1.1):
N AL = = = ( )80 8 94 9, rounded to (D.3)
gnilpmaSnoitacol
forebmuNselcitrap
(≥ 3,0 µ )m
forebmuNselcitrap
(≥ 5,0 µ )m
1
2
3
4
5
6
7
8
9
542
581
95
601
461
691
622
422
591
12
42
0
7
22
52
32
73
91
COPYRIGHTED MATERIAL LICENSED TO NASA (nasa.gov users) (G2222)(137.78.215.178) ON Friday, June 18, 2004 FOR LICENSEE'S USE ONLY. SINGLE USER LICENSE ONLY. COPYING ANDNETWORKING PROHIBITED DOCUMENT PROVIDED BY USAINFO.COM.

© ISO ISO 14644-1:1999(E)
11
D.1.7From the raw data (D.1.6), the number of particles per cubicmetre, xi , is calculated:
gnilpmaSnoitacol
xi ≥ 3,0 µm xi ≥ 5,0 µm
1
2
3
4
5
6
7
8
9
0578
7066
7012
6873
7585
0007
1708
0008
4696
057
758
0
052
687
398
128
1231
976
Each calculated concentration value for 0,3 µm and 0,5 µm isless than the limits established in D.1.3. This satisfies the firstpart of classification (B.6.1) and therefore calculation of the95% UCL according to annex C can proceed.
D.1.8Computation of average concentration in accordance withequation (C.1) (see C.2) is not applicable, as the samplevolumes taken were single volumes which represent an aver-age particle concentration at each location. The overall meansof the averages are calculated in accordance with equation(C.2) (see C.3.2).
For particles ≥ 0,3 µm:
19
8 750 6 607 2 107 3 786
5 857 7 000 8 071 8 000
6 964
+ + ++ + + ++
(D.5)
= 19 x 57 142
= 6 349,1 rounded to 6 349 particles/m3
For particles ≥ 0,5 µm:
19
750 857 0 250 786
893 821 1 321 679
+ + + ++ + + +
(D.6)
= x 6 357
= 706,3 rounded to 706 particles/m3
D.1.9The standard deviations of the location averages are calcu-lated in accordance with equation (C.3) (see C.3.3).
For particles ≥ 0,3 µm:
18
8 750 6 349 6 607 6 349
2 107 6 349 3 786 6 349
5 857 6 349 7 000 6 349
8 071 6 349 8 000 6 349
6 964 6 349
2 2
2 2
2 2
2 2
2
( ) ( )
( ) ( )
( ) ( )
( ) ( )
( )
− + −+ − + −+ − + −+ − + −
+ −
(D.7)
= 18 x 37 130 073
= 4 641 259,1 rounded to 4 641 259
s = 4˚641˚259 (D.8)
= 2 154,4 rounded to 2 154 particles/m3
For particles ≥ 0,5 µm:
18
750 706 857 706
0 706 250 706
786 706 893 706
821 706 1 321 706
679 706
2 2
2 2
2 2
2 2
2
( ) ( )
( ) ( )
( ) ( )
( ) ( )
( )
− + −+ − + −+ − + −+ − + −+ −
(D.9)
= 18 x 1 164 657
= 145 582,1 rounded to 145 582
s = 145˚582 (D.10)
= 381,6 rounded to 382 particles/m3
D.1.10The 95% upper confidence limits (UCL) are calculated inaccordance with equation (C.4) (see C.3.4). As the number ofindividual averages is m = 9, the t distribution taken fromTable C.1 is t = 1,9.
95% UCL 0,3 m
rounded to particles/m3
≥( ) = +
=
µ 6 349 1 92 154
9
7 713 2
7 713
,
, (D.11)
=
=
s2 =
19
x=
x=
s2 =
COPYRIGHTED MATERIAL LICENSED TO NASA (nasa.gov users) (G2222)(137.78.215.178) ON Friday, June 18, 2004 FOR LICENSEE'S USE ONLY. SINGLE USER LICENSE ONLY. COPYING ANDNETWORKING PROHIBITED DOCUMENT PROVIDED BY USAINFO.COM.
ISO 14644-1:1999(E) © ISO
12
95% UCL 0,5 m
rounded to 948 particles/m3
≥( ) = +
=
µ 706 1 9382
9
947 9
,
, (D.12)
D.1.11The interpretation of results is carried out according to B.6.1.In D.1.7, it was shown that the particle concentration of eachsingle sample volume is less than the specified class limits. InD.1.10, it was shown that the calculated values of the 95% UCLare also less than the class limits established in D.1.3.
Therefore the airborne particulate cleanliness of the clean-room meets the required classification.
D.2 Example 2D.2.1This example is constructed to show the influence of the 95%UCL calculations on the results.
A cleanroom is specified for a particulate cleanliness of ISOClass 3 in operation. The number of sampling locations hasbeen determined to be five. As the number of samplinglocations is more than one and less than ten, the calculation ofthe 95% UCL according to annex C is applicable.
Only one particle size (D ≥ 0,1 µm) is considered.
D.2.2The particle concentration limit for ISO Class 3 at ≥ 0,1 µm istaken from Table 1:
Cn (≥ 0,1 µm) = 1 000 particles/m3
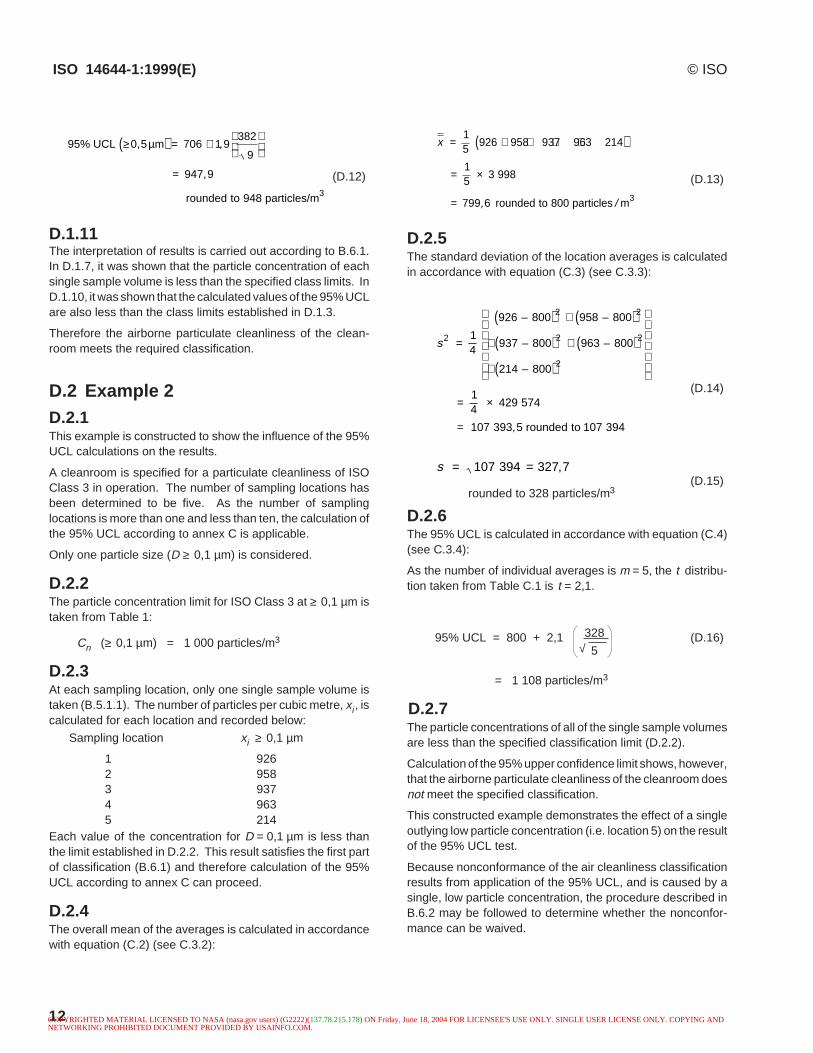
D.2.3At each sampling location, only one single sample volume istaken (B.5.1.1). The number of particles per cubic metre, xi , iscalculated for each location and recorded below:
Sampling location xi ≥ 0,1 µm
1 9262 9583 9374 9635 214
Each value of the concentration for D = 0,1 µm is less thanthe limit established in D.2.2. This result satisfies the first partof classification (B.6.1) and therefore calculation of the 95%UCL according to annex C can proceed.
D.2.4The overall mean of the averages is calculated in accordancewith equation (C.2) (see C.3.2):
x = + + + +( )
= ×
=
15
926 958 937 963 214
15
3 998
799 6 800 3, /rounded to particles m
(D.13)
D.2.5The standard deviation of the location averages is calculatedin accordance with equation (C.3) (see C.3.3):
s2
2 2
2 2
2
14
926 800 958 800
937 800 963 800
214 800
14
429 574
107 393 5 107 394
=
( ) + ( )+ ( ) + ( )+ ( )
= ×
=
– –
– –
–
, rounded to
(D.14)
s = =107 394 327 7,(D.15)
rounded to 328 particles/m3
D.2.6The 95% UCL is calculated in accordance with equation (C.4)(see C.3.4):
As the number of individual averages is m = 5, the t distribu-tion taken from Table C.1 is t = 2,1.
95% UCL = 800 + 2,1 (D.16)
= 1 108 particles/m3
D.2.7The particle concentrations of all of the single sample volumesare less than the specified classification limit (D.2.2).
Calculation of the 95% upper confidence limit shows, however,that the airborne particulate cleanliness of the cleanroom doesnot meet the specified classification.
This constructed example demonstrates the effect of a singleoutlying low particle concentration (i.e. location 5) on the resultof the 95% UCL test.
Because nonconformance of the air cleanliness classificationresults from application of the 95% UCL, and is caused by asingle, low particle concentration, the procedure described inB.6.2 may be followed to determine whether the nonconfor-mance can be waived.
328
5√
COPYRIGHTED MATERIAL LICENSED TO NASA (nasa.gov users) (G2222)(137.78.215.178) ON Friday, June 18, 2004 FOR LICENSEE'S USE ONLY. SINGLE USER LICENSE ONLY. COPYING ANDNETWORKING PROHIBITED DOCUMENT PROVIDED BY USAINFO.COM.
© ISO ISO 14644-1:1999(E)
13
Annex E(informative)
Considerations for the counting and sizing of particles outsidethe size range applicable for classification
E.1 PrincipleIn some situations, typically those related to specific processrequirements, alternative levels of air cleanliness may bespecified on the basis of particle populations that are not withinthe size range applicable to classification. The maximumpermitted concentration of such particles and the choice of testmethod to verify compliance are matters for agreement be-tween the customer and the supplier. Considerations for testmethods and prescribed formats for specification are givenin E.2 (for U descriptors) and E.3 (for M descriptors).
E.2 Consideration of particles smallerthan 0,1 µm (ultrafine particles) —U descriptorE.2.1. ApplicationIf contamination risks caused by particles smaller than 0,1 µmare to be assessed, sampling devices and measurementprocedures appropriate to the specific characteristics of suchparticles should be employed.
The number of sampling locations should be established inaccordance with B.4.1 and the minimum sample volume Vsshould be 2 litres (B.4.2.2).
E.2.2 U descriptor formatThe ultrafine particle concentration of the U descriptor may beused alone or as a supplement to the airborne particulatecleanliness class. The U descriptor is expressed in the format
“U (x; y)”, where
x is the maximum permitted concentration of ultrafineparticles (expressed as ultrafine particles per cubicmetre of air);
y is the size in micrometres at which the applicablediscrete-particle counter counts such particles with50% counting efficiency.
EXAMPLE To express a maximum permitted ultrafine particleconcentration of 140 000 particles/m3 in the particle size range ≥ 0,01µm, the designation would be: “U (140 000; 0,01 µm)”.
NOTE 1 Suitable methods of test for concentrations of airborneparticles smaller than 0,1 µm are given in IEST-G-CC1002 [1].
NOTE 2 If the U descriptor designation is used as a supplement toan airborne particulate cleanliness class, the ultrafine particle concen-tration (x) should be not less than the particle concentration limit
(particles per cubic metre) applicable to the considered size of 0,1 µmfor the specified ISO class.
E.3 Consideration of particles largerthan 5 µm (macroparticles) —M descriptorE.3.1 ApplicationIf contamination risks caused by particles larger than 5 µm areto be assessed, sampling devices and measurement proce-dures appropriate to the specific characteristics of such parti-cles should be employed.
As particle liberation within the process environment normallydominates the macroparticle fraction of the airborne particlepopulation, the identification of an appropriate sampling deviceand measurement procedure should be addressed on anapplication-specific basis. Factors such as the density, shape,volume, and aerodynamic behaviour of the particles need to betaken into account. Also, it may be necessary to put specialemphasis on specific components of the total airborne popula-tion, such as fibres.
E.3.2 M descriptor formatThe M descriptor may be specified independently or as asupplement to the ISO classes of airborne particulate cleanli-ness. The M descriptor is expressed in the format
“M (a; b); c ”, where
a is the maximum permitted concentration ofmacroparticles (expressed as macroparticles percubic metre of air);
b is the equivalent diameter (or diameters) associ-ated with the specified method for measuringmacroparticles (expressed in micrometres);
c is the specified measurement method.
NOTE 1 If the population of airborne particles being sampledcontains fibres, they may be accounted for by supplementing the Mdescriptor with a separate descriptor for fibres, having the format “Mfibre(a; b); c”.
EXAMPLE 1 To express an airborne particle concentration of 10 000particles/m3 in the particle size range of >5 µm based on the use of atime-of-flight aerosol particle counter to determine the aerodynamicdiameter of the particles, the designation would be:
“M (10 000; >5 µm); time-of-flight aerosol particle counter”.
COPYRIGHTED MATERIAL LICENSED TO NASA (nasa.gov users) (G2222)(137.78.215.178) ON Friday, June 18, 2004 FOR LICENSEE'S USE ONLY. SINGLE USER LICENSE ONLY. COPYING ANDNETWORKING PROHIBITED DOCUMENT PROVIDED BY USAINFO.COM.

ISO 14644-1:1999(E) © ISO
14
EXAMPLE 2 To express an airborne particle concentration of 1 000particles/m3 in the particle size range of 10 to 20 µm, based on the useof a cascade impactor followed by microscopic sizing and counting, thedesignation would be:
“M (1 000; 10 µm to 20 µm); cascade impactor followed by microscopicsizing and counting”.
NOTE 2 Suitable methods of test for concentrations of airborneparticles larger than 5 µm are given in IEST-G-CC1003 [2].
NOTE 3 If the M descriptor designation is used as a supplement toan airborne particulate cleanliness class, the macroparticle concentra-tion (a) should be not greater than the particle concentration limit(particles per cubic metre) applicable to the considered size of 5 µm forthe specified ISO class.
COPYRIGHTED MATERIAL LICENSED TO NASA (nasa.gov users) (G2222)(137.78.215.178) ON Friday, June 18, 2004 FOR LICENSEE'S USE ONLY. SINGLE USER LICENSE ONLY. COPYING ANDNETWORKING PROHIBITED DOCUMENT PROVIDED BY USAINFO.COM.
© ISO ISO 14664-1:1999(E)
15
Annex F(informative)
Sequential sampling procedure
F.1 Background and limitations
F.1.1 Background
If the air being sampled is significantly more or significantlyless contaminated than the specified class concentrationlimit for the considered particle size, use of the sequentialsampling procedure can reduce sample volumes andsampling times, often dramatically. Some savings mayalso be realized when the concentration is near thespecified limit. Sequential sampling is most appropriatewhen air cleanliness is expected to quality as ISO Class 4or cleaner.
NOTE For further information on sequential sampling, seeIEST-G-CC1004 [3].
F.1.2 Limitations
The principal limitations of sequential sampling are:
a) The procedure is only applicable to sampling aimed ata total of 20 particles per measurement, for particles of theconsidered size at the specified class or concentrationlimit.
b) Each sample measurement requires supplementarymonitoring and data analysis, which can be facilitatedthrough computerized automation.
c) Particle concentrations are not determined as
precisely as with conventional sampling procedures, due tothe reduced sample volume
F.2 Basis for the procedure
The procedure is based on comparison of real-timecumulative particle counts to reference count values.Reference values are derived from equations for upper andlower limit boundaries:
Upper limit: C = 3,96 + 1,03 E (F.1)
Lower limit: C = - 3,96 + 1,03 E (F.2)
where
C is the observed count;
E is the expected count.
To facilitate comparisons, helpful references have beenprovided in the form of a graph, Figure F.1, and in tabularform as Table F.1. Either format may be used.
As air is being sampled at each designated location, the run-ning total particle count is continuously compared to referencecount limits which are a function of the proportion of the pre-scribed total volume that has been sampled. If the runningtotal count is less than the lower reference count limit corre-sponding to the volume that has been sampled, the air being
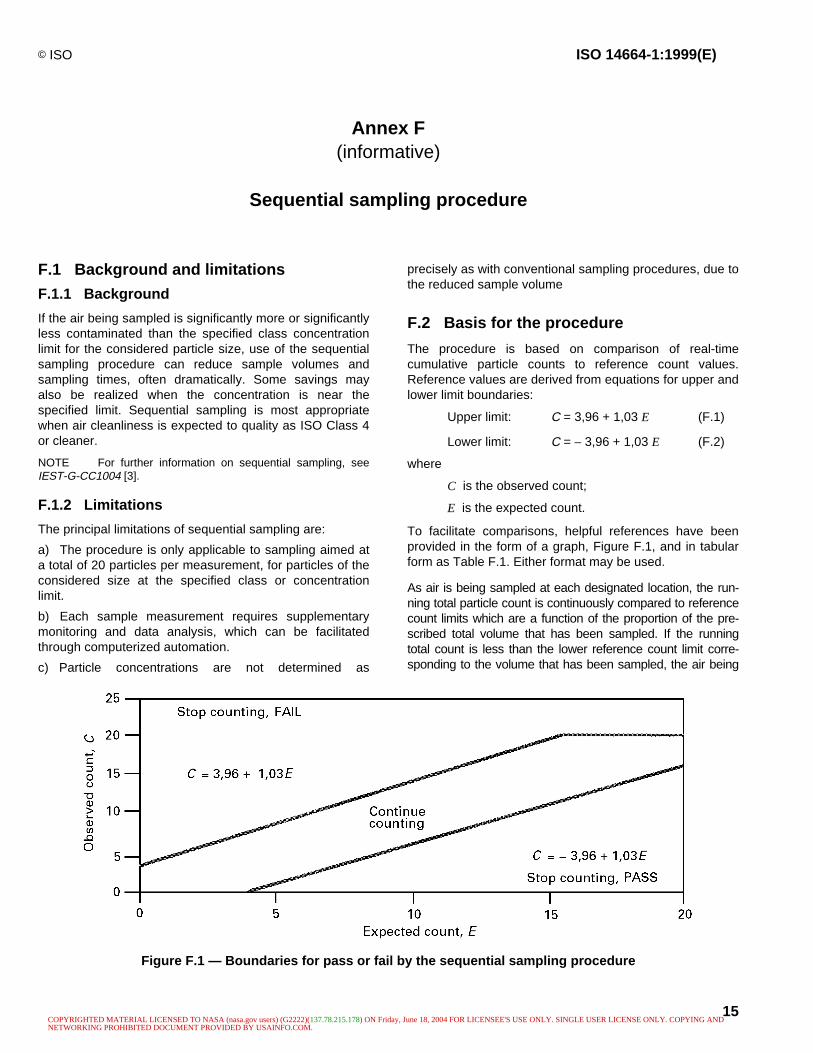
Figure F.1 — Boundaries for pass or fail by the sequential sampling procedure
COPYRIGHTED MATERIAL LICENSED TO NASA (nasa.gov users) (G2222)(137.78.215.178) ON Friday, June 18, 2004 FOR LICENSEE'S USE ONLY. SINGLE USER LICENSE ONLY. COPYING ANDNETWORKING PROHIBITED DOCUMENT PROVIDED BY USAINFO.COM.
ISO 14644-1:1999(E) © ISO
16
Observed Count
456789
101112131415161718192021
Fractional time, t
0,192 20,240 70,289 30,337 80,386 40,434 90,483 40,532 00,580 50,629 10,667 60,726 20,774 70,823 30,871 80,920 30,968 91,000 0
Observed Count
0123456789
1011121314151617
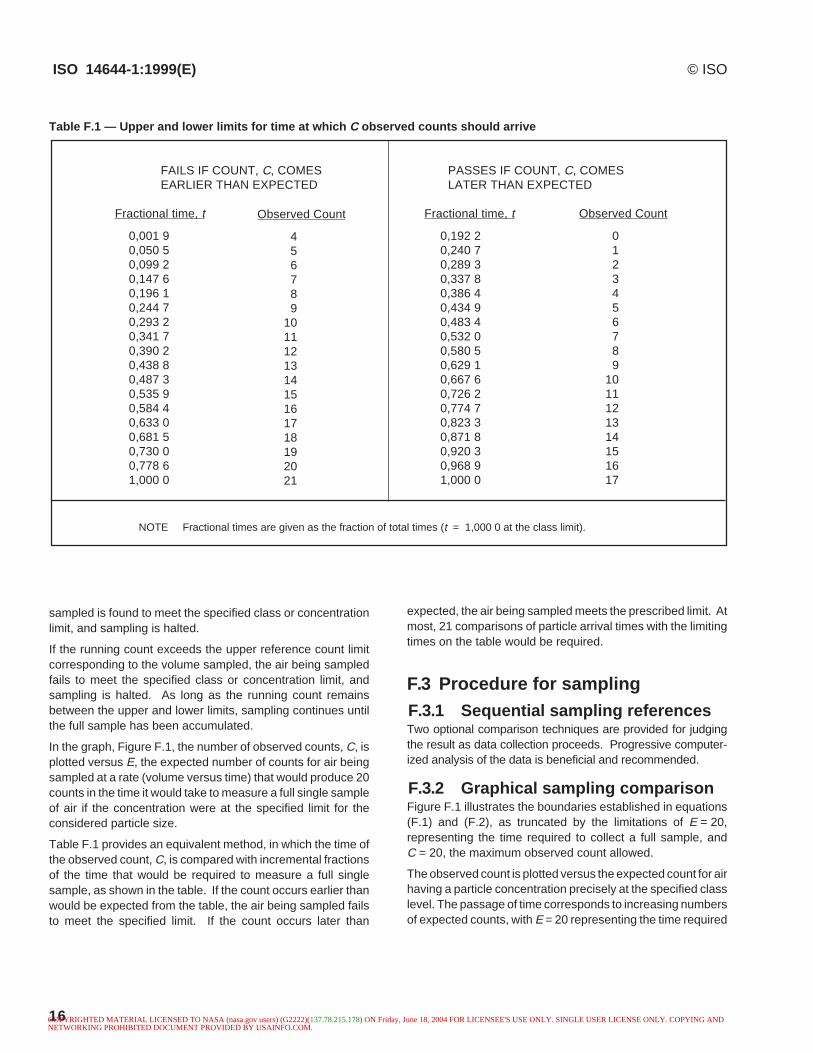
NOTE Fractional times are given as the fraction of total times (t = 1,000 0 at the class limit).
Table F.1 — Upper and lower limits for time at which C observed counts should arrive
FAILS IF COUNT, C, COMES PASSES IF COUNT, C, COMESEARLIER THAN EXPECTED LATER THAN EXPECTED
Fractional time, t
0,001 90,050 50,099 20,147 60,196 10,244 70,293 20,341 70,390 20,438 80,487 30,535 90,584 40,633 00,681 50,730 00,778 61,000 0
expected, the air being sampled meets the prescribed limit. Atmost, 21 comparisons of particle arrival times with the limitingtimes on the table would be required.
F.3 Procedure for samplingF.3.1 Sequential sampling referencesTwo optional comparison techniques are provided for judgingthe result as data collection proceeds. Progressive computer-ized analysis of the data is beneficial and recommended.
F.3.2 Graphical sampling comparisonFigure F.1 illustrates the boundaries established in equations(F.1) and (F.2), as truncated by the limitations of E = 20,representing the time required to collect a full sample, andC = 20, the maximum observed count allowed.
The observed count is plotted versus the expected count for airhaving a particle concentration precisely at the specified classlevel. The passage of time corresponds to increasing numbersof expected counts, with E = 20 representing the time required
sampled is found to meet the specified class or concentrationlimit, and sampling is halted.
If the running count exceeds the upper reference count limitcorresponding to the volume sampled, the air being sampledfails to meet the specified class or concentration limit, andsampling is halted. As long as the running count remainsbetween the upper and lower limits, sampling continues untilthe full sample has been accumulated.
In the graph, Figure F.1, the number of observed counts, C, isplotted versus E, the expected number of counts for air beingsampled at a rate (volume versus time) that would produce 20counts in the time it would take to measure a full single sampleof air if the concentration were at the specified limit for theconsidered particle size.
Table F.1 provides an equivalent method, in which the time ofthe observed count, C, is compared with incremental fractionsof the time that would be required to measure a full singlesample, as shown in the table. If the count occurs earlier thanwould be expected from the table, the air being sampled failsto meet the specified limit. If the count occurs later than
COPYRIGHTED MATERIAL LICENSED TO NASA (nasa.gov users) (G2222)(137.78.215.178) ON Friday, June 18, 2004 FOR LICENSEE'S USE ONLY. SINGLE USER LICENSE ONLY. COPYING ANDNETWORKING PROHIBITED DOCUMENT PROVIDED BY USAINFO.COM.
© ISO ISO 14644-1:1999(E)
17
to accumulate a full sample volume if the particle concentrationwere at the class limit.
The procedure for sequential sampling using Figure F.1 is asfollows:
As sampling proceeds, record the number of particles countedas a function of time, and compare the count with the upper andlower limit lines of Figure F.1. If the cumulative observed countcrosses the upper line, sampling at the location is stopped andthe air is reported to have failed compliance with the specifiedclass limit. If the cumulative observed count crosses the lowerline, sampling is stopped and the air passes the specified classlimit. If the cumulative observed count remains between theupper and lower lines, sampling will continue.
If the total count is 20 or less at the end of the prescribedsampling period and has not crossed the upper line, the air isjudged to have complied with the class limit.
F.3.3 Tabular sampling comparisonTable F.1 provides an equivalent method for use with sequen-tial sampling, also based on equations (F.1) and (F.2). Thetime, t, on the table is assigned a value of “1,000 0” to representthe duration of a complete single sample. The volume of thissample is the volume necessary to provide 20 particles, if theair contains precisely the class limit equivalent concentration ofparticles of the considered size. The time values listed in thetable are the fractional portions of the total time required foraccumulation of the entire single sample.
The procedure for sequential sampling using Table F.1 is asfollows:
As sampling proceeds, record the number of particles countedas a function of time, and compare the time at which each countis observed with the times shown in the two columns of thetable. If a given cumulative observed count occurs earlier thanexpected, as indicated by comparison with the left-hand col-umn, sampling is stopped and the air is reported to have failedcompliance with the specified class limit. If the cumulativeobserved count occurs later than expected, as indicated bycomparison with the right-hand column, sampling is stoppedand the air is reported to be in compliance with the specifiedlimit. If the cumulative observed count continuously arrivesbetween the times shown in the two columns, sampling willcontinue. If counting continues through 21 comparisons withthe left-hand column and no count arrives earlier than itsexpected time, the air passes the specified limit for a full singlesample.
COPYRIGHTED MATERIAL LICENSED TO NASA (nasa.gov users) (G2222)(137.78.215.178) ON Friday, June 18, 2004 FOR LICENSEE'S USE ONLY. SINGLE USER LICENSE ONLY. COPYING ANDNETWORKING PROHIBITED DOCUMENT PROVIDED BY USAINFO.COM.
ISO 14644-1:1999(E) © ISO
18
Bibliography
[1] IEST-G-CC1002, Determination of the Concentra-tion of Airborne Ultrafine Particles. Mount Prospect, Illinois:Institute of Environmental Sciences and Technology (1999)
[2] IEST-G-CC1003, Measurement of AirborneMacroparticles. Mount Prospect, Illinois: Institute of Environ-mental Sciences and Technology (1999)
[3] IEST-G-CC1004, Sequential Sampling Plan for Usein Classification of the Particulate Cleanliness of Air in Clean-rooms and Clean Zones. Mount Prospect, Illinois: Institute ofEnvironmental Sciences and Technology (1999)
COPYRIGHTED MATERIAL LICENSED TO NASA (nasa.gov users) (G2222)(137.78.215.178) ON Friday, June 18, 2004 FOR LICENSEE'S USE ONLY. SINGLE USER LICENSE ONLY. COPYING ANDNETWORKING PROHIBITED DOCUMENT PROVIDED BY USAINFO.COM.
COPYRIGHTED MATERIAL LICENSED TO NASA (nasa.gov users) (G2222)(137.78.215.178) ON Friday, June 18, 2004 FOR LICENSEE'S USE ONLY. SINGLE USER LICENSE ONLY. COPYING ANDNETWORKING PROHIBITED DOCUMENT PROVIDED BY USAINFO.COM.
ISO 14644-1:1999(E) © ISO
ICS 13.040.30
Price based on 18 pages
COPYRIGHTED MATERIAL LICENSED TO NASA (nasa.gov users) (G2222)(137.78.215.178) ON Friday, June 18, 2004 FOR LICENSEE'S USE ONLY. SINGLE USER LICENSE ONLY. COPYING ANDNETWORKING PROHIBITED DOCUMENT PROVIDED BY USAINFO.COM.