Embed Size (px)
Citation preview

ISM Business SurveysEconomic Growth in 2006
ISM Business SurveysEconomic Growth in 2006
Presented by
Norbert Ore, C.P.M.
February 23, 2006
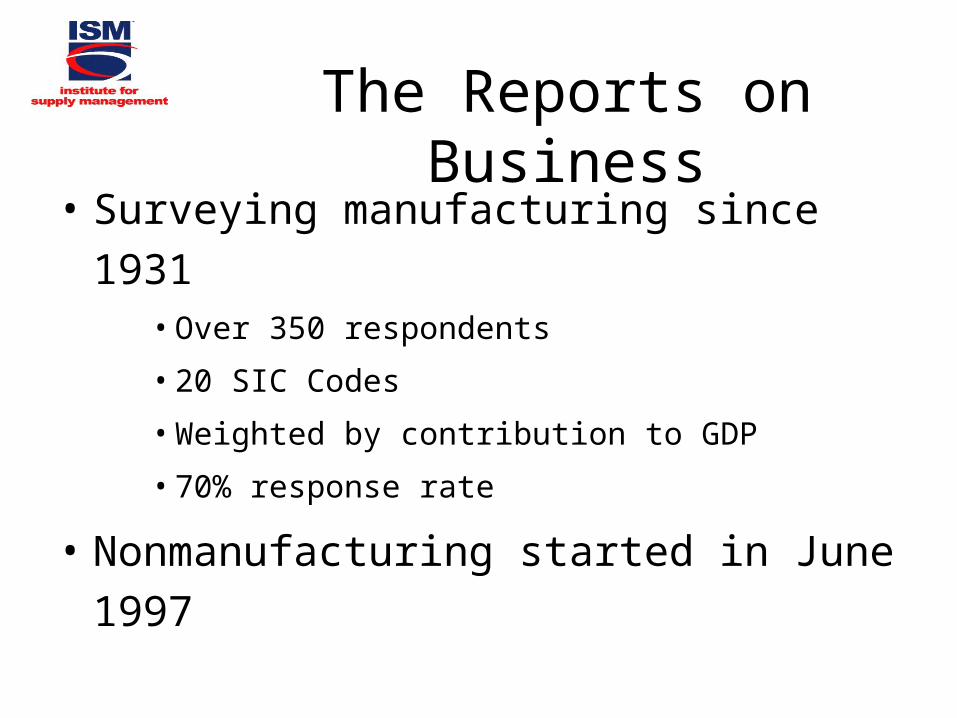
The Reports on Business• Surveying manufacturing since 1931
• Over 350 respondents
• 20 SIC Codes
• Weighted by contribution to GDP
• 70% response rate
• Nonmanufacturing started in June 1997

The Reports on Business• A series of diffusion indexes measuring
change from month to month
• Above 50% indicates growth
• Below 50% indicates contraction
• 50% is the breakeven or “no change”

Basic Economics
The Rate of UP is DOWN
50 %
The Rate of DOWN is UP
50 %

Composition of GDP
Governmentspending - 19%
CapitalSpending -16%
ConsumerSpending -70
Other - 5%

Composition of Consumer Spending (PCE*)
* Personal Consumption Expenditures
Durable Goods- 12%
Nondurablegoods - 29%
Services - 59%

http://www.ism.ws/ISMReport/JPMorgan

http://www.chinawuliu.com.cn/english/index.asp


Manufacturing PMI - 54.8 Non-manufacturing BAI - 56.8
January 2006
30
35
40
45
50
55
60
65
70
75
Jan-
03
Mar
-03
May
-03
Jul-0
3
Sep-0
3
Nov-0
3
Jan-
04
Mar
-04
May
-04
Jul-0
4
Sep-0
4
Nov-0
4
Jan-
05
Mar
-05
May
-05
Jul-0
5
Sep-0
5
Nov-0
5
Jan-
06
Mar
-06
May
-06
Jul-0
6
PMI BAI

Manufacturing New Orders January 2006 Index: 58.0
30
35
40
45
50
55
60
65
70
75
Jan-
03
Apr-0
3
Jul-0
3
Oct-03
Jan-
04
Apr-0
4
Jul-0
4
Oct-04
Jan-
05
Apr-0
5
Jul-0
5
Oct-05
Jan-
06
Apr-0
6
Jul-0
6
New Orders 3 Month Moving Avg

Manufacturing Production January 2006 Index: 56.6
30
35
40
45
50
55
60
65
70
75
Jan-
03
Apr-0
3
Jul-0
3
Oct-03
Jan-
04
Apr-0
4
Jul-0
4
Oct-04
Jan-
05
Apr-0
5
Jul-0
5
Oct-05
Jan-
06
Apr-0
6
Jul-0
6
Production 3 Month Moving Avg
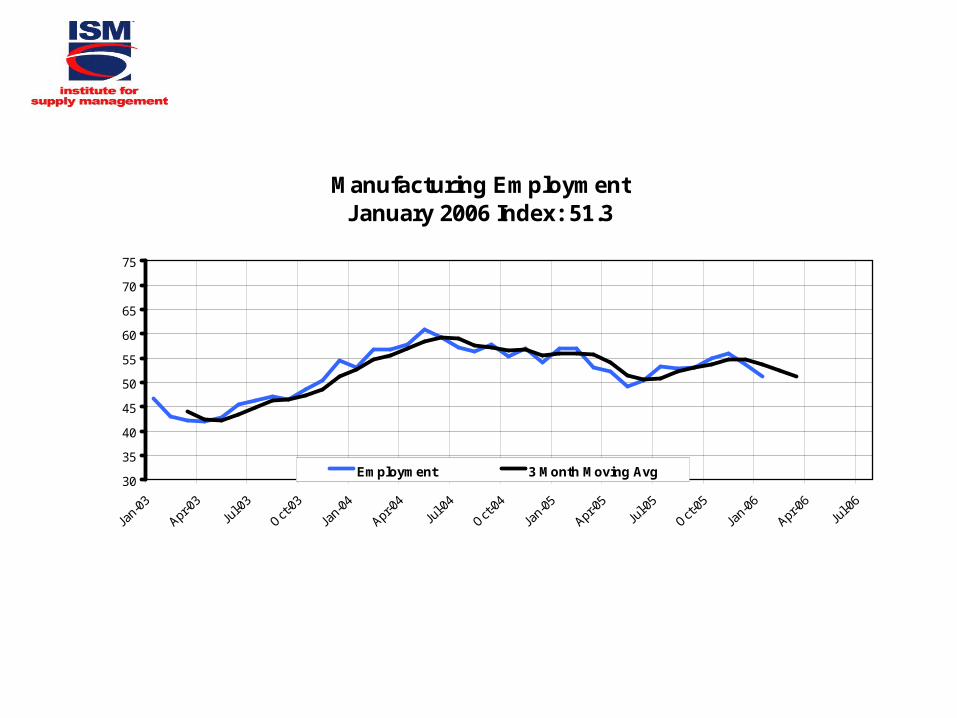
Manufacturing EmploymentJanuary 2006 Index: 51.3
30
35
40
45
50
55
60
65
70
75
Jan-
03
Apr-0
3
Jul-0
3
Oct-03
Jan-
04
Apr-0
4
Jul-0
4
Oct-04
Jan-
05
Apr-0
5
Jul-0
5
Oct-05
Jan-
06
Apr-0
6
Jul-0
6
Employment 3 Month Moving Avg

Manufacturing New Orders - Inventories January 2006: +11.5
0
5
10
15
20
25
May
-03
Jul-0
3
Sep-0
3
Nov-0
3
Jan-
04
Mar
-04
May
-04
Jul-0
4
Sep-0
4
Nov-0
4
Jan-
05
Mar
-05
May
-05
Jul-0
5
Sep-0
5
Nov-0
5
Jan-
06
Mar
-06
May
-06
Jul-0
6
New Orders - Inventories
The rate of growth of new orders is currently faster than the rate of growth of inventories. The recent trend is that new order growth has significantly outpaced inventories
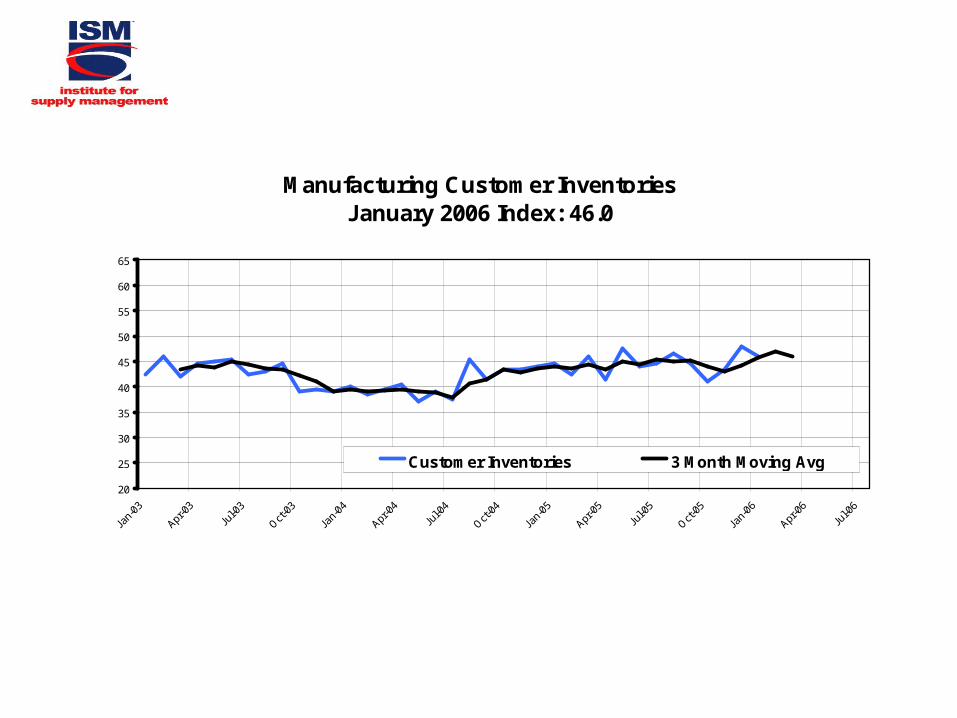
Manufacturing Customer Inventories January 2006 Index: 46.0
20
25
30
35
40
45
50
55
60
65
Jan-
03
Apr-0
3
Jul-0
3
Oct-03
Jan-
04
Apr-0
4
Jul-0
4
Oct-04
Jan-
05
Apr-0
5
Jul-0
5
Oct-05
Jan-
06
Apr-0
6
Jul-0
6
Customer Inventories 3 Month Moving Avg

Manufacturing PricesJanuary 2006 Index: 65.0
30
40
50
60
70
80
90
Jan-
03
Apr-0
3
Jul-0
3
Oct-03
Jan-
04
Apr-0
4
Jul-0
4
Oct-04
Jan-
05
Apr-0
5
Jul-0
5
Oct-05
Jan-
06
Apr-0
6
Jul-0
6
Prices 3 Month Moving Avg
Peak at 88.0 in April
Hurricane Katrina8/22/05
Hurricane Rita 9/21/05

Manufacturing Backlog of OrdersJanuary 2006 Index: 53.5
30
35
40
45
50
55
60
65
70
75
Jan-
03
Apr-0
3
Jul-0
3
Oct-03
Jan-
04
Apr-0
4
Jul-0
4
Oct-04
Jan-
05
Apr-0
5
Jul-0
5
Oct-05
Jan-
06
Apr-0
6
Jul-0
6
Backlog of Orders 3 Month Moving Avg

Manufacturing New Export OrdersJanuary 2006 Index: 58.5
30
35
40
45
50
55
60
65
70
75
Jan-
03
Apr-0
3
Jul-0
3
Oct-03
Jan-
04
Apr-0
4
Jul-0
4
Oct-04
Jan-
05
Apr-0
5
Jul-0
5
Oct-05
Jan-
06
Apr-0
6
Jul-0
6
New Export Orders 3 Month Moving Avg

0604020098
80
70
60
50
40
30
80
70
60
50
40
30
Diff
usio
n In
dex D
iffusion Ind
ex
High-Tech PMI vs. Overall PMI(Seasonally Adjusted)
HIGH-TECH PMI MFG. PMI
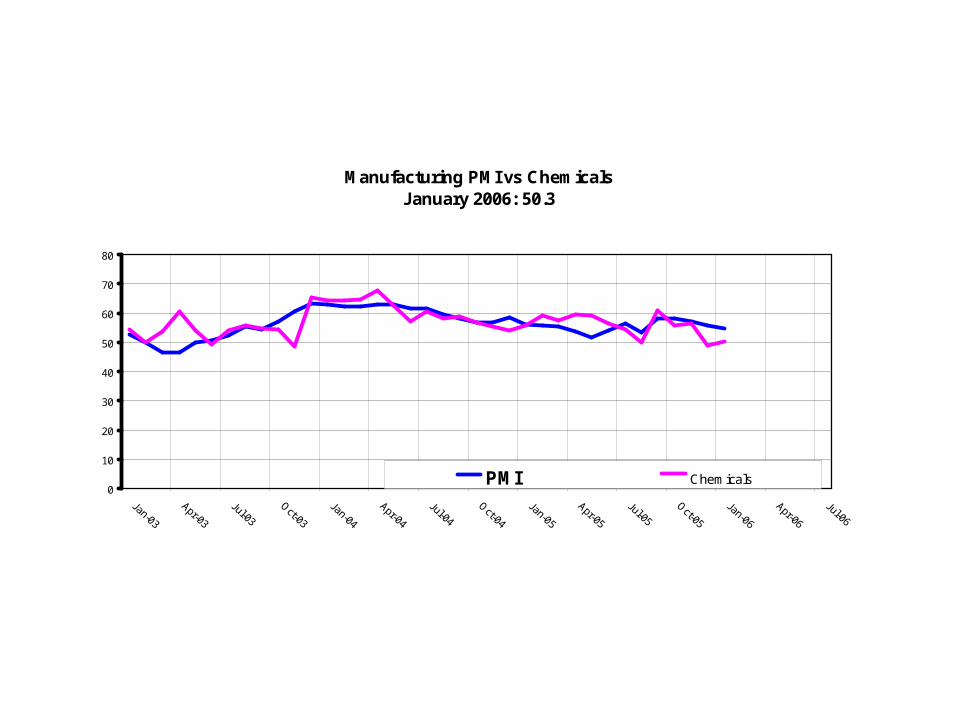
Manufacturing PMI vs ChemicalsJanuary 2006: 50.3
0
10
20
30
40
50
60
70
80
Jan-03
Apr-03
Jul-03
Oct-03
Jan-04
Apr-04
Jul-04
Oct-04
Jan-05
Apr-05
Jul-05
Oct-05
Jan-06
Apr-06
Jul-06
PMI Chemicals

Manufacturing PMI vs Printing & Publishing January 2006: 50.0
0
10
20
30
40
50
60
70
Jan-03 Apr-03 Jul-03 Oct-03 Jan-04 Apr-04 Jul-04 Oct-04 Jan-05 Apr-05 Jul-05 Oct-05 Jan-06 Apr-06 Jul-06
PMI Printing
`

Manufacturing PMI vs Paper January 2006: 48.3
0
10
20
30
40
50
60
70
80
Jan-03 Apr-03 Jul-03 Oct-03 Jan-04 Apr-04 Jul-04 Oct-04 Jan-05 Apr-05 Jul-05 Oct-05 Jan-06 Apr-06 Jul-06
PMI Paper
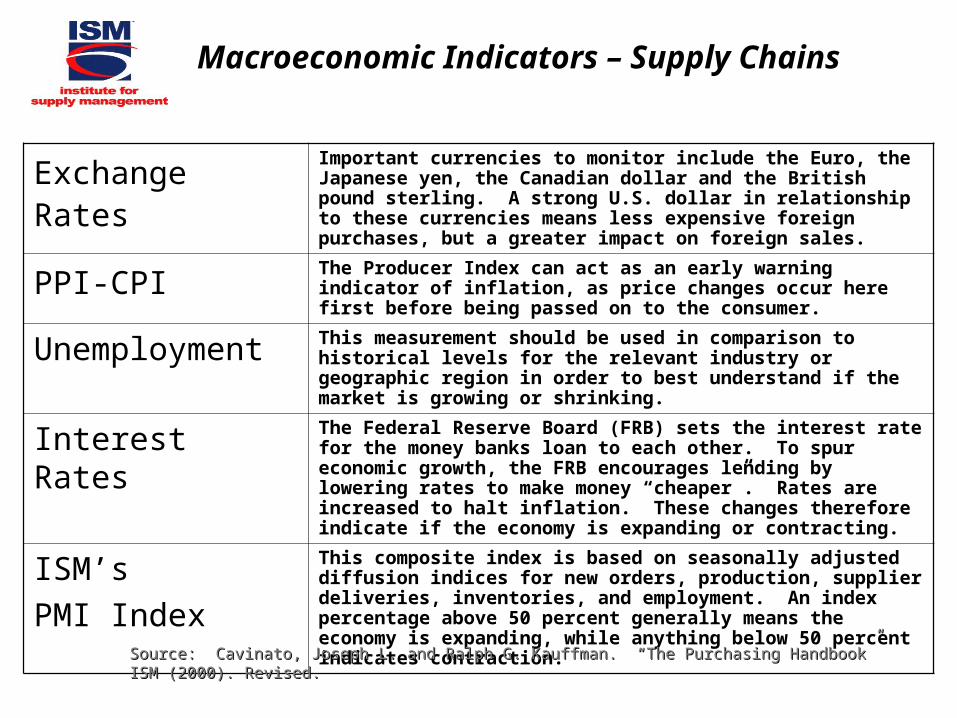
Macroeconomic Indicators – Supply Chains
Exchange RatesImportant currencies to monitor include the Euro, the Japanese yen, the Canadian dollar and the British pound sterling. A strong U.S. dollar in relationship to these currencies means less expensive foreign purchases, but a greater impact on foreign sales.
PPI-CPIThe Producer Index can act as an early warning indicator of inflation, as price changes occur here first before being passed on to the consumer.
Unemployment This measurement should be used in comparison to historical levels for the relevant industry or geographic region in order to best understand if the market is growing or shrinking.
Interest Rates The Federal Reserve Board (FRB) sets the interest rate for the money banks loan to each other. To spur economic growth, the FRB encourages lending by lowering rates to make money “cheaper”. Rates are increased to halt inflation. These changes therefore indicate if the economy is expanding or contracting.
ISM’s
PMI Index
This composite index is based on seasonally adjusted diffusion indices for new orders, production, supplier deliveries, inventories, and employment. An index percentage above 50 percent generally means the economy is expanding, while anything below 50 percent indicates contraction.
Source: Cavinato, Joseph L. and Ralph G. Kauffman. “The Purchasing Handbook” ISM (2000). Source: Cavinato, Joseph L. and Ralph G. Kauffman. “The Purchasing Handbook” ISM (2000). Revised.Revised.
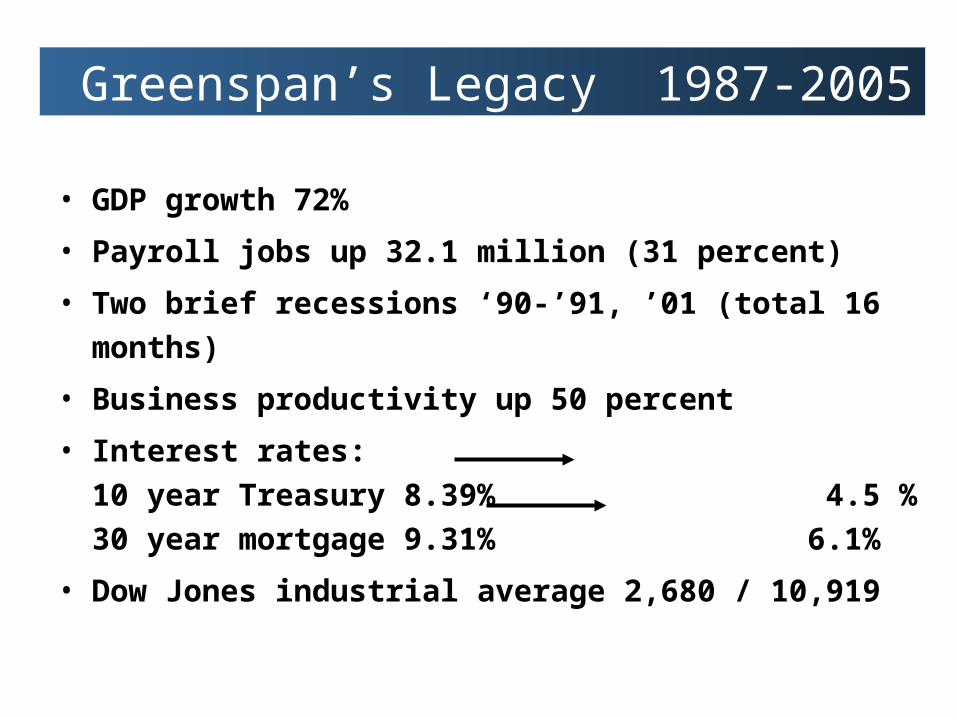
• GDP growth 72%
• Payroll jobs up 32.1 million (31 percent)
• Two brief recessions ‘90-’91, ’01 (total 16 months)
• Business productivity up 50 percent
• Interest rates:10 year Treasury 8.39% 4.5 %30 year mortgage 9.31% 6.1%
• Dow Jones industrial average 2,680 / 10,919
Greenspan’s Legacy 1987-2005

Environmental Factors
• Business is investing
• Employment is accelerating
• Capacity in primary manufacturing
• Fed almost finished
• Exchange rates favorable to export