Embed Size (px)
Citation preview
2012
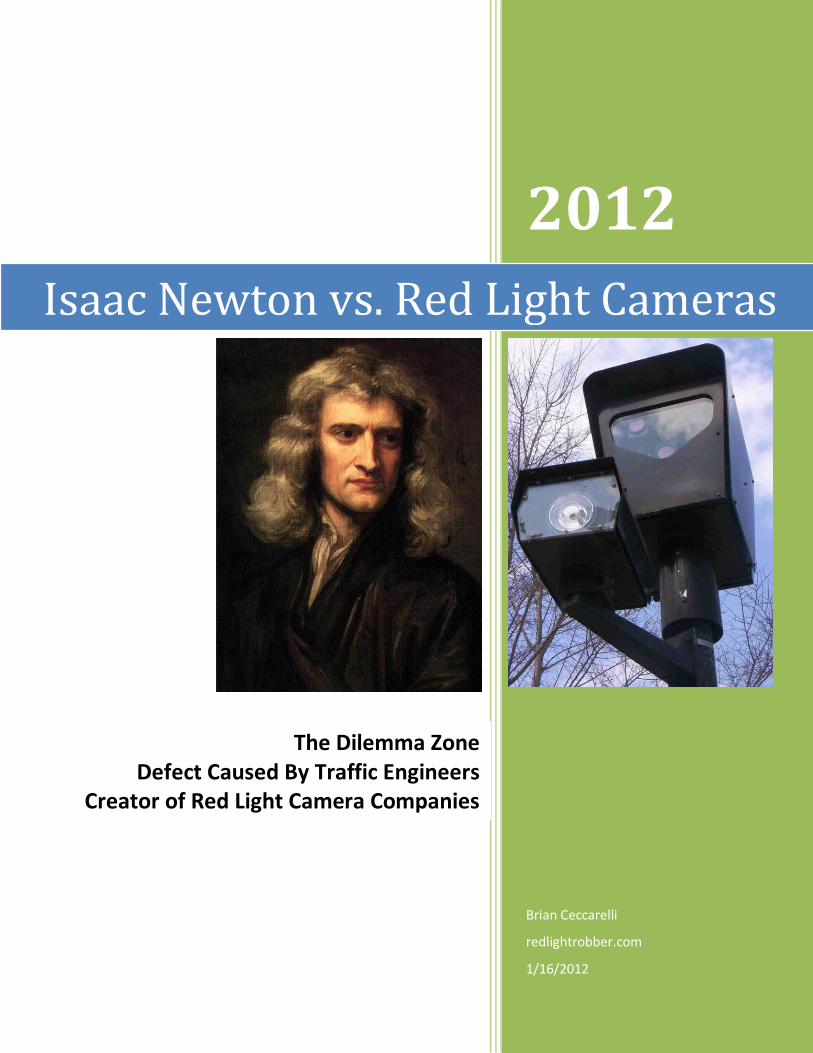
Brian Ceccarelli
redlightrobber.com
1/16/2012
Isaac Newton vs. Red Light Cameras
The Dilemma Zone Defect Caused By Traffic Engineers
Creator of Red Light Camera Companies
2
Table of Contents
Dilemma Zone Defined .......................................................................................... 3
The Federal Highway Administration (FHWA) ..................................................... 3
The Institute of Transportation Engineers (ITE) .................................................. 3
Dilemma Zone -- an Engineering Defect ................................................................. 4
Yellow Light Defined .............................................................................................. 5
ITE Yellow Light Interval Equation Defined............................................................. 6
Definition by Words ............................................................................................ 6
Definition by Math6 ............................................................................................ 6
Safe Braking Distance—Expression of Newton’s Law of Motion ............................ 7
ITE Yellow Light Equation – Not Totally Arbitrary ................................................... 7
The Name “The Yellow Light Interval Equation” – One Possible Name ............... 8
Yellow Duration Shortened - Repercussions .......................................................... 9
Omission of Safe Braking Distance Line -- Repercussions ..................................... 11
Solutions .............................................................................................................. 13
Best Way ........................................................................................................... 14
Compromise ..................................................................................................... 15
Conclusion ........................................................................................................... 16
References ........................................................................................................... 17

3
Dilemma Zone Defined
The Federal Highway Administration (FHWA)
The area in which it may be difficult for a driver to decide whether to stop or proceed through the intersection at the onset of the yellow signal indication. It is also referred to as the “option zone” or the “zone of indecision.”1 The FHWA is talking about a type II dilemma zone.
There is also the worse type I dilemma zone2, 4. A type I dilemma zone is a region of the road where if the driver is in it at the time the light turns yellow, the driver neither can stop safely nor proceed at the approach speed without running a red light. In this case the yellow is so short that it confronts the driver with an unsolvable decision problem7. There is no solution.
The Institute of Transportation Engineers (ITE)
The dilemma zone is a space between two points on an approach to a signalized intersection, generally defined as beginning at a point where approaching drivers—when shown a yellow display—will stop at the stop line of the intersection and ending where drivers—again, when shown a yellow display—will proceed through the intersection before the red indication is displayed. Between these two points, drivers are in a dilemma as to whether to stop or proceed. Some will decide to stop and others continue on. An abrupt stop may cause a rear-end crash and failing to stop may cause a right-angle crash.3 ITE is referring to a type II dilemma zone.

4
Dilemma Zone -- an Engineering Defect
Most DOTs and organizations like the National Motorist Association know that
traffic engineers must set the yellow light interval to that computed by ITE’s
equation. By setting the yellow light interval to that equation, DOT’s give the
yellow light interval the bare bones minimum time that it takes for the type I
dilemma zone go away.2, 4 A type I dilemma zone is a region on the road where
the engineer confronts the driver with an unsolvable decision problem. No
matter whether the driver decides to go or to stop, the engineer forces the driver
to run a red light.
Most DOTs in the world use ITE’s equation as their formal spec. But what they
don’t know is that this same ITE equation, not only requires that traffic engineers
set the yellow light interval correctly, but also requires that traffic engineers
disclose the safe braking distance line to the driver. Without disclosing the safe
braking distance line to the driver, DOTs create a type II dilemma zone.
A type II dilemma zone is a region on the road where although the solution of
whether to stop or to go is possible [no type I dilemma zone], it is still not clear to
the driver what that solution is.
A correctly set yellow light interval works only when engineers implement it in
tandem with full disclosure of the safe braking distance. This tandem
requirement comes directly from Newton’s Laws of Motion, Newton’s Laws of
Motion being embedded in ITE’s equation. Traffic engineers need to paint a line
on the approach to every signalized intersection indicating the location of the safe
braking distance. The need to do this is just as important as the need to set the
yellow interval correctly.
Without disclosure of the safe braking distance line, the engineer forces the
driver, upon seeing a light turn yellow, to guess whether to stop or to proceed.
This guess creates the “zone of indecision”—the dilemma zone—a type II
dilemma zone.
5
Traffic engineers have the deadly habit of misapplying ITE’s yellow light equation
to turn lanes and to two close-by intersections. By misapplying ITE’s equation,
engineers automatically create a type I dilemma zone. Unimpeded drivers going
the maximum allowable speed, who have passed the critical distance for their
speed, need up to twice as much yellow to slow down in order to initiate their
turn or to avoid running into obstacles on the far side of the intersection.
ITE’s equation only provides enough time for driver going the maximum allowable
speed. It does handle a slowing down driver who is not slowing down to a
stop. The inventor of the yellow light equation, Denos Gazis4, never intended
for a traffic engineer to use his equation for turn lanes. In his paper, “The
Problem of the Amber Light Signal in Traffic Flow, Gazis clearly means for his
equation to be used for straight-thru movement only. Gazis mentions that
turning cars are a different problem, and not covered by his equation.
Traffic engineers also add insult to injury by making turn yellows even shorter
than ITE’s equation. That act only increases the type I dilemma zone. Traffic
engineers do not understand ITE’s yellow light equation. Instead of a setting
the yellow longer to allow drivers to slow down from the maximum allowable
speed, engineers shorten the yellow because they feel cars are going slower the
speed limit. They do not understand that slowing down, with no intention of
stopping, requires more time, not less. By shorting the yellow, engineers
covertly forbid drivers from approaching the intersection at the maximum
allowable legal speed. Engineers force such drivers to run red lights.
Yellow Light Defined
Prerequisite: Place a line at the safe braking distance from the intersection.
1. When the driver sees the light turn yellow and he has not yet crossed the line, he must stop. The light will be red by the time the driver gets to the intersection. If he goes, then he will run a red light and possibly cause a T-bone collision.

6
2. If the driver has already crossed the line when light turns yellow, the driver
must go. The light will still be yellow when the driver gets to the intersection. If the driver tries to stop, he may cause a rear-end collision.
3. If the driver is on the line when the light turns yellow, the driver must stop. The yellow will turn red the instant the driver gets to the intersection. If the driver goes, he will run the red light but he will traverse the intersection within the all-red interval. He will be safe.
ITE Yellow Light Interval Equation Defined
The yellow light interval equals the time it takes for a driver to perceive the light
turning from green to yellow plus the time it takes for a driver to traverse the safe
braking distance at the speed limit.5
Definition by Words
[ ]
Definition by Math6
[
]
[
]

7
Where:
tp = perception time in seconds v = speed limit in ft/s a = safe deceleration of car in ft/s2
G = Acceleration due to Earth’s gravity (32.2 ft/s2) g = grade of the road in %/100, downhill is negative grade
Safe Braking Distance—Expression of Newton’s Law of Motion
[
]
To see a formal math derivation of the safe braking distance equation from Newton’s Laws of Motion, see Derivation of the Yellow Light Equation, Red Light Robber, http://redlightrobber.com/red/links_pdf/Derivation.pdf.
ITE Yellow Light Equation – Not Totally Arbitrary
This spec incorporates the immutable Newton’s Laws of Motion. Half of the
spec computes the yellow time. The other half computes the safe braking
distance. The safe braking distance derivation is an exact expression of a higher
law that governs the universe. It is as important to the formula as the yellow
time itself. But traffic engineers choose to implement only the yellow time half,
not the safe braking distance half. By your DOT not implementing the full spec,
your DOT violates the higher law and establishes conditions that force drivers to
run red lights.
In order for drivers to obey the spec, the driver needs for traffic engineers to
disclose the exact location of the safe braking distance:

8
[
]
Which in tandem requires traffic engineers to set the yellow light interval to:
Setting Y but not disclosing Sb is like requiring a cook to bake bread for 20 minutes
but not telling the cook at what temperate to cook it. The repercussions of
badly cooked bread are raw dough or burnt crust. The repercussions of badly
cooked intersections are rampant red light running, rear-enders and T-bone
crashes.
The Name “The Yellow Light Interval Equation” – One Possible Name
The name “The Yellow Light Interval Equation” can be redubbed the “The Safe
Braking Distance Line Equation”:
where the traffic engineer paints a line at Sb from the intersection. It is equally
valid. Traffic engineers did not consider refactoring the polynomial. Actually
the real problem with traffic engineers (and this is a truthful statement not a
sarcastic one) is that traffic engineers do not know physics.
Physics is the science of expressing reality in terms of math. It is reality to math.
Not math to reality. ITE’s equation demonstrates the latter: capricious math
forced upon Nature, and thus rejected. A physicist sees ITE’s equation and
says, “Aside from ITE’s equation never working because it is not an equation of
motion, ITE’s equation still demands me to set the yellow light interval to Y and
tell the driver the location of the safe braking distance Sb. But even when I do all
that, that equation still creates a type II dilemma zone for cars travelling slower

9
than the speed limit inside the safe braking region when the light turns to yellow.
The equation will always cause problems.”
A traffic engineer sees ITE’s equation and says, “I will set the yellow light interval
to Y only for straight-thru lanes. I’ll use a different standard, the MUTCD 3
second minimum, for left turn lanes. I’ll give those left-turning cars 3 seconds
even when the straight-thru cars get 4.5 seconds. Law of Momentum? What’s
that? Safe braking distance line? What‘s that? By the way, there is this
awful dilemma zone which has been causing red light running, crashes and deaths
for decades. We don’t know what causes all this, but look at all our efforts to
curtail its effects.”
In total frustration of seeing cars running red lights and crashing, town councils
and sheriffs follow up with, “We’ll put up some red light cameras. Those will
make Newton’s Laws of Motion go away.”
Yellow Duration Shortened - Repercussions
When the traffic engineer does this,
[
]
he sets the yellow interval to a length less than the equation requires, and in so
doing violates Newton’s Laws of Motion and creates a type I dilemma zone.
Since tp and v are constants, the traffic engineer cuts into the safe braking
distance. The driver no longer has enough distance within which to stop his
car. The driver must go through the intersection. The traffic engineer forces
drivers to run red lights.

10
Everyone has heard of cities shortening the yellow light durations, but few
understand how reprehensible that is. There is a tremendous penalty for the
engineer’s crime of violating the immutable Laws of the Universe. Mother
Nature does not take kindly to being violated. By looking at the red light
camera data, you will see that shortening Y even so much as a mere ½ second,
more than quadruples the number of red light runners. Just a ½ second mistake
puts millions of people in harm’s way.
Many people accuse cities of intentionally shortening yellow lights. While I am
sure some cities do so once seeing all the money a short yellow pulls in, I believe
that most cities initially are not aware of their preexisting short yellows. At
first cities are only aware that they have problems at certain intersections—that
certain intersections have far more accidents and have more people running red
lights. Cities place their cameras at these intersections.
It seems to never cross a city’s mind that problem intersections are caused by
engineers. Cities rather believe that thousands of drivers spontaneously get a
suicide complex at their problem intersections, willfully run its red light, and then
by the time they get to the next intersection, gain their sanity again. By
accusing drivers of behavior disorders, cities enact the solution of enforcement.
Sheriffs get behind this idea because the only thing they know is enforcement.
Cities install cameras to penalize drivers. Cities penalize in an attempt to affect
positive change in the drivers’ behavior.
But once the red light camera data comes in, cities find that driver behavior hasn’t
changed. People are still running reds as usual. Cities do not understand that
the problem must lay elsewhere. Given the traffic signal plans for those
problem intersections, one immediately discovers that these problem
intersections have specific and rather obvious engineering defects. The disparity
of red light running statistics from one intersection to the next makes it obvious.
At the top of the failure list is a type I dilemma zone. Next on the list is the type
II dilemma zone. The type II dilemma zone is on every list.

11
Once the cameras are up and collecting the money, as my colleague Barnet Fagel
the Ticket Doctor puts it, the cameras become like cocaine. The income is
addictive. Cities will not take the cameras down. Cities will not even use the
camera data to help their engineers because helping their engineers would mean
less revenue. On top of that, many cities like Cary have a tiered contract with
their symbiotic traffic camera company. The more tickets Cary issues, the
higher percentage of money Cary keeps. It profits Cary to keep traffic
engineers in the dark.
Omission of Safe Braking Distance Line -- Repercussions
I bet until now you never heard about the safe braking distance line. After all
none of us has ever seen one. Am I fussing about nothing? We all seem to
have been getting along just fine without such a line these past decades.
Or have we?
Why do people run red lights? Why do accidents happen? Even though most
people never witness crashes, crashes do happen at a rate of several dozen at
each intersection each year. Why are crashes so frequent and why at every
intersection?
It is the outcome of the presence of a dilemma zone.
Even when traffic engineers set the yellow correctly, there is still a tremendous
amount of people running red lights. Setting the yellow “correctly” leaves no
margin of error—the traffic engineer expects the human brain to be a computer.
If you believe your Town Council, a Town Council that supports red light cameras,
then you believe everyone in the city, and I mean everyone, intentionally runs
reds lights. You believe that everyone in the city drives like the Dukes of
Hazzard.
I have told you that violating the Laws of Motion causes reprehensible
consequences. I have told you that a yellow ½ second shorter than that

12
required by ITE’s equation more than quadruples the number of the people
running reds. Well. Quadruples from what? It quadruples from the number
of people running red lights due to the type II dilemma zone that same equation
creates.
Even when DOTs set yellows to the ITE spec, there is still a steady stream of cars
running red lights. A shorter yellow is a case of worse on top of bad. Bring
the yellow up to spec, one removes the worse, but the bad is still there.
Dilemma zone II is still present.
By omitting the safe braking distance line, the traffic engineer forces you to guess.
How good a guesser are you? The farther away from the intersection you are,
the easier it is to know you must stop. The closer to the intersection you are,
the easier it is to know you must go. But somewhere in the middle, you really
don’t know whether you have the distance to stop or the time to go.
Imagine you are driving into Cary, North Carolina. It is Spring. The pear trees
are spiked with white flowers, the scent of freshly blooming magnolias waft in the
air. You are exiting off Highway 1 onto the Cary Parkway. You turn west onto
Cary Parkway. You approach High Meadows Drive.
Reality strikes. You see the photo-enforced sign. There’s a camera there.
The pressure is on.
Do you know how far back 194.5 ft is from the intersection’s stop line?
The light turns yellow. You are 195.0 ft from the intersection. You are not
sure whether to go or stop. You guess to go. Oops! Wrong guess. You
were really 6 inches farther from the intersection than the DOT’s secret safe
braking distance line when the light turned yellow. You ran the light by 1/10th
of a second. Ticket for you.
This scenario, this single scenario, guarantees those red light camera companies a
steady income. 99.9999% of all red light running on properly yellow-timed
intersections are fraction of a second violations. All these puny little violations

13
are the result of a guess forced upon you by the traffic engineer, because the
traffic engineer failed to disclose the safe braking distance.
Some people may not guess as well as you. They may decide to go even from
farther back, perhaps even from 217.8 ft—which is what they could do if Cary was
a city in California. In that case, by the time they get to the intersection, not
only would the light be red but also cross traffic would have a green light.
Oops! T-Bone crash.
Some people are old. Take an old granny who is overly cautious. But on this
particular day, granny is going the speed limit, not her usual 5 mph. She is 100
ft from the intersection when the light turns yellow. Like most people, she
believes the yellow light means brake. But she is within the safe braking
distance and should go. But being the granny she is, she does not want to take
the chance of running the red light. She slams on the brakes. Oops!
Rear-end crash. The duration of the yellow interval is half the time it takes for
her to stop. No one can stop their car within the time the light is yellow.
Granny doesn’t know that. Hardly anybody knows that.
The fraction of a second violation, the rear-ender and the T-bone crash: they
are all products of a dilemma zone.
Solutions
To remove the dilemma zone; a.k.a., zone of indecision, remove the decision.
Instead of forcing drivers to guess what they have to do, just tell them what they
have to do.
There are two ways to remove the decision. There’s the best way, and there’s
a compromise.

14
Best Way
Instead of ITE’s equation, use the following equation:
[
]
Now Y is the time it takes you to perceive the light change and brake to a stop.
If DOTs set the yellow light interval to this solution, drivers always have the
option to brake. Drivers no longer have to guess between two opposing actions.
Graceful braking is always a possibility. Even when the driver is too close to
the intersection, the worse he can do is gracefully slow down and glide through
the intersection on a yellow.
This solution covers all possibilities. This solution covers the case where the
driver is within the safe braking distance, but going slower than the speed limit.
If the light turns yellow, he can still gracefully brake and never get penalized.
This solution is the easiest to implement. DOTs only have to increase the yellow
light durations by 1 – 3 seconds depending on the speed limit. DOTs don’t
have to get out a can of paint.
After the DOT implements this solution, then DMVs must education drivers on
what a yellow light means. This time DMVs could actually explain what a yellow
light means.
The biggest complaint from traffic engineers about this solution is that drivers
have too much yellow. Traffic engineers believe that drivers will just treat the
yellow light as if it means go. My rebuttal is, “Even now that is what your yellow
means.”

15
The reason why this solution is the best solution, and I would add the only
solution, is because the solution is an equation of motion. As opposed to ITE’s
equation which tries to impose reality, this equation actually describes reality.
Compromise
The compromise is the solution I have been mentioning from the beginning.
Make DOTs paint a line at the safe braking distance. This implies that DOTs keep
ITE’s equation.
The painted line works when cars are travelling at the speed limit on the entire
approach to the intersection.
There are a couple of show stoppers to this solution:
1. Painting a crucial line on the road on the approach to the intersection may
distract a driver’s attention away from the intersection.
2. Crucial lines on the road are not easily visible in bad weather or at night.
Watching for a light only is much easier and much more reliable.
3. Lines eventually wear off.
4. This solution does not address the case when a driver is travelling slower
than the speed limit within the safe braking distance when the light turns
yellow. This situation still requires the driver to guess whether to stop or
go. Therefore this solution does not make the dilemma zone go away.
5. The possibility of two opposing actions (stop or go) still exists.

16
Conclusion
Not in their wildest dreams do people ever consider that their DOT, the
organization responsible for vehicular motion in the State, does not understand
the Laws of Motion. But the raw data from the red light cameras show exactly
that. That data points a solid finger at the physics incompetence of traffic
engineers.
Cities need desperately to trust their own Department of Transportation. It is
awful that they cannot. It is psychologically more comforting and definitely
more lucrative for cities to point a finger at drivers rather than face this
inconvenient truth. You can actually thank the red light camera companies for
revealing the truth, although they do their best to keep this a secret..
If we remove all the engineering defects, we should see perhaps one red light
runner per intersection per month. That’s right, 1 perhaps 2 per month.
Right now we see hundreds of runners per month. Sometimes thousands. Are
we to be satisfied when we get the numbers down from 1000 to 50 runners per
month? To 30? How about 20? Is this a game of the Price is Right where
lower numbers are acceptable and higher numbers are not? The only
acceptable number of cars running a red light is 0. 0 is acceptable. Anything
else is not. We are talking about human beings, not jelly beans. We are
playing Russian roulette, not rummy. Engineers must stop systemically loading
the guns. Short yellow light = Type I Dilemma Zone = 3 bullets. Type II
Dilemma Zone = 1 bullet. The occasional drunk driver is bad enough.
17
References
1Engineering Countermeasures to Reduce Red-Light Running, Publication FHWA-SA-10-005, USDOT, FHWA, November 2009, p. 6. 2 The Dilemma with Dilemma Zones, Dr. Tom Urbanik, The University of Tennessee; Peter Koonce, Associate Engineer, Kittelson and Associates 3 Traffic Engineering Handbook, 6th Edition, Publication TB-010B, Institute of Transportation Engineers, 2010, p. 424.
4 The Problem of the Amber Signal Light in Traffic Flow, Denos Gazis, GM Research Labs, 1959 5 Determining Vehicle Signal Change and Clearance Intervals, ITE Technical Council Task Force 4TF-1, Institute of Transportation Engineers, 1994, p. 3
6 Traffic Engineering Handbook, 6th Edition, Publication TB-010B, Institute of Transportation Engineers, 2010, p. 412. The basic equation is found in every State, Federal and International Department of Transportation’s signals manual. The “2” in the denominator is the give-away. The equation originated with the Traffic Engineering Handbook, 3rd Edition, Institute of Traffic Engineers, 1965, p. 407. Here are some examples: 6Traffic Signal Timing Manual, Publication FHWA-HOP-08-024, Federal Highway
Administration, 2008, p. 138
6 Intelligent Traffic Signal Systems Unit Design Manual, North Carolina Department of Transportation, 2009, Standard 5.2.2, Sheet 4 of 4 6Caltrans Traffic Manual, California Depart of Transportation, Table 4D-102
6Signal Policy and Guidelines, Oregon Department of Transportation, 2009,
Appendix K
7 The Problem with the Amber Signal Light in Traffic Flow, Gazis, Herman &
Maradudin, GM Research Laboratories, 1959, p. 113