Embed Size (px)
Citation preview

Is Your ALM System Lying to You? What Ever Happened to Interest Rate Reward?
Philip M. Nussbaum, Chairman
PT Capital Partners
LBA CFO Conference | Baton Rouge, LA | May 21, 2015

© 2015 PT Capital Partners. All Rights Reserved. Is Your ALM System Lying to You? 2
ALM is not simply a compliance exercise. We don’t call it ALC.
Measuring the risk vs. reward of assets and liabilities individually
and in combinations across a range of interest rate scenarios.
Measuring the trade-off between short-term and longer-term income.
Generating and quantifying potential profitability enhancement strategies.
What is Asset/Liability Management?

Goals For Today’s Talk
Recognize that:
1. Traditional asset liability metrics have significant shortcomings in measuring risk versus reward
2. These shortcomings can be eliminated through a relatively small analytical adjustment
3. The benefit of making this adjustment is potentially significant
4. Core deposit assumptions are a really big deal when determining economic value, especially the average life assumptions of those that are truly core

© 2015 PT Capital Partners. All Rights Reserved. Is Your ALM System Lying to You? 4
Everything should be made as simple as it can be,
but not simpler.
ALBERT EINSTEIN THEORETICAL PHYSICIST

© 2015 PT Capital Partners. All Rights Reserved. Is Your ALM System Lying to You? 5
Today, the industry is largely oversimplifying and undervaluing ALM
This oversimplification is leading to less than optimal decisions
These less than optimal decisions are costing significant dollars
The Cost of Oversimplifying

© 2015 PT Capital Partners. All Rights Reserved. Is Your ALM System Lying to You? 6
We model risk and reward separately, not versus one another
We oversimplify A/L management, robbing the process of much value
An examiner’s A/L worldview is necessarily different than a banker’s
Core deposits are often incorrectly measured as shorter than they are
In general, A/L management is not highly valued
Problems with the Current State of
Asset/Liability Management

© 2015 PT Capital Partners. All Rights Reserved. Is Your ALM System Lying to You? 7
We model risk and reward separately, not versus one another
We oversimplify A/L management, robbing the process of much value
An examiner’s A/L worldview is necessarily different than a banker’s
Core deposits are often incorrectly measured as shorter than they are
In general, A/L management is not highly valued
Problems with the Current State of
Asset/Liability Management

© 2015 PT Capital Partners. All Rights Reserved. Is Your ALM System Lying to You? 8
Brief History of ALM
GAP
Reporting Income Simulation Economic Value
Measures the expected
re-pricing and/or
maturities of assets
and liabilities and
compare the net
position over time
Measures the impact of
instantaneous rate
shocks on the net
interest margin over a
horizon (one year, two
years, three years)
Measures the impact of
instantaneous rate
shocks on rate sensitive
assets and liabilities on
a present value basis
SHORT-TERM REWARD LONG-TERM RISK

© 2015 PT Capital Partners. All Rights Reserved. Is Your ALM System Lying to You? 9
Are you asset sensitive as your net interest income simulation indicates?
-200 -100 Base 100 200 300 400
Net Interest Income
Net Interest Income Measures Short-Term Reward

© 2015 PT Capital Partners. All Rights Reserved. Is Your ALM System Lying to You? 10
Are you asset sensitive as your net interest income simulation indicates?
OR
Are you liability sensitive as your economic value simulation indicates?
-200 -100 Base 100 200 300 400 -200 -100 Base 100 200 300 400
Net Interest Income Economic Value
Economic Value Measures Long-Term Risk

© 2015 PT Capital Partners. All Rights Reserved. Is Your ALM System Lying to You? 11
This makes it very difficult to measure the trade-off between risk
and reward. As risk is increased by one unit, is reward increased
by one unit, two units, or maybe only one half of a unit?
We Model Risk and Reward on Separate Scales
RISK REWARD

© 2015 PT Capital Partners. All Rights Reserved. Is Your ALM System Lying to You? 12
Bonds
We Model Risk and Reward on Separate Scales
DURATION
YIELD

© 2015 PT Capital Partners. All Rights Reserved. Is Your ALM System Lying to You? 13
Economic
Value
(EV)
Income
Simulation
ALM
We Model Risk and Reward on Separate Scales

© 2015 PT Capital Partners. All Rights Reserved. Is Your ALM System Lying to You? 14
AND
NOT Risk AND Reward
We Should Not Model Risk and Reward
on Separate Scales
RISK REWARD

© 2015 PT Capital Partners. All Rights Reserved. Is Your ALM System Lying to You? 15
RISK
REWARD
But rather Risk VERSUS Reward
We Should Model Risk and Reward on One Scale
Investors should measure RISK vs REWARD to make objective decisions.

© 2015 PT Capital Partners. All Rights Reserved. Is Your ALM System Lying to You? 16
1-Year Income Simulation
Cash flow 4
Cash flow 1
Cash flow 2
Cash flow 3
Time Zero Year 1
Short-term Income
What about this portion of the cash flow?
WE
IGNORE
THEM!

© 2015 PT Capital Partners. All Rights Reserved. Is Your ALM System Lying to You? 17
Economic Value (“EV”)
Time Zero
Cash flow 4
Cash flow 1
Cash flow 2
Cash flow 3

© 2015 PT Capital Partners. All Rights Reserved. Is Your ALM System Lying to You? 18
Economic Value (“EV”)
Present Value (different rate scenarios)
Cash flow 4
Cash flow 1
Cash flow 2
Cash flow 3
What’s the
problem with
EV?
Time Zero
How is income
over time
incorporated? IT IS NOT!

© 2015 PT Capital Partners. All Rights Reserved. Is Your ALM System Lying to You? 19
Scenario-Based Total Return
Time Zero Horizon
Cash flow 4
Cash flow 1
Cash flow 2
Cash flow 3
Short-term
Income PV of Future Income + = Total Return
Income
Simulation + Economic Value = Total Return

© 2015 PT Capital Partners. All Rights Reserved. Is Your ALM System Lying to You? 20
Income Simulation and Economic Value Example
Asset #3
5-Year Maturity
3.15% Coupon at Par
Callable after 2 years
Asset #2
5-Year Maturity
3.00% Coupon at Par
Non-callable
Asset #1
2-Year Maturity
1.50% Coupon at Par
Non-callable

© 2015 PT Capital Partners. All Rights Reserved. Is Your ALM System Lying to You? 21
Net Interest Income
2-Year Income Simulation Example
20,000
30,000
40,000
50,000
60,000
70,000
-400 -300 -200 -100 0 100 200 300 400
2 Yr @ 1.5% 30,000 30,000 30,000 30,000 30,000 30,000 30,000 30,000 30,000
5 Yr @ 3% 60,000 60,000 60,000 60,000 60,000 60,000 60,000 60,000 60,000
5nc2 @ 3.15% 63,000 63,000 63,000 63,000 63,000 63,000 63,000 63,000 63,000
Clearly the 5-year (longer assets)
rainbow the 2-year (shorter assets)

© 2015 PT Capital Partners. All Rights Reserved. Is Your ALM System Lying to You? 22
EV % Change
Economic Value Example
-20%
-15%
-10%
-5%
0%
5%
10%
15%
20%
-400 -300 -200 -100 0 100 200 300 400
2 Yr @ 1.5% 3.00% 3.00% 3.00% 1.99% 0.00% -1.95% -3.84% -5.70% -7.50%
5 Yr @ 3% 15.00% 15.00% 9.90% 4.83% 0.00% -4.58% -8.92% -13.04% -16.94%
5nc2 Yr @ 3.15% 5.99% 5.99% 5.99% 4.43% 0.00% -4.56% -8.89% -12.99% -16.89%
Which one would you buy?

© 2015 PT Capital Partners. All Rights Reserved. Is Your ALM System Lying to You? 23
EV % Change
Economic Value Example
-20%
-15%
-10%
-5%
0%
5%
10%
15%
20%
-400 -300 -200 -100 0 100 200 300 400
2 Yr @ 1.5% 3.00% 3.00% 3.00% 1.99% 0.00% -1.95% -3.84% -5.70% -7.50%
5 Yr @ 3% 15.00% 15.00% 9.90% 4.83% 0.00% -4.58% -8.92% -13.04% -16.94%
5nc2 Yr @ 3.15% 5.99% 5.99% 5.99% 4.43% 0.00% -4.56% -8.89% -12.99% -16.89%
Breakeven
at rates
unchanged
Which one would you buy?

© 2015 PT Capital Partners. All Rights Reserved. Is Your ALM System Lying to You? 24
EV % Change
Economic Value Example
(instantaneous shift)
-20%
-15%
-10%
-5%
0%
5%
10%
15%
20%
-400 -300 -200 -100 0 100 200 300 400
2 Yr @ 1.5% 3.00% 3.00% 3.00% 1.99% 0.00% -1.95% -3.84% -5.70% -7.50%
5 Yr @ 3% 15.00% 15.00% 9.90% 4.83% 0.00% -4.58% -8.92% -13.04% -16.94%
5nc2 Yr @ 3.15% 5.99% 5.99% 5.99% 4.43% 0.00% -4.56% -8.89% -12.99% -16.89%
Which one would you buy?
Consider this risk

© 2015 PT Capital Partners. All Rights Reserved. Is Your ALM System Lying to You? 25
2-Year Total Return
Total Return Analysis
(not an instantaneous shift)
-2%
0%
2%
4%
6%
8%
-400 -300 -200 -100 0 100 200 300 400
2 Yr @ 1.5% 1.49% 1.49% 1.49% 1.49% 1.49% 1.51% 1.51% 1.52% 1.53%
5 Yr @ 3% 7.13% 7.13% 7.12% 5.73% 4.33% 2.97% 1.62% 0.30% -1.01%
5nc2 @ 3.15% 3.09% 3.09% 3.09% 3.09% 3.10% 3.09% 1.77% 0.45% -0.85%
Now, which one
would you buy?

© 2015 PT Capital Partners. All Rights Reserved. Is Your ALM System Lying to You? 26
= Short-term Income + Change in Unrealized Gain/Loss
= Short-term Income + Long-term Income
= Income Simulation + Economic Value at Horizon
FINALLY, a management methodology that completely
measures risk vs. reward, empowering you to seek
superior balance sheet decisions.
TOTAL
RETURN

© 2015 PT Capital Partners. All Rights Reserved. Is Your ALM System Lying to You? 27
Income
Simulation (“IS”)
Economic Value
(“EV”)
TOTAL
RETURN
Accounts for
Passage
of Time
Counts ALL
Cash Flows X

© 2015 PT Capital Partners. All Rights Reserved. Is Your ALM System Lying to You? 28
Income
Simulation (“IS”)
Economic Value
(“EV”)
TOTAL
RETURN
Accounts for
Passage
of Time
Counts ALL
Cash Flows
X
X

© 2015 PT Capital Partners. All Rights Reserved. Is Your ALM System Lying to You? 29
Income
Simulation (“IS”)
Economic Value
(“EV”)
TOTAL
RETURN
Accounts for
Passage
of Time
Counts ALL
Cash Flows
X
X

© 2015 PT Capital Partners. All Rights Reserved. Is Your ALM System Lying to You? 30
OR
-200 -100 Base 100 200 300 400 -200 -100 Base 100 200 300 400
-200 -100 Base 100 200 300 400
VS
Net Interest Income EV
3-Year Total Return
Total Return:
The Marriage of Income Simulation and EV

© 2015 PT Capital Partners. All Rights Reserved. Is Your ALM System Lying to You? 31
TOTAL RETURN =
CHANGE IN MARKET VALUE
Income + - Ending Price Beginning Price

© 2015 PT Capital Partners. All Rights Reserved. Is Your ALM System Lying to You? 32
“Yield” + “Duration”
WHICH IS ESSENTIALLY
TOTAL RETURN =
Income + Change in Market Value

© 2015 PT Capital Partners. All Rights Reserved. Is Your ALM System Lying to You? 33
Total Return Shape Basics
Floating rate asset without caps/floors or
short fixed-rate asset
Longer term fixed-rate liability without options
Floating rate asset with caps (no floors)
Longer term fixed-rate liability with call
option not controlled by the bank
Floating rate asset with floors (no caps)
Longer term fixed-rate liability with call
option controlled by the bank
Longer term fixed-rate asset without options
Floating rate liability without caps/floors or
short fixed-rate liability
Longer term fixed-rate asset with call
option not controlled by the bank
Floating rate liability with floors (no caps)
Longer term fixed-rate asset with call (put)
option controlled by the bank
Floating rate liability with caps (no floors)
NO OPTIONS SOLD OPTIONS OWNED OPTIONS
Down Base Up Down Base Up Down Base Up
Down Base Up Down Base Up Down Base Up

© 2015 PT Capital Partners. All Rights Reserved. Is Your ALM System Lying to You? 34
Shapes Are Additive
Total Return Shape Basics
=
Total return shapes are additive (dollar weighted)
Down Base Up Down Base Up

© 2015 PT Capital Partners. All Rights Reserved. Is Your ALM System Lying to You? 35
Shapes Are Additive
Total Return Shape Basics
Shape Management® on the entire balance sheet
consists of assessing and adjusting the proportional
contributions of all balance sheet instruments.
=
► Adjusted Allocations
Down Base Up
Initial Allocations

© 2015 PT Capital Partners. All Rights Reserved. Is Your ALM System Lying to You? 36
12 Months
Sample Bank Loan Shape Comparison
© 2015 PT Capital Partners. All Rights Reserved. Is Your ALM System Lying to You? 37
36 Month
-8%
-6%
-4%
-2%
0%
2%
4%
6%
8%
-200 -100 0 +100 +200 +300 +400
Loan - 5/25 @ 2.5+1L Loan - 5/25 @ 4.5% Fixed
Loans: Fixed vs. Adjustable
CHANGED SCALE

© 2015 PT Capital Partners. All Rights Reserved. Is Your ALM System Lying to You? 38
36 Month
-10%
-8%
-6%
-4%
-2%
0%
2%
4%
6%
8%
10%
12%
-200 -100 0 +100 +200 +300 +400
5/25 @ 4.5% - Fixed - w/ PO 5/25 @ 4.5% - Fixed - NO PO
5/25 @ 4.5% - Pool
Loans with and without Prepayment “Options”
© 2015 PT Capital Partners. All Rights Reserved. Is Your ALM System Lying to You? 39
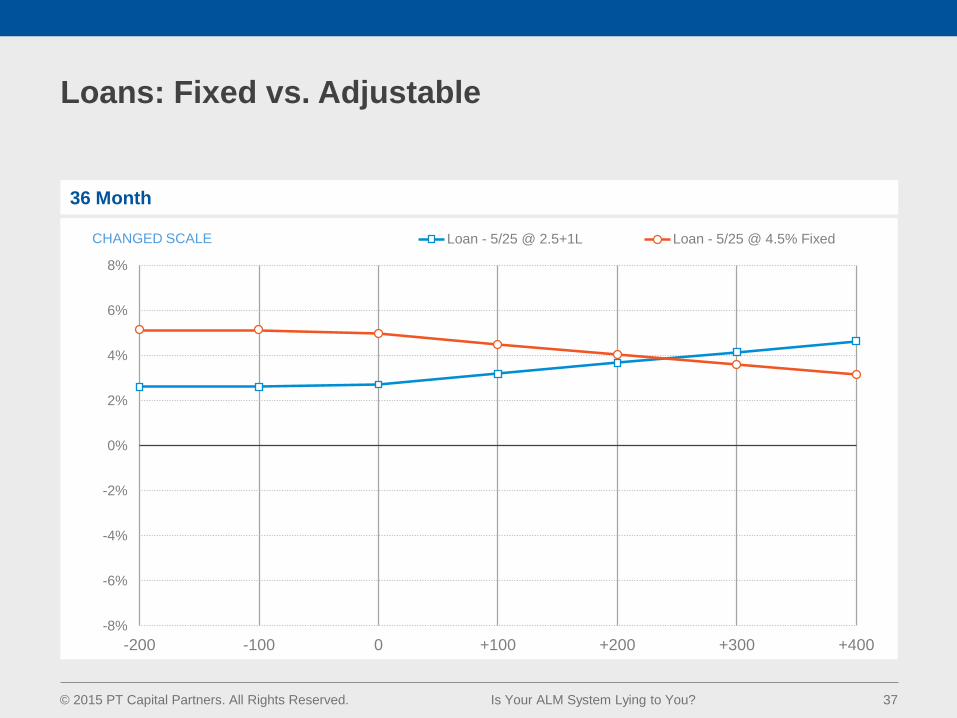
36 Month
Retail CDs with and without Surrender “Option”
-10%
-5%
0%
5%
10%
15%
-200 -100 0 +100 +200 +300 +400
5 Yr @ 2% - With Option 5 Yr @ 2% - No Option
© 2015 PT Capital Partners. All Rights Reserved. Is Your ALM System Lying to You? 40
-5%
-3%
0%
3%
5%
8%
10%
13%
15%
18%
20%
23%
-200 -100 0 +100 +200 +300 +400
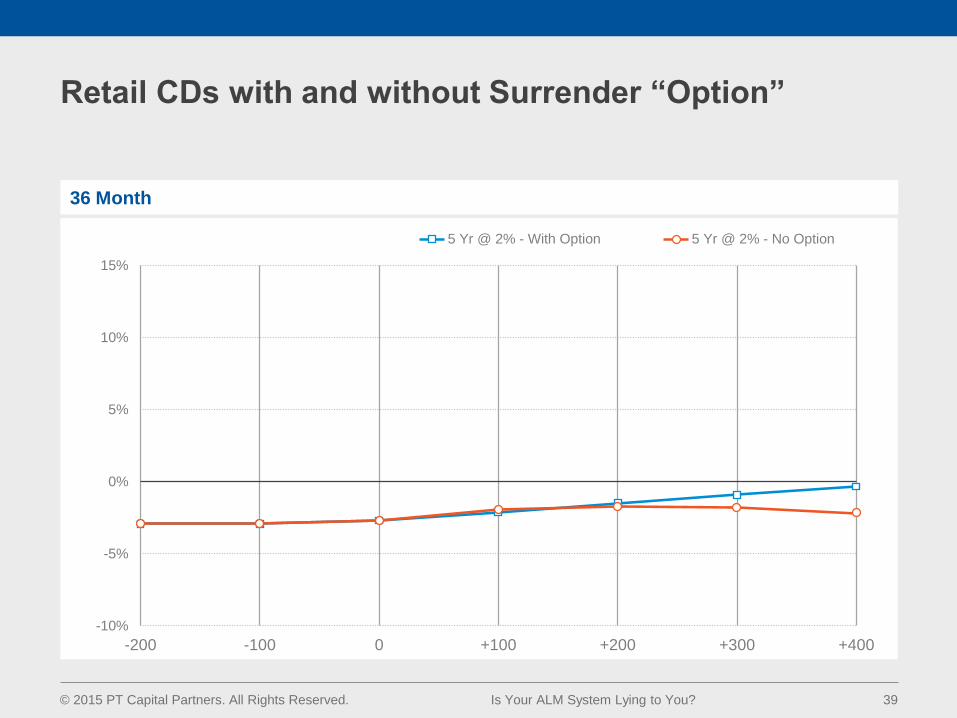
Brokered 3YrNC6 @ .95% Brokered 10YrNC6 @ 2.9%
Brokered 20YrNC6 @ 3.75%
36 Month
Short vs. Long Callable Brokered CDs
CHANGED SCALE

© 2015 PT Capital Partners. All Rights Reserved. Is Your ALM System Lying to You? 41
We model risk and reward separately, not with one another
We oversimplify A/L management, robbing the process of much value
An examiner’s A/L worldview is necessarily different than a banker’s
Core deposits are often incorrectly measured as shorter than they are
In general, A/L management is not highly valued
Problems with the Current State of
Asset/Liability Management

© 2015 PT Capital Partners. All Rights Reserved. Is Your ALM System Lying to You? 42
Broad categories (e.g., Call Report) instead of instrument level detail
Apply general industry assumptions as opposed to institution specific
Embedded option risk is not accurately modeled in many cases
Certain instruments often mismodeled (e.g., municipal bonds)
Oversimplifying ALM

© 2015 PT Capital Partners. All Rights Reserved. Is Your ALM System Lying to You? 43
We model risk and reward separately, not with one another
We oversimplify A/L management, robbing the process of much value
An examiner’s A/L worldview is necessarily different than a banker’s
Core deposits are often incorrectly measured as shorter than they are
In general, A/L management is not highly valued
Problems with the Current State of
Asset/Liability Management

© 2015 PT Capital Partners. All Rights Reserved. Is Your ALM System Lying to You? 44
Examiners are charged with protecting the deposit insurance fund
Consequently, they care very much about the “Armageddon” scenario
Thus, they care very much about instantaneous rate shocks
We care about the Armageddon scenario, but should we manage to it?
Many instruments behave differently over time than they do instantaneously
We need to take “a movie” of our bank through time, not a “snapshot”
Instantaneous Rate Shock vs. Shock over TIME

© 2015 PT Capital Partners. All Rights Reserved. Is Your ALM System Lying to You? 45
We model risk and reward separately, not one with another
We oversimplify A/L management, robbing the process of much value
An examiner’s A/L worldview is necessarily different than a banker’s
Core deposits are often incorrectly measured as shorter than they are
In general, A/L management is not highly valued
Problems with the Current State of
Asset/Liability Management

© 2015 PT Capital Partners. All Rights Reserved. Is Your ALM System Lying to You? 46
Core Deposit Assumptions:
The…

© 2015 PT Capital Partners. All Rights Reserved. Is Your ALM System Lying to You? 47
Sample Bank: EV Comparison
Core Deposit Assumptions
Can Cause Big Changes in EV
50,000
60,000
70,000
80,000
90,000
100,000
110,000
120,000
130,000
-200 -100 0 +100 +200 +300 +400
Original EVE Book

© 2015 PT Capital Partners. All Rights Reserved. Is Your ALM System Lying to You? 48
Sample Bank: EV Comparison
Core Deposit Assumptions
Can Cause Big Changes in EV
50,000
60,000
70,000
80,000
90,000
100,000
110,000
120,000
130,000
-200 -100 0 +100 +200 +300 +400
New EVE Original EVE Book

© 2015 PT Capital Partners. All Rights Reserved. Is Your ALM System Lying to You? 49
Since the crisis, core deposits as a percentage of assets, has
increased significantly. The leverage nature of the assumptions
for core deposits is even greater today than it has been in the past.
All are rightfully concerned about this increased in “surge” balances.
How many will be retained when rates rise?
However, there is a second item that deserves significant attention.
Of those NMDs that are not surge deposits, how long are they?
Core vs. Non-Core
All Insured Commercial Banks*
Dec-03 Dec-07 Change Dec-08 Dec-12 Change
ALL CORE 70.03 63.30 -9.61% 62.11 79.07 27.31%
* % of Average Assets

© 2015 PT Capital Partners. All Rights Reserved. Is Your ALM System Lying to You? 50
Many institutions are estimating core deposit durations shorter
to much shorter than they actually behave
In addition, most core deposit studies essentially ignore new deposits
Is there a difference between a 3-year bond and a 10-year bond?
Is there a difference between a 3-year and 10-year liability?
Our ALM reports seem to say no
How Long is Core?

© 2015 PT Capital Partners. All Rights Reserved. Is Your ALM System Lying to You? 51
Average Life of Deposits when considering “surge” balances
Core vs. Non-Core
% of Non-Core ("Surge") Deposits (1 yr Avg Life)
10% 20% 30% 40% 50% 60%
Tru
e C
ore
Dep
osits (
Avg L
ife
)
4 3.7 3.4 3.1 2.8 2.5 2.2
5 4.6 4.2 3.8 3.4 3.0 2.6
6 5.5 5.0 4.5 4.0 3.5 3.0
7 6.4 5.8 5.2 4.6 4.0 3.4
8 7.3 6.6 5.9 5.2 4.5 3.8
9 8.2 7.4 6.6 5.8 5.0 4.2
10 9.1 8.2 7.3 6.4 5.5 4.6
11 10.0 9.0 8.0 7.0 6.0 5.0
12 10.9 9.8 8.7 7.6 6.5 5.4
13 11.8 10.6 9.4 8.2 7.0 5.8
14 12.7 11.4 10.1 8.8 7.5 6.2
15 13.6 12.2 10.8 9.4 8.0 6.6
Base Stressed
Which is the bigger issue?

© 2015 PT Capital Partners. All Rights Reserved. Is Your ALM System Lying to You? 52
NMD/Total Deposits
0
10
20
30
40
50
60
70
80
2007 2008 2009 2010 2011 2012 2013 2014 2015 2016 2017 2018 2019 2020 2021 2022 2023
The Run Up in “Surge Deposits”
Source: Performance Trust

© 2015 PT Capital Partners. All Rights Reserved. Is Your ALM System Lying to You? 53
NMD/Total Deposits
0
10
20
30
40
50
60
70
80
2007 2008 2009 2010 2011 2012 2013 2014 2015 2016 2017 2018 2019 2020 2021 2022 2023
Could Our Deposits “Surge” Down This Much? Our NMD assumptions suggest they will.
Average Life = 5.4
Source: Performance Trust
$0 Balance

© 2015 PT Capital Partners. All Rights Reserved. Is Your ALM System Lying to You? 54
NMD/ Total Deposits (+300 Standard)
Non-Maturity Assumptions
0
10
20
30
40
50
60
70
80
2007 2008 2009 2010 2011 2012 2013 2014 2015 2016 2017 2018 2019 2020 2021 2022 2023 2024 2025
16% drop in
2 years
19% drop in
6 years Average Life = 10.2
Source: Performance Trust
$0 Balance

© 2015 PT Capital Partners. All Rights Reserved. Is Your ALM System Lying to You? 55
NMD Balances +300
Non-Maturity Assumptions
0
10
20
30
40
50
60
70
80
2007 2008 2009 2010 2011 2012 2013 2014 2015 2016 2017 2018 2019 2020 2021 2022 2023
FRANCHISE VALUE
Source: Performance Trust

© 2015 PT Capital Partners. All Rights Reserved. Is Your ALM System Lying to You? 56
Median M&A Core Deposit Premiums vs. Prime and Fed Funds Rate Since 1/1/2000
M&A Core Deposit Premium vs. Interest Rate Analysis
5.8% 5.0%
3.0% 2.5%
1.0%
2.9% 2.1%
9.2%
15.5%
18.4%
16.8%
15.3%
13.6%
8.8% 9.5%
11.1%
0%
2%
4%
6%
8%
10%
12%
14%
16%
18%
20%
2Q141Q1420132012201120102009200820072006200520042003200220012000
Median Core Deposit Premium Prime Rate Fed Funds Rate
Source: Performance Trust

© 2015 PT Capital Partners. All Rights Reserved. Is Your ALM System Lying to You? 57
Since the crisis, NMD as a percentage of assets, has increased
significantly (55% vs 70%) – Some of these are non-core deposits.
The impact of the assumptions for NMD is greater today than
in recent history.
Most NMD frameworks have unrealistic decay profiles —
Are we being too conservative?
Decay of non-maturity principal is equivalent to those dollars
repricing with overnight funding at market rates.
Concede sooner on % of non core than maturity of remaining core.
The Elephant: Non-Maturity Deposits

© 2015 PT Capital Partners. All Rights Reserved. Is Your ALM System Lying to You? 58
We model risk and reward separately, not one with another
We oversimplify A/L management, robbing the process of much value
An examiner’s A/L worldview is necessarily different than a banker’s
Core deposits are often incorrectly measured as shorter than they are
In general, A/L management is not highly valued
Problems with the Current State
of Asset/Liability Management

© 2015 PT Capital Partners. All Rights Reserved. Is Your ALM System Lying to You? 59
We don’t really trust our own output — this becomes self-fulfilling
We are not convinced that the upside for getting it “right” is worth it
ALM is Not Highly Valued

© 2015 PT Capital Partners. All Rights Reserved. Is Your ALM System Lying to You? 60
Are these improvements achievable with better risk
versus reward decision-making tools?
ROA Improvement (Annual)
0.01% 0.05% 0.10% 0.15% 0.20% 0.25% 0.30% 0.40% 0.50%
AS
SE
T S
IZE
(M
ILL
ION
S)
250 25,000 125,000 250,000 375,000 500,000 625,000 750,000 1,000,000 1,250,000
500 50,000 250,000 500,000 750,000 1,000,000 1,250,000 1,500,000 2,000,000 2,500,000
750 75,000 375,000 750,000 1,125,000 1,500,000 1,875,000 2,250,000 3,000,000 3,750,000
1,000 100,000 500,000 1,000,000 1,500,000 2,000,000 2,500,000 3,000,000 4,000,000 5,000,000
1,250 125,000 625,000 1,250,000 1,875,000 2,500,000 3,125,000 3,750,000 5,000,000 6,250,000
1,500 150,000 750,000 1,500,000 2,250,000 3,000,000 3,750,000 4,500,000 6,000,000 7,500,000
1,750 175,000 875,000 1,750,000 2,625,000 3,500,000 4,375,000 5,250,000 7,000,000 8,750,000
2,000 200,000 1,000,000 2,000,000 3,000,000 4,000,000 5,000,000 6,000,000 8,000,000 10,000,000
2,250 225,000 1,125,000 2,250,000 3,375,000 4,500,000 5,625,000 6,750,000 9,000,000 11,250,000
2,500 250,000 1,250,000 2,500,000 3,750,000 5,000,000 6,250,000 7,500,000 10,000,000 12,500,000
2,750 275,000 1,375,000 2,750,000 4,125,000 5,500,000 6,875,000 8,250,000 11,000,000 13,750,000
3,000 300,000 1,500,000 3,000,000 4,500,000 6,000,000 7,500,000 9,000,000 12,000,000 15,000,000
Is It Really Worth It??

© 2015 PT Capital Partners. All Rights Reserved. Is Your ALM System Lying to You? 61
Is this your institution?
Asset Duration 2 years
Liability Duration 5 years
Difference -3 years
Treasury Curve
2-Yr 0.5
5-Yr 1.75
5-Yr – 2-Yr 1.25
Asset Size Cost of Mismatch
$500,000,000 $6,250,000
$1,000,000,000 $12,500,000
Is It Really Worth It??
Are these improvements achievable with better risk
versus reward decision-making tools?

© 2015 PT Capital Partners. All Rights Reserved. Is Your ALM System Lying to You? 62
Total Return models risk vs. reward together (literally in the same equation)
Don’t oversimplify. Take a moving picture of your bank not a snapshot
Realize an examiner’s A/L worldview is necessarily different than yours
Spend the resources necessary to more accurately measure core deposits.
Realize this assumption dramatically influences other balance sheet
decisions. This issue significantly impacts your members
Highly value ALM. The upside to improving your ALM is very significant,
which for many, it can result in the hundreds of thousands of dollars and
possibly, millions of dollars
Solving the Current Problems of ALM

Goals For Today’s Talk
Recognize that:
1. Traditional asset liability metrics have significant shortcomings in measuring risk versus reward
2. These shortcomings can be eliminated through a relatively small analytical adjustment
3. The benefit of making this adjustment is potentially significant
4. Core deposit assumptions are a really big deal when determining economic value, especially the average life assumptions of those that are truly core

© 2015 PT Capital Partners. All Rights Reserved. Is Your ALM System Lying to You? 64
Questions and Comments
© 2015 PT Capital Partners, LLC (which, along with its affiliates, is referred to as “PT”).
All Rights Reserved. This material is for your internal use only and may not be disclosed to
third parties. The content is the proprietary and confidential material of Trust and so designated
pursuant to a confidentiality agreement between the intended recipient and PT. The research
and other information provided herein has been prepared for informational purposes only
and is not an offer or solicitation to purchase or sell securities. PT may make a market,
or have a position in the securities discussed herein and may purchase or sell the same
on a principal basis or as an agent. Investing involves risks, including the potential for
principal loss. There is no guarantee that the strategies and services will be successful
or outperform other strategies and services. Certain assumptions may have been made
in connection with the analysis presented herein, and changes to the assumptions may
have a material impact on the analysis or results. Past performance is no guarantee of future
results. The investments discussed herein may be unsuitable for investors depending on their
specific investment objectives and financial position. Investors should independently evaluate
each investment discussed in the context of their own objectives, risk profile and circumstances.
The information contained herein has been obtained from sources considered to be reliable,
and is subject to change without notice. PT does not guarantee its accuracy, adequacy or
completeness and is not responsible for any errors or omissions or for the results obtained
from the use of such information. FOR INSTITUTIONAL USE ONLY.