Embed Size (px)
Citation preview

U.S. Department of the InteriorU.S. Geological Survey
Is there enough sand?Evaluating the fate of Grand Canyon sandbars
Scott A. Wright, John C. Schmidt, Theodore S. Melis, David J. Topping, David M. Rubin
Manuscript status: Approved by USGS, in review at GSA Today
8 April 2008
GCDAMP TWG meeting, PHX
Motivation
Science Symposium Panel: Several were declaring it a lost cause and that sediment augmentation is needed
Knowledge Assessment Workshop: Primary question identified for sediment was “Is there a ‘flow-only’ (non sediment augmentation) operation that will rebuild and maintain sandbar habitats over decadal time scales?”
Goal here was to take a “big picture”approach to try to answer the question,
Is there enough sand?

ApproachDefine and evaluate the “best case scenario”, in terms of hydrology and dam operations for rebuilding and maintaining sandbars (we call this scenario “optimal operations”)
Why this approach?
It’s the logical first step - If the "optimal operations“ don’t “work”, then non-flow measures may be evaluated. If the "optimal operations" do “work”, it sets the upper bound for expectations and leads into more complex scenarios
The "optimal operations" are the easiest to analyze with available information, leading to the least uncertainty

Definition of "optimal operations"
Sand transport is non-linearly related to water discharge. It follows that lower flows transport less sand, and for a given flow volume, steady flows transport less sand than fluctuating flows.
Thus, for maximizing sand retention:- “optimal hydrology” is minimum releases (8.23 MAF*)- “optimal flows” are steady year-round- result: 8.23 MAF steady = 11,400 cfs
Any accumulation would be below 11,400 cfs stage. Redistribution to higher elevations is required by periodic highflows (we assume an annual high flow with a hydrograph shape dependent on the supply condition for a given year)
* This analysis was done before shortage criteria
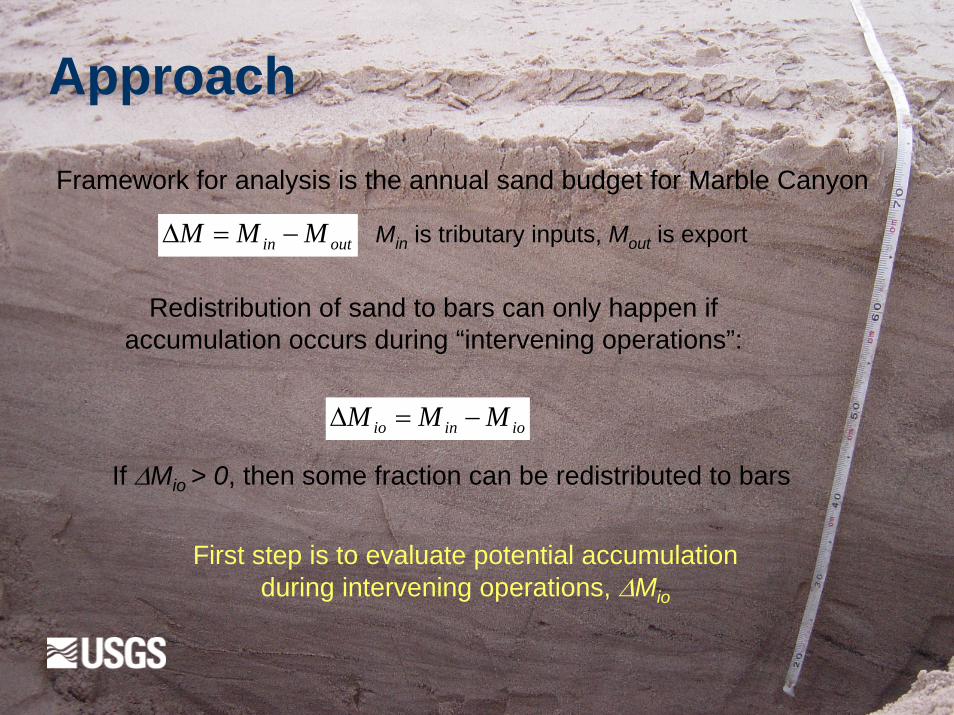
ioinio MMM −=Δ
Approach
outin MMM −=Δ
Redistribution of sand to bars can only happen if accumulation occurs during “intervening operations”:
Framework for analysis is the annual sand budget for Marble Canyon
First step is to evaluate potential accumulation during intervening operations, ΔMio
Min is tributary inputs, Mout is export
If ΔMio > 0, then some fraction can be redistributed to bars
Annual tributary inputsAnnual tributary inputs
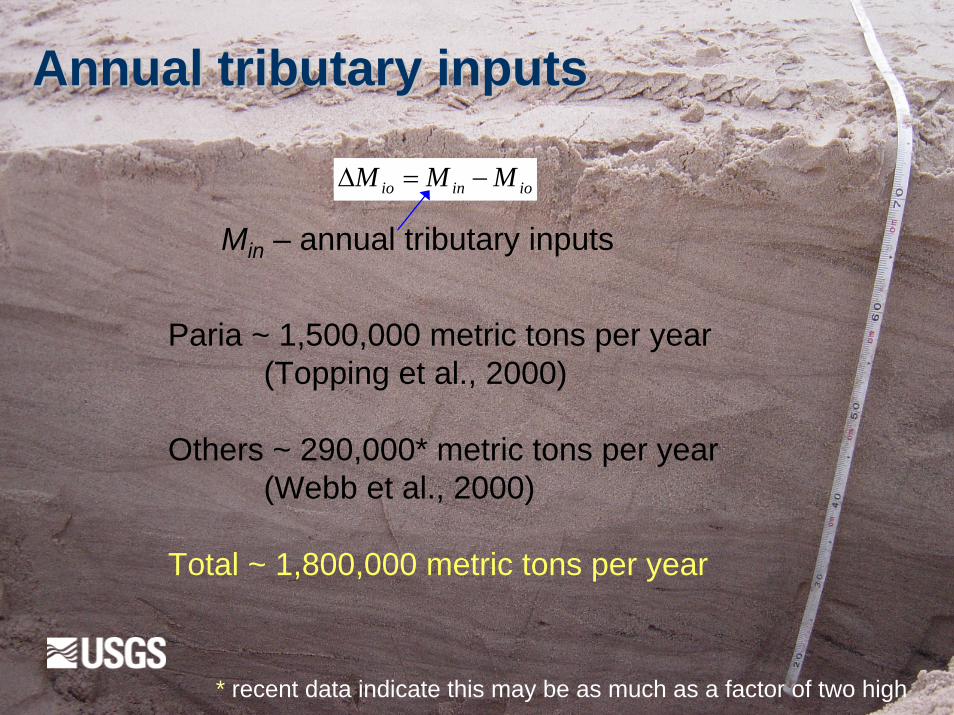
ioinio MMM −=Δ
Min – annual tributary inputs
Paria ~ 1,500,000 metric tons per year(Topping et al., 2000)
Others ~ 290,000* metric tons per year(Webb et al., 2000)
Total ~ 1,800,000 metric tons per year
* recent data indicate this may be as much as a factor of two high
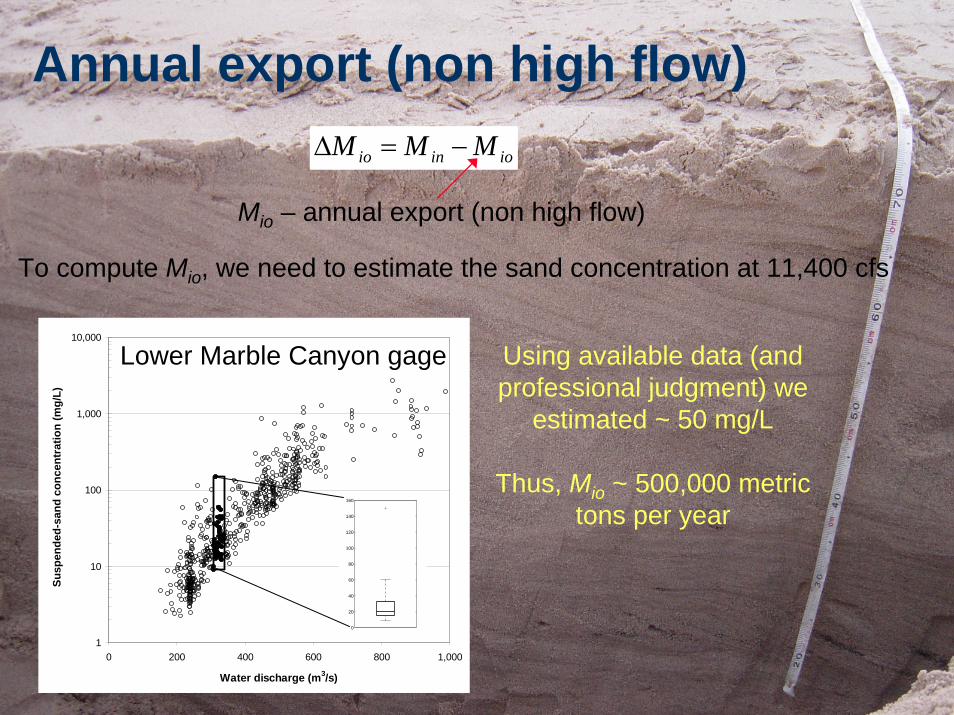
ioinio MMM −=Δ
Mio – annual export (non high flow)
Annual export (non high flow)
1
10
100
1,000
10,000
0 200 400 600 800 1,000
Water discharge (m3/s)
Susp
ende
d-sa
nd c
once
ntra
tion
(mg/
L)
0
20
40
60
80
100
120
140
160
To compute Mio, we need to estimate the sand concentration at 11,400 cfs
Lower Marble Canyon gage Using available data (and professional judgment) we
estimated ~ 50 mg/L
Thus, Mio ~ 500,000 metric tons per year
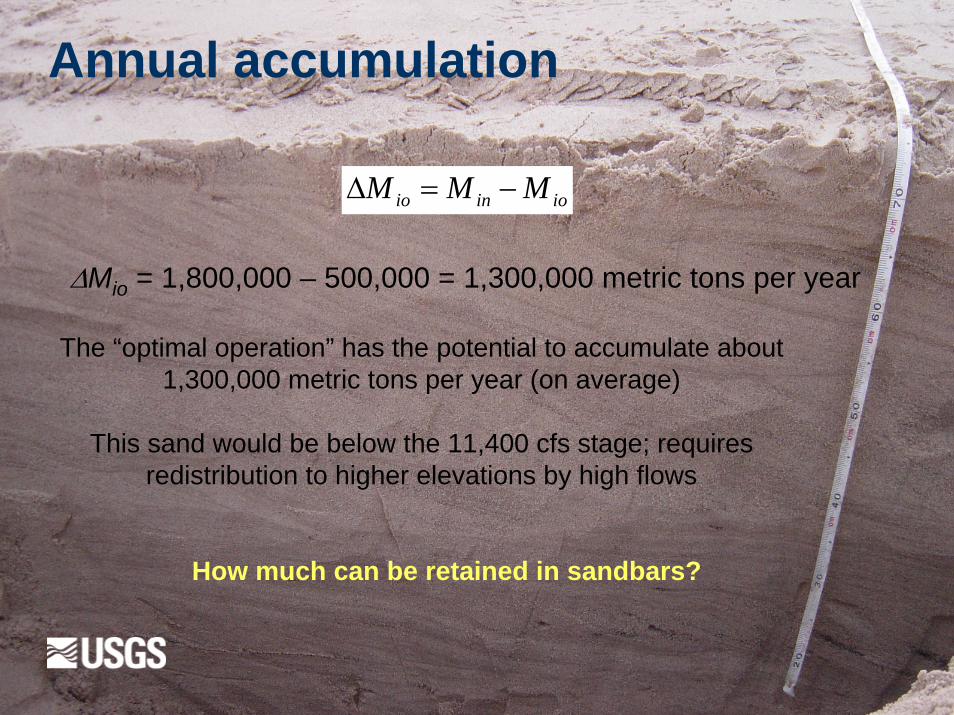
ΔMio = 1,800,000 – 500,000 = 1,300,000 metric tons per year
Annual accumulation
ioinio MMM −=Δ
The “optimal operation” has the potential to accumulate about 1,300,000 metric tons per year (on average)
This sand would be below the 11,400 cfs stage; requires redistribution to higher elevations by high flows
How much can be retained in sandbars?

High flow redistribution
( ) ioecb MFFF Δ++
As pointed out by Rubin et al. (2002), high flows are a “double edged sword” because, in order to redistribute sand to higher elevation, a substantial quantity must be exported:
Fraction transferred to bars
Fraction left behind in channel
Fraction exported

High flow redistribution
Estimates of FbTopping et al. (2006b) estimated that ~10-20% of the available tributary sand retained in the upper 50 km of Marble Canyon was still in the reach following the 2004 high flow event, presumably in sandbars
Though the 1996 high flow event resulted in an overall net loss of sediment from sandbars (Schmidt, 1999, Hazel et al., 2006), there was a gain in high-elevation volume that was ~20% of the losses from the low-elevation portions of sandbars and the channel
Hazel et al. (2006) estimated the potential active storage in sandbars in Marble Canyon to be ~13,000,000 metric tons, which is ~20% of the total pre-dam fine sediment load (sand and finer)
we chose Fb ~ 0.15

High flow redistribution
How does this compare to post-dam erosion rates?
Thus, we estimate that ~200,000 of the ~1,300,000 metric tons of accumulated sand could go towards bar-building. Since this is based on “optimal” operations, it can be considered the upper bound for expectations
If gains are maintained until the next high flow (an implicit assumption in our approach), response would be cumulative through time
iob MFonaccumulatiSandbar Δ=
Post-dam erosion rates
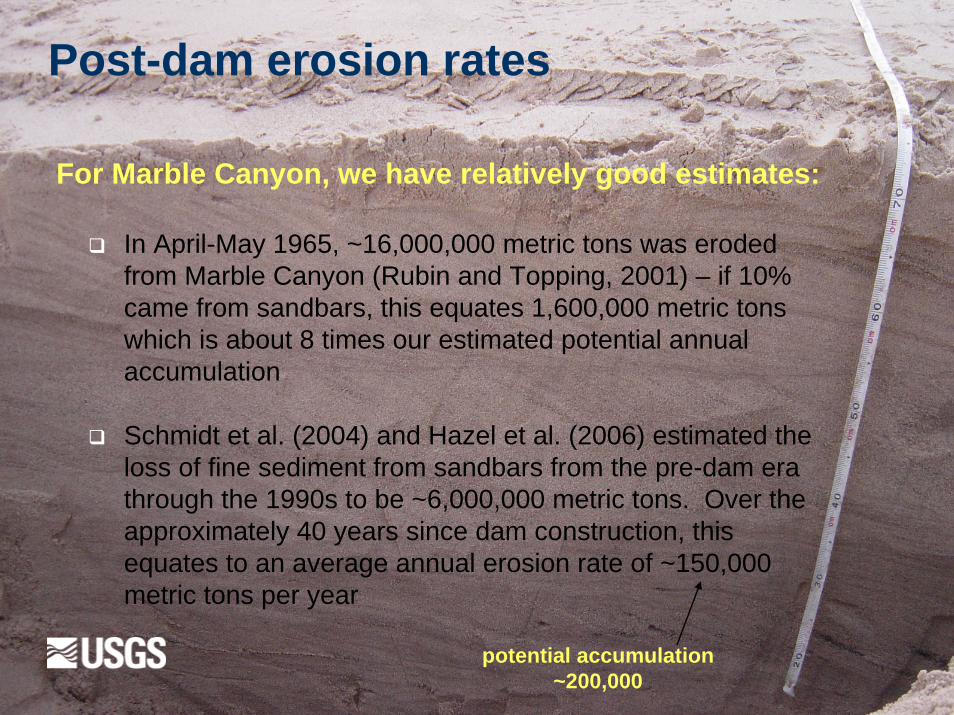
In April-May 1965, ~16,000,000 metric tons was eroded from Marble Canyon (Rubin and Topping, 2001) – if 10% came from sandbars, this equates 1,600,000 metric tons which is about 8 times our estimated potential annual accumulation
Schmidt et al. (2004) and Hazel et al. (2006) estimated the loss of fine sediment from sandbars from the pre-dam era through the 1990s to be ~6,000,000 metric tons. Over the approximately 40 years since dam construction, this equates to an average annual erosion rate of ~150,000 metric tons per year
For Marble Canyon, we have relatively good estimates:
potential accumulation ~200,000

Conclusions
The “best case scenario” for hydrology and dam operations has some viability for rebuilding and maintaining sandbar deposits
The maximum rate at which sandbars could potentially be rebuilt is comparable to their erosion rate over the ~40 years since dam construction
Deviations from “optimal conditions” (e.g. wetter hydrology, fluctuating flows) will decrease the rate of accumulation or result in net erosion
The largest uncertainty is in estimating Fb. Can high flow hydrographs be “optimized” to promote sandbar building while minimizing export?
Future work
Variable hydrology – we assumed minimum releases (8.23 MAF) – if releases are higher, export increases and less sand is available for building sandbars. The difficulty in analyzing these scenarios is predicting future hydrology.
Fluctuating flows – To evaluate a year-round steady flow, one discharge and one concentration are required. To evaluate fluctuating flows, hourly hydrographs, relations between discharge and sand concentration, and time series of tributary inputs are required. We are working on models to do this (LTEP), but they are not quite ready.
Optimized high flow hydrographs – Need models capable of evaluating various hydrograph scenarios and supply conditions.

Final comments
Is there a ‘flow-only’ (non sediment augmentation) operation that will rebuild and maintain sandbar
habitats over decadal time scales?
We think so, yes…
But, it is likely dependent on low volume releases
And, it will take time even under "optimal operations"