Embed Size (px)
Citation preview

Corporate Board: Role, Duties & Composition / Volume 6, Issue 1, 2010
6
IS THERE AN OPTIMUM GRANT SIZE AND EXERCISE PRICE FOR INCENTIVIZING EXECUTIVES?
Jean M. Canil*, Bruce A. Rosser**
Abstract
This study tests the Hall and Murphy (2000, 2002) propositions using a dataset wherein in-the-money and out-of-the-money option grants are just as prevalent as at-the-money option grants. The choice of grant size and exercise price in determining optimal pay-performance sensitivity, reveals an over prescription of at-the-money options at the expense of in-the-money options, particularly for high risk-averse CEOs. Also, pay-performance sensitivity is found unexpectedly negatively related to the exercise price, which is attributed to an equally unexpected inverse relation between risk aversion and grant size. Keywords: executive compensation, CEO, corporate governance *Corresponding author: Business School, University of Adelaide, Adelaide, South Australia 5005 Tel: 61 8 8303 5534 Fax: 61 8 8303 4368 Email: [email protected] **Business School, University of Adelaide, Adelaide, South Australia 5005
I. Introduction
Incentivizing executives through an optimal combination of grant size and exercise price in their stock
option grants remains a pervasive issue. Irrespective of whether companies are large or small and
whether companies operate in developed or under-developed economies, shareholders face the same
problem of how to delegate managerial decisions without at the same time incurring agency costs of
equity. An oft-cited optimal incentive model that employs these arguments is Hall and Murphy (2000,
2002) (hereafter, HM). Despite its seminal significance, the HM model of optimal stock option
compensation for executives has yet to be tested empirically, particularly their recommendation that
executive incentive is optimized by at-the-money (ATM) grants. Their model incorporates a positive
relation between grant value and the exercise price in recognizing that risk-averse and poorly-
diversified executives value options below their Black-Scholes value.1 The aim and contribution of the
present paper is to test both the internal arguments and external application of HM.2
In the HM model, shareholders incentivize risk-averse executives with a lower exercise price (in tandem
with a smaller grant) as an executive‘s level of risk aversion increases, reinforced by declining
diversification on private account. Pay-performance sensitivity is the dollar change in option value for a
one percentage change in the underlying stock price. Since pay-performance sensitivity/exercise price
tends invariant as the degree of risk aversion declines, HM prescribe ATM grants to optimize incentive.
Even so, the HM model specifies scenarios in which in-the-money (ITM) and out-of-the-money (OTM)
stock option grants remain optimal. For example, OTM grants are predicated for low levels of risk
aversion and increasing private diversification, while ITM options are optimal for high levels of risk
aversion reinforced by declining private diversification.
A successful test of the HM model requires that granting companies are free to vary grant size and the
exercise price to deliver the targeted pay-performance sensitivity. Such flexibility is arguably lacking
1 Meulbroek (2001) addresses the same issue in a utility framework. 2 We do not test the optimality of early exercise. HM demonstrate that the propensity for early exercise is higher for
executives with higher risk aversion and lower private diversification. Chance and Yang (2008) propose an entirely
different rationale: that early exercise is always optimal for executives who can influence the underlying stock price.

Corporate Board: Role, Duties & Composition / Volume 6, Issue 1, 2010
7
for U.S. companies, where mandated option expensing and tax considerations combine to favor ATM
grants, and documented backdating distorts the exercise price. 3 In contrast, in our Australian data set all
three intervening factors are either absent or minimal for the sample period. For Australian option
grants prior to 2000 variation in the exercise price was not costly in the sense that (i) Accounting
Standards were yet to mandate the expensing either of the grant value or at least any grant discount (as
for U.S. firms), and (ii) there were no immediate income tax consequences for the company or the
recipient in granting non-ATM options. Only about one-third of our sampled grants to Australian CEOs
are ATM grants, compared with the 94% observed for the U.S. by HM themselves. Finally, Australian
option grants are comparatively free of backdating, so ATM grants do not mask an ex post discount.
Several findings emerge. First, the internal arguments of HM receive general support save for the
positive (and not negative) relation observed between the number of options granted and risk aversion.
Second, ATM grants in general attract positive abnormal returns, but problems are that (i) ATM grants
do not occur more frequently as risk aversion falls, and (ii) ATM grants to least risk-averse CEOs have
zero abnormal returns at grant. The remainder of the paper is organized as follows. Tests of the HM are
fashioned in the next Section. The data, sample and measures are described in Section III, which is
followed by the analysis and conclusions in Sections IV and V, respectively.
II. Hypothesis development HM model
HM recognize, as do Meulbroek (2001) and others, that risk-averse and poorly-diversified executives
value their grants below the Black-Scholes value4. In the HM model, risk aversion is a major argument
in establishing the relation between the key decision variables of the number of stock options granted
per period and the exercise price. The degree of private diversification is subordinate to risk aversion.
CEO productivity is assumed constant across risk aversion and private diversification. Assuming a fixed
proportion of performance-based compensation, increasing CEO risk aversion calls for a lower exercise
price but a smaller grant. The lower exercise price increases the option delta, which measures incentive.
Hence, higher exercise prices imply larger grants. The number of options granted and the exercise price
are therefore positively related.5 In the limit, a highly risk-averse executive is most efficiently
incentivized by a grant of restricted stock because options then have no incentive value. The impact of
private diversification is opposite to risk aversion: diversification is increasing in grant size (as
measured by the number of granted options) and the exercise price, and hence decreasing in delta. The
intuition is that an executive with low equity ownership (possibly implying a high degree of
diversification on private account) values a larger grant more than an executive with high equity
ownership. For a given grant size, a poorly-diversified executive requires a lower exercise price (and
hence a higher delta) relative to a well-diversified executive to provide the same incentive. Thus, large
grants with high exercise prices are predicated for less risk-averse and well-diversified executives,
while small grants with low exercise prices are predicated for more risk-averse and poorly-diversified
executives. These arguments imply the fully-embracing hypothesis:
H1: Pay-performance sensitivity per unit of risk aversion is increasing in the exercise
price/stock price and decreasing in private diversification.
Pay-performance sensitivity is defined as the product of the number of options granted (n) and the
option delta, giving the change in grant value per $1 change in the stock price. Thus, in a Black-Scholes
option valuation, pay-performance sensitivity is the number of options granted multiplied by the option
delta. To reveal the internal roles of risk aversion and private diversification we also test
H2: Risk aversion is decreasing in the number of options granted and exercise price/stock
price.
3 Hall and Murphy (2002) report that 94 per cent of options granted to CEOs of S&P 500 companies in 1998 were
granted at-the-money. 4 An exception is Chance and Yang (2008), who argue that influential CEOs may actually value their option grants
above the Black-Scholes value to the extent that CEOs negotiate an earlier vesting date to avoid the liquidity penalty
inherent in the non-tradability of their options. 5 This positive relation is common to most stock vs. option optimization models: see, for example Lambert and
Larcker (2004).

Corporate Board: Role, Duties & Composition / Volume 6, Issue 1, 2010
8
H3: Private diversification per unit of risk aversion is decreasing in the number of options
granted and increasing in exercise price/stock price.
We proceed to form hypotheses relating to the explanatory power of the model. For low values of
absolute risk aversion (ρ≤2) HM prescribe ATM grants because pay-performance sensitivity has
shallow convexity across quite wide variations in grant moneyness (refer their Figure 5), conditional on
options being an add-on to existing pay packages.6 For example, when ρ=2 ATM grants substitute
closely for ITM grants with a discount up to 50% and OTM grants with a premium up to 100%.7 As ρ>2
OTM grants are increasingly sub-optimal and ATM grants increasingly do not substitute for ITM
grants. Thus, we propose
H4: The likelihood of an ATM grant is decreasing in risk aversion.
If HM are right, when ρ≤2, cumulative abnormal returns (CARs) at the grant date should be non-
negative for ATM and OTM grants and negative for ITM grants because the latter are unlikely to be
optimal. On the other hand, when ρ>2 non-negative abnormals are expected to be observed for ATM or
ITM grants, while negative abnormals are predicted for OTM grants which are unlikely to be optimal.
Thus, the following couplet of hypotheses is generated:
H5A: When ρ≤2, grant CARs for ATM and OTM grants are ≥0, while for ITM grants CARs
are <0
H5B: When ρ>2, grant CARs for ATM and ITM grants are ≥0, while for OTM grants CARs
are <0
III. Sample, data and measures
Testing these models requires an institutional setting in which both grant size and exercise price are free
to interact. We argue this is unlikely to be the case for U.S. grants. Three strands of evidence suggest
the dominance of ATM grants is largely driven by institutional rigidities. Executive stock options in the
U.S. are typically fixed and non-qualifying. Since 1972, APB 25 has required fixed options with an
exercise price below the stock price at issue be expensed.8 Further, expensing a non-qualifying stock
option (e.g., at market value) at grant creates an immediate tax deduction for the company but also an
immediate income tax liability for the holder. Moreover, ITM options are not deductible under the
Internal Revenue Code if an executive‘s total non-performance-based compensation exceeds $1 million
a year. The sum effect is to penalize ITM grants. To complicate matters, many U.S. option grants are
back-dated, where the grant date is set retrospectively at the time of grant.9 The notional grant date
invariably precedes a stock price runup (known with hindsight), so back-dating can be an ex post means
of delivering an ITM grants which has all the appearances of an ATM grant at the grant date. Taken
together, these considerations suggest that in the U.S. grant moneyness is effectively not a decision
variable or is at least subject to measurement error.
On the other hand, the Australian data for our sample period, 1987-2000, are virtually free of these
problems. Prior to 2000 there was no accounting requirement to disclose or expense the value of option
grants10
, taxation was levied at the time of exercise on the difference between the stock price and the
6 When grants substitute for existing compensation, optimal incentive is delivered by grants of restricted stock. 7 Assuming add-on grants in the Hall and Murphy model, increasing risk aversion and/or lower private diversification
require higher incentive (delta) via a lower exercise price, for a given grant size. For example, for risk aversion of 3
and 50 per cent private investment in company stock a grant discount of approximately 35 per cent to market is
implied. Alternatively, for a given grant size, decreasing risk aversion and/or higher private diversification require
lower incentive (delta) via a higher exercise price. For example, for a risk aversion value of 2 and 50 per cent private
investment in company stock a grant premium of approximately 20 per cent is implied.
8 A fixed option is one in which the exercise price and the grant size are fixed at the time of the award, while in a
variable option either or both can vary. Variable options are always expensed. Since 1995 SFAS 123 has required
disclosure (but not recognition) of compensation expense (i.e., option values) relating to most fixed options in the
year of grant. A good discussion of the accounting and tax issues is provided by Chance (2008). 9 For an extended discussion of back-dating see, for example, Lie (2005) and Narayanan and Seyhun (2006). 10 In Australia, the expensing debate was unresolved until July, 2004 when AASB 2 became effective. Prior
accounting debate in Australia can be traced back to the release of the International Accounting Standards Board

Corporate Board: Role, Duties & Composition / Volume 6, Issue 1, 2010
9
exercise price, and back-dating was all but eliminated by the ASX requirement to lodge notice of any
change in directors‘ interests within 14 days of the event. Thus, if backdating exists the window of
opportunity is so short to all but eliminate the problem. Grants are notified to the Australian Stock
Exchange (ASX) in the Notice of Directors’ Interests (pursuant to the then Corporations Act, Section
235). For the duration of our sample period this notice was to be lodged within 14 days of the grant
(Section 205G).11, 12
Any issue of securities (including options) to a director of a company must be
approved by shareholders of the company prior to the issue (ASX Listing Rule 10.11). The grant
announcement date is the date on which the ASX publishes the notification by the granting company,
and is the date used for determining abnormal returns.
As in the U.S., executive stock option plans set the conditions under which subsequent grants are
made.13
The exercise price is determined either by a formula contained in the plan or on an ad hoc basis
by the compensation committee. Many formulae imbed a permanent discount or premium14
.
Compensation committees typically have discretion as to the frequency, the size and timing of grants
along with determination of the exercise price. Few plans specify grant frequency schedules: most leave
this to the discretion of the compensation committee.15
The aggregate of unexercised grants is
sometimes capped at a fixed percentage of outstanding shares or, else, option grants are sometimes
rationed with reference to a fixed, rolling interval.
In the absence of an Australian executive compensation database, all grant data were obtained from a
keyword-search of all ASX-listed companies included in Huntleys’ DatAnalysis service. Exercise
details were obtained from the ASX Additions to the Official List. Of 767 cases initially identified by
the keyword search, 257 cases (representing 107 companies) were deleted because the granting
company failed to provide a copy of the underlying option plan. A further 98 cases for which grant
dates preceded announcement dates were also deleted.16
To avoid the problem of pre-announcement
information leakage, the sample was restricted to grants occurring only on the announcement date or
subsequently, thereby excluding all cases of grants made prior to announcement.17
Application of these
preliminary filters resulted in an initial selection of 412 valid grants made by 144 companies. Further
deletions were made for (i) inadequate or inconsistent grant-related disclosures (186) and (ii) grants
made within 3 days of other major announcements, such as earnings releases (58). The final sample
comprised 168 stock option grants made by 51 companies to 65 CEOs18
. The sample derivation is
summarized thus:
(IASB) in mid-2002, which stated that all share-based payments should be recognized in the financial statements of
issuing companies. A summary of the Australian debate on accounting for executive stock options may be found in
the March, 2002 issue of the Australian Accounting Review. 11 Australian disclosures are on a par with the U.K.: see Conyon and Sadler (2001). In the U.K., Urgent Issue Task
Force (UITF) Abstract 10 of the Accounting Standards Board forms the basis of executive stock options disclosure,
and is similar to the Australian disclosure rules as embodied in s.205G of the Corporations Act 12 More recently, disclosure rules in both the U.S. and Australia have been tightened. In the U.S., in line with Section
403 of the Sarbanes-Oxley Act of 2002, the SEC amended the disclosure rules for beneficiary ownership reports to be
filed under Section 16(a) to be reported within two business days of receiving notification of the grant. In Australia,
ASX Listing Rule 3.19A introduced in 2001 requires any change in directors‘ interests to be notified within 5
business days of the change. 13 Australian executive stock option plans are partially surveyed in Rosser and Canil (2004) and Taylor and Coulton
(2002), while U.S. executive stock option plans are partially surveyed by Hall (1999). 14 For example, the plans of North Limited, ICI Australia Limited and Ashton Mining Limited prescribe an exercise
price being the average of the stock price for the prior 5 trading days, implying an ATM grant. Energy Equity
Limited specifies a permanent premium to market while Orbital Engine Limited specifies a permanent discount.
Amcor Limited and BRL Hardy Limited grant full discretion to their compensation committees. 15 Scheduled versus unscheduled grants in the U.S. are examined by Collins, Gong and Li (2005). 16 These cases are unlikely to represent back-dating. More likely, the granting company (many of which are small)
had not formally announced the grant. 17 Announcement and grants occurred on the same day in 56.5 per cent of sampled cases, with 29.6 per cent within
the following four weeks. 18 The number of CEOs exceeds the number of companies due to CEO turnover.

Corporate Board: Role, Duties & Composition / Volume 6, Issue 1, 2010
10
Number of hits from keyword-search 767
less grants for which the option plan could not be obtained (257)
less grants where grant date occurs prior to announcement date (98)
Number of valid grants 412
less deletions for:
inadequate or inconsistent grant-related disclosures (186)
grants made within 3 days of other major announcements (58)
Final sample 168
Of the 168 grants 74 are multiple grants, being two or more grants made on the same date to the same
CEO but differentiated by expiry or the exercise price, or both.19
These grants have the same properties
as single grants in all other respects. Resource stocks make up almost 18% of the final sample, with
industrial stocks (including manufacturing, engineering, conglomerate and technology stocks)
accounting for the remainder.
Compensation specialists in Australia consider that nearly all stock option grants made during the
sample period were add-ons and not substitutes. Add-on grants are also common in the U.S., as
indicated by HM and Baranchuk (2006) who note simultaneous growth in option grants along with CEO
salaries, bonuses and other benefits. In the pervasive absence of grant schedules, we define regular
grants as grants made annually for at least three consecutive years to the same CEO and with a
maximum timing variation of three months; the remainder are defined as irregular.
Grant moneyness (including the contingent CEO gain/loss at grant) is determined with reference to the
stock price at the close of trade on the grant date, while shareholder returns were determined around the
grant announcement date. An OTM grant is defined to occur when the stock price at grant exceeds the
exercise price by at least 5%; likewise, an ITM grant occurs when the stock price falls below the
exercise price by the same percentage. Notional ITM grants/OTM grants within this 5% tolerance are
therefore classified as ATM awards.20
This spread is considered wide enough to classify virtually all
ATM grants correctly, i.e., Type 1 error is believed negligible. A wide spread also captures many near-
ATM grants that are desirable given the non-exactitude of the Hall and Murphy (2002) predictions. The
likelihood of Type 2 error (misclassifying non-ATM grants) is therefore likely higher than Type 1 error.
Thus, grants classified as ITM or OTM are almost certainly not due to noise in stock prices.
Following Morgan and Poulsen (2001), a three-day window [-1, 1] is employed to capture grant
announcements made after the close of trading on day-zero.21
Cumulative abnormal returns are the
cumulative differences between expected and raw (or observed) stock returns, where expected returns
are calculated from application of the market model, with the S&P/ASX All Ordinaries Accumulation
Index used to proxy market returns on the market portfolio. Beta factors for this model are estimated
prior to the grant date using the excess return form of the market model (Brown and Warner, 1980).
Grant CARs are equally-weighted across the sample.
HM measure pay-performance sensitivity by SnVe )( , where eV (n) is the executive‘s valuation, S
is the stock price and n is the number of granted options. Executive value is determined after taking into
account risk aversion and diversification but not early exercise, which is treated as a separate
adjustment.22
Since for add-on grants Hall and Murphy (2002, p. 25) show that )()( nCnV BSe is not
sensitive across a wide range of grant discounts/premiums, we measure pay-performance sensitivity by
the partial derivative of the Black-Scholes call value with respect to the stock
price, SnCBS or ndN . 1 , adjusted for dividends. CEO risk aversion and private diversification
are proxied because these variables cannot be directly observed. Our primary measure of (absolute) risk
aversion is MRP/3.33σ2, where MRP is the market risk premium (set at 5%), σ is the standard
deviation of stock returns for a given company and 3.33 is a constant that delivers a sample-average
19 Spreads in exercise prices and exercise dates were intended to increase the probability that at least one of the grants
would be exercised. 20 Narrowing this spread to ±2% does not materially affect our results. 21 Daily abnormal returns for a week either side of this window are not statistically significant. 22 Ingersoll (2006) presents an algorithm for adjusting the Black-Scholes call value for all three factors.

Corporate Board: Role, Duties & Composition / Volume 6, Issue 1, 2010
11
aversion level of ρ = 2 which is pivotal in the HM model.23
A further reason for selecting ρ = 2 is that
the firms in our sample exhibit higher beta risk than average, implying lower executive risk aversion
than an often assumed investor value of around 3.24
The degree of Private diversification is proxied by
the index
TA
ownershipEquity
ownershipEquity 100 . ln , where TA is pre-grant total assets. The intuition
underlying this measure is that CEOs are likely less diversified as their direct equity ownership
increases but more diversified as firm size increases. For example, in a small firm it is to be expected
that an owner-manager has most of her wealth tied up in the business, while in a large corporation a
CEO having a similar stake is likely also to be wealthy (i.e., privately diversified) in her own right.
IV. Analysis
Descriptive statistics are presented in Table 1. Firm financial characteristics are consistent with the
economic conditions of the 1990s, but the sample exhibits higher than average beta risk. This is not
surprising because options are more valuable and hence carry stronger incentive effect as stock
volatility (which is usually positively related to beta) increases. Individual option grants tend below
0.5% of outstanding shares. Across the whole sample, the contingent gain at grant (based on the spread
between the stock price and the exercise price) is significantly positive (mean p = 0.072, median p =
0.063), implying an average discount of about 1.5%. An early indication of problems for the HM model
is given by the absence of a positive relation between the number of options granted and the exercise
price (r = -.081, p = 0.297). Grant and CEO characteristics are differentiated by grant moneyness in
Table 2 using probit analysis. Grant and CEO characteristics do not differ between ATM and OTM
grants, but CEO tenure is lower and private diversification is higher for ATM-grant firms relative to
ITM-grant firms. Notably, neither grant size nor CEO risk aversion differ according to grant
moneyness, which is inconsistent with HM. Separate univariate analysis (results not reported) shows
that ATM-grant firms make larger grants and exhibit higher CEO risk aversion and private
diversification than non-ATM-grant firms but have lower CEO equity ownership.
Prior to testing the HM propositions we show that our measure of risk aversion possesses desirable
properties. These are (i) a positive relation with the degree of corporate diversification25
, (ii) a positive
relation with cash flow/total assets and (iii) an inverse relation with growth opportunities, commonly
proxied by market-to-book of assets26
. Aversion is expected increasing in corporate diversification
because more diversified firms are less risky which suits more risk-averse executives. Likewise, firms
with a higher proportion of cash flow to total assets are likely to exhibit lower stock return volatility that
also suits more risk-averse executives. On the other hand, higher growth opportunities imply higher risk
that suits less risk-averse executives. As a robustness check, we introduce an alternative risk aversion
measure that is tested in the same way. The alternative aversion measure assumes that CEOs enter their
new job with a level of risk aversion equal to the sample average (ρ = 2.011), but as their tenure
lengthens risk aversion converges to that implied by the standard portfolio theory measure ( ). For
example, an executive joining a firm whose stock volatility implies lower (higher) risk aversion than the
sample average is conjectured to adjust her aversion downwards (upwards) linearly as she assimilates
with the firm ‗culture‘. This process is further conjectured to evolve fully by the tenth year. Thus, the
alternative risk aversion measure is:
23 This is the standard approach used in portfolio theory; see Bodie, Kane and Marcus (2005), ch.7. 24 The choice is not critical because our results are closely similar for sample-average aversion values of 3 and 4. 25 See Amihud and Lev (1981), May (1995) and Tufano (1996). 26 These are not the only benchmarks for developing a risk aversion measure. Guay (1999) further argues that more
risk-averse executives prefer a higher proportion of cash in their total compensation, while Berger, Ofek and
Yermack (1997) argue that executives become more risk averse as their tenure is longer. Our aversion measure
does not load on either of these variables, but we do not consider this a threat because both alternatives involve
circular reasoning. In the former case, option grants will naturally lower the observed proportion of cash in total
compensation. In the latter case competition in the executive labor market should lower the incidence of
incumbencies that are detrimental to shareholders; if executives are entrenched they will be unlikely to accept
incentive options in the first place.

Corporate Board: Role, Duties & Composition / Volume 6, Issue 1, 2010
12
where , t is the number of years of tenure and T = 10. We choose the measure which is
most strongly associated with variables previously identified as having a fixed directional relationship
with risk aversion. Specifically, a negative relation with growth opportunities is expected because
higher growth requires lower risk aversion. For the same reason, we also expect to observe a positive
relation with corporate diversification because diversified firms are less risky than the returns risk of the
same segments operated as independent entities. Likewise, high-cash flow firms have a higher
proportion of assets-in-place than low-cash flow firms and are therefore more attractive to risk-averse
executives. Consistency tests for both aversion measures are presented in Table 3, which shows that the
primary measure for risk aversion ( ) is clearly preferred.
Using this preferred measure, we now proceed to the tests of the HM model. Tests of hypotheses H1
through H4 are presented in Table 4. For H1, Private diversification is correctly signed (negative) but
Exercise price/Stock price is not. Given the likelihood that our risk aversion measure is reliable, failure
to establish a positive relation with the exercise price poses a major threat to the HM model. Recall that
pay-performance sensitivity is defined by HM as the product of delta and the number of options
granted. Since delta is exogenous, the source of the failure is attributable to the number of options
granted. The test of H2 shows that Risk aversion is inversely related to Exercise price/Stock price as
hypothesized, but the positive coefficient on Number of options is unexpected. However, given the
outcome of testing H1, it is apparent that the number of options granted is again problematic for HM,
who argue that more risk-averse CEOs require smaller grants, and vice versa. Thus, our results indicate
exactly the reverse. The test of H3 is inconclusive. To this point, the evidence suggests the number of
options granted does not behave as predicted by HM, whereas behavior of the exercise price conforms
to their model. The test outcome of H4 is adverse: ATM grants are found to occur more, and not less,
frequently as CEO risk aversion increases. In other words, risk aversion is decreasing in non-ATM
grants.27
To the extent that our risk aversion measure is credible, it appears that ATM grants are over-
prescribed by HM. Given the inverse relation between risk aversion and the exercise price (refer the test
of H2), it appears many ATM grants should have been ITM grants.
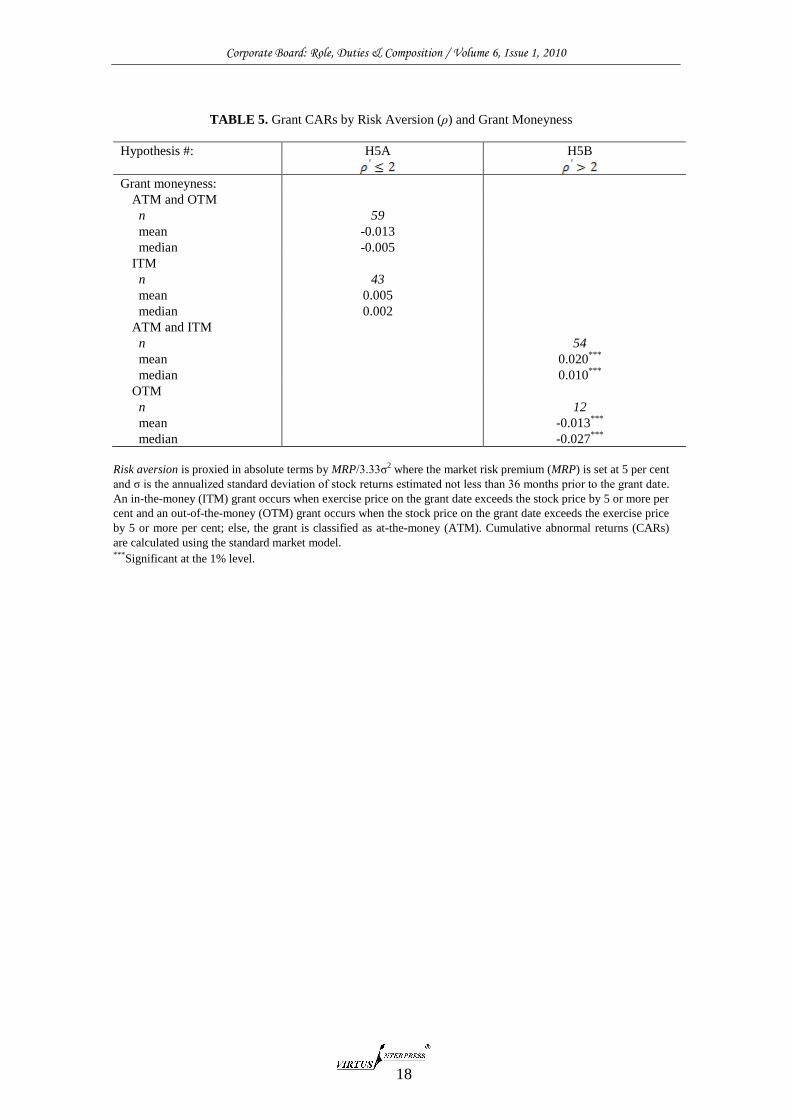
Table 5 presents grant [-1, 1] CARs by the level of CEOs‘ risk aversion and grant moneyness in order to
test hypotheses H5A and H5B. We preface these results by noting that ATM grants in our sample
exhibit positive CARs (mean 0.0140, p = 0.000), OTM grants exhibit negative CARs (mean -0.0170, p
= 0.000) while ITM grants exhibit returns not significantly different from zero (mean 0.0063, p =
0.768). Thus, initially at least, HM appear to receive limited support with respect to the ATM grants.
However, when risk aversion is taken into account H5A receives no support, with all CARs for
being insignificantly different from zero across grant moneyness. On the other hand, H5B receives
strong empirical support: for higher levels of risk aversion ( 2), ATM and ITM grants exhibit
positive CARs while OTM grant CARs are negative, as hypothesized. OTM grants coupled with high
risk aversion are found costly for shareholders. Our results suggest two factors prevent the HM model
from receiving unqualified empirical support: first, the number of options granted does not increase
with the exercise price and, second, the HM model ‗works‘ for high CEO risk aversion but not low risk
aversion.
V. Conclusions
We report the first tests of the key incentive-related propositions contained in the widely-cited optimal
incentive model of HM. Our use of Australian data confers dual benefits not present in U.S. data:
freely-adjusting exercise prices while minimizing the impact of expensing requirements and tax
considerations. In the HM model, the level of executive risk aversion and the degree of private
diversification jointly determine pay-performance sensitivity simultaneously with the exercise price. We
document evidence that is generally supportive of their model, save for absolute grant size. We further
show that grant CARs tend to be supportive of exercise price choices for grants made to more risk-
averse CEOs, but are not supportive of grants made to less risk-averse CEOs. The posited positive
relation between pay-performance sensitivity and the exercise price is not found in the data. The
observed inverse relation is attributable to the positive (and not negative) relation between CEO risk
aversion and absolute grant size. Given these results, a puzzle emerges: more risk-averse CEOs appear
to receive larger grants than HM would prescribe, while less risk-averse CEOs appear to receive smaller
27 Further analysis (not reported) documents the inverse relation separately for ITM but less so for OTM grants.

Corporate Board: Role, Duties & Composition / Volume 6, Issue 1, 2010
13
grants than HM would prescribe. On the other hand, exercise prices appear roughly consistent with the
HM model. Hence, we attribute the indifferent grant CARs observed for more risk-averse CEOs to
problems getting grant sizes ―right‖. Incentivizing highly risk-averse CEOs remains problematical.
References
1. Amihud, Y. and Baruch Lev, (1981): ―Risk reduction as a Managerial motive for Conglomerate
Mergers‖, Bell Journal of Economics, 12, 605-617.
2. Australian Accounting Standards Board, AASB 2, ―Share-based Payment‖, Melbourne, Australia,
2004.
3. Baranchuk, Nina, (2006): ―Are CEOs Charged for Stock-Based Pay? An Instrumental Variable
Analysis‖, Working paper, School of Management, University of Texas–Dallas (March).
4. Berger, Philip G., Eli Ofek and David L. Yermack, (1997): ―Managerial entrenchment and capital
structure decisions‖, Journal of Finance 52, 1411-1438.
5. Black Fischer and Myron Scholes, (1973): ―The Pricing of Options and Corporate Liabilities‖,
Journal of Political Economy 81, 637-654.
6. Bodie, Zvi, Alex Kane and Alan J. Marcus, (2005): Investments, 6th
edition ( McGraw-Hill
International, Boston).
7. Brown, Stephen and Jerold Warner, (1980): ―Measuring security price performance‖, Journal of
Financial Economics 8, 205-258.
8. Chance, Don, (2008): ―Expensing Executive Stock Options: Sorting Out the Issues‖, Charlottesville:
CFA Institute Centre for Financial Market Integrity.
9. Chance, Don and Tung-Hsiao Yang, (2008): ―The Valuation of Executive Stock Options when
Executives can Influence the Payoffs‖, Southern Finance Association, Annual Meeting, Key West.
10. Collins, Daniel W., Guojin Gong and Haidan Li, (2005): ―The Timing of CEO Stock Option
Grants: Scheduled versus Unscheduled Awards‖, Working paper, University of Iowa, Department of
Accounting.
11. Conyon, Martin J. and Graham V. Sadler, (2001): ―CEO Compensation, Option Incentives and
Information Disclosure‖, Review of Financial Economics 10, 251-277.
12. Guay, Wayne R., (1999): ―The sensitivity of CEO wealth to equity risk: an analysis of the
magnitude and determinants‖, Journal of Financial Economics 53, 43-71.
13. Hall, Brian J., (1999): ―The Design of Multi-Year Stock Option Plans‖, Journal of Applied
Corporate Finance 12, 97-106.
14. Hall, Brian J. and Kevin J. Murphy, (2000): ―Optimal Exercise Prices for Executive Stock
Options‖, American Economic Review, Papers and Proceedings of the 112th
Annual Meeting of the
American Economic Association, May, 209-214.
15. Hall, Brian and Kevin J. Murphy, (2002): ―Stock options for undiversified executives‖, Journal of
Accounting and Economics 33, 3-42.
16. Ingersoll, Jonathan E., (2006): ―The subjective and objective evaluation of incentive index stock
options‖, Journal of Business 79, 453-487.
17. Lambert, Richard A. and David F. Larcker, (2004): ‗Stock Options, Restricted Stock and
Incentives‖, University of Pennsylvania, Wharton School, Working Paper.
18. Lie, Erik, (2005): ‗On the timing of CEO stock option awards‖, Management Science, 51, 802-
812.
19. Meulbroek, Lisa K., (2001): ‗The Efficiency of Equity-Linked Compensation: Understanding the
Full Cost of Awarding Executive Stock Options‖, Financial Management, 30, 5-44.
20. Morgan, Angela G. and Annette B. Poulsen, (2001): ―Linking pay to performance: Compensation
proposals in the S&P 500‖, Journal of Financial Economics, 62, 489-523.
21. Narayanan, M.P. and H. Nejat Seyhun, (2006): ―Dating Games: Do Managers Designate Grant
Dates to Increase their Compensation?‖ Working paper, University of Michigan (April).
22. Rosser, Bruce A. and Jean M. Canil, (2004): ―Executive Stock Options: Evidence that
Premium and Discount Awards Do Matter‖, Working paper, University of Adelaide, Australia
(July).
23. Taylor, Stephen J. and John Coulton, (2002): ―Options Awards for Australian CEOs: The Who,
What and Why‖, Australian Accounting Review 12, 25-35.
24. Tufano, Peter, (1996): ―Who manages risk? An empirical examination of risk management
practices in the gold mining industry‖, Journal of Finance, 51, 1097-1137.

Corporate Board: Role, Duties & Composition / Volume 6, Issue 1, 2010
14
Appendices
TABLE 1. Descriptive Statistics
Variable Mean Median Standard
deviation
25th
Percentile
75th
Percentile
Firm characteristics:
Firm size (log) 5.92 5.92 1.85 4.84 7.64
Stock return volatility (%) 41.2 32.0 25.2 23.2 51.4
Beta risk 1.31 1.12 0.92 0.80 1.83
Market-to-book of assets 1.32 1.04 1.41 0.08 1.30
Financial leverage (%) 19.0 17.6 13.5 8.4 28.9
CEO characteristics:
Tenure (years) 4.06 4.00 2.40 4.56 5.00
Equity ownership (%) 1.53 0.03 4.53 0.01 0.46
Grant characteristics:
Grant size (%) 0.34 0.15 0.68 0.05 0.36
Contingent gain at grant 0.015 0.013 0.189 -0.047 0.101
Grant expiry (years) 4.60 5.00 0.82 2.00 6.00
N=168
Firm size is measured by pre-grant ln(total assets). Stock return volatility is measured by the annualized standard
deviation of pre-grant monthly stock returns (in percentage terms) over a minimum 3 years prior to grant. Market-to-
book of assets is the sum of the sum of the market value of equity and the book value of debt divided by book total
assets, all pre-grant. Financial leverage is the ratio of total debt to total assets, all pre-grant. Tenure is the number of
years since appointment. Equity ownership is the number of ordinary shares beneficially-owned pre-grant and divided
by the number of ordinary shares outstanding. Grant size is the number of granted options divided by the number of
outstanding ordinary shares prior to grant, expressed as a percentage. Contingent gain at grant is the stock price at
grant minus the exercise price, divided by the stock price at grant: a gain (loss) implies a discount (premium). Grant
expiry is the contracted term to expiry.

Corporate Board: Role, Duties & Composition / Volume 6, Issue 1, 2010
15
TABLE 2. Probit regressions: Differentiation of Grant and CEO Characteristics by Grant Moneyness
Dependent variable:
ATM=1
(ATM vs OTM)
ATM=1
(ATM vs ITM)
Contingent CEO gain n.a. n.a.
Grant size (%) -0.764
(-1.563)
-0.670
(-1.382)
Grant expiry (years) 0.303
(1.474)
0.254
(1.347)
Tenure (years) -0.010
(-0.164)
-0.094*
(-1.687)
CEO equity ownership (%) -0.004
(-0.112)
0.050
(1.489)
CEO risk aversion (absolute) 0.102
(1.270)
0.068
(0.378)
CEO private diversification (index) 0.016
(0.338)
0.116**
(2.389)
Intercept -1.485
(-1.519)
-2.060**
(-2.029)
McFadden 2R 0.111 0.163
Number of observations=1 55 55
Number of observations=0 48 65
Contingent gain at grant is the stock price at grant minus the exercise price, divided by the stock price at grant: a
gain (loss) implies a discount (premium). Grant size is the number of granted options divided by the number of
outstanding ordinary shares prior to grant, expressed as a percentage. Grant expiry is the contracted term to expiry.
Tenure is the number of years since appointment. CEO equity ownership is the number of ordinary shares
beneficially-owned pre-grant and divided by the number of ordinary shares outstanding. CEO risk aversion is
proxied in absolute terms by MRP/3.33σ2 where the market risk premium (MRP) is set at 5 per cent and σ is the
annualized standard deviation of stock returns estimated not less than 36 months prior to the grant date. CEO
private diversification is proxied by the index
TA
ownershipEquity
ownershipEquity 100 . ln , where TA is pre-grant total
assets. All regressions are on panel data and are White- corrected for heteroscedasticity.
***Significant at the 1% level. **Significant at the 5% level. *Significant at the 10% level.

Corporate Board: Role, Duties & Composition / Volume 6, Issue 1, 2010
16
TABLE 3. Consistency Tests of Risk Aversion Measures
Dependent variable:
Growth opportunities -0.083*
(-1.76)
-0.044
(-1.52)
Corporate diversification (=1) 1.068***
(3.57)
0.458***
(3.08)
Cash flow/Total assets 1.415***
(2.80)
0.380
(1.33)
Intercept 1.126 1.700
Adjusted 2R 0.123 0.066
All independent variables are measured pre-grant. Growth opportunities are measured by market-to-book of assets,
which is the sum of the market value of equity and the book value of debt divided by book total assets.
Corporate diversification is a binary variable where two or more reported operating segments classify a firm as
diversified. Cash flow is net cash flow from operations. All regressions are on panel data and are White-corrected
for heteroscedasticity.
***Significant at the 1% level. *Significant at the 10% level.

Corporate Board: Role, Duties & Composition / Volume 6, Issue 1, 2010
17
TABLE 4. HM Tests
Hypothesis #: H1 H2 H3 H4
Dependent variable: Pay-
performance
sensitivity/Risk
aversion
Risk aversion Private
diversification/
Risk aversion
ATM grant
(=1)
Estimation method: Least squares Least squares Least squares ML
N=168
Exercise price/stock
price
-0.176
(-1.02)
-0.311**
(-2.54)
-0.920
(-0.32)
Number of options
(millions)
0.341**
(2.03)
-2.215
(-1.45)
Risk aversion 0.180***
(2.976)
Private
diversification
-0.041**
(-2.32)
Intercept 1.110***
(4.16)
2.161***
(8.82)
15.297***
(4.25)
-0.826***
(-5.071)
Adjusted 2R 0.026 0.042 0.017
McFadden 2R 0.042
Pay-performance sensitivity is the option delta multiplied by the number of granted options. Risk aversion is
proxied in absolute terms by MRP/3.33σ2 where the market risk premium (MRP) is set at 5 per cent and σ is the
annualized standard deviation of stock returns estimated not less than 36 months prior to the grant date. Private
diversification is proxied by the index
TA
ownershipEquity
ownershipEquity 100 . ln , where TA is pre-grant total assets. For
the OLS regressions, t statistics are shown in parentheses, while for the logit regression the parenthesized numbers
are Wald statistics. An ATM grant occurs when the stock price at grant minus the exercise price, divided by the
stock price at grant is ≤ 5%. All regressions are on panel data with the White correction for heteroscedasticity
applied to the least squares regressions.
***Significant at the 1% level. **Significant at the 5% level.
*Significant at the 10% level.
Corporate Board: Role, Duties & Composition / Volume 6, Issue 1, 2010
18
TABLE 5. Grant CARs by Risk Aversion (ρ) and Grant Moneyness
Hypothesis #: H5A H5B
Grant moneyness:
ATM and OTM
n
mean
median
59
-0.013
-0.005
ITM
n
mean
median
43
0.005
0.002
ATM and ITM
n
mean
median
54
0.020***
0.010***
OTM
n
mean
median
12
-0.013***
-0.027***
Risk aversion is proxied in absolute terms by MRP/3.33σ2 where the market risk premium (MRP) is set at 5 per cent
and σ is the annualized standard deviation of stock returns estimated not less than 36 months prior to the grant date.
An in-the-money (ITM) grant occurs when exercise price on the grant date exceeds the stock price by 5 or more per
cent and an out-of-the-money (OTM) grant occurs when the stock price on the grant date exceeds the exercise price
by 5 or more per cent; else, the grant is classified as at-the-money (ATM). Cumulative abnormal returns (CARs)
are calculated using the standard market model. ***Significant at the 1% level.