Embed Size (px)
Citation preview

University of Nebraska at Omaha University of Nebraska at Omaha
DigitalCommons@UNO DigitalCommons@UNO
Journal Articles Department of Biomechanics
10-2011
Is There a Relationship Between Fatigue Questionnaires and Gait Is There a Relationship Between Fatigue Questionnaires and Gait
Mechanics in Persons With Multiple Sclerosis? Mechanics in Persons With Multiple Sclerosis?
Jessie M. Huisinga University of Nebraska at Omaha
Mary Filipi University of Nebraska Medical Center
Kendra K. Schmid University of Nebraska Medical Center
Nikolaos Stergiou University of Nebraska at Omaha, [email protected]
Follow this and additional works at: https://digitalcommons.unomaha.edu/biomechanicsarticles
Part of the Biomechanics Commons
Recommended Citation Recommended Citation Huisinga, Jessie M.; Filipi, Mary; Schmid, Kendra K.; and Stergiou, Nikolaos, "Is There a Relationship Between Fatigue Questionnaires and Gait Mechanics in Persons With Multiple Sclerosis?" (2011). Journal Articles. 103. https://digitalcommons.unomaha.edu/biomechanicsarticles/103
This Article is brought to you for free and open access by the Department of Biomechanics at DigitalCommons@UNO. It has been accepted for inclusion in Journal Articles by an authorized administrator of DigitalCommons@UNO. For more information, please contact [email protected].

*Title page with author details
Fatigue and gait mechanics in MS patients
IS THERE A RELATIONSHIP BETWEEN FATIGUE QUESTIONNAIRES AND GAIT
MECHANICS IN PERSONS WITH MULTIPLE SCLEROSIS?
Jessie M. Huisinga1, Mary L. Filipi
2, Kendra K. Schmid
3, Nicholas Stergiou
3, 4
1Department of Neurology
Oregon Health and Science University
NSI Building, Rm 1107
505 NW 185th Ave.
Beaverton, OR 97006
2 College of Nursing
University of Nebraska Medical Center
985330 Nebraska Medical Center
Omaha, NE 68198-5330
3 Department of Biostatistics
College of Public Health
University of Nebraska Medical Center
Omaha, NE 68198-7850, USA
4 Nebraska Biomechanics Core Facility
University of Nebraska at Omaha
6001 Dodge Street
Omaha, NE 68182, USA
Acknowledgements: Support for this work was provided by the American Society of
Biomechanics Grant-in-Aid and the Nebraska Research Initiative.
Corresponding Author: Dr. Jessie Huisinga

Fatigue and gait mechanics in MS patients
Department of Neurology

*Title page with author details
Oregon Health and Science University
NSI Building, Rm 1107
505 NW 185th Ave.
Beaverton, OR 97006 USA
Phone: 503-418-2603
Fax: 503-418-2701
Acknowledgements
Support for this work was provided by the American Society of Biomechanics Grant-in-Aid and
the Nebraska Research Initiative.
We certify that no party having a direct interest in the results of the research supporting this
article has or will confer a benefit on us or on any organization with which we are associated
AND, if applicable, we certify that all financial and material support for this research (eg, NIH or
NHS grants) and work are clearly identified in the title page of the manuscript.

Fatigue and gait mechanics in MS patients
Fatigue and gait mechanics in MS patients
1 Abstract
2 Objective: To evaluate the reported fatigue levels and gait deficits in Multiple Sclerosis (MS)
3 patients to determine the relationships that may exist between fatigue in MS patients and
4 alterations in gait mechanics.
5 Design: Cross-sectional
6 Setting: Biomechanics laboratory
7 Participants: Subjects with MS (n = 32) and age- and sex-matched controls (n = 30).
8 Interventions: None
9 Main Outcome Measures: Fatigue Severity Scale (FSS), Modified Fatigue Index Scale (MFIS),
10 and shortform SF-36 to assess fatigue and general health. Biomechanical gait analysis was
11 performed to measure peak joint torques and powers in the sagittal plane at the ankle, knee, and
12 hip. Correlations were performed between fatigue measures and degree of deficit within each MS
13 patient for each joint torque and power measure.
14 Results: FSS was significantly correlated with deficits in ankle power generation at late stance
15 and walking velocity. MFIS was significantly correlated with deficits in peak knee extensor
16 torque and in knee power absorption at early stance. SF-36 subscales were correlated with
17 several of the joint torque and power variables.
18 Conclusions: subjective fatigue rating scales alone should not be used as an indicator of motor
19 disability or of disease progression as it affects the walking performance of the MS patients
20 Key words: joint torque, joint power, general health, neurological disease

*Manuscript without author identifiers
21 Introduction
22 Fatigue is one of the most common symptoms of multiple sclerosis (MS). It is reported
23 by up to 90% of patients and is described as an increased weakness with exercise or as the day
24 progresses, as an abnormal constant and persistent sense of tiredness, or as fatigable weakness
25 exacerbated by activity or heat 1, 23
. Measurement of fatigue in MS patients is based primarily on
26 the patient’s own reports, and as a result, the measures are inherently subjective. Fatigue ratings
27 in MS patients may be affected by the individual’s performance self efficacy and altered sensory
28 input during activity. Also, ratings may be affected if an observer rates the fatigue based on
29 reports of decreased effort due to impaired motor control capabilities4.
30 Because fatigue is a subjectively reported symptom, there are currently no tests or
31 objective signs allowing the clinician to quantify its severity outside of fatigue related
32 questionnaires 5. Studies to investigate relationships between fatigue scores have reported weak
33 correlations and noted that fatigue is a multi-factorial symptom which may not be fully explained
34 by one fatigue scale or another1, 2
. Additionally, changes in fatigue ratings do not correlate with
35 changes in walking performance which led researchers to suggest monitoring reports of fatigue
36 with more objective measures6. Lack of correlation between fatigue ratings and walking
37 performance may exist because self-reported fatigue scales rely on subjective reporting by
38 patients and therefore cannot differentiate an inability to generate or maintain voluntary force
39 from an unwillingness to do so4.
40 MS fatigue symptoms are likely due to ‘central fatigue’ which indicates a problem with
41 the neural drive to sustain muscle force4. Neural drive is also required to facilitate walking and
42 thus is feasible to expect fatigue to be reflected as alterations in walking mechanics when MS
43 patients are compared to healthy controls. This association between specific reports of fatigue
44 and the gait mechanics of patients with MS has not previously been investigated.

Fatigue and gait mechanics in MS patients
45 The purpose of this study was to evaluate both the reported fatigue levels in MS patients
46 and these patients’ deficits in gait mechanics to determine whether relationships exist between
47 fatigue in MS patients and alterations in gait mechanics. It was hypothesized that since both
48 fatigue in MS patients and neural control of gait are mediated by supraspinal and spinal inputs 4,
49 7-9
, there would be a significant relationship between reported fatigue levels and the alterations in
50 gait mechanics of MS patients. Additionally, alterations in walking mechanics could lead to
51 increased metabolic cost and overall greater energy expenditure during walking 10, 11
. Thus,
52 persons with MS who have greater alterations in walking mechanics could have greater fatigue
53 levels. In addition to fatigue measures, general health measures were also investigated and
54 compared to gait measures to determine whether general health perceptions of MS patients are
55 related to gait mechanics. Because general health perceptions are likely influenced by fatigue
56 levels, it was hypothesized that general health perceptions are also related to deficits in gait
57 mechanics.
Fatigue and gait mechanics in MS patients
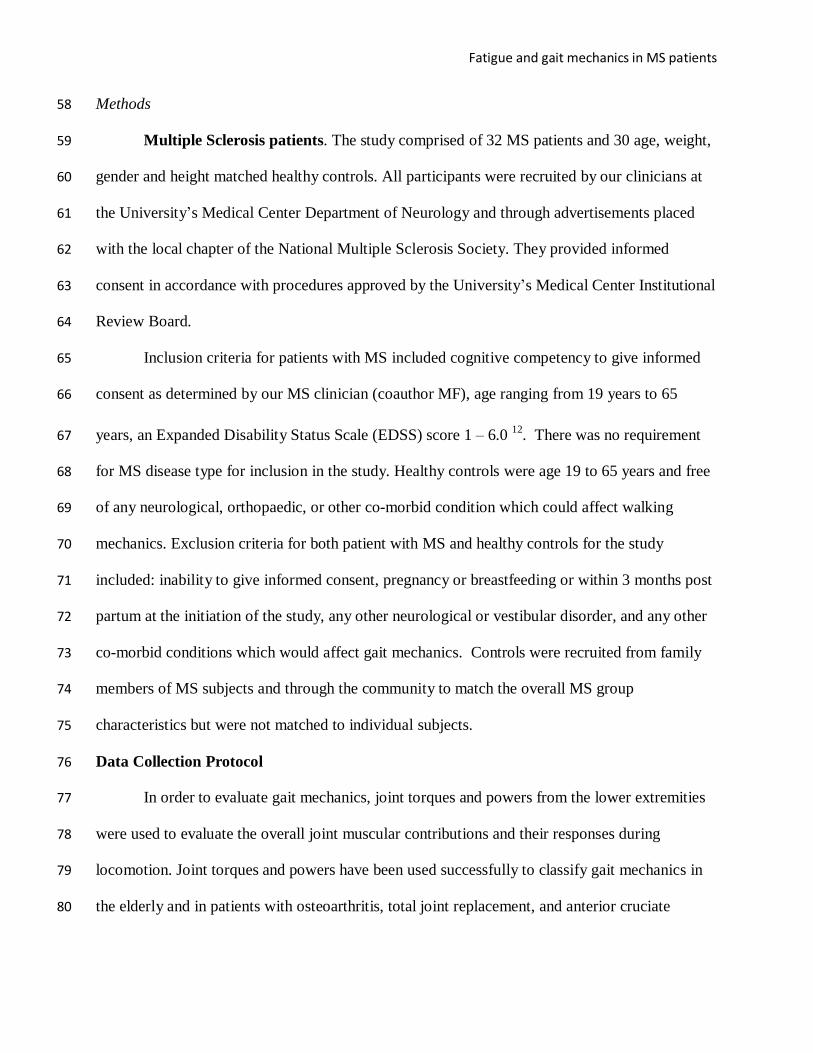
58 Methods
59 Multiple Sclerosis patients. The study comprised of 32 MS patients and 30 age, weight,
60 gender and height matched healthy controls. All participants were recruited by our clinicians at
61 the University’s Medical Center Department of Neurology and through advertisements placed
62 with the local chapter of the National Multiple Sclerosis Society. They provided informed
63 consent in accordance with procedures approved by the University’s Medical Center Institutional
64 Review Board.
65 Inclusion criteria for patients with MS included cognitive competency to give informed
66 consent as determined by our MS clinician (coauthor MF), age ranging from 19 years to 65
67 years, an Expanded Disability Status Scale (EDSS) score 1 – 6.0 12
. There was no requirement
68 for MS disease type for inclusion in the study. Healthy controls were age 19 to 65 years and free
69 of any neurological, orthopaedic, or other co-morbid condition which could affect walking
70 mechanics. Exclusion criteria for both patient with MS and healthy controls for the study
71 included: inability to give informed consent, pregnancy or breastfeeding or within 3 months post
72 partum at the initiation of the study, any other neurological or vestibular disorder, and any other
73 co-morbid conditions which would affect gait mechanics. Controls were recruited from family
74 members of MS subjects and through the community to match the overall MS group
75 characteristics but were not matched to individual subjects.
76 Data Collection Protocol
77 In order to evaluate gait mechanics, joint torques and powers from the lower extremities
78 were used to evaluate the overall joint muscular contributions and their responses during
79 locomotion. Joint torques and powers have been used successfully to classify gait mechanics in
80 the elderly and in patients with osteoarthritis, total joint replacement, and anterior cruciate

Fatigue and gait mechanics in MS patients
81 ligament deficiency 13-16
to make surgical decisions 17
, and to evaluate treatment outcomes in
82 pathological populations 18, 19
. For all data collections, the subjects (patients and controls)
83 arrived at the laboratory where informed consent was obtained. Next, anthropometric data of the
84 lower extremities was measured and reflective markers were placed according to anatomical
85 location 20
. Figure 1 shows the marker set-up from the frontal plane only. Subjects walked
86 through 10 meter walk-way equipped with an embedded force platform (Kistler 9281B, Kistler
87 Instrumentation Corporation, Amhurst, NY) and surrounded with an 8 camera Motion Analysis
88 system (Eagle system, Motion Analysis Corp., Santa Rosa, CA). Figure 2 shows a subject
89 walking with a foot striking the force platform. The subject walked through the walkway from
90 the determined starting position while
91 INSERT FIGURE 1 AND FIGURE 2
92 real-time marker position (60 Hz) and force platform (600 Hz) data was collected
93 simultaneously. Once the trial was completed, the MS patient rested for at least one minute. The
94 same process was then repeated at least four more times to obtain five good trials with the
95 subject’s footfall landing completely within the force plate without altering the stride. After five
96 successful trials, the other leg was collected using the same process. Participants typically
97 needed to complete a total of 15 walking trials in order to obtain 5 good trials on each side.
98 Finally, the MS patients completed two fatigue specific questionnaires and a general health
99 survey, the SF-36 questionnaire. These are described below.
100 Qualitative measures
101 Fatigue Severity Scale. The FSS is a method of evaluating fatigue in MS patients and in
102 other conditions including chronic fatigue immune dysfunction syndrome and systemic lupus
103 erythmatosis. The FSS is designed to differentiate fatigue from clinical depression, since both

Fatigue and gait mechanics in MS patients
104 share some of the same symptoms. The FSS questionnaire is comprised of nine statements
105 related to the patients’ subjective perception of fatigue and its consequences on everyday
106 activities. Patients are asked to rate their level of agreement (toward seven) or disagreement
107
108
(toward zero) with the nine statements. The FSS has been validated for use with MS patients
where the scale demonstrated high internal consistency with a Cronbach’s alpha of 0.81 21
.
109 Modified Fatigue Impact Scale. The MFIS is a modified form of the Fatigue Impact Scale
110 based on items derived from interviews with MS patients. The scale assesses the effect of fatigue
111
112
in terms of physical, cognitive, and psychosocial functioning with a 21-item questionnaire. The
MFIS has been validated for use with MS patients by Kos et al 22
who found the overall
113 Cronbach’s alpha was 0.9223, 0.8813 for the physical, 0.9219 for the cognitive and 0.6496 for
114 the psychosocial subscale.
115 Short form SF-36. Eight health domains are assessed with the SF-36: Physical Function,
116 limitation due to Physical Health, limitation due to Emotional Problems, Energy, Mental Health,
117
118
119
Bodily Pain, General Health, and Social Function. The SF-36 has been used extensively to
evaluate and differentiate between groups of varying health status 23, 24
and has previously been
used with MS patients 25, 26
.
120 Quantitative Measures
121 Joint Torques & Powers. During post processing, a low-pass second order Butterworth
122 digital filter with a 7 Hz cutoff frequency was used to smooth the marker trajectories.
123
124
Subsequently, the joint angles were calculated for the sagittal plane during the stance phase of
walking based on the methods of Vaughan et al 27
and Nigg et al 28
. Joint torques were then
125
126
calculated from the joint angles of the lower limb segments and the simultaneous ground reaction
forces produced based on inverse dynamics 29
. Joint powers were calculated based on the

Fatigue and gait mechanics in MS patients
127 resultant joint torques and the angular velocities of the limb segments. Calculation of joint
128 torques and powers was accomplished using custom made laboratory software generated in
129 Matlab (The MathWorks, Inc., Natick, MA).
130 The peak values for joint extensor and flexor torque, and joint power absorption and
131
132
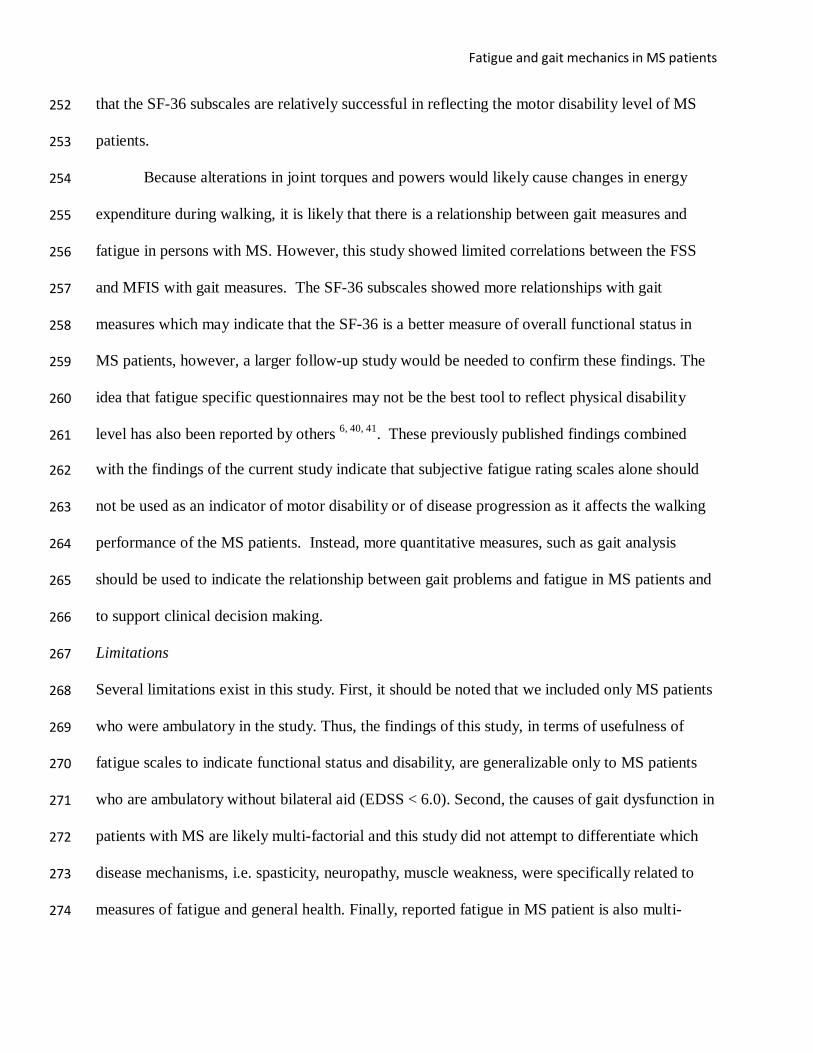
generation (Figures 3 and 4) were identified for the ankle, knee and hip joints during the stance
phase according to other gait studies on joint kinetics 13, 30-32
. To identify the difference between
133 MS patients and controls for the joint torques and powers, the value for each peak joint torque
134 and peak joint power variable (average from 5 trials) for each MS patient was subtracted from
135 the corresponding average value of the same variable from the healthy control group (Table 3).
136 For example, for each MS subject, the differenced joint torque and joint power variables were
137 calculated as:
138 d_APT = APTcontrol mean – APTMS subject
139 Because control subjects were recruited as a group and not matched to individual MS subjects,
140 this methodology allowed for identification of the differences between MS patients and the entire
141 control group rather than single control subjects.
142 INSERT FIGURE 3 HERE
143 INSERT FIGURE 4 HERE
144 Statistical Analysis
145 A sample of 30 MS patients and 30 matched controls yielded 80% power to detect an
146 effect size of 0.9 for differences in gait variables between the two groups. Independent t-tests
147 were used to compare demographic data for patients with MS to healthy controls. Pearson
148 correlations were performed between the scores for the FSS, MFIS, each of the eight SF-36
149 domains and each of the differenced joint torque and power parameters. All data was assessed

Fatigue and gait mechanics in MS patients
150 for normality (Q-Q plots) and found to be normally distributed. Analyses were performed using
151 SPSS 16.0 statistical software (SPSS Inc, Chicago, IL) with alpha equal with 0.05. Due to the
152
153
exploratory nature of this study, no adjustments were made for multiple comparisons.

Fatigue and gait mechanics in MS patients
154 Results
155 A total of 32 patients with MS and 30 healthy controls were included. The MS group and
156 healthy controls did not significantly differ in terms of age and mass. None of patients with MS
157 experienced a relapse of symptoms within 3 months of participating in the gait analysis. All of
158 the MS subjects were on disease modifying, but not on symptom modifying therapies. The mean
159 EDSS score for the MS group was 2.6 ± 0.7 which indicates a relatively mild level of motor
160 disability.
161 INSERT TABLE 1 HERE
162 The mean scores for the Fatigue Severity Scale (FSS), Modified Fatigue Impact Scale
163 (MFIS) and for each subscale of the SF-36 are listed in Table 2.
164 INSERT TABLE 2 HERE
165 The FSS showed a significant relationship only with walking velocity (Table 3) and peak
166 ankle power generation (A2) (Table 4). The MFIS showed a significant relationship only with
167 peak knee extensor torque (Table 3) and the peak knee power absorption (K1) (Table 4). The SF-
168 36 Physical Function subscale revealed a significant relationship with several parameters from
169 the joint torques (4 out of 6; Table 3) and joint powers (6 out of 8; Table 4). The Limitation due
170 to Emotional Problems and Social Function subscales each showed a significant relationship
171 with one joint torque (Table 3) and one joint power parameter (Table 4). The Limitation due to
172 Physical Function subscale showed a significant relationship with walking velocity (Table 3) and
173 with one joint power parameter (Table 4). The Energy subscale showed a significant relationship
174 with one joint power parameter (Table 4). The Bodily Pain subscale showed a significant
175 relationship with walking velocity (Table 3), two joint torque parameters (2 out of 6; Table 3)
176 and three joint power parameters (3 out of 8; Table 4).
177 INSERT TABLES 3 & 4 HERE

Fatigue and gait mechanics in MS patients
178 Importantly, all the significant relationships between the quantitative gait measures (joint
179
180
torques and powers) and the fatigue scales (FSS and MFIS) were small or medium (0.1 to 0.3
and 0.3 to 0.5, respectively) 33
. In contrast, the SF-36 physical function subscale revealed large
181 correlations (0.5 to 1.0) with walking velocity and with the joint torque and joint power
182
183
parameters (Table 3 and 4).

Fatigue and gait mechanics in MS patients
184 Discussion
185 This study outlines the relationship between reported fatigue levels and the deficits in
186 joint torques and powers during overground walking in MS patients. The FSS, which specifically
187 evaluates fatigue levels independent of depression, showed only two significant relationships
188 out of 15 (13.3%), indicating a limited relationship with the changes that occur in the gait
189 mechanics of patients with MS. The MFIS, which is an MS patient specific fatigue measure,
190 showed similar results with only two significant relationships out of 15 (13.3%). It was
191 hypothesized that fatigue and gait mechanics would reveal significant relationships because both
192
193
fatigue in MS patients and gait control. Because both gait and fatigue are affected by central
neural drive4, 7, 9
, it is expected that any alterations in gait mechanics would likely contribute to
194 fatigue. This hypothesis was shown to be only partially true with respect to the utilized fatigue
195 scales. With respect to SF-36, the Physical Function subscale and the Bodily Pain subscale both
196 showed relationships with the gait mechanics of patients with MS with 11 out of 15 (73.3%) and
197 6 out of 15 (40.0%) correlations, respectively, being significant. The larger number of significant
198 relationships with gait mechanics and the SF-36 subscales is partially in agreement with the
199 original hypothesis that general health perceptions would be related to gait deficit measures.
200 The lack of correlations between fatigue questionnaires (FSS and MFIS) and measures of
201 gait mechanics indicate that the use of fatigue questionnaires to infer information regarding MS
202 patient’s functional capability may be inappropriate. The SF-36 subscales focus more on specific
203 function areas and show stronger relationship with gait mechanics. Thus, we believe that it may
204 be possible to better represent the relationship between fatigue in MS patients and their gait
205 mechanics by expanding the fatigue questionnaires to incorporate the effects of fatigue on
206 specific areas of physical function as the SF-36 does.

Fatigue and gait mechanics in MS patients
207 The FSS was significantly and positively related with walking velocity (Table 3) and
208 with the joint power measure A2 (Table 4). Overall, the FSS focuses on the perception of fatigue
209 and its consequences on everyday activities, so the results indicate that the worse the MS
210 patient’s perception of fatigue was, the larger the differences in walking velocity and in power
211 generation at the ankle (A2) during late stance between the patients and the healthy controls. The
212 decrements in power generation at the ankle (A2) during late stance indicate that the MS patients
213 have difficulty propelling the trunk and the leg into the swing phase and indicate that the ankle
214
215
plantarflexors (soleus and gastrocnemius) are not providing sufficient power to accelerate the
trunk which would result in slower walking velocity 34
. The significant relationship between FSS
216 and walking velocity decrements in MS patients indicate that FSS is related primarily with the
217 mechanisms related to forward progression during walking. Decreased walking velocity and
218
219
220
decreased capability to maintain forward progression during walking could result in increased
energy expenditure during walking 35
and would likely affect performance on everyday activities
34, 36, causing increased overall fatigue, thus demonstrating a relationship between A2 and FSS
221 score.
222 The MFIS, which outlines the effect of fatigue in terms of physical, cognitive, and
223 psychosocial functioning, was correlated decreased power absorption at the knee (K1) and
224 extensor torque at the knee (KET) during early stance phase. The decreased power absorption at
225 the knee (K1) and extensor torque at the knee (KET) indicate that MS patients have difficulty
226
227
during weight acceptance in single stance and are not able to generate the necessary extensor
activity to eccentrically absorb power at the knee (negative muscle) during early stance35
. Loss
228
229
of the high efficiency negative work at the knee could result in increased metabolic energy
expenditure during gait35
and a larger metabolic cost of walking for patients with MS. Because

Fatigue and gait mechanics in MS patients
230 MFIS shows a significant relationship with the amount of negative work being performed at the
231 knee during early stance, we can speculate that the MFIS is related mostly with the overall
232 energy expenditure of patients with MS during walking.
233 MS patients may be likely to perceive fatigue levels as higher since their ability to
234 maintain forward progression is diminished and overall metabolic cost is likely increased during
235 walking. To maintain forward progression an increase in the frequency of muscle firing would be
236
237
238
necessary, but this could be difficult to maintain for an MS patient due to demyelination of nerve
fiber and conduction block seen in structurally intact axons 37
. This conduction block is proposed
as the primary causation of fatigue in MS patients seen during voluntary effort 4. The
239 correlations between FSS, MFIS, and the specified joint power measures may be a reflection of
240 the theorized primary causation of fatigue in MS patients.
241 Finally, the SF-36 subscales for Physical Function and Bodily Pain, which measure
242 overall perceptions of general health, both had negative correlations with joint parameters which
243 indicate that as differences in the gait measures between MS patients and healthy controls
244 increased, the perception of physical function capability decreased in MS patients and the
245
246
perceptions of bodily pain increased in MS patients. These results are not surprising since Motl
et al 38
reported that worsening MS symptoms have a direct negative relationship with self-
247 efficacy and physical activity; hence any changes in actual physical capability levels (reflected
248 here by joint torques and powers) would also be related to perception of physical function. The
249
250
same investigators also reported that with worsening of symptoms, including an increase in
bodily pain, there is a significant decrease in levels of physical activity and physical function39
.
251 Because these scales are significantly related with several of the gait measures, it is fair to report
Fatigue and gait mechanics in MS patients
252 that the SF-36 subscales are relatively successful in reflecting the motor disability level of MS
253 patients.
254 Because alterations in joint torques and powers would likely cause changes in energy
255 expenditure during walking, it is likely that there is a relationship between gait measures and
256 fatigue in persons with MS. However, this study showed limited correlations between the FSS
257 and MFIS with gait measures. The SF-36 subscales showed more relationships with gait
258 measures which may indicate that the SF-36 is a better measure of overall functional status in
259 MS patients, however, a larger follow-up study would be needed to confirm these findings. The
260
261
idea that fatigue specific questionnaires may not be the best tool to reflect physical disability
level has also been reported by others 6, 40, 41
. These previously published findings combined
262 with the findings of the current study indicate that subjective fatigue rating scales alone should
263 not be used as an indicator of motor disability or of disease progression as it affects the walking
264 performance of the MS patients. Instead, more quantitative measures, such as gait analysis
265 should be used to indicate the relationship between gait problems and fatigue in MS patients and
266 to support clinical decision making.
267 Limitations
268 Several limitations exist in this study. First, it should be noted that we included only MS patients
269 who were ambulatory in the study. Thus, the findings of this study, in terms of usefulness of
270 fatigue scales to indicate functional status and disability, are generalizable only to MS patients
271 who are ambulatory without bilateral aid (EDSS < 6.0). Second, the causes of gait dysfunction in
272 patients with MS are likely multi-factorial and this study did not attempt to differentiate which
273 disease mechanisms, i.e. spasticity, neuropathy, muscle weakness, were specifically related to
274 measures of fatigue and general health. Finally, reported fatigue in MS patient is also multi-

Fatigue and gait mechanics in MS patients
275 factorial. Specific medication, sleep patterns, and overall lifestyle influences may affect reports
276 of fatigue. By utilizing fatigue rating scales that are well established for use with patients who
277 have MS, this study did not seek to specify the sources of reported fatigue but only the relative
278 MS fatigue rating and whether those ratings were related to objective and reliable measures of
279 walking performance.

Fatigue and gait mechanics in MS patients
280 References
281 1. Flachenecker P, Kumpfel T, Kallmann B, Gottschalk M, Grauer O, Rieckmann P, et al.
282 Fatigue in multiple sclerosis: A comparison of different rating scales and correlation to clinical
283 parameters. Mult Scler 2002;8:523-6.
284 2. Freal JE, Kraft GH, Coryell JK. Symptomatic fatigue in multiple sclerosis. Arch Phys Med
285 Rehabil 1984;65:135-8.
286 3. Krupp LB, Christodoulou C. Fatigue in multiple sclerosis. Curr Neurol Neurosci Rep
287 2001;1:294-8.
288 4. Vucic S, Burke D, Kiernan MC. Fatigue in multiple sclerosis: Mechanisms and management.
289 Clin Neurophysiol 2010.
290 5. Morrow SA, Weinstock-Guttman B, Munschauer FE, Hojnacki D, Benedict RH. Subjective
291 fatigue is not associated with cognitive impairment in multiple sclerosis: Cross-sectional and
292 longitudinal analysis. Mult Scler 2009;15:998-1005.
293 6. Morris ME, Cantwell C, Vowels L, Dodd K. Changes in gait and fatigue from morning to
294 afternoon in people with multiple sclerosis. J Neurol Neurosurg Psychiatry 2002;72:361-5.
295 7. Beres-Jones JA, Harkema SJ. The human spinal cord interprets velocity-dependent afferent
296 input during stepping. Brain 2004;127:2232-46.
297 8. Harkema SJ. Plasticity of interneuronal networks of the functionally isolated human spinal
298 cord. Brain Res Rev 2008;57:255-64.
299 9. Courtine G, Song B, Roy RR, Zhong H, Herrmann JE, Ao Y, et al. Recovery of supraspinal
300 control of stepping via indirect propriospinal relay connections after spinal cord injury. Nat Med
301 2008;14:69-74.

Fatigue and gait mechanics in MS patients
302 10. Siegel KL, Kepple TM, Stanhope SJ. Joint moment control of mechanical energy flow during
303 normal gait. Gait Posture 2004;19:69-75.
304 11. Donelan JM, Kram R, Kuo AD. Mechanical work for step-to-step transitions is a major
305 determinant of the metabolic cost of human walking. J Exp Biol 2002;205:3717-27.
306 12. Kurtzke JF. Rating neurologic impairment in multiple sclerosis: An expanded disability
307 status scale (EDSS). Neurology 1983;33:1444-52.
308 13. Kerrigan DC, Lee LW, Nieto TJ, Markman JD, Collins JJ, Riley PO. Kinetic alterations
309 independent of walking speed in elderly fallers. Arch Phys Med Rehabil 2000;81:730-5.
310 14. Landry SC, McKean KA, Hubley-Kozey CL, Stanish WD, Deluzio KJ. Knee biomechanics
311 of moderate OA patients measured during gait at a self-selected and fast walking speed. J
312 Biomech 2007;40:1754-61.
313 15. Ristanis S, Stergiou N, Patras K, Tsepis E, Moraiti C, Georgoulis AD. Follow-up evaluation
314 2 years after ACL reconstruction with bone-patellar tendon-bone graft shows that excessive tibial
315 rotation persists. Clin J Sport Med 2006;16:111-6.
316 16. Saari T, Tranberg R, Zugner R, Uvehammer J, Karrholm J. Changed gait pattern in patients
317 with total knee arthroplasty but minimal influence of tibial insert design: Gait analysis during
318 level walking in 39 TKR patients and 18 healthy controls. Acta Orthop 2005;76:253-60.
319 17. Joseph B. Quantitative gait analysis in the treatment of children with cerebral palsy. J Pediatr
320 Orthop 2007;27:718,9; author reply 719-20.
321 18. Georgoulis AD, Ristanis S, Chouliaras V, Moraiti C, Stergiou N. Tibial rotation is not
322 restored after ACL reconstruction with a hamstring graft. Clin Orthop Relat Res 2007;454:89-94.

Fatigue and gait mechanics in MS patients
323 19. Ristanis S, Stergiou N, Patras K, Vasiliadis HS, Giakas G, Georgoulis AD. Excessive tibial
324 rotation during high-demand activities is not restored by anterior cruciate ligament
325 reconstruction. Arthroscopy 2005;21:1323-9.
326 20. Houck J, Yack HJ, Cuddeford T. Validity and comparisons of tibiofemoral orientations and
327 displacement using a femoral tracking device during early to mid stance of walking. Gait Posture
328 2004;19:76-84.
329 21. Krupp LB, LaRocca NG, Muir-Nash J, Steinberg AD. The fatigue severity scale. application
330 to patients with multiple sclerosis and systemic lupus erythematosus. Arch Neurol 1989;46:1121-
331 3.
332 22. Kos D, Kerckhofs E, Carrea I, Verza R, Ramos M, Jansa J. Evaluation of the modified
333 fatigue impact scale in four different european countries. Mult Scler 2005;11:76-80.
334 23. Garratt AM, Ruta DA, Abdalla MI, Buckingham JK, Russell IT. The SF36 health survey
335 questionnaire: An outcome measure suitable for routine use within the NHS? BMJ
336 1993;306:1440-4.
337 24. Ware JE,Jr, Sherbourne CD. The MOS 36-item short-form health survey (SF-36). I.
338 conceptual framework and item selection. Med Care 1992;30:473-83.
339 25. Hopman WM, Coo H, Pavlov A, Day AG, Edgar CM, McBride EV, et al. Multiple sclerosis:
340 Change in health-related quality of life over two years. Can J Neurol Sci 2009;36:554-61.
341 26. Nogueira LA, Nobrega FR, Lopes KN, Thuler LC, Alvarenga RM. The effect of functional
342 limitations and fatigue on the quality of life in people with multiple sclerosis. Arq Neuropsiquiatr
343 2009;67:812-7.
344 27. Vaughan CL, Davis BL, O'Connor JJ. Dynamics of human gait: 2nd ed. 2nd ed. Cape Town,
345 South Africa: Kiboho Publishers; 1992.

Fatigue and gait mechanics in MS patients
346 28. Nigg BM, Cole GK, Nachbauer W. Effects of arch height of the foot on angular motion of
347 the lower extremities in running. J Biomech 1993;26:909-16.
348 29. Winter DA. Biomechanics and motor control of human movement. 3rd ed. Hoboken, New
349 Jersey: John Wiley & Sons, Inc.; 2005.
350 30. DeVita P, Hortobagyi T. Age causes a redistribution of joint torques and powers during gait.
351 J Appl Physiol 2000;88:1804-11.
352 31. Graf A, Judge JO, Ounpuu S, Thelen DG. The effect of walking speed on lower-extremity
353 joint powers among elderly adults who exhibit low physical performance. Arch Phys Med
354 Rehabil 2005;86:2177-83.
355 32. Winter DA, Patla AE, Frank JS, Walt SE. Biomechanical walking pattern changes in the fit
356 and healthy elderly. Phys Ther 1990;70:340-7.
357 33. Cohen J. Statistical power analysis for the behavioral sciences 2nd ed. New York City:
358 Routledge Academic; 1988.
359 34. Neptune RR, Kautz SA, Zajac FE. Contributions of the individual ankle plantar flexors to
360 support, forward progression and swing initiation during walking. J Biomech 2001;34:1387-98.
361 35. Sawicki GS, Lewis CL, Ferris DP. It pays to have a spring in your step. Exerc Sport Sci Rev
362 2009;37:130-8.
363 36. Judge JO, Davis RB,3rd, Ounpuu S. Step length reductions in advanced age: The role of
364 ankle and hip kinetics. J Gerontol A Biol Sci Med Sci 1996;51:M303-12.
365 37. Kaji R. Physiology of conduction block in multifocal motor neuropathy and other
366 demyelinating neuropathies. Muscle Nerve 2003;27:285-96.

Fatigue and gait mechanics in MS patients
367 38. Motl RW, McAuley E, Wynn D, Suh Y, Weikert M, Dlugonski D. Symptoms and physical
368 activity among adults with relapsing-remitting multiple sclerosis. J Nerv Ment Dis
369 2010;198:213-9.
370 39. Motl RW, Arnett PA, Smith MM, Barwick FH, Ahlstrom B, Stover EJ. Worsening of
371 symptoms is associated with lower physical activity levels in individuals with multiple sclerosis.
372 Mult Scler 2008;14:140-2.
373 40. Romani A, Bergamaschi R, Candeloro E, Alfonsi E, Callieco R, Cosi V. Fatigue in multiple
374 sclerosis: Multidimensional assessment and response to symptomatic treatment. Mult Scler
375 2004;10:462-8.
376 41. Koch M, Uyttenboogaart M, van Harten A, Heerings M, De Keyser J. Fatigue, depression
377
378
379
and progression in multiple sclerosis. Mult Scler 2008;14:815-22.

Fatigue and gait mechanics in MS patients
380 Figure Legends
381 Figure 1: Marker set from the frontal plane
382 Figure 2: A subject walking with one foot striking the force platform
383 Figure 3: Joint Torque figures which identify the gait variables used
384
385
Figure 4: Joint Power figures which identify the gait variables used

Fatigue and gait mechanics in MS patients
1 Tables
2 Table 1: Demographic information of study participants. P-value is indicated for independent t-
3 test between groups.
MS Patients Healthy Controls
(n = 32) (n = 30)
Sex 5 male, 27 female 8 male; 22 female
Age 46.3 ± 10.8 yrs 41.4 ± 12.2 yrs p = 0.097
EDSS 2.6 ± 0.7 -
Height (cm) 165.0 ± 6.7 170.6 ± 11.2 p = 0.021
Mass (kg) 79.9 ± 18.5 76.9 ± 18.5 p = 0.535
4
5

Table
6 Table 2: Averaged scores for each fatigue scale and for each component of the Medical
7 Outcomes Short Form 36 Health Survey (SF-36) for MS patients.
Questionnaire Scale Fatigue Severity
MS patient score
mean ± SD
Scale 4.6 ± 1.5
Modified Fatigue
Impact Scale
SF-36
42.3 ± 15.4
Physical function 57.8 ± 23.6
Limitation due to
Physical Function
Limitation due to
Emotional Problems
43.0 ± 36.1
46.8 ± 43.0
Energy 46.4 ± 22.5
Mental Health 65.0 ± 22.0
Social Function 61.9 ± 27.3
Bodily Pain 65.4 ± 22.9
General Health 50.3 ± 20.6
8

FSS *0.35 (.049) 0.22 0.31 0.30 0.09 0.26 0.02
MFIS 0.34 0.20 0.14 *0.37 (.038) -0.03 0.16 -0.09
SF-36
Physical function *-0.70 (.000) *-0.54 (.002) *-0.51 (.003) *-0.69 (.000) -0.15 -0.22 *-0.39 (.029)
Limitation due to
Physical Function *-0.35 (.050)
-0.09 -0.09 -0.26 0.21 -0.070 -0.02
Limitation due to
motional Problems -0.11 0.04 -0.22 *-0.36 (.041) 0.32 -0.12 -0.16
Energy 0.05 0.06 0.18 -0.13 0.23 -0.12 0.16
Mental Health 0.13 0.04 0.12 -0.23 0.32 -0.06 0.31
Social Function -0.15 -0.08 -0.08 *-0.37 (.038) 0.10 -0.01 0.05
Bodily Pain *-0.46 (.008) *-0.37 (.037) -0.26 *-0.45 (.011) -0.15 -0.03 -0.13
General Health -0.11 -0.100 -0.08 -0.13 0.07 -0.10 0.16
9 Table 3: Correlation matrix between quantitative parameters of gait mechanics (joint torques) and the qualitative self-
10 perceived measures of fatigue (Fatigue Severity Scale, Modified Fatigue Impact Scale) and functional status (SF-36) of MS
11 patients. Pearson correlation values are reported.
Qualitative Measure Quantitative Measure
d_Velocity d_ADT d_APT d_KET d_KFT d_HET d_HFT
E
12 SF-36: Medical Outcomes Survey Short Form 36 Health Survey.
13 *Significant correlations (p -value).
14 d_Velocity – difference in walking velocity; d_ADT - difference in Peak ankle dorsiflexion moment during early stance; d_APT -
15 difference in Peak ankle plantarflexion moment during late stance; d_KFT - difference in Peak knee flexion moment during stance;
16 d_KET - difference in Peak knee extension moment during stance; d_HFT - difference in Peak hip flexion moment during late stance;
17 d_HET - difference in Peak hip extension moment during early stance.

FSS 0.25 0.42 (.010) 0.28 0.27 0.31 0.31 0.07 0.00
MFIS 0.31 0.32 0.35 (.048) 0.33 0.11 0.21 0.07 0.10
SF-36
Physical function -0.38(.033) -0.69 (.000) -0.62 (.000) -0.42 (.017) -0.43 (.015) -0.11 -0.56(.001) 0.09
Limitation due to
Physical Function -0.10
-0.23 -0.24 -0.37 (.035) -0.29 -0.17 -0.10 -0.17
Limitation due to
motional Problems -0.11 -0.28 -0.29 -0.45 (.009) -0.19 -0.04 -0.28 -0.22
Energy -0.09 -0.01 -0.08 -0.37 (.037) -0.15 -0.03 0.06 -0.24
Mental Health -0.06 0.01 -0.11 -0.22 -0.02 -0.10 0.05 -0.04
Social Function -0.18 -0.22 -0.34 -0.38 (.030) -0.24 -0.09 -0.12 -0.32
Bodily Pain -0.32 -0.48 (.005) -0.50 (.003) -0.39 (.026) -0.14 -0.13 -0.27 0.14
General Health -0.01 -0.20 -0.11 -0.04 -0.06 -0.15 -0.05 0.04
18 Table 4: Correlation matrix between quantitative parameters of gait mechanics (joint powers) and the qualitative self-
19 perceived measures of fatigue (Fatigue Severity Scale, Modified Fatigue Impact Scale) and functional status (SF-36) of MS
20 patients. Pearson correlation values are reported.
Qualitative Measure Quantitative Measure
d_A1 d_A2 d_K1 d_K2 d_K3 d_H1 d_H2 d_H3
E
21 SF-36: Medical Outcomes Survey Short Form 36 Health Survey.
22 *Significant correlations (p -value).
23 d_A1 - difference in Peak ankle power absorption in early stance; d_A2 - difference in Peak ankle power generation in late stance;
24 d_K1 - difference in Peak knee power absorption in early stance; d_K2 - difference in Peak knee power generation in mid-stance;
25 d_K3 - difference in Peak knee power absorption in late stance; d_H1 - difference in Peak hip power generation in early stance; d_H2
26 - difference in Peak hip power absorption in late mid-stance; d_H3 - difference in Peak hip power generation in late stance.

Figure 1: Marker set
from the frontal plane
Figure 2: A subject walking with one
foot striking the force platform

Figure
Jo
int
To
rq
ue
(N
*m
/kg
) J
oin
t T
orq
ue
(N
*m
/kg
) J
oin
t T
orq
ue (
N*
m/k
g)
1.4
1.2
1
Ankle APT
0.8
0.6
0.4
0.2
0
-0.2
-0.4
0.7
0.5
KET
ADT
Knee
0.3
0.1
-0.1
KFT
-0.3
0.6
0.4
HET
Hip
0.2
0
-0.2
-0.4
-0.6
-0.8
-1
HFT 0 10 20 30 40 50 60 70 80 90 100
% Stance Phase
Figure 3: Joint Torque figures which identify
the gait variables used
Jo
int
Po
wer (
Wa
tts/k
g)
Jo
int
Po
wer (
Wa
tts/k
g)
Jo
int
Po
wer (
Wa
tts/
kg
)
3.2
2.7
Ankle A2
2.2
1.7
1.2
0.7
0.2
-0.3
-0.8
0.4
0.2
A1
Knee
K2
0
-0.2
-0.4
-0.6
-0.8
0.5
K1 K3
H1 Hip H3
0
-0.5
-1 H2
-1.5
-2
0 10 20 30 40 50 60 70 80 90 100
% Stance Phase
Figure 4: Joint Power figures which identify the
gait variables used