Embed Size (px)
Citation preview

Is there a close association between ‘soils’ and ‘vegetation’? A case study from central western New South Wales
M.O. Rankin1, 3, W.S Semple2, B.W. Murphy1 and T.B. Koen1
1 Department of Natural Resources, PO Box 445, Cowra, NSW 2794, AUSTRALIA 2 Department of Natural Resources, PO Box 53, Orange, NSW 2800, AUSTRALIA
3 Corresponding author, email: [email protected]
Abstract: The assumption that ‘soils’ and ‘vegetation’ are closely associated was tested by describing soils and vegetation along a Travelling Stock Reserve west of Grenfell, New South Wales (lat 33° 55’S, long 147° 45’E). The transect was selected on the basis of (a) minimising the effects of non-soil factors (human interference, climate and relief) on vegetation and (b) the presence of various soil and vegetation types as indicated by previous mapping. ‘Soils’ were considered at three levels: soil landscapes (a broad mapping unit widely used in central western NSW), soil types (according to a range of classifications) and soil properties (depth, pH, etc.). ‘Vegetation’ was considered in three ways: vegetation type (in various classifications), density/floristic indices (density of woody species, abundance of native species, etc.) and presence/absence of individual species. Sites along the transect were grouped according to soil landscapes or soil types and compared to vegetation types or indices recorded at the sites.
Various measures indicated low associations between vegetation types and soil landscapes or soil types. Except for infrequent occurrences of a soil type or landscape, any one soil type or landscape was commonly associated with a number of vegetation types and any one vegetation type was associated with a number of soil landscapes or soil types. However, significant associations between some vegetation indices, mainly density or numbers of woody species, and some soil landscapes and soil types were evident. Although many species were relatively ubiquitous, some groups of species that were restricted to one or two soil types were identified. Canonical Correspondence Analysis provided some suggestions as to which properties (e.g. texture) of these soils were associated with the presence of particular species.
Cunninghamia (2007) 10(2): 199–214
Introduction
As soils are the most common terrestrial substrate for plant growth, it would seem logical that their properties (texture, structure, depth, nutrient status, etc.) would have a major influence over which species become established and persist thus on the structure and floristics of the vegetation at any site. Soils and vegetation are also theoretically dependent on the same independent factors: parent material, topography, climate, organism-availability and time.
Dominant plants, especially eucalypt species, were reported (Bower et al. 2002) to have guided the early settlers in their selection of suitable lands (‘soils’) for grazing and/or agriculture in central western New South Wales (NSW). Vegetation has also been used by soil surveyors as a guide to soil type (Chapman and Atkinson 2000). It is therefore surprising that following an extensive survey of soils and vegetation in western NSW, Beadle (1948, p. 49) reported:
“While it is true that climate partly determines not only the soil characters (parent material in western New South Wales, at least, plays an equally important
part) but also the nature of the vegetation, the relationships that exist between the vegetation and the soil are so ill-defined that to use one as an indicator of the other (except in a very broad sense) will lead to a misrepresentation of the true conditions.”
Vegetation types, he claimed, reflected water availability, which is mainly a function of rainfall and soil texture with the latter being mainly a function of parent material. He did, however, report relationships between some species and soil properties (texture, pH and drainage). By contrast, Moore (1953) reported a close relationship between Great Soil Groups and vegetation alliances in the Riverina district further to the east.
It could be argued that some natural associations between plant and soils may have been obliterated by the activities of European man. Direct effects include the deliberate replacement of one vegetation type by clearing and/or changed grazing regimes, and soil compaction by introduced herbivores leading to increased runoff to depressions (and a more assured water supply for early settlers; Heathcote 1965, p. 26). Indirect effects include the local extinction of

200 Cunninghamia 10(2): 2007 Rankin, Semple, Murphy & Koen, ‘Soils’ and ‘vegetation’— A case study from central western NSW
ground-foraging marsupials that were believed to have an important role in rainfall infiltration and nutrient cycling (Martin 2001). In many cases, changes were brought about inadvertently during drought when overgrazing or cultivation led to soil erosion and/or permanent changes in the composition of vegetation. Other examples of the effects of these predominantly European introductions on soils are provided by Russell and Isbell (1986), and on vegetation by Anderson (1941) and Benson (1991). However, the nature of the pre-European settlement vegetation and particularly the role of fire in its maintenance have been the subject of heated debate (e.g. Griffiths 2001).
Nevertheless there are reasons why vegetation and its component species may not be related to soil type. For example, within the one climatic zone, changes in microclimate due to altitude, aspect and the presence of ‘frost hollows’ could be associated with a change in vegetation. Diagrammatic cross sections showing changes in vegetation with slope, aspect and altitude suggest an independence between soils and vegetation. However, this is not always the case. Moore’s (1953) Figure 9 indicates changes in dominant trees with increasing altitude and on different aspects in hilly country in the south-east Riverina but also indicates commensurate changes in the degree of soil development at different altitudes and aspects.
Major changes in vegetation and/or floristic assemblages across climatic zones, e.g. Prober & Thiele (2004) in NSW, and between widely separated areas within the temperate zone (e.g. south-western Western Australia v. south-eastern NSW) also suggest an independence of soils and vegetation – unless of course, soils also change across these distances. The main issue here is species availability. Even within the one climatic zone, propagules of some species are not available to all soils that could support that species. For example, Eucalyptus albens1•, which occurs on a range of soil types, has disjunct populations across its southern range, particularly in Victoria and South Australia, though they may have been continuous in the past.
At the specific site level, the association between vegetation and soil (as well as topography, microclimate, etc.) is unique but this is not what is meant when it is asserted that soils and vegetation are closely associated. The latter implies that when ‘soils’ and ‘vegetation’ are classified in some way, then ‘soil group A’ is consistently associated with ‘vegetation group X’. The nature of the relationship may be very specific, i.e. that A and X always occur together and never with other groups; but looser associations are also implied, e.g. that soil A is associated with vegetation X in some (perhaps climatic) areas but with Y in others. To test the strength of these associations in any particular region it is necessary to classify the soils and vegetation but soils and vegetation (and component plants) can be classified in a variety of ways and
• Botanic nomenclature follows that of Wheeler et al. (2002), Harden (1990–93) and subsequent usage by the Royal Botanic Gardens Sydney.
associations may be stronger with some classifications than with others.
One of the broadest taxonomic units used in soil mapping is the soil landscape, “.. a characteristic landform pattern with one or more soil taxonomic units occurring in a related sequence. It is often associated with the physiographic features of the landscape…” (Chapman & Atkinson 2000, p. 111). Hence, the area encompassed by any one soil landscape commonly contains more than one soil type. An additional source of heterogeneity in some soil landscapes is the presence of defined sub-units such as drainage lines. Heterogeneity is further increased in practice because small areas of soil landscapes within larger areas of another cannot be shown at small mapping scales such as 1: 250 000.
At a finer scale, soil types are groups of soils that have one or more properties in common. Depending on the perceived importance of individual soil properties and their location within the soil profile, a soil can be classified in a number of ways. In the field survey described below, three standard classifications were used: Great Soil Groups (Stace et al. 1968), the Australian Soil Classification (Isbell 1996) and Principal Profile Forms (Northcote 1979), as well as groups of the latter as described by Northcote et al. (1975). As these generalist classifications may not reflect local conditions, soils described in the survey were also grouped using a local classification devised by one of the authors [BWM].
Vegetation can be classified in a multitude of ways and formalised systems of doing so have (as with soils) changed over the years. No one system is universally adopted by vegetation surveyors but one based on structure and dominant or diagnostic species as described by Walker and Hopkins (1990) has general acceptance. Local classifications based on presence/absence or abundance of individual species can be generated using cluster analysis. Both methods of classification were used in the survey.
To adequately test the hypothesis that ‘soils’ and ‘vegetation’ are closely associated in the field , it is necessary to limit the role of non-soil factors likely to influence the composition of vegetation, i.e. organism-availability, time since disturbance, climate and topography. This can be done by selecting a relatively small area in which organism-availability and climate are likely to be uniform, where remnant vegetation in good condition is present, where changes in topography and relief are low, and where soils are known to vary widely. Maps of woody vegetation can be used to locate potentially useful stands of native vegetation; and soil landscape maps can be used to assess likely soil variability.
Cunninghamia 10(2): 2007 Rankin, Semple, Murphy & Koen, ‘Soils’ and ‘vegetation’— A case study from central western NSW 201
Four hypotheses, from the general to the specific, were tested:
1. Soil landscapes are consistently associated with particular vegetation types.
2. Soil types are consistently associated with particular vegetation types.
3. Soil types are consistently associated with presence/ absence of plant species.
4. Soil properties (pH, colour, structure, etc.) are consistently associated with the presence/absence of plant species.
Methods
Site selection
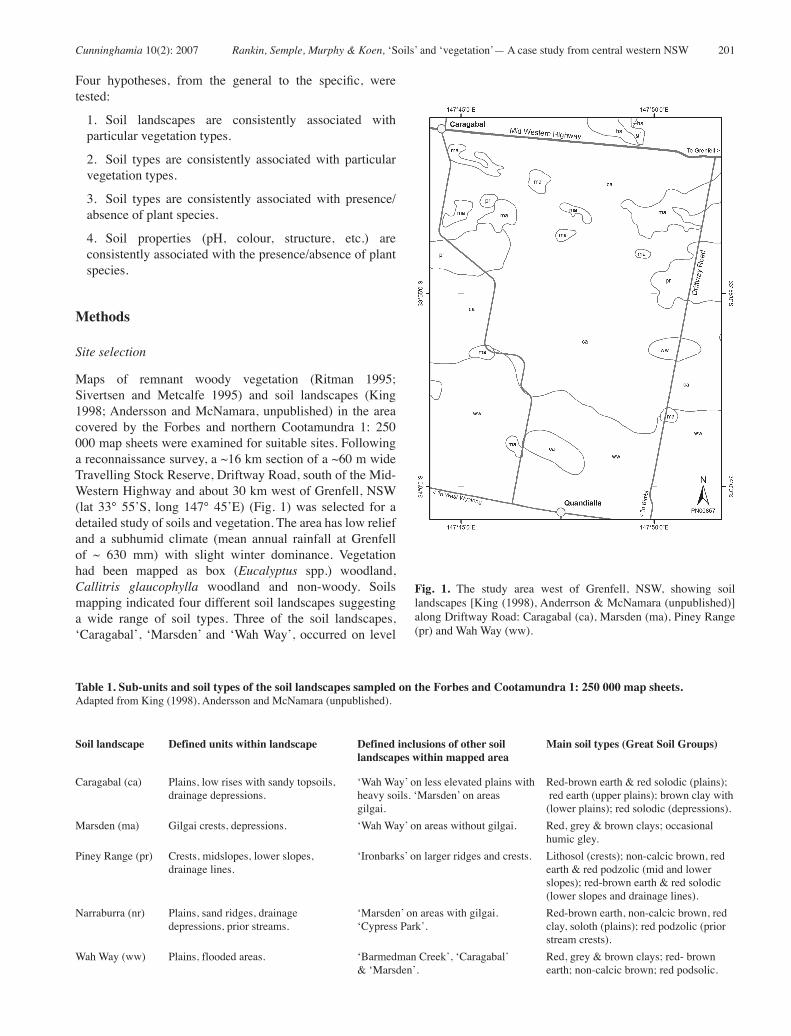
Maps of remnant woody vegetation (Ritman 1995; Sivertsen and Metcalfe 1995) and soil landscapes (King 1998; Andersson and McNamara, unpublished) in the area covered by the Forbes and northern Cootamundra 1: 250 000 map sheets were examined for suitable sites. Following a reconnaissance survey, a ~16 km section of a ~60 m wide Travelling Stock Reserve, Driftway Road, south of the Mid-Western Highway and about 30 km west of Grenfell, NSW (lat 33° 55’S, long 147° 45’E) (Fig. 1) was selected for a detailed study of soils and vegetation. The area has low relief and a subhumid climate (mean annual rainfall at Grenfell of ~ 630 mm) with slight winter dominance. Vegetation had been mapped as box (Eucalyptus spp.) woodland, Callitris glaucophylla woodland and non-woody. Soils mapping indicated four different soil landscapes suggesting a wide range of soil types. Three of the soil landscapes, ‘Caragabal’, ‘Marsden’ and ‘Wah Way’, occurred on level
Fig. 1. The study area west of Grenfell, NSW, showing soil landscapes [King (1998), Anderrson & McNamara (unpublished)] along Driftway Road: Caragabal (ca), Marsden (ma), Piney Range (pr) and Wah Way (ww).
Table 1. Sub-units and soil types of the soil landscapes sampled on the Forbes and Cootamundra 1: 250 000 map sheets. Adapted from King (1998), Andersson and McNamara (unpublished).
Soil landscape Defined units within landscape Defined inclusions of other soil Main soil types (Great Soil Groups) landscapes within mapped area
Caragabal (ca) Plains, low rises with sandy topsoils, ‘Wah Way’ on less elevated plains with Red-brown earth & red solodic (plains); drainage depressions. heavy soils. ‘Marsden’ on areas red earth (upper plains); brown clay with gilgai. (lower plains); red solodic (depressions).Marsden (ma) Gilgai crests, depressions. ‘Wah Way’ on areas without gilgai. Red, grey & brown clays; occasional humic gley. Piney Range (pr) Crests, midslopes, lower slopes, ‘Ironbarks’ on larger ridges and crests. Lithosol (crests); non-calcic brown, red drainage lines. earth & red podzolic (mid and lower slopes); red-brown earth & red solodic (lower slopes and drainage lines). Narraburra (nr) Plains, sand ridges, drainage ‘Marsden’ on areas with gilgai. Red-brown earth, non-calcic brown, red depressions, prior streams. ‘Cypress Park’. clay, soloth (plains); red podzolic (prior stream crests).Wah Way (ww) Plains, flooded areas. ‘Barmedman Creek’, ‘Caragabal’ Red, grey & brown clays; red- brown & ‘Marsden’. earth; non-calcic brown; red podsolic.

202 Cunninghamia 10(2): 2007 Rankin, Semple, Murphy & Koen, ‘Soils’ and ‘vegetation’— A case study from central western NSW
terrain whereas ‘Piney Range’ was on slightly undulating terrain with a maximum relief of ~10 m along the transect. The soil landscapes, together with an unmapped outlier of ‘Narraburra’ that was discovered during the survey, are described in Table 1.
Survey procedures
Pre-determined sampling points – specified distances along the road – were located within but not near the boundary of each of the four mapped soil landscapes such that each would be sampled eight times. At each point, the sampling site was located 25 m to the east of the road and pegged. If this site was unsuitable, e.g. due to disturbances such as tracks or gravel extraction or was in some way atypical, a location 50 m further south along the road was selected.
With the peg as centre, a 20 x 20 m plot with one side parallel to the road was laid out. Cover-abundance of all ground-storey species was assessed using a 0 to 7 Braun-Blanquet scale similar to that described by French et al. (2000). Ground-storey species identification was facilitated by the absence of grazing in the months prior to the survey in May 2000. Immature annual plants that could not be identified at the time were recorded as ‘annual herbage’ (subsequently found to contain up to 13 species, mainly grasses). As a number of common species, especially perennial grasses, lacked flowers/seedheads, all sites were revisited in spring 2000 to update species identifications.
Numbers of individuals of low shrubs (all Maireana microphylla) were counted within each plot. Since other woody species (potential mature height >1.5 m) were often infrequent in the plots, their numbers were determined within a circular plot of 25 m radius, centred on the plot peg. These data were converted to numbers of plants per hectare. Woody species present nearby but not within plots were recorded as a ‘marginal occurrence’.
The soil profile at the peg (the centre of the plot) was examined to a depth of ~1 m using a 75 mm diameter soil auger. Soil horizons and terrain features were described. Samples from each horizon were collected and later assessed for field texture, pH1:5 soil : water and electrical conductivity (EC1:5 soil : water) using the same procedures as described for King’s (1998) soil landscapes survey. All data were recorded on standard Soils Data System Cards and subsequently entered on the SALIS database (Milford et al. 2001).
Classification of soils and vegetation at each site
Soils and vegetation were described independently. Classification of soils at each site and determination of the site’s match with the mapped soil landscape (or another soil landscape) were carried out by BWM. Species determination and tree/shrub density measurements were carried out by MOR and WSS, who also determined the initial vegetation classification based on structural formation, dominant species
and understorey type (grassy v. shrubby). They also considered the vegetation at each site in terms of ‘density/floristic indices’, which included the number of native ground-storey species, number of native woody species, number of all native species and densities of native woody plants.
Alternative classifications of the vegetation at each site were generated from floristic data by TBK using an agglomerative numerical hierarchical cluster analysis (HCA) within Belbin’s (1995) PATN software package. The analysis was performed on three data sets: (a) densities of individual woody species, (b) Braun-Blanquet values for ground-storey species and (c) presence/absence data for all species. Of the 122 species recorded in the plots, 24 were excluded because they occurred at only one site. The choice of an acceptable number of groups from the HCA was made by examination of a scree diagram (Krzanowski 1990). This graphical plot displays the declining within-group variance against an increasing number of groups. Typically, the formation of the first few groups shows a sharp decline in average within-group variance, followed by a much more gradual rate of decrease. The number of ‘principal’ groups formed by the analysis is suggested to be near the point of inflection of this curve, since the cost of further increases in the group complexity of the system comes at only marginal benefits in reduction of within-group variance.
Hypothesis testing
To test hypothesis (1), that soil landscapes are consistently associated with particular vegetation types, it was necessary to ascertain that each site visited in the field actually fitted the description of the soil landscape within which it was mapped; i.e. that the site was not located on an unusual sub-unit or on a small outlier of another soil landscape, or that the mapping was incorrect. This was done by comparing terrain and soils at the site with those described for the soil landscape. If a discrepancy occurred, the site was reallocated to a more appropriate soil landscape category. Hence, hypothesis (1) was tested at two levels: (a) for soil landscapes as shown on the map and (b) for soil landscapes as amended following field evaluation.
To test for associations, separate two-way tables for each of the four vegetation classifications versus each of the soil landscapes (as originally mapped and as amended) were prepared and examined using a range of measures of association: Cramer’s V2, Somer’s D, Goodman-Kruskal gamma and Kendall’s tau-b (Minitab 2005). Differences between mean density/floristic indices for each group of sites (i.e. according to soil landscape as mapped or as amended) were assessed using analysis of variance.
Hypothesis (2), that soil types are consistently associated with particular vegetation types, was tested for each of the five soil classifications using the same procedures as described above.
Only the local soil classification was used to test hypothesis (3), that soil types are associated with the presence/absence

Cunninghamia 10(2): 2007 Rankin, Semple, Murphy & Koen, ‘Soils’ and ‘vegetation’— A case study from central western NSW 203
of one or more plant species. Site species lists were grouped according to soil types to determine species that were restricted to particular types.
As soil properties and species are narrowly-defined, hypothesis (4), that soil properties are consistently associated with the presence/absence of one or more plant species, did not require multiple testing. The test was limited to 40 soil x horizon properties (Table 2) extracted from the soil profile data at each site. The interaction between these soil variables and species, as measured by the presence/absence for all species that occurred more than once at each site, was examined using Canonical Correspondence Analysis (CCA) (ter Braak 1987).
Results
Twenty nine field sites were described. Sampling of the Marsden soil landscape was less frequent than desired – five sites instead of eight – because of the need to avoid soil landscape boundaries. Examination of soils and terrain at each of the sites indicated that six sites mapped as Wah Way did not fit the general description of that soil landscape. Five of these sites were re-allocated to Caragabal (a reported inclusion in Wah Way soil landscape; Table 1) and the other to Narraburra. Soil landscapes, soil types, vegetation types and vegetation indices at each site are presented in Appendix 1.
Depending on the classifications employed, soils at the 29 sites encompassed: six groups in the local classification
(see Table 3), six Great Soil Groups, seven Principal Profile Form (PPF) groups (representing eight PPFs) or eight groups in the Australian Soil Classification.
Five vegetation types were identified in the field: (a) inland grey box – white cypress pine (Eucalyptus microcarpa – Callitris glaucophylla) grassy woodland (3 sites), (b) open grassy woodland (15 sites), (c) inland grey box – white cypress pine shrubby woodland (5 sites), (d) belah (Casuarina cristata) forest (3 sites) and (e) natural grassland (3 sites). These five groups were subsequently reduced to four by abandoning the distinction between woodlands and open woodlands as the difference between the two may be an artefact of human activity.
Pattern analysis of tree and shrub density data yielded four groups plus a group lacking trees and shrubs (aA to aE in Appendix 1). Ground-storey Braun-Blanquet data yielded six groups (bA to bF in Appendix 1). Presence/absence data yielded three groups (cA to cC in Appendix 1).
Table 2. Soil variables and soil horizons – A (a), upper B (b) and lower B (bb) unless otherwise indicated – that were used in the Canonical Correspondence Analysis of soil properties and the occurrence of plant species.
Ranges of each variable across horizons are shown in parentheses. Symbols for each soil variable are given in bold. A Derived from texture and structure (after Williams et al. 1983). B Laboratory (pH1:5 soil:water) test results only
Colour Physical Inclusions Chemistry
H LD CFN EC Hue Lower depth of horizon Coarse fragments EC1:5 soil:water (10–17.5) (5–80 cm) (nil – abundant) (0.03–1.0 dS/m)
V TN1 CCNbb Value Texture Calcium carbonate segregations pHR (3–5) (fine sandy loam – medium clay) [lower B only] pH (Field Raupach) (nil – many) (5.0–9.0)
Ch TN2 Rock pHW Chroma Water holding capacity at field capacity A Rock at depth [lower B only] pH1:5 soil:water (2–8) (80–260 mm /m of soil) (yes/no) (4.63–9.27)
M StN pHb–a Munsell colour Structure grade pH B trend [upper B minus A] (very pale brown – (weak – strong) (-0.61–1.87) dark red)
pHbb–b pH B trend [lower B minus upper B] (-0.05–2.45)
Table 3. Soil types in the local classification
A. Brown clays on alluvium (‘Caragabal soil’)
B. Well-drained massive earths on metasediments (‘Piney Range soil’)
C. Grey cracking clays on alluvium (‘Wah Way soil’)
D. Red duplex soil on prior stream deposits (‘Narraburra soil’)
E. Grey cracking clay with gilgai on alluvium (‘Marsden soil’)
F. Deep, brown soils on colluvium. Includes duplex soils and massive earths. Transitional between soils A and B.

204 Cunninghamia 10(2): 2007 Rankin, Semple, Murphy & Koen, ‘Soils’ and ‘vegetation’— A case study from central western NSW
Twenty eight tree and tall shrub species were recorded. Of these, seven occurred outside the plots and five occurred at only one site. Maireana microphylla was the only low shrub recorded in any quantity. Eucalyptus microcarpa (at 26 sites) and Maireana microphylla (22 sites) were the most frequent woody species. Apart from some annual exotic grasses and forbs (‘annual herbage’) that were not identifiable in autumn 2000, 101 herbaceous and subshrub species were recorded. Of these, 19 were recorded at only one site. Species and their frequency of occurrence on soils of the local classification are listed in Appendix 2.
Associations between soil landscapes and vegetation types or indices
Measures of association between vegetation types (in the various classifications) and soil landscapes, as originally mapped or after amendment, were low. This indicated that none of the vegetation types was solely associated with a particular landscape and conversely, that no soil landscape
(except those with very few sites) was solely associated with a particular vegetation type. An example is presented in Table 4.
Significant differences (P<0.05) were evident between some soil landscapes and density/floristic indices, particularly those related to woody plants. Piney Range and Wah Way (together with Narraburra, which was represented by only one site) represented the two extremes of tree/tall shrub density in this survey. Sites within Piney Range landscape had a significantly higher mean number of woody native species (7.5) and mean density of native tree/tall shrubs (1293 plants/ha) but a lower mean number of ground-storey species (17.6) than the other soil landscapes. In contrast, sites within Wah Way landscape had a low mean density of tree/tall shrubs (132 or 156 plants/ha depending on whether the calculation was based on the original or amended mapping) and the highest mean number of ground-storey species (26.9 or 33.5).
Table 4. The occurrence of four conventionally-classified vegetation types at sites within Caragabal (ca), Marsden (ma), Piney Range (pr), Wah Way (ww) and Narraburra (nr) soil landscapes. All measures of association between this (and other) vegetation classifications and soil landscapes were low.
Numbers indicate the number of sites with that vegetation – soil landscape combination.
Sites classified according Sites reclassified into more to mapped soil landscapes appropriate soil landscapes
ca ma pr ww ca ma pr ww nr n=8 n=5 n=8 n=8 n=13 n=5 n=8 n=2 n=1
Grassy woodland 7 2 4 5 9 2 4 2 1Shrubby woodland 1 0 4 0 1 0 4 0 0Belah forest 0 3 0 0 0 3 0 0 0Grassland 0 0 0 3 3 0 0 0 0
Table 5. The occurrence of vegetation types (for two of the four vegetation classifications) at sites classified according to Principal Profile Form soil groups.
Numbers in each cell indicate the number of sites with that vegetation – soil combination.BDS= Brown duplex soil; RDS= Red duplex soil; YDS=Yellow duplex soil; RME =Red massive earth; BME =Brown massive earth; RSE= Red structured earth; GCC= Grey massive cracking clay.
Vegetation classification BDS RDS YDS RME BME RSE GCC n=7 n=1 n=1 n=10 n=3 n=1 n=6
(a) PATN vegetation classification based on presence/absence data for all species. Somer’s D and Goodman-Kruskal gamma measures of association were relatively high at –0.7 and –0.8 respectively for this combination of vegetation type and soil type. Vegetation type cA 1 1 1 10 3 1 2Vegetation type cB 2 0 0 0 0 0 2Vegetation type cC 4 0 0 0 0 0 2
(b) A conventional classification based on structure, dominant species/species groups. Somer’s D and Goodman-Kruskal gamma measures of association were relatively low at 0.4 and 0.5 respectively for this combination of vegetation type and soil type. Grassy woodland 5 0 1 6 3 1 2Shrubby woodland 0 1 0 4 0 0 0Belah forest 1 0 0 0 0 0 2Grassland 1 0 0 0 0 0 2
Cunninghamia 10(2): 2007 Rankin, Semple, Murphy & Koen, ‘Soils’ and ‘vegetation’— A case study from central western NSW 205
Associations between soil types and vegetation types or indices
An association between one of the PATN vegetation classifications and Principal Profile Form soil groups was relatively high but unique combinations of soil type and vegetation type were absent. Though five of the seven PPF groups were associated with only one vegetation type, it was the same type for all five (Table 5a). Measures of association between other vegetation classifications and soil classifications were generally low (e.g. Table 5b).
No significant differences between sites on the one soil type and mean numbers of ground-storey species were evident. However, mean numbers of woody species were significantly lower on clay soil types and higher on soil B (‘Piney Range soil’) than on the other soil types. Mean densities of low
shrub also varied significantly between some soil types, e.g. being higher on red earths than on red brown earths.
Associations between soil types of the local classification and plant species
Examination of species occurrence on soil types A to F (Table 3) indicated that species fell into three broad groups. The first comprised relatively common species that occurred on virtually all soil types, e.g. Austrodanthonia setacea (26 sites), Enteropogon acicularis (26 sites), Oxalis sp. (26 sites), Vittadinia sp. (23 sites), Austrostipa aristiglumis (14 sites) and Austrostipa blackii (17 sites) though no single species was recorded on all sites. Eucalyptus microcarpa (26 sites) and Einadia nutans (25 sites) occurred on all but soil type C. A second group comprised rare species that occurred at only
Table 6. Native species occurring on > 3 sites (or 2 sites for species restricted to Soil C) that occurred only on one or two soil types of the local classification.Numbers indicate the number of sites within each soil type where the species was recorded. Data from Appendix 2.
Species symbol Species Soil F Soil B Soil C Soil D Soil E Soil A 9 Sites 11 2 1 4 2
Group 1 Bchd Brachyscome heterodonta 3 Cbnl Cymbonotus lawsonianus 3 Maen Maireana enchylaenoides 3 Pltq Plantago drummondii 6 Madc Maireana decalvans 4 1
Group 2A Alom Allocasuarina luehmannii 4 3 Pspp Pittosporum phylliraeoides 6 8 Emdb Eremophila debilis 3 3 Akol Acacia oswaldii 3 2 Chlz Cheilanthes sp. 1 8 Ahpi Arthropodium minus 2 2 Lazz Lomandra sp. 3 4 Einh Einadia hastata 1 4 Sieg Austrostipa elegantissima 3 4
Group 2B Mpmt Myoporum montanum 8 Bhkz Bothriochloa macra/decipiens 3
Group 3A Klop Calostemma purpureum 2 1 Erjp Eryngium plantagineum 3 2 Sspc Swainsona procumbens 2 2
Group 3B Ixll Ixiolaena leptolepis 2 Lymh Lythrum hyssopifolia 2 Rnzz Ranunculus sp. 2 Eezb Eleocharis sp. ‘b’ 2
Group 4 Kzct Casuarina cristata 2 2 Dpkf Diplachne fusca 2 2 Fbdk Fimbristylis dicotoma 1 2
Group 5 Akmv Acacia melvillei 3 1Srcr Sporobolus caroli 3 2

206 Cunninghamia 10(2): 2007 Rankin, Semple, Murphy & Koen, ‘Soils’ and ‘vegetation’— A case study from central western NSW
one or two sites – perhaps by chance and about which little can be interpreted. The remaining group, comprising species which were neither rare nor widespread, were examined for consistent associations with one or two soil types. As shown in Table 6, two relatively common species, Plantago drummondii and Myoporum montanum, were recorded only on the one soil type – F and B respectively. Also evident was a number of species assemblages that were associated with one or two soil types, e.g. group 2A, where the woody plants, Allocasuarina luehmannii, Pittosporum phylliraeoides, Acacia oswaldii and (sub-shrub) Eremophila debilis, together with a number of forbs, were associated with soils F and B.
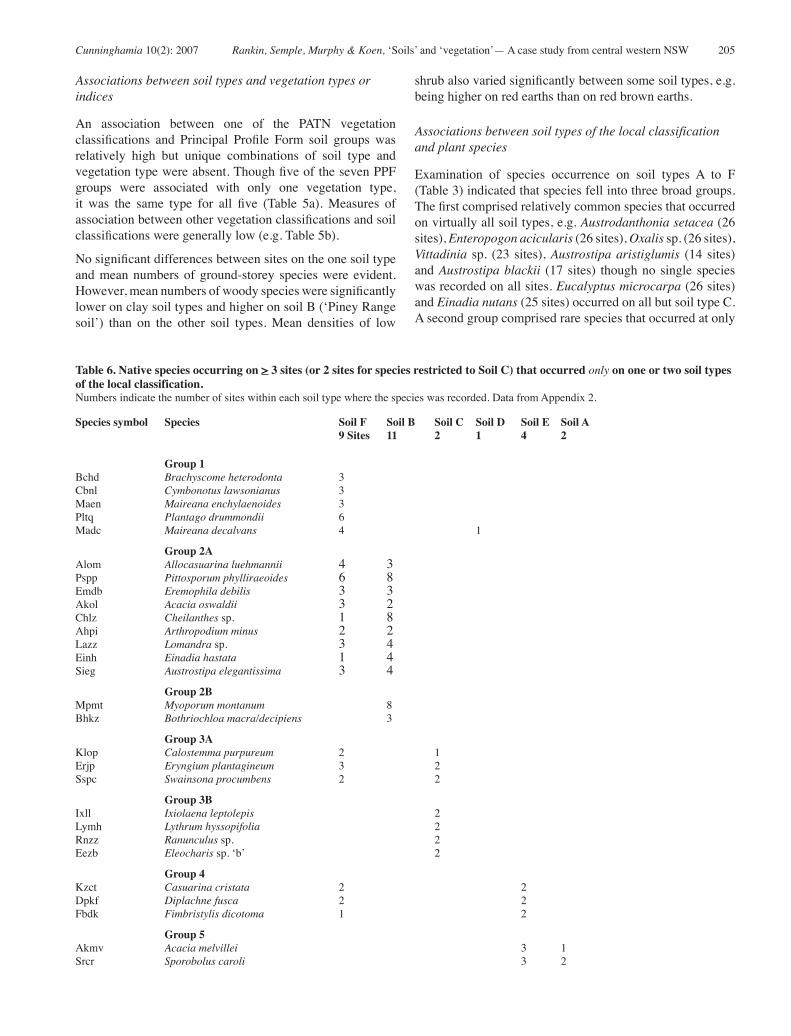
Associations between soil properties and plant species
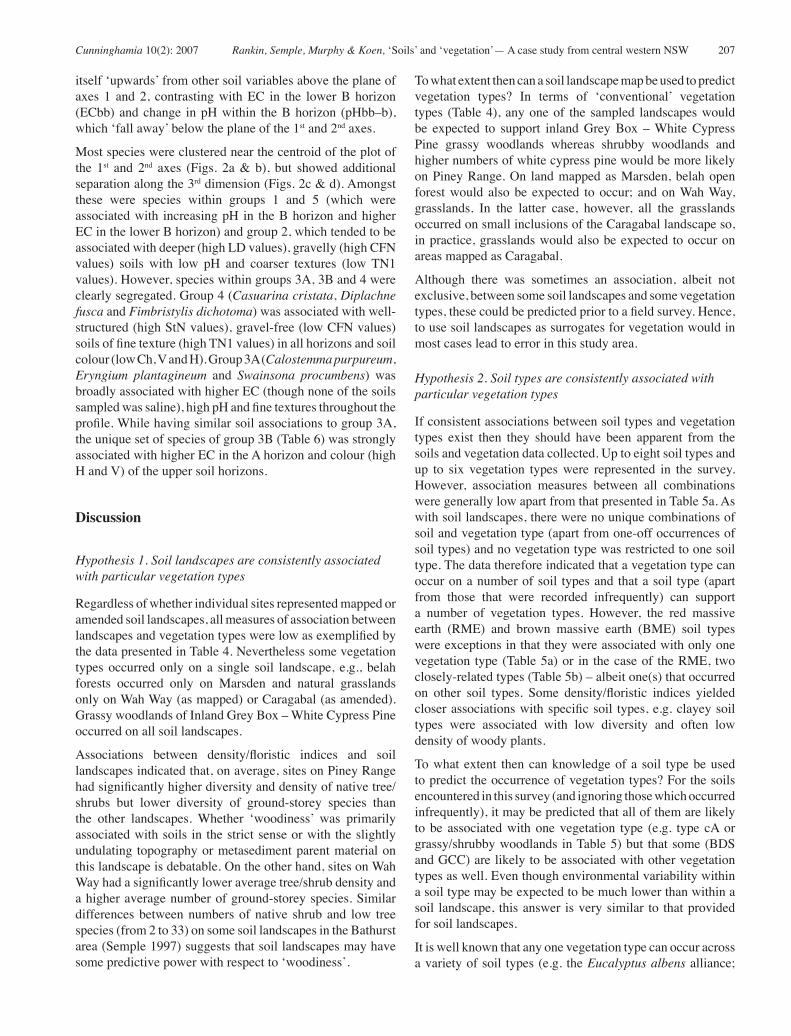
An indication of the soil properties associated with each of the species groups shown in Table 6 can be obtained from the CCA analysis of the presence/absence of all species (Fig. 2). Vectors representing the measured soil properties showed a distinct ‘left-right’ contrast in the first two axes (Fig. 2a), with the higher values of pH, electrical conductivity (EC), texture (TN1 and TN2) and structure (StN) to the left; and higher values of coarse fragments (CFN), horizon depth (LD) and most attributes of colour (Ch, H, M) to the right. Further insight into the dominant associations between soil variables can be made from the plot of the 1st and 3rd axes from the CCA analysis (Fig. 2c). Horizon depth (LD) lifts
Axis 1
LDa
Ha
Va
Cha
Ma
TN1a
TN2a
StNa CFNa
pHRa
pHWa
ECa
LDb
Hb
Vb
Chb
Mb
TN1b
TN2b
StNb
CFNb
pHRbpHWb
ECb
LDbb
Hbb
Vbb
Chbb
MbbTN1bb
TN2bb
StNbb
CFNbb
CCNbb
pHRbbpHWbb
ECbb
pHb-a
pHbb-b
Rock
LDa
Ha
Va
Cha
Ma
TN1a
TN2a
StNaCFNa
pHRa
pHWa
ECa
LDb
Hb
Vb
Chb
Mb
TN1b
TN2b
StNb
CFNb
pHRb
pHWb
ECb
LDbb
Hbb
Vbb
Chbb
Mbb
TN1bbTN2bb
StNbb
CFNbb
CCNbb
pHRbbpHWbb
ECbb
pHb-a
pHbb-b
Rock
MbMbbHa
LDbbMaChbbChbHbb
CFNbCFNbbCFNaRock
LDb
LDaCha
pHbb-b
HbECbb ECa
VapHRa
TN1bbTN2bbStNb
pHWa
TN2a VbbStNbb Vb
TN2b TN1aStNa
pHRb pHWbpHRbb pHWbb
ECb CCNbbpHb-a TN1b
Gp 4
Gp 3A
Gp 3B
Gp 5Gp 2A
Gp 2B
Gp 1
(a) (b)
Axis 1
LDa
Ha
VaCha
Ma
TN1a
TN2a
StNa
CFNa
pHRa
pHWa
ECa
LDb
HbVb
Chb
Mb
TN1b
TN2b
StNb
CFNb
pHRb
pHWb
ECb
LDbb
Hbb
Vbb
Chbb
Mbb
TN1bbTN2bb
StNbb
CFNbb
CCNbb
pHRbbpHWbb
ECbb
pHb-a
pHbb-b
Rock
Bchd
Cbnl
MaenPltqMadc
Alom
Akol
Pspp
Emdb
ChlzAhpi
Lazz
Einh
Sieg
Mpmt
Bhkz
Klop
Erjp
Sspc
IxllLymhRnzzEezb
KzctDpkf
Fbdk
AkmvSrcr
LDa
Ha
VaCha
Ma
TN1a
TN2a
StNa
CFNa
pHRa
pHWa
ECa
LDb
HbVb
Chb
Mb
TN1b
TN2b
StNb
CFNb
pHRb
pHWb
ECb
LDbb
Hbb
Vbb
Chbb
Mbb
TN1bbTN2bb
StNbb
CFNbb
CCNbb
pHRbbpHWbb
ECbb
pHb-a
pHbb-b
Rock
Mb
Mbb
Ha
LDbb
Ma
Chbb
ChbHbb
CFNb
CFNbb
CFNa
Rock
LDb
LDa
Cha
pHbb-b
Hb
ECbb
Va
pHRa
ECb TN1bb
ECaVb
TN2bb VbbStNb pHb-a
pHWbb pHRbbStNa TN1b
TN1a StNbbpHWb CCNbb
TN2a TN2bpHWa pHRb
Gp 1
Gp 5
Gp 3B
Gp 4
Gp 3A
Gp 2A
Gp 2B
(d)(c)
Fig. 2. Biplots of the 1st and 2nd axes [(a) and (b)] and 1st and 3rd axes [(c) and (d)] from Canonical Correspondence Analysis of the presence/absence of species using soil properties as a set of supplementary variables. To aid interpretation, contrasts between soil properties are displayed in the left hand panels, while differences between species groups are shown in the right hand panels. All spatial coordinates are from the one analysis. Species are shown as dots and groups of dots (see Table 6) and soil properties in three horizons, a, b and bb, as vectors (see Table 2 for key to symbols).
Cunninghamia 10(2): 2007 Rankin, Semple, Murphy & Koen, ‘Soils’ and ‘vegetation’— A case study from central western NSW 207
itself ‘upwards’ from other soil variables above the plane of axes 1 and 2, contrasting with EC in the lower B horizon (ECbb) and change in pH within the B horizon (pHbb–b), which ‘fall away’ below the plane of the 1st and 2nd axes.
Most species were clustered near the centroid of the plot of the 1st and 2nd axes (Figs. 2a & b), but showed additional separation along the 3rd dimension (Figs. 2c & d). Amongst these were species within groups 1 and 5 (which were associated with increasing pH in the B horizon and higher EC in the lower B horizon) and group 2, which tended to be associated with deeper (high LD values), gravelly (high CFN values) soils with low pH and coarser textures (low TN1 values). However, species within groups 3A, 3B and 4 were clearly segregated. Group 4 (Casuarina cristata, Diplachne fusca and Fimbristylis dichotoma) was associated with well-structured (high StN values), gravel-free (low CFN values) soils of fine texture (high TN1 values) in all horizons and soil colour (low Ch, V and H). Group 3A (Calostemma purpureum, Eryngium plantagineum and Swainsona procumbens) was broadly associated with higher EC (though none of the soils sampled was saline), high pH and fine textures throughout the profile. While having similar soil associations to group 3A, the unique set of species of group 3B (Table 6) was strongly associated with higher EC in the A horizon and colour (high H and V) of the upper soil horizons.
Discussion
Hypothesis 1. Soil landscapes are consistently associated with particular vegetation types
Regardless of whether individual sites represented mapped or amended soil landscapes, all measures of association between landscapes and vegetation types were low as exemplified by the data presented in Table 4. Nevertheless some vegetation types occurred only on a single soil landscape, e.g., belah forests occurred only on Marsden and natural grasslands only on Wah Way (as mapped) or Caragabal (as amended). Grassy woodlands of Inland Grey Box – White Cypress Pine occurred on all soil landscapes.
Associations between density/floristic indices and soil landscapes indicated that, on average, sites on Piney Range had significantly higher diversity and density of native tree/shrubs but lower diversity of ground-storey species than the other landscapes. Whether ‘woodiness’ was primarily associated with soils in the strict sense or with the slightly undulating topography or metasediment parent material on this landscape is debatable. On the other hand, sites on Wah Way had a significantly lower average tree/shrub density and a higher average number of ground-storey species. Similar differences between numbers of native shrub and low tree species (from 2 to 33) on some soil landscapes in the Bathurst area (Semple 1997) suggests that soil landscapes may have some predictive power with respect to ‘woodiness’.
To what extent then can a soil landscape map be used to predict vegetation types? In terms of ‘conventional’ vegetation types (Table 4), any one of the sampled landscapes would be expected to support inland Grey Box – White Cypress Pine grassy woodlands whereas shrubby woodlands and higher numbers of white cypress pine would be more likely on Piney Range. On land mapped as Marsden, belah open forest would also be expected to occur; and on Wah Way, grasslands. In the latter case, however, all the grasslands occurred on small inclusions of the Caragabal landscape so, in practice, grasslands would also be expected to occur on areas mapped as Caragabal.
Although there was sometimes an association, albeit not exclusive, between some soil landscapes and some vegetation types, these could be predicted prior to a field survey. Hence, to use soil landscapes as surrogates for vegetation would in most cases lead to error in this study area.
Hypothesis 2. Soil types are consistently associated with particular vegetation types
If consistent associations between soil types and vegetation types exist then they should have been apparent from the soils and vegetation data collected. Up to eight soil types and up to six vegetation types were represented in the survey. However, association measures between all combinations were generally low apart from that presented in Table 5a. As with soil landscapes, there were no unique combinations of soil and vegetation type (apart from one-off occurrences of soil types) and no vegetation type was restricted to one soil type. The data therefore indicated that a vegetation type can occur on a number of soil types and that a soil type (apart from those that were recorded infrequently) can support a number of vegetation types. However, the red massive earth (RME) and brown massive earth (BME) soil types were exceptions in that they were associated with only one vegetation type (Table 5a) or in the case of the RME, two closely-related types (Table 5b) – albeit one(s) that occurred on other soil types. Some density/floristic indices yielded closer associations with specific soil types, e.g. clayey soil types were associated with low diversity and often low density of woody plants.
To what extent then can knowledge of a soil type be used to predict the occurrence of vegetation types? For the soils encountered in this survey (and ignoring those which occurred infrequently), it may be predicted that all of them are likely to be associated with one vegetation type (e.g. type cA or grassy/shrubby woodlands in Table 5) but that some (BDS and GCC) are likely to be associated with other vegetation types as well. Even though environmental variability within a soil type may be expected to be much lower than within a soil landscape, this answer is very similar to that provided for soil landscapes.
It is well known that any one vegetation type can occur across a variety of soil types (e.g. the Eucalyptus albens alliance;

208 Cunninghamia 10(2): 2007 Rankin, Semple, Murphy & Koen, ‘Soils’ and ‘vegetation’— A case study from central western NSW
Moore 1953) but the corollary, that the one soil type can support, or is associated with, a variety of vegetation types, in not always appreciated. The results from this survey clearly show this to be the case and there is no reason to suppose that the study area is unique in this respect. The failure to appreciate this relationship may be a consequence, at least partly, of the way vegetation types are often described in terms of their associated soils in vegetation surveys, e.g. Austrostipa aristiglumis grassland with dark grey self-mulching clays (Biddiscombe 1963) and Acacia pendula woodlands with grey clays (Sivertsen & Metcalfe (1995). Such descriptions imply that the vegetation type always occurs on the stated soil type and that the soil type always supports the specified vegetation type. Though this may be the case for the two examples cited, it is not general.
The issue of associations between soils and vegetation types is further complicated by the nature of classification itself. Soils and vegetation at any one site are essentially unique and classifying them on the basis of pH, depth, etc. (for soils) or tallest species, most common species, etc. (for vegetation) is largely based on convenience, which may or may not have relevance to the properties that affect plant growth (for soil classifications) or the habitat requirements of the dominant species, in the case of vegetation classifications. As a ‘vegetation type’ is basically an assemblage of species, it seems unreasonable to expect soil types to be associated primarily with the dominant(s), particularly one like Eucalyptus microcarpa, which appears to be suited to a wide range of environments.
Hypothesis 3. Soil types are consistently associated with the presence/absence of plant species
Six species, including Austrodanthonia setacea and Enteropogon acicularis, occurred on all soil types sampled (though not at all sites) but some groups of species were apparently restricted on one or two soil types (Table 6) and others, though occurring on most soil types, were absent from one or two. For example, Eucalyptus microcarpa, Maireana microphylla, Elymus scaber, Calotis lappulacea, Atriplex spinibractea, Atriplex semibaccata, Einadia nutans, Sclerolaena muricata, Dichondra repens and Goodenia pinnatifida occurred on all soil types except type C – albeit represented at only two sites. This suggests that knowledge of soil types may have some predictive value for presence/absence of some species (though little can be said about species or soil types recorded infrequently in this survey).
Hypothesis 4. Soil properties (pH, colour, structure, etc.) are consistently associated with the presence/absence of plant species
A Canonical Correspondence Analysis of species presence/absence and soil properties (Fig. 2) suggested that some species with restricted distributions were associated with a suite of soil properties. For example, species in group 4 (Casuarina cristata, Diplachne fusca and Fimbistylis dicotoma) were associated with well structured, gravel-free soils with finer than average texture. However, the associations suggested should be considered tentative as they were based on only a few occurrences of these species and more sites would need to be described to increase confidence.
Conclusions
Soil landscape maps could not be used as surrogate vegetation maps though, if supplemented by local knowledge, some soil landscapes may be helpful in locating specific vegetation types. In the case of soil types that were encountered more than once, none was uniquely associated with a particular vegetation type. The most common vegetation type, a grassy woodland, occurred on all soil types whereas others, e.g. belah forest, occurred on two soil types only. Although some soils were associated with only the most common vegetation type, most supported more than one vegetation type.
However, there were significant associations between aspects of woodiness and some soil landscapes (e.g. high density and numbers of species of woody plants on the Piney Range soil landscape) and some soil types (e.g. low numbers of woody species on clay soil types). Although many plant species occurred on virtually all soil types encountered, some were apparently restricted to one or two – presumably in response to a suite of soil properties that were incompletely defined in this study.
Though apparently unique associations of vegetation types and soil types have been reported in other vegetation surveys, they were not evident in this study, though soils were examined in more detail than would probably be the case for most vegetation surveys. In an earlier and much larger study where soils were examined in considerable detail, Beadle (1948) concluded that associations between soils and vegetation were very ill-defined. The results of our survey support this. We do not deny that such associations do occur in some instances but we also note that some vegetation surveyors are not prepared to make definitive statements about vegetation and soil types except in a general way. For example, Westbrooke and Miller (1995) and Tozer (2003) emphasise geomorphology or geology, and Stafford and Eldridge (2000) emphasise soil properties.

Cunninghamia 10(2): 2007 Rankin, Semple, Murphy & Koen, ‘Soils’ and ‘vegetation’— A case study from central western NSW 209
Acknowledgements
Thanks to Ian Cole, David Eldridge and an anonymous referee for constructive comments on various drafts of the manuscript, to John Young for field assistance and preparation of Fig. 1, and botanists at the Royal Botanic Gardens Sydney for identifying some of the plants collected in the field survey.
References
Anderson, R.H. (1941). The effect of settlement on the New South Wales flora. Proceedings of the Linnean Society of New South Wales 66, 5–23.
Andersson, C. & McNamara, C. (unpublished). Soil landscapes of the Cootamundra 1:250 000 sheet (Department of Natural Resources: Sydney).
Beadle, N.C.W. (1948). The vegetation and pastures of western New South Wales with special reference to soil erosion (NSW Department of Conservation: Sydney).
Belbin, L. (1995). PATN pattern analysis package – technical reference manual (CSIRO Sustainable Ecosystems: Canberra).
Benson, J. (1991). The effect of 200 years of European settlement on the vegetation and flora of New South Wales. Cunninghamia 2, 343–370.
Biddiscombe, E.F. (1963). A vegetation survey in the Macquarie region, New South Wales. Division of Plant Industry Technical Paper 18, CSIRO, Melbourne,
Bower, C., Semple, B. & Harcombe, L. (2002). Eucalypts of the Central West of NSW (NSW Department of Land & Water Conservation: Orange).
Chapman, G.H. & Atkinson, G. (2000). Soil survey and mapping. In: Soils: their properties and management (eds P.E.V. Charman & B.W. Murphy), pp. 106–132 (Oxford University Press: South Melbourne).
French, K., Pellow, B. & Henderson, M. (2000). Vegetation of the Holsworthy Military Area. Cunninghamia 6, 893–940.
Griffiths, T. (2001). The writing of A Million Wild Acres. In: Perfumed pineries. Environmental history of Australia’s Callitris forests (eds J. Dargavel, D. Hart & B. Libbis), pp. 184–194 (Centre for Resource & Environmental Studies, Australian National University: Canberra).
Harden, G.J. (ed.) (1990–1993). Flora of New South Wales Volumes 1–4 (New South Wales University Press: Kensington).
Heathcote, R.L. (1965). Back of Bourke. A study of land appraisal and settlement in semi-arid Australia (Melbourne University Press: Carlton).
Isbell, R.F. (1996). The Australian soil classification (CSIRO: Melbourne).
King, D.P. (1998). Soil landscapes of the Forbes 1:250 000 sheet (Department of Land & Water Conservation: Sydney).
Krzanowski, W.J. (1990). Principles of multivariate analysis: a user’s perspective (Oxford University Press: Oxford).
Martin, G. (2001). The role of small ground-foraging mammals in topsoil health and biodiversity: implications to management and restoration. Ecological Management & Restoration 4, 114–119.
Milford, H.B., McGaw, A.J.E. & Nixon, K.J. (eds.) (2001). Soil data entry handbook for the NSW Soil and Land Information System (SALIS) (3rd edition) (Department of Land & Water Conservation: Parramatta).
Minitab (2005). Minitab statistical software release 14 (Minitab Inc.: State College).
Moore, C.W.E. (1953). The vegetation of the south-eastern Riverina, New South Wales I. The climax communities. Australian Journal of Botany 1, 458–547.
Northcote, K.H. (1979). A factual key for the recognition of Australian soils (4th edition) (Rellim Technical Publications: Adelaide).
Northcote, K.H., Hubble, G.D., Isbell, R.F., Thompson, C.H. & Bettenay, E. (1975). A description of Australian soils (CSIRO: Melbourne / Wilke & Co.: Clayton).
Prober, S.M.. & Thiele, K.R. (2004). Floristic patterns along an east-west gradient in grassy box woodlands of Central New South Wales. Cunninghamia 8, 306–325.
Russell, J.S. & Isbell, R.F. (eds) (1986) Australian soils: the human impact (University of Queensland Press: St Lucia).
Ritman, K.T. (1995). Structural vegetation data: a specification manual for the Murray Darling Basin Project M305 (Department of Land & Water Conservation, Land Information Centre: Bathurst).
Semple, W.S. (1997). Native and naturalised shrubs of the Bathurst Granites: past and present. Cunninghamia 5, 49–80.
Sivertsen, D. & Metcalfe, L. (1995). Natural vegetation of the southern wheat-belt (Forbes and Cargelligo 1:250 000 map sheets). Cunninghamia 4, 103–128.
Stace, H.C.T., Hubble, G.D., Brewer, R., Northcote, K.H., Sleeman, J.R., Mulcahy, M.J. & Hallsworth, E.G. (1968). A handbook of Australian soils (Rellim Technical Publications: Adelaide).
Stafford, M.J. & Eldridge, D.J. (2000). Vegetation, soils and management of ‘Zara’: a sandhill remnant on the Riverine Plain. Cunninghamia 6, 717–746.
ter Braak, C.J.F. (1987). The analysis of vegetation-environment relationships by canonical correspondence analysis. Vegetatio 69, 69–77.
Tozer, M. (2003). The native vegetation of the Cumberland Plain, western Sydney: systematic classification and field identification of communities. Cunninghamia 8, 1–75.
Walker, J. & Hopkins, M.S. (1990). Vegetation. In: Australian soil and land survey. Field handbook (2nd edn) (eds R.C. McDonald, R.F. Isbell, J.G. Speight, J. Walker & M.S. Hopkins) (Inkata Press: Melbourne).
Westbrooke, M.E. & Miller, J.D. (1995). The vegetation of Mungo National Park, western New South Wales. Cunninghamia 4, 63–80.
Wheeler, D.J.B., Jacobs, S.W.L. & Whalley, R.D.B. (2002). Grasses of New South Wales (3rd edition) (University of New England: Armidale)
Williams, J., Prebble, R.E., Williams, W.T. & Hignett, C.T. (1983). The influence of texture, structure and clay minerology on the soil moisture characteristic. Australian Journal of Soil Research 21, 15–32.
Manuscript accepted 24 July 2007

210 Cunninghamia 10(2): 2007 Rankin, Semple, Murphy & Koen, ‘Soils’ and ‘vegetation’— A case study from central western NSW
App
endi
x 1.
Cha
ract
erist
ics o
f site
s (gr
oupe
d ac
cord
ing
to so
il la
ndsc
apes
as o
rigi
nally
map
ped)
.
A G
W E
. mic
roca
rpa
– C
. gla
ucop
hylla
gra
ssy
woo
dlan
d; S
W E
. mic
roca
rpa
– C
. gla
ucop
hylla
shru
bby
woo
dlan
d; B
F C
. cri
stat
a op
en fo
rest
; G n
atur
al g
rass
land
B R
D R
ed D
erm
osol
; BD
Bro
wn
Der
mos
ol; G
D G
rey
Der
mos
ol ;
GV
Gre
y Ve
rtoso
l; R
C R
ed C
hrom
osol
; BC
Bro
wn
Chr
omos
ol; R
K R
ed K
ando
sol;
BK
Bro
wn
Kan
doso
l.C
Db1
.13
Bro
wn
dupl
ex so
il (B
DS)
; Dr2
.13
Red
dup
lex
soil
(RD
S); D
y2.1
3 Ye
llow
dup
lex
soil
(YD
S); G
n2.1
2 &
Gn2
.13
Red
mas
sive
ear
th (R
ME)
; Gn2
.43
Bro
wn
mas
sive
ear
th (B
ME)
; G
n4.1
3 R
ed st
ruct
ured
ear
th (R
SE);
Ug5
.5 G
rey
mas
sive
cra
ckin
g cl
ay (G
CC
).D B
C B
row
n cl
ay; G
C G
rey
clay
; RB
E R
ed-b
row
n ea
rth; B
E B
row
n ea
rth; R
E R
ed e
arth
; YS
Yello
w so
lodi
c.E
See
Tabl
e 3.
Site
num
ber
1 2
6 7
16
17
20
21
3 4
5 22
23
Soil
land
scap
esA
s map
ped
ca
ca
ca
ca
ca
ca
ca
ca
ma
ma
ma
ma
ma
Afte
r am
endm
ent
ca
ca
ca
ca
ca
ca
ca
ca
ma
ma
ma
ma
ma
Flor
istic
indi
ces –
num
bers
of n
ativ
e sp
ecie
s with
in:
(a) g
roun
d-st
orey
32
29
23
22
20
8
30
12
24
24
17
10
18(b
) tre
es
1 3
1 1
3 3
2 3
2 2
4 2
2(c
) shr
ubs
1 1
2 3
6 1
5 2
1 2
0 0
0(d
) low
shru
b 1
1 1
1 1
0 0
1 1
1 1
0 0
(e) t
rees
, shr
ubs &
low
shru
bs
3 5
4 5
10
4 7
6 4
5 5
2 2
(f) s
ite (i
.e. a
ll sp
ecie
s)
35
34
27
27
30
12
37
18
28
29
22
12
20
Den
sity
(pla
nts/h
a) o
f:(a
) nat
ive
low
shru
b,
150
150
1375
17
25
150
0 0
50
225
750
25
0 0
Mai
rean
a m
icro
phyl
la(b
) nat
ive
trees
& sh
rubs
46
97
10
2 16
8 77
2 24
4 34
1 92
2 17
3 11
2 82
5 12
68
703
Vege
tatio
n ty
pes:
Con
vent
iona
l A
GW
G
W
GW
G
W
SW
GW
G
W
GW
G
W
GW
B
F B
F B
FPA
TN a
aA
aA
aB
aB
aB
aB
aB
aB
aA
aA
aD
aD
aD
PATN
b
bA
bA
bA
bA
bB
bF
bA
bB
bA
bA
bC
bC
bCPA
TN c
cA
cA
cA
cA
cA
cB
cC
cA
cA
cA
cB
cB
cB
Soil
type
s:A
ust.
Soil
Cla
ssifi
catio
n B
GV
B
D
RD
R
D
RC
R
C
BC
B
C
GD
G
V
GV
B
C
GV
Prin
cipa
l Pro
file
Form
s (PP
Fs)
Ug
Db
Gn
Gn
Dr
Db
Db
Gn
Dy
Ug
Ug
Db
Ug
5.
5 1.
13
4.13
2.
13
2.13
1.
13
1.13
2.
43
2.13
5.
5 5.
5 1.
13
5.5
PPF
grou
ps C
G
CC
B
DS
RSE
R
ME
RD
S B
DS
BD
S B
ME
YD
S G
CC
G
CC
B
DS
GC
CG
reat
Soi
l Gro
ups D
B
C
RB
E R
E R
E R
BE
RB
E R
BE
RE
YS
GC
G
C
RB
E G
CLo
cal c
lass
ifica
tion
E A
A
B
B
B
F
F F
E E
E F
E

Cunninghamia 10(2): 2007 Rankin, Semple, Murphy & Koen, ‘Soils’ and ‘vegetation’— A case study from central western NSW 211
Site
num
ber
8 9
10
11
12
13
14
15
18
19
24
25
26
27
27
29
Soil
Land
scap
esA
s map
ped
pr
pr
pr
pr
pr
pr
pr
pr
ww
w
w
ww
w
w
ww
w
w
ww
w
wA
fter a
men
dmen
t pr
pr
pr
pr
pr
pr
pr
pr
w
w
ww
ca
ca
ca
ca
ca
nr
Flor
istic
indi
ces –
num
bers
of n
ativ
e sp
ecie
s with
in:
(a) g
roun
d-st
orey
20
17
20
20
15
18
14
17
34
33
19
21
29
25
34
20
(b) t
rees
3
3 2
3 3
3 2
3 1
2 3
2 0
0 0
2(c
) shr
ubs
3 3
5 1
3 4
4 7
5 3
4 1
0 0
0 1
(d) l
ow sh
rub
1 1
1 1
1 1
1 1
1 1
1 1
0 0
0 1
(c) t
rees
, shr
ubs &
low
shru
bs
7 7
8 5
7 8
7 11
7
6 8
4 0
0 0
4(d
) site
(i.e
. all
spec
ies)
27
24
28
25
22
26
21
28
41
39
27
25
29
25
34
24
Den
sity
(pla
nts/h
a) o
f:(a
) nat
ive
low
shru
b,
18
25
650
1450
20
0 75
87
5 50
17
5 25
50
32
5 32
5 0
0 0
1900
M
aire
ana
mic
roph
ylla
(b) n
ativ
e tre
es &
shru
bs
581
382
550
148
1397
20
63
2241
29
80
224
87
581
97
0 0
0 56
Vege
tatio
n ty
pes:
Con
vent
iona
l A
GW
G
W
GW
G
W
SW
SW
SW
SW
GW
G
W
GW
G
W
G
G
G
GW
PATN
a
aB
aB
aB
aB
aC
aC
aC
aC
aA
aA
aB
aA
aE
aE
aE
aAPA
TN b
bA
bA
bA
bA
bA
bA
bB
bB
bD
bD
bA
bA
bE
bE
bD
bA
PATN
c
cA
cA
cA
cA
cA
cA
cA
cA
cC
cC
cA
cA
cC
cC
cC
cA
Soil
type
s:A
ust.
Soil
Cla
ssifi
catio
n B
R
D
RD
R
D
RD
R
K
RD
R
D
RK
R
C
BC
B
K
BD
G
V
GV
B
C
RD
Prin
cipa
l Pro
file
Form
s (PP
F)
Gn
Gn
Gn
Gn
Gn
Gn
Gn
Gn
Db
Db
Gn
Gn
Ug
Ug
Db
Gn
2.
13
2.13
2.
13
2.13
2.
13
2.13
2.
13
2.12
1.
13
1.13
2.
43
2.43
5.
5 5.
5 1.
13
2.13
PPF
grou
ps C
R
ME
RM
E R
ME
RM
E R
ME
RM
E R
ME
RM
E B
DS
BD
S B
ME
BM
E G
CC
G
CC
B
DS
RM
EG
reat
Soi
l Gro
ups D
R
E R
E R
E R
E R
E R
E R
E R
E R
BE
RB
E B
E B
E G
C
GC
R
BE
RE
Loca
l cla
ssifi
catio
n E
B
B
B
B
B
B
B
B
F F
F F
C
C
F D

212 Cunninghamia 10(2): 2007 Rankin, Semple, Murphy & Koen, ‘Soils’ and ‘vegetation’— A case study from central western NSW
Appendix 2. Frequency of occurrence on sites with the same soil type in the local classification of vascular plant species recorded along Driftway Road during 2000.
Species are flowering plants except conifers (marked A) or (ferns (B). Tree/shrub species marked # were not recorded in plots but were noted nearby (‘marginal occurrences’) or in the general area. * = introduced species. # = a ‘marginal occurrence’, i.e. a tree/shrub species noted in the area but not recorded in plots.¶ = a group comprising one or more of the following species: *Avena sp., *Bromus diandrus, *Bromus molliformis, *Hordeum leporium, *Hordeum hystrix, *Lolium rigidum & *Vulpia bromoides (Poaceae), *Arctotheca calendula (Asteraceae), *Echium plantagineum (Boraginaceae), *Capsella bursa-pastoris (Brassicaceae), *Medicago & *Trifolium spp. (Fabaceae), *Parentucellia latifolia (Scrophulariaceae).
Soil types (see Table 3)
F A B C D E all soils 9 sites 2 sites 11 sites 2 sites 1 sites 4 sites 29 sitesTrees Species (family minus -aceae)
Cupress Callitris glaucophylla A 3 0 9 0 1 0 14Casuarin Allocasuarina leuhmannii 4 0 3 0 0 0 7Casuarin Casuarina cristata 2 0 0 0 0 2 4Fab Acacia melvillei 0 1 0 0 0 3 4Fab Acacia pendula # Myopor Myoporum platycarpum # Myrt Eucalyptus albens 0 0 1 0 0 0 1Myrt Eucalyptus conica # Myrt Eucalyptus melliodora # Myrt Eucalyptus microcarpa 8 2 11 0 1 4 26Rut Geijera parviflora 0 0 1 0 0 0 1Sapind Alectryon oleifolius 1 1 2 0 0 1 5
Tall shrubs
Aster Cassinia laevis 1 0 1 0 0 0 2Fab Acacia acinacea 0 0 1 0 0 0 1Fab Acacia deanei # Fab Acacia difformis 0 0 1 0 0 0 1Fab Acacia hakeoides 4 0 5 0 1 2 12Fab Acacia lineata 0 0 2 0 0 0 2Fab Acacia oswaldii 3 0 2 0 0 0 5Fab Acacia trineura 2 0 0 0 0 0 2Fab Senna artemisioides 2 1 9 0 0 1 13Myopor Myoporum montanum 0 0 8 0 0 0 8Pittospor Pittosporum phylliraeoides 6 0 8 0 0 0 14Prote Hakea sp. # Santal Santalum acuminatum # Sapind Dodonaea viscosa 3 1 4 0 0 0 8 ssp. cuneataSolan *Lycium ferocissimum 0 0 0 0 0 1 1
Low shrubs
Chenopodi Maireana microphylla 5 2 11 0 1 3 22
Total number of 13 6 17 0 4 8 21 tree/shrub/low shrub species recorded within plotsTotal number of ex-plot tree/shrub/low shrub species 7
Ground-storey
Marsile Marsilea sp. B 2 1 0 2 0 2 7Sinopterid Cheilanthes sp. B 1 0 8 0 0 0 9Amaryllid Calostemma purpureum 2 0 0 1 0 0 3Antheric Anthropodium minus 2 0 2 0 0 0 4Colchic Wurmbea dioica 2 0 0 0 0 0 2Cyper Carex inversa 3 0 1 2 0 1 7Cyper Eleocharis sp. ‘a’ 0 0 0 1 0 0 1Cyper Eleocharis sp. ‘b’ 0 0 0 2 0 0 2Cyper Fimbristylis dichotoma 1 0 0 0 0 2 3Irid *Romulea sp. 1 0 0 0 0 0 1Junc Juncus sp. ‘a’ 3 0 0 2 0 2 7

Cunninghamia 10(2): 2007 Rankin, Semple, Murphy & Koen, ‘Soils’ and ‘vegetation’— A case study from central western NSW 213
F A B C D E all soils 9 sites 2 sites 11 sites 2 sites 1 sites 4 sites 29 sites
Junc Juncus sp. ‘b’ 0 0 0 0 0 1 1Lomandr Lomandra sp. 3 0 4 0 0 0 7Orchid ?Pterostylis sp. 0 0 1 0 0 0 1Po Austrodanthonia caespitosa 8 0 2 2 1 1 14Po Austrodanthonia setacea 8 2 11 1 1 3 26Po Austrostipa aristiglumis 3 2 3 2 1 3 14Po Austrostipa blackii 5 2 6 1 1 2 17Po Austrostipa elegantissima 3 0 4 0 0 0 7Po Austrostipa nodosa 4 1 3 0 0 1 9Po Austrostipa scabra 2 0 10 0 1 0 13Po Bothriochloa macra/decipiens 0 0 3 0 0 0 3Po Chloris truncata 3 1 1 1 0 0 6Po Diplachne fusca 2 0 0 0 0 2 4Po Elymus scaber 6 1 5 0 1 1 14Po Enteropogon acicularis 8 2 10 1 1 4 26Po Eragrostis sp. 1 0 0 0 0 1 2Po Eriochloa pseudoacrotricha 5 1 0 2 0 1 8Po Panicum decompositum 1 0 0 0 0 0 1Po Panicum simile 1 1 0 0 0 0 2Po Paspalidium constrictum 1 2 1 0 0 0 4Po *Paspalum dilatatum 0 0 0 1 0 0 1Po *Phalaris paradoxa 0 0 0 1 0 1 2Po Sporobolus caroli 0 2 0 0 0 3 5Po Walwhalleya proluta ined. 2 0 0 2 0 2 6Amaranth Alternanthera denticulata 1 1 0 1 0 1 4Amaranth Ptilotus obovatus 2 1 0 0 0 2 5 var. parviflorus Api ?Trachymene sp. 1 0 0 1 0 0 2Api Eryngium plantagineum 3 0 0 2 0 0 5Aster Brachyscome ciliaris 3 2 1 0 0 0 6Aster Brachyscome heterodonta 3 0 0 0 0 0 3Aster Calocephalus sp. 0 1 0 0 0 1 2Aster Calotis anthemoides 1 0 0 0 0 0 1Aster Calotis cuneifolia 3 0 9 0 1 0 13Aster Calotis lappulacea 2 1 7 0 1 1 12Aster Calotis scabiosifolia 0 0 0 2 0 1 3Aster *Carthamus lanatus 2 0 0 0 0 0 2Aster Cymbonotus lawsonianus 3 0 0 0 0 0 3Aster Eclipta platyglossa 0 0 0 1 0 0 1Aster Hedypnois rhagodioloides 1 0 0 0 0 0 1Aster Isoetopsis graminifolia 1 0 0 0 0 0 1Aster Ixiolaena leptolepis 0 0 0 2 0 0 2Aster Ixiolaena tomentosa 0 0 0 1 0 0 1Aster Minuria integerrima 1 0 0 0 0 1 2Aster Podospermum resedifolium 1 0 0 1 1 0 3Aster Pycnosorus chrysanthus 4 0 0 2 0 1 7Aster Rhodanthe corymbiflora 1 2 0 0 0 1 4Aster Solenogyne bellioides 0 0 1 0 0 0 1Aster *Sonchus oleraceus 0 0 2 2 0 1 5Aster Triptilodiscus pygmaeus 1 0 0 0 0 0 1Aster Vittadinia sp. [V. gracilis?] 7 2 10 1 1 3 24Brassic *Lepidium africanum 2 0 2 0 0 2 6Campanul Wahlenbergia spp. 4 2 6 0 0 1 13Caryophyll *Spergularia rubra 3 2 0 0 0 1 6Chenopodi Atriplex semibaccata 2 2 5 0 1 3 13Chenopodi Atriplex spinibractea 1 2 7 0 1 2 13Chenopodi Chenopodium desertorum 1 0 7 0 0 2 10Chenopodi Einadia hastata 1 0 4 0 0 0 5Chenopodi Einadia nutans 7 2 11 0 1 4 25Chenopodi Enchylaena tomentosa 0 2 8 0 0 3 13Chenopodi Maireana decalvans 4 0 0 0 1 0 5Chenopodi Maireana enchylaenoides 3 0 0 0 0 0 3Chenopodi Maireana humillima 0 0 1 0 0 0 1Chenopodi Salsola kali 1 2 4 0 0 0 7

214 Cunninghamia 10(2): 2007 Rankin, Semple, Murphy & Koen, ‘Soils’ and ‘vegetation’— A case study from central western NSW
F A B C D E all soils 9 sites 2 sites 11 sites 2 sites 1 sites 4 sites 29 sites
Chenopodi Sclerolaena brachyptera 0 0 0 0 0 1 1 Chenopodi Sclerolaena muricata 1 2 4 0 1 3 11Chenopodi Sclerolaena stelligera 1 0 0 0 0 0 1Convolvul Convolvulus erubescens 3 2 2 1 0 2 10Convolvul Dichondra repens 4 2 8 0 1 2 17Crassul Crassula sp. 1 0 0 0 0 0 1Euphorbi Chamaesyce drummondii 3 2 1 1 0 1 8Fab Glycine sp. 1 1 1 0 0 0 3Fab Swainsona procumbens 2 0 0 2 0 0 4Goodeni Goodenia spp. 1 0 1 1 0 0 3Goodeni Goodenia pinnatifida 4 2 10 0 1 2 19Lami *Marrubium vulgare 0 0 6 0 1 1 8Lami *Salvia verbenaca 0 0 4 0 0 0 4Lami Teucrium racemosum 1 0 0 0 0 0 1Lin Linum marginale 1 0 0 1 0 0 2Lobeli Pratia concolor 0 0 0 2 0 2 4Lythr Lythrum hyssopifolia 0 0 0 2 0 0 2Malv Sida corrugata 2 2 7 0 0 2 13Malv Sida cunninghamii 4 2 0 1 0 3 10Myopora Eremophila debilis 3 0 3 0 0 0 6Oxalid Oxalis sp. 8 2 10 2 1 3 26Plantagin Plantago drummondii 6 0 0 0 0 0 6Polygon Rumex tenax 3 2 1 1 1 2 10Ranuncul Ranunculus sp. 0 0 0 2 0 0 2Rubi Asperula cunninghamii 4 1 0 2 0 0 7Scrophulari Mimulus gracilis 1 0 0 0 0 0 1Solan Solanum esuriale 3 1 2 0 0 1 7
Total number of ground-storey species 78 38 47 39 21 49 101
‘Annual herbage’ ¶ 9 11 1 1 1 4 28