Embed Size (px)
Citation preview

November 2020 || https://headwaterseconomics.org
Is Rural America Really Doing So Badly? Lessons from the Transformation of Rural Counties

Is rural America really doing so badly? | November 2020 | 1
Is Rural America Really Doing So Badly?
Published Online: https://headwaterseconomics.org/economic-development/rural-transformation
About Headwaters Economics Headwaters Economics is an independent, nonprofit research group whose mission is to improve community development and land management decisions. https://headwaterseconomics.org/
Author Information Megan Lawson, Ph.D. | 406-570-7475 | [email protected]
Acknowledgments This report was made possible by a grant from the Wilburforce Foundation.
P.O. Box 7059 | Bozeman, MT 59771 https://headwaterseconomics.org

Is rural America really doing so badly? | November 2020 | 2
Table of Contents 1. Introduction and background ................................................................................................................. 3
When rural communities grow, by definition they are no longer “Rural” ....................................................4
Communities grow for many reasons ............................................................................................................4
Research questions ........................................................................................................................................4
Definitions .....................................................................................................................................................5
2. Which counties switched to Urban and which stayed Rural? .............................................................. 5
3. What kinds of counties switched from Rural to Urban? ...................................................................... 7
Close to existing Urban area..........................................................................................................................7
Diverse economies ........................................................................................................................................8
Universities ....................................................................................................................................................8
Regionally important factors for switching from Rural to Urban .................................................................9
4. What kind of counties stayed Rural? .................................................................................................... 10
Dependent on natural resources...................................................................................................................10
Amenity-based economies...........................................................................................................................11
5. Socioeconomic indicators of “switchers” compared to “stayers” ..................................................... 11
Population ....................................................................................................................................................11
Poverty.........................................................................................................................................................12
College attainment .......................................................................................................................................13
Average earnings per job .............................................................................................................................13
Unemployment ............................................................................................................................................13
Summary .....................................................................................................................................................14
6. Conclusion ............................................................................................................................................... 15
7. Appendix: Data Sources & Methods ...................................................................................................... 16
Citations .......................................................................................................................................................... 18

Is rural America really doing so badly? | November 2020 | 3
1. Introduction and background
The well-being of rural America has been a concern of policymakers, politicians, and pundits in recent years. Substantial media coverage has highlighted “failing rural communities.” However, rural America is a complicated place. Some parts of rural America are thriving. For example, 48% of counties that were rural in 1970 grew so much that today they are classified as urban, and the average poverty rate in rural counties declined by 26% between 1970 and 2018.
As policymakers consider how to help rural communities (particularly as the country recovers from the COVID-19 pandemic), they must develop policies that address the many different stories that make up “rural” – places that have low populations or are losing population because their economies cyclically boom and bust; places that are growing quickly (perhaps too quickly) and are facing big-city growth challenges; and places that have grown out of their “rural” designation to become cities.
While rural voters account for 6% of the U.S. population, they live in 51% of the U.S. land area, giving them a disproportionately large voice in both the electoral college and the U.S. Senate. Rather than discounting, homogenizing, or overlooking rural places, national elected representatives must address the diverse needs of rural residents.
In this paper we explore why some rural communities have grown economically over time, sometimes enough that, by government definitions, their classification changes from Rural to Metropolitan or Micropolitan (shortened to “Urban” in this paper). Notably, almost half of the counties that were classified as Rural in 1970 grew enough to be reclassified as Urban by 2018. These communities tended to have younger residents and higher per capita income. When, over time, these counties switch to the Urban classification, the counties that remain Rural appear, on average, older, poorer, and less educated.1
When we try to understand what makes rural communities function, looking only at places that have remained in the Rural classification omits important stories about places that have grown and changed during the past 50 years.
Our research finds the following: • Counties that over time remained in the Rural classification had,
on average, the least growth in terms of population change,earnings per job, and college attainment. When compared tocounties that were always Urban or switched from Rural toUrban, counties that have over time remained Rural showedgreater improvement in poverty rate and unemployment rate.
•
•
Rural counties that grew enough to switch to the Urban classification most often were close to an existing city, had diversified, non-specialized economies, and often had a university.Counties that stayed Rural are not homogeneous, but they often have some economic specialization or dependence. Counties that stayed Rural and lost population tended to depend on farming, mining, or oil and gas. Counties that stayed Rural and gained
Formal Delineations A county’s status as Rural, Metropolitan, or Micropolitan is based primarily on population size.
The U.S. Office of Management and Budget (OMB) publishes standards to define metropolitan and micropolitan areas.1 In summary:
• A MetropolitanStatistical Area is acounty with at least oneurbanized area with apopulation of at least50,000.
• A MicropolitanStatistical Area is acounty with at least oneurbanized area with apopulation of at least10,000 but less than50,000.
• A Rural area is neitherMetropolitan norMicropolitan.
OMB also considers economic connectivity—such as people commuting from rural places to work in cities—to determine classifications. This is why some places look rural but are technically classified as Metropolitan.
We use the term “Urban” to refer to either Metropolitan or Micropolitan areas.

Is rural America really doing so badly? | November 2020 | 4
population (though not enough to switch to Urban) tended to be recreation-dependent and/or retirement destinations.
• The impacts of COVID-19 on rural communities are ongoing. Some rural communities have experienced devastating outbreaks while others have remained relatively healthy. The economic impacts have hit some severely while others have remained relatively unscathed. Some rural communities have seen a large influx of new residents from urban areas seeking what they perceive as a lower-risk environment, but it is unclear whether these residents will remain once the pandemic subsides.
When rural communities grow, by definition they are no longer “Rural” In May 2019, a Washington Post headline read: “The real (surprisingly comfortable) reason rural America is doomed to decline.”2 The “surprisingly comfortable” reason was that some counties grow to the point where they are reclassified by government as Metropolitan (Metro)—that is, they switched from one county classification to another. The counties that stay in the Rural classification are not growing as fast. Hence, the Post’s declaration that rural America is doomed to decline. In other words, rural America is reported as declining in part because we no longer count as Rural those counties that grew into a Metro classification. We are measuring those counties that stay Rural which, by definition, have not grown. Rural places face economic headwinds. But much of the narrative of “struggling rural America” overlooks that many small communities have prospered during the past 50 years and therefore are no longer classified as Rural.
Communities grow for many reasons Goetz et al. (2018)3 point out that it is inaccurate to describe rural America as uniformly in decline. Rural areas are diverse, and some are doing well while others are not. Some are gaining population, others are in decline, and yet some have maintained a constant population. Goetz at al. write also that some rural counties may be doing surprisingly well because they are adjacent to metropolitan areas, or because they possess “attractive landscapes, mountains, lakes, oceans, and a pleasant climate” that attracts amenity migrants. The authors point out that the rural counties that tend to struggle economically are those that are remote or dependent on resource extraction. This is similar to findings by Rasker et al. (2009)4 who classify the western United States into three types of counties: metro, non-metro but connected to metro via airports, and rural isolated. The counties classified as rural-isolated tend to lag behind the other categories in terms of economic and demographic metrics.5 This analysis is not prescriptive: we do not necessarily equate growth with success. Some rural community residents prefer to not grow and would rather maintain a steady population in a stable environment. Some see the consequences of growth as a mixed blessing—higher wages and a more diverse economy come at a cost. The housing affordability crisis that has emerged in high-growth resort areas is a prime example of why some question whether growth is worth it.6
Research questions Mindful of the nuances of how rural places are defined, the purpose of this paper is to describe more accurately the economic performance of rural counties over time, and to learn why some rural counties grow while others remain steady or decline. We ask the following research questions:
• Which counties switched from Rural to Urban? Are there regional or temporal patterns to those changes? • What are the geographic and socioeconomic characteristics of counties that switched compared to
counties that remain Rural? • How do the socioeconomic indicators of places that switched to Urban compare to places that stayed
Rural? Put another way, how is the 1970 cohort of Rural counties doing today?

Is rural America really doing so badly? | November 2020 | 5
Definitions “Rural” and “Urban,” “Switchers” and “Stayers” In this report we classify Metropolitan Statistical Areas and Micropolitan Statistical Areas as Urban. We classify all other counties as Rural. We use uppercase “Urban” or “Rural” when we refer to a county’s official delineation. Counties are re-evaluated roughly every five years using either the latest Decennial Census or American Community Survey data. This analysis uses the September 2018 delineations to correspond with the latest published socioeconomic data available at the time of analysis.7 Using historical delineation files, we identify “switchers”—counties that were Rural in 1970 and by 2018 had switched classification to be Urban, and “always-Rural”—counties that were Rural in 1970 and stayed in that classification in 2018. We use the term “always-Urban” to refer to counties that were Urban in 1970.
2. Which counties switched to Urban and which stayed Rural? Of the 3,146 counties in the United States, 2,504 (80%) were Rural in 1970. Of these 2,504 Rural counties, 1,207 (48%) are switchers, becoming Urban by 2018. Figure 1 shows the counties’ classification. Always-Rural counties (in green) make up 1,297 (41.2%) of all counties. Counties that switched to being reclassified as Urban by 2018 (in blue) make up 1,207 (38.4%) of all counties. Always-Urban counties (white) make up 642 (20.4%) of all counties. Fig. 1. Counties that from 1970 to 2018 stayed Rural (dark blue), switched from Rural to Urban (light blue), or were always Urban (white).

Is rural America really doing so badly? | November 2020 | 6
Regions vary substantially in level of urbanization. Table 1 shows the total number of counties, the number of counties that switched from Rural to Urban between 1970 and 2018, the share of Rural counties that switched, and the share of all counties that stayed Rural in 2018.
In the Midwest, 49% of counties were always Rural. While the Northeast had the fewest switchers, as a geographically small region these switchers represent two-thirds of the Rural counties in the region in 1970. In the South more than half of Rural counties have switched, and 38% of all counties were always Rural. In the West nearly half of Rural counties switched (47%) and nearly half (46%) of all counties were always Rural. __________________________________________________________________________________________________________________________________ Table 1. The number of counties that were Rural in 1970 and by 2018 switched to Urban, and counties that since 1970 have always been Rural or Urban.
Midwest Northeast South West U.S.
Total # of counties 1,055 244 1,395 452 3,146
# of “switchers” (Rural to Urban), 1970-2018 360 86 579 182 1,207 % of all counties that switched 34% 35% 42% 40% 38% % of all counties that stayed Rural 49% 18% 38% 46% 41% % of all counties that stayed Urban 17% 47% 20% 14% 20%
__________________________________________________________________________________________________________________________________
Figure 2 shows the number of counties that switched from Rural to Urban, by decade. Nearly 70% of counties that switched did so between 1990 and 2000. The large number that switched between 1990 and 2000 is largely due to the introduction of a new “Micropolitan” category. Of the 838 counties that switched between1990 and 2000, 600 (72%) switched from Rural to the new “Micropolitan” category introduced for the 2003 county delineations.8 The 2003 delineations also included a
substantial revision of the classification standards that newly defined counties with a large share of residents commuting to adjacent cities as “Metropolitan.”
Fig. 2. Decade when counties switched from Rural to Urban classification.
135 95
838
65 74
1970-1980 1980-1990 1990-2000 2000-2010 2010-2018
Num
ber o
f cou
ntie
s tha
t be
com
e U
rban
Is rural America really doing so badly? | November 2020 | 7
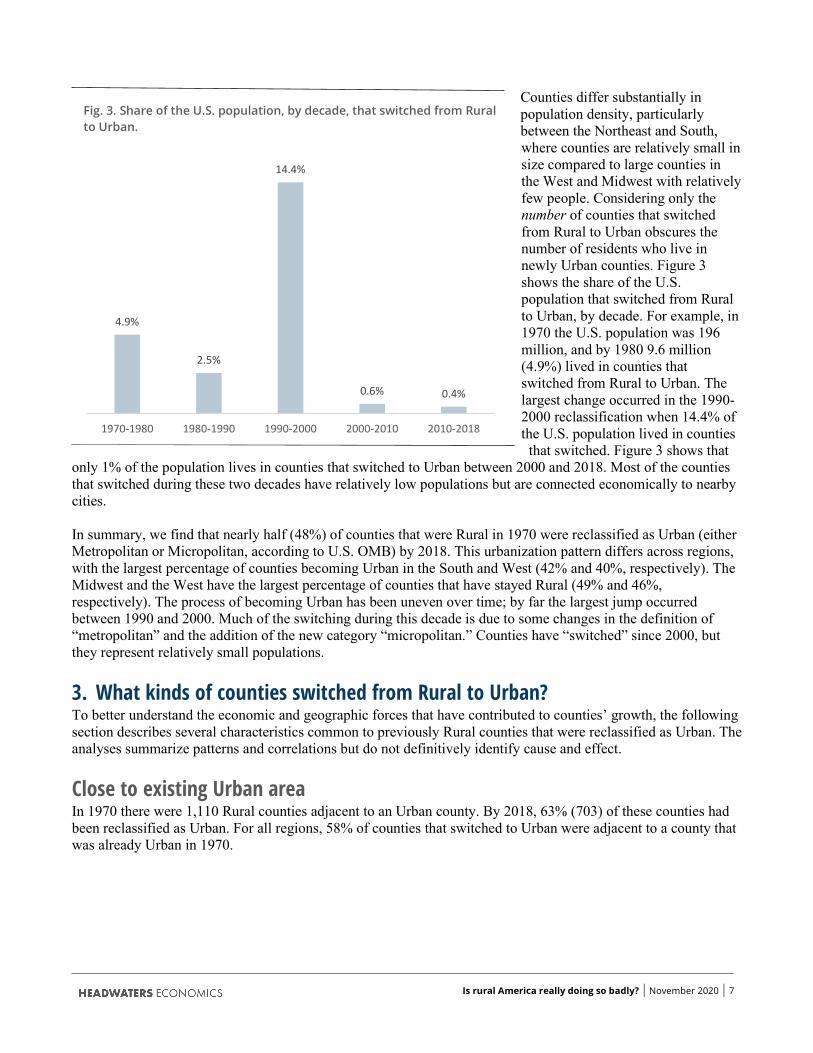
Counties differ substantially in population density, particularly between the Northeast and South, where counties are relatively small in size compared to large counties in the West and Midwest with relatively few people. Considering only the number of counties that switched from Rural to Urban obscures the number of residents who live in newly Urban counties. Figure 3 shows the share of the U.S. population that switched from Rural to Urban, by decade. For example, in 1970 the U.S. population was 196 million, and by 1980 9.6 million (4.9%) lived in counties that switched from Rural to Urban. The largest change occurred in the 1990-2000 reclassification when 14.4% of the U.S. population lived in counties
that switched. Figure 3 shows that only 1% of the population lives in counties that switched to Urban between 2000 and 2018. Most of the counties that switched during these two decades have relatively low populations but are connected economically to nearby cities. In summary, we find that nearly half (48%) of counties that were Rural in 1970 were reclassified as Urban (either Metropolitan or Micropolitan, according to U.S. OMB) by 2018. This urbanization pattern differs across regions, with the largest percentage of counties becoming Urban in the South and West (42% and 40%, respectively). The Midwest and the West have the largest percentage of counties that have stayed Rural (49% and 46%, respectively). The process of becoming Urban has been uneven over time; by far the largest jump occurred between 1990 and 2000. Much of the switching during this decade is due to some changes in the definition of “metropolitan” and the addition of the new category “micropolitan.” Counties have “switched” since 2000, but they represent relatively small populations.
3. What kinds of counties switched from Rural to Urban? To better understand the economic and geographic forces that have contributed to counties’ growth, the following section describes several characteristics common to previously Rural counties that were reclassified as Urban. The analyses summarize patterns and correlations but do not definitively identify cause and effect.
Close to existing Urban area In 1970 there were 1,110 Rural counties adjacent to an Urban county. By 2018, 63% (703) of these counties had been reclassified as Urban. For all regions, 58% of counties that switched to Urban were adjacent to a county that was already Urban in 1970.
Fig. 3. Share of the U.S. population, by decade, that switched from Rural to Urban.
4.9%
2.5%
14.4%
0.6% 0.4%
1970-1980 1980-1990 1990-2000 2000-2010 2010-2018

Is rural America really doing so badly? | November 2020 | 8
Figure 4 summarizes the share of counties that were Rural and adjacent to an Urban county in 1970. The change to Urban status is most pronounced in the Northeast, where 76% of counties that were Rural and adjacent to an Urban area switched. In the West, 69% of Rural counties next to Urban counties switched, and in both the Midwest and South 61% of Rural counties switched. This pattern aligns with researchers’ findings that places that are connected to cities—whether because they adjoin the city or are connected via regular air travel9—are most likely to grow and have economic opportunities comparable to cities. The frequency with which Rural counties adjacent to Urban counties switch to becoming Urban can be attributed to two primary factors. First,
as urban areas grow, they will grow out—sprawling into nearby areas—before they grow vertically and increase density. Counties that switched to Urban have absorbed much of the population growth for larger urban areas. Second, Rural counties are economically connected to their Urban neighbors as service providers (e.g., health care and retail) and as employment centers. Many residents of Rural counties commute to Urban counties for work. Therefore, even counties that look rural may be classified as Urban if enough residents commute to the nearby Urban county for work. These cross-county commuting patterns are one of the reasons the Bureau of the Census has used an additional classification called “metro outlying."10
Diverse economies Counties that switched often have a diverse economy that is not dependent on any one sector or employer. We use the U.S. Department of Agriculture’s Economic Research Service (ERS) county typology codes to measure economic specialization. Counties that are not dependent on any one sector are defined as “non-specialized.” Of the 1,207 counties that were Rural in 1970 and switched to Urban by 2018, 497 (41%) have non-specialized economies. The share is highest in the South (45%) and lowest in the West (32%). Counties that have stayed Rural are more likely to be specialized in mining, farming, manufacturing, or recreation. A later section describes these patterns in greater detail. Diverse economies help Rural communities to weather the boom and bust cycles that accompany many sectors, particularly with mining and agriculture. Counties with a diversified economy often are better positioned to recover from national recessions and avoid significant population loss when individual employers close.
Universities Many counties that switched to Urban have a university. Across the United States, 25% of counties that switched have a university.11 The effect of universities is particularly pronounced in the Northeast, where 49% of counties that switched have a university. Universities are important in the Midwest, West, and South (27%, 23%, and 21% of switchers, respectively), but less so than other factors.
61%
76%
61%
69%
63%
Midwest Northeast South West Total% o
f Rur
al c
ount
ies n
ext t
o U
rban
cou
ntie
s in
1970
that
switc
hed
to U
rban
Fig. 4. Share of counties that were Rural and adjacent to an Urban county in 1970 that switched to Urban by 2018.

Is rural America really doing so badly? | November 2020 | 9
Universities can fuel rural growth in several ways. First, universities employ a large number of workers in a range of occupations including administration, teaching, and construction and maintenance. Second, universities can help to incubate innovative new businesses and serve as networking hubs. Universities also provide an educated workforce for employers in the area. Finally, universities purchase significant quantities of goods and services, which can have a large impact if these purchases are made from local businesses.12, 13 Grafton County, New Hampshire, for example, is home to Dartmouth College and Plymouth State University. The county changed classification to “micropolitan” in 2000. Its population grew by 79% between 1970 and 2018, from 50,134 in 1970 to 89,811 in 2018.
Regionally important factors for switching from Rural to Urban Different economic specializations in counties that switched from Rural to Urban are more common in some regions of the United States than in others. Figure 5 and the following section summarize the types of economic specialization most common among counties that switched. Counties that switched in the Midwest and South often depend on manufacturing In the Midwest and South, counties that switched are likely to be dependent on manufacturing: 29% of Midwest counties and 21% of Southern counties that switched are manufacturing-dependent. Only 8% of counties that switched in the Northeast and 3% of counties in the West are manufacturing-dependent. For example, Elkhart County, Indiana, is a leading manufacturing center for recreational vehicles, with more than 80% of RV production occurring in the county. This manufacturing hub developed because of its proximity to Detroit (200 miles away) with its skilled automotive manufacturing workforce, and proximity to suppliers and the interstate.14 Elkhart County switched from Rural to Urban in 1980.
Retirement destinations in the South and West In the South and West, roughly one in four counties that switched (22% in the South and 28% in the West) are retirement destinations. ERS defines retirement destinations as counties in which the number of residents 60 and older grew by 15% or more between 2000 and 2010 due to net migration. Retirees bring with them non-labor income from 401k and retirement nest eggs, pensions, and revenue from Medicare. This non-labor income supports jobs in construction, health care, real estate, and other sectors.15 Retirement destinations of course attract retirees, but they also attract new residents of all ages to fill the jobs that retirees create. In Florida, 18 of the 28 counties that switched from Rural to Urban are retirement destinations. In Sumter County, east of Orlando, population grew by 755% between 1970 and 2018. It switched to Urban in 2000. Sumter County is home to The
Fig. 5. Economic specialization for counties that stayed Rural and counties that switched from Rural to Urban, 1970-2018.
25%28%
10%
15%
11%12%
41%
7% 7%
19%
15%
11%
Stayed Rural Switched
Is rural America really doing so badly? | November 2020 | 10
Villages, a community for residents 55 and older. Sumter County has the oldest median age of any U.S. county (62 years; the U.S. average is 37.9) and 56% of its residents are 65 and older. Recreation economies in the Northeast and West In the Northeast and West, 30% and 31% of counties that switched, respectively, are recreation-dependent. Recreation dependence means that a high share of jobs and income are in tourism-related sectors and a relatively high share of housing is second homes.16 Rural counties that are recreation-dependent have seen faster growth—largely due to in-migration—than other rural counties.17 People moving in support the tourism-supporting industries, and also support other sectors. These places, on average, have experienced faster growth in earnings per job, suggesting growth in jobs in higher-wage services. Recreation-dependent places have grown due to a combination of high quality of life and economic opportunities beyond traditional tourism-supporting jobs. The amenities that attract visitors to a community can also attract new residents and business owners, who in turn use amenities as a way to attract a talented workforce. Summit County, Colorado—home to Breckenridge, Copper Mountain, and Keystone ski resorts—switched from Rural to Urban in 2000. Its population increased more than 1,000% between 1970 and 2018, from 2,660 to 30,429 in 2018. Government-dependent counties in the West Some counties that switched from Rural to Urban rely on government jobs—including federal and state agencies, and county and municipal staff. In the West, 25% of counties that switched from Rural to Urban depend on government jobs. These jobs are particularly valuable in rural communities because they provide relatively high-paying, stable jobs. In many communities, growth in government jobs roughly mirrors growth in population. In some communities, such as state capitals of rural states (e.g., Lewis and Clark County, Montana; Albany County, Wyoming), government accounts for a large share of jobs. Other counties have corrections facilities (e.g., Del Norte County, California).
4. What kind of counties stayed Rural? Of the 2,504 counties classified as Rural in 1970, 1,297 (52%) stayed Rural in 2018. This means their populations did not grow enough to warrant a change in classification to either metropolitan or micropolitan, as defined by the Office of Management and Budget. There are significant regional variations: from 1970 to 2018 only 33% of counties in the Northeast stayed Rural. In the South 48% of counties stayed Rural, followed by the West (53%) and Midwest (59%). Counties that stayed Rural are more likely to have some type of economic specialization, whether mining, farming, manufacturing, or recreation: 25% of counties that stayed Rural have a non-specialized economy while 41% of counties that switched to Urban are non-specialized.
Dependent on natural resources No single story describes always-Rural counties. For example, population change—the primary means by which metropolitan status is determined—varies tremendously even within the cohort of counties that stayed Rural, from declines of nearly 80% between 1970 and 2018 to increases of nearly 700%. The places that have lost the most population tend to have resource-dependent or farming economies. Eight of the 10 counties that have had the largest percent decline in population were mining- or farming-dependent communities. For example, the population of Harding County, New Mexico, a rural ranching community, has declined by nearly 80% since 1970.

Is rural America really doing so badly? | November 2020 | 11
Of the 1,297 always-Rural counties, 40% depend on mining, oil and gas production, and farming. Of the 524 always-Rural counties that depend on mining, oil and gas, or farming communities, 69% lost population between 1970 and 2018. In boom years, mining and oil and gas communities can attract new residents who earn high incomes. During cyclical downturns, many residents leave or endure low incomes until the next boom. Farming communities have not had the similar boom-bust cycle as commodity-dependent places but have lost population because increased efficiency of agricultural production requires less labor to produce the same amount.
Amenity-based economies Most places that have grown rapidly while staying Rural are recreation-dependent or are retirement destinations and tend to have amenity-based economies. Nine of the 10 counties that grew the most between 1970 and 2018 were recreation-dependent and/or retirement destinations. Of the 297 counties that stayed Rural and are either recreation or retirement destinations, only 13% lost population between 1970 and 2018. San Juan County, Washington, is a cluster of islands between Washington and Vancouver Island, British Columbia, with a recreation-dependent economy. Between 1970 and 2018 its population grew by 332%. San Juan County is also one of the wealthiest counties in the country. The same amenities that draw visitors and recreationists also bring in relatively wealthy people with investment income. The recreation amenities also are part of the quality of life for residents and newcomers. Some of the fastest-growing recreation and retirement counties are near urban areas. Burnet County, Texas, for example, more than tripled in population from 11,254 residents in 1970 to 45,750 residents in 2018. Burnet County lies immediately west of Austin, Texas. As its population continues to increase, it likely will switch to Urban in the 2020 decennial census. Population change does not capture other challenges facing rural communities, especially those that are growing quickly due to their natural amenities. Recreation communities face a rapidly increasing cost of living, changing community character, and ecological impacts to the natural resources that are attracting new residents. Some places with dramatic population growth rates started with very small populations: for example, Hinsdale County, Colorado, grew from 111 residents in 1970 to 878 in 2018, a seven-fold increase.
5. Socioeconomic indicators of “switchers” compared to “stayers” Economic performance indicators that look only at counties that stay Rural overlook rapid growth in counties that were classified as Rural but switched to Urban (metropolitan or micropolitan) since 1970. Table 2 summarizes socioeconomic indicators for always- Urban counties, counties that switched to Urban, and counties that stayed Rural. We summarize each socioeconomic indicator in further detail below.
Population The population in all counties that were Rural in 1970 (including both “switchers” and “stayers”) has grown steadily (52% growth since 1970), but substantially slower than the growth rate of 1970 metro counties (126% growth). However, when we separate the 1970 Rural counties into those that stayed Rural and those that switched to Urban, we see that population has grown much faster in counties that switched to Urban between 1970 and 2018 (87% growth) compared to counties that stayed Rural (19% growth) (see Figure 6). This is logical because counties that grow, by definition, become classified as Metropolitan or Micropolitan.

Is rural America really doing so badly? | November 2020 | 12
__________________________________________________________________________________________________________________________________ Table 2. Percent change in socioeconomic indicators between 1970 and 2018 for counties that were Urban in 1970, switched to Urban, or stayed Rural.
Socioeconomic Indicator
County average, 2018 % change, 1970-2018
Always Urban
Switched to Urban
Always Rural
Always Urban
Switched to Urban
Always Rural
Population 368,527 56,194 13,780 126% 87% 19% Poverty rate 13% 16% 17% 9% -12% -26% College attainment 30% 18% 21% 521% 466% 463% Earnings per job $32,276 $24,662 $22,357 66% 58% 56% Unemployment rate 3.8% 4.1% 4.3% -41% -33% -21%
__________________________________________________________________________________________________________________________________ __________________________________________________________________________________________________________________________________ Figure 6. Population growth rates, 1970-2018, for Urban, Rural, and counties that switched. Change since 1970.
__________________________________________________________________________________________________________________________________
Poverty Poverty is the one indicator in which counties that were Rural in 1970 have improved more than their Urban counterparts. The poverty rate declined by 12% for counties that switched to Urban and by 26% for counties that stayed Rural, while increasing by 9% in counties that were always Urban. Despite these improvements, poverty rates remain lowest for always-Urban counties (13%), followed by formerly Rural counties that switched to Urban (16%) and always-Rural counties (17%).
52%
19%
87%
126%
1970 1980 1990 2000 2010 2018
All "stayers" and "switchers" Stay Rural Switched to Urban Always Urban

Is rural America really doing so badly? | November 2020 | 13
College attainment Of the set of socioeconomic indicators analyzed, college attainment is most dramatically different between the county types. In counties that were always Urban, the percentage of people in the county with a bachelor’s degree increased by 521%. Counties that switched from Rural to Urban increased by 466% and counties that were Rural in 1970 and stayed Rural in 2018 increased by 463%. The difference in growth rate of college graduates between “switchers” and “stayers” is not statistically significant.
Average earnings per job Since 1970, average earnings per job have been higher and have increased the most in counties that were always Urban. Higher initial average earnings per job in 1970 combined with a faster growth rate has led to a significant divergence in earnings per job between Urban and Rural counties even when we include “switchers” as Rural. In 1970, average earnings per job in always-Urban counties were 28% higher than counties that were Rural in 1970. By 2018, that gap had grown to 38%. Average earnings per job increased the most in always-Urban counties (66% increase), followed by counties that switched to Urban (58% increase) and always-Rural counties (56% increase). The difference in growth rates between switchers and stayers is marginally significant (p=0.07).
Unemployment In 1970, unemployment was lowest in always-Rural counties (6.2%), followed by the always-Urban counties (7.01%) and counties that switched to Urban (7.05%). The difference between always-Urban and counties that switched to Urban is not statistically significant. Since 1970, unemployment decreased the most in always-Urban counties (-41%), followed by counties that switched to Urban (-33%) and counties that stay Rural (-21%). As a result, unemployment today is lowest for the most urbanized counties. Unemployment during the COIVD-19 pandemic The COVID-19 pandemic has affected counties in very different ways, with counties that have always been Urban most affected. Figure 8 shows the difference in unemployment rate between 2019 and 2020 for the months of April and July, for always-Rural counties, counties that switched from Rural to Urban, and always-Urban counties.
In all three types of counties, the average unemployment rate was higher in April and July 2020 than it was during the same months in 2019. Always-Urban counties have been hit the hardest, with the largest increase in unemployment rate since 2019: 11 percentage points higher in April 2020 than in April 2019 and 5 percentage points higher in July 2019 than in July 2020. Always-Rural counties have had the smallest change in unemployment rate since 2019 (7 percentage points higher in April and 3 percentage points higher in July), and counties that switched from Rural to Urban are in the middle. The differences between each group, and between years, are all statistically significant.
Fig. 8. During the COVID-19 pandemic unemployment rates rose the most in always-Urban counties and the least in always-Rural counties.
7%
9%11%
Always-Rural Switched fromRural to Urban
Always-Urban
Perc
enta
ge p
oint
diff
eren
ce
in u
nem
ploy
men
t rat
e be
twee
n Ap
ril, 2
019
and
April
, 202
0

Is rural America really doing so badly? | November 2020 | 14
This pattern reflects the differences in the level of COVID-19 infections during this time period, the intensity of public health measures to control the infection’s spread, and the economic composition of the counties in each category. While there have been rural hot spots of infection throughout the pandemic, urban areas have had the largest volume of cases and consequently these cities have had more intensive and longer-lasting restrictions on business operations. With many jobs in urban areas associated with providing face-to-face services, these areas have been affected the most. While there are dramatic exceptions, particularly in Native American communities, many rural counties have not had widespread outbreaks and therefore businesses and employees have not had to endure long-lasting restrictions. Many rural counties also have a higher share of employment in non-service sectors like mining, farming, manufacturing, and construction. While restrictions varied from state to state, construction, for example, was deemed an “essential business” during the initial shutdown of nonessential businesses.
Summary Across the five socioeconomic indicators we report here, counties that switched from Rural to Urban on average perform between the always-Urban counties and the counties that stayed Rural, such as with changes in population, poverty rate, and changes in unemployment rate. On two important indicators—changes in college attainment rates and changes in earnings per job—they perform similarly to their Rural counterparts. Figure 9 summarizes average socioeconomic indicators for the three types of counties. __________________________________________________________________________________________________________________________________
_________________________________________________________________________________________________________________________________
Fig. 9. Change in key socioeconomic indicators, 1970-2020.

Is rural America really doing so badly? | November 2020 | 15
6. Conclusion In this paper we examined a cohort of 2,504 counties classified as Rural by the U.S. Office of Management and Budget in 1970. We analyzed which counties remained Rural in 2018 and which counties were reclassified as Urban by 2018 and compared both to counties that had been classified Urban throughout that 48-year time period. We dissected the characteristics of different types of counties to determine regional and temporal patterns. Counties that switched from Rural to Urban tend to be near existing Urban areas. They tend to have diversified economies that do not depend on one particular economic sector, and often have a university. Within regions, we do see some specialization. In the West and South, for example, many counties that switched from Rural to Urban are retirement destinations. In the Midwest, many counties that switched have strong manufacturing sectors. By definition, always-Rural counties are slower growing than their Urban counterparts. On average, always-Rural counties have experienced slower growth in college attainment and earnings per job than counties that have always been Urban, but they do not lag significantly behind counties that switched from Rural to Urban. Always-Rural counties experienced a significantly greater decline in poverty rates between 1970 and 2018, although poverty rates remain higher than in Urban counties. Always-Rural counties, on average, have had the smallest increase in unemployment rate between 2019 and 2020 (as of July 2020). A range of socioeconomic circumstances lies beneath the blanket narrative of “failing rural communities.”18 National policy conversations, when not overlooking rural concerns altogether, often describe “rural issues” and “rural voters” as a uniform topic when, in fact, there is tremendous variation in experiences and needs among those places that have stayed Rural, as well as those that recently switched from Rural to Urban. Across the United States, Rural counties account for 51% of the land area and 6% of the population. Consequently, rural voters play an outsized role in the electoral college and U.S. Senate. It is critical that those shaping policy for the next four years understand the heterogeneity of rural communities’ experiences and needs. Rural places are not uniform, so different policies are needed to address the needs of different types of Rural places. Many always-Rural counties have not grown tend to be mining- (including oil and gas) dependent or farming-dependent. Farming-dependent communities have been dealing with ongoing population loss as farms consolidate, efficiency increases, and fewer year-round employees are needed. Counties that are mining-dependent have historically dealt with cyclical commodity markets, and some also are now facing a transition away from coal. Policies that can strengthen local institutions and plan for long-term investments in coal-dependent communities can help them weather these economic transitions. Among always-Rural counties, those that grew modestly tend to be recreation-dependent or retirement destinations. Many of these communities have seen rising per capita income, and also face challenges around growing inequality and decreasing housing affordability. Many of these counties likely will switch to Urban after the 2020 census. The analyses described in this paper summarize average trends over the past 50 years. At the time this paper was completed in the Fall of 2020, the COVID-19 pandemic continues. Infection rates are rising in rural places that had previously been spared, high unemployment persists throughout the country, and urbanites have been leaving cities for less dense suburbs, second homes, and rural areas. It is unclear whether the migration to rural areas during the summer of 2020 is a temporary population shift or whether, as new residents purchase homes and enroll children in schools, this pandemic-driven migration will lead to a more durable “rural renaissance” akin to that of the 1970s.
Is rural America really doing so badly? | November 2020 | 16
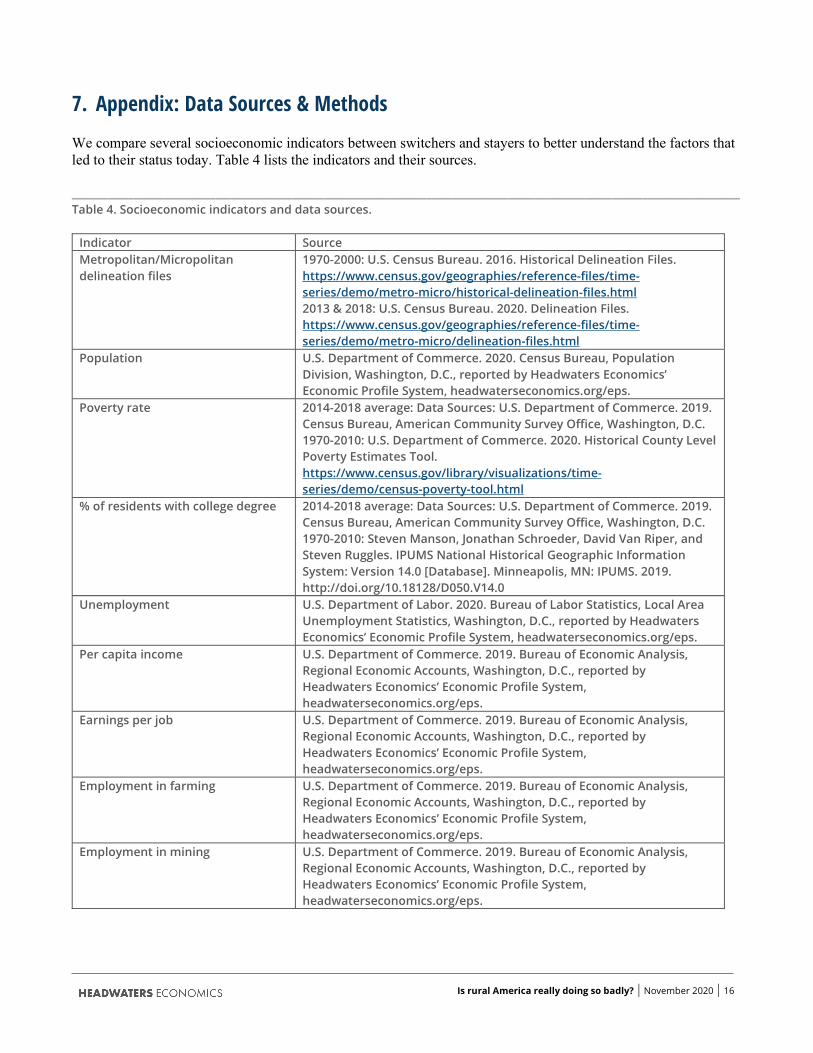
7. Appendix: Data Sources & Methods We compare several socioeconomic indicators between switchers and stayers to better understand the factors that led to their status today. Table 4 lists the indicators and their sources. __________________________________________________________________________________________________________________________________ Table 4. Socioeconomic indicators and data sources.
Indicator Source Metropolitan/Micropolitan delineation files
1970-2000: U.S. Census Bureau. 2016. Historical Delineation Files. https://www.census.gov/geographies/reference-files/time-series/demo/metro-micro/historical-delineation-files.html 2013 & 2018: U.S. Census Bureau. 2020. Delineation Files. https://www.census.gov/geographies/reference-files/time-series/demo/metro-micro/delineation-files.html
Population U.S. Department of Commerce. 2020. Census Bureau, Population Division, Washington, D.C., reported by Headwaters Economics’ Economic Profile System, headwaterseconomics.org/eps.
Poverty rate 2014-2018 average: Data Sources: U.S. Department of Commerce. 2019. Census Bureau, American Community Survey Office, Washington, D.C. 1970-2010: U.S. Department of Commerce. 2020. Historical County Level Poverty Estimates Tool. https://www.census.gov/library/visualizations/time-series/demo/census-poverty-tool.html
% of residents with college degree 2014-2018 average: Data Sources: U.S. Department of Commerce. 2019. Census Bureau, American Community Survey Office, Washington, D.C. 1970-2010: Steven Manson, Jonathan Schroeder, David Van Riper, and Steven Ruggles. IPUMS National Historical Geographic Information System: Version 14.0 [Database]. Minneapolis, MN: IPUMS. 2019. http://doi.org/10.18128/D050.V14.0
Unemployment U.S. Department of Labor. 2020. Bureau of Labor Statistics, Local Area Unemployment Statistics, Washington, D.C., reported by Headwaters Economics’ Economic Profile System, headwaterseconomics.org/eps.
Per capita income U.S. Department of Commerce. 2019. Bureau of Economic Analysis, Regional Economic Accounts, Washington, D.C., reported by Headwaters Economics’ Economic Profile System, headwaterseconomics.org/eps.
Earnings per job U.S. Department of Commerce. 2019. Bureau of Economic Analysis, Regional Economic Accounts, Washington, D.C., reported by Headwaters Economics’ Economic Profile System, headwaterseconomics.org/eps.
Employment in farming U.S. Department of Commerce. 2019. Bureau of Economic Analysis, Regional Economic Accounts, Washington, D.C., reported by Headwaters Economics’ Economic Profile System, headwaterseconomics.org/eps.
Employment in mining U.S. Department of Commerce. 2019. Bureau of Economic Analysis, Regional Economic Accounts, Washington, D.C., reported by Headwaters Economics’ Economic Profile System, headwaterseconomics.org/eps.

Is rural America really doing so badly? | November 2020 | 17
Indicator Source Employment in manufacturing U.S. Department of Commerce. 2019. Bureau of Economic Analysis,
Regional Economic Accounts, Washington, D.C., reported by Headwaters Economics’ Economic Profile System, headwaterseconomics.org/eps.
Presence of a university U.S. Homeland Infrastructure Foundation-Level Data. 2020. Colleges and Universities. https://hifld-geoplatform.opendata.arcgis.com/datasets/colleges-and-universities
Economic specialization in farming, mining, manufacturing, recreation, government, or retirement destination
U.S. Department of Agriculture Economic Research Service. 2015. County Typology Codes. https://www.ers.usda.gov/data-products/county-typology-codes/
We determined that counties have a university if they have at least 500 full-time students, a graduate school program, and are a degree-granting institution. We identify counties that were adjacent to a metropolitan county in 1970 using historical delineation files and GIS analysis.

Is rural America really doing so badly? | November 2020 | 18
Citations 1 Johnson K & Lichter D. (2020). Metropolitan Reclassification and the Urbanization of Rural America. Demography (2020): 1-22. 2 Van Dam A. (2019, May 24). The real (surprisingly comforting) reason rural America is doomed to decline. Washington Post. Retrieved from https://www.washingtonpost.com/business/2019/05/24/real-surprisingly-comforting-reason-rural-america-is-doomed-decline/ 3 Goetz SJ, Partridge MD, & Stephens HM. (2018). The economic status of rural America in the President Trump era and beyond. Applied Economic Perspectives and Policy, 40(1), 97-118. 4 Rasker R, Gude PH, Gude JA, & van den Noor J. (2009). The Economic Importance of Air Travel in High-Amenity Rural Areas. Journal of Rural Studies, 25(2009), 343-353. 5 Three Wests. (2015). Bozeman, MT: Headwaters Economics. Retrieved from https://headwaterseconomics.org/dataviz/three-wests/ 6 Lawson, M. (2020). Housing in recreation counties is less affordable. Bozeman, MT: Headwaters Economics. Retrieved from https://headwaterseconomics.org/equity/housing-affordability-recreation-counties/ 7 U.S. Census. (2020). Delineation files. Washington, DC: U.S. Department of Commerce. Retrieved from https://www.census.gov/geographies/reference-files/time-series/demo/metro-micro/delineation-files.html 8 We align the delineation updates to the prior decade (most recent) decennial census. For example, the 2003 delineations are based on results from the 2000 decennial census. Our subsequent analyses use the 2003 delineations and 2000 decennial census data for socioeconomic metrics. 9 Goetz SJ, Partridge MD, & Stephens HM. (2018). The economic status of rural America in the President Trump era and beyond. Applied Economic Perspectives and Policy, 40(1), 97-118. Rasker R, Gude PH, Gude JA, & van den Noor J. (2009). The Economic Importance of Air Travel in High-Amenity Rural Areas. Journal of Rural Studies, 25(2009), 343-353. 10 According to the Bureau of the Census, “A county qualifies as outlying under the following circumstances: (1) one-quarter or more of the employed residents work in the central counties of the metro area, or (2) one-quarter or more of the employment is composed of workers who live in the central counties. Furthermore, outlying counties also include the counties of any smaller metro or micro area that are adjacent to the metro area and merge with it. Retrieved from https://www.census.gov/prod/2009pubs/p25-1136.pdf 11 We define a university as a graduate degree-granting institution with at least 500 full-time students. 12 Porter M. (2007). Colleges and Universities and Regional Economic Development: A Strategic Perspective. Cambridge, MA: Forum for the Future of Higher Education. 13 Valero A & Van Reenen J. (2019). The economic impact of universities: Evidence from across the globe. Economics of Education Review 2019(68), 53-67. 14 Leisure Group Travel. (n/a). Elkhart County: RV capital of the world. Retrieved from https://leisuregrouptravel.com/elkhart-county-rv-capital-of-the-world/ 15 Lawson MM, Rasker R, & Gude PH. (2014). The importance of non-labor income: an analysis of socioeconomic performance in western counties by type of non-labor income. Journal of Regional Analysis and Policy, 44(2014): 175-190. 16 Johnson KM & Beale CL. (2002). Nonmetro recreation counties: their identification and rapid growth. Rural America, 17(4), 1-8. Retrieved from https://www.ers.usda.gov/webdocs/publications/46984/19347_ra174b_1_.pdf?v=0 17 Lawson M. (2019). Recreation counties attract new residents and higher incomes. Bozeman, MT: Headwaters Economics. Retrieved from https://headwaterseconomics.org/economic-development/trends-performance/recreation-counties-attract/ 18 Krugman P. (2019, March 18). Getting real about rural America. New York Times. Retrieved from https://www.nytimes.com/2019/03/18/opinion/rural-america-economic-decline.html

Headwaters Economics is an independent, nonprofit research group whose mission is to improve community development and land management decisions. https://headwaterseconomics.org Follow Headwaters Economics on Twitter @headecon Free, custom socioeconomic profiles: https://headwaterseconomics.org/tools