Embed Size (px)
Citation preview
Atlantic Review of Economics – 1st Volume - 2014
Revista Atlántica de Economía – Volumen 1 - 2014
Is poverty the mother of crime? Empirical
evidence of the impact of socioeconomic
factors on crime in India
Ashish Bharadwaj
International Max Planck Research School for Competition and Innovation;
Munich Centre for Innovation and Entrepreneurship Research,

Atlantic Review of Economics – 1st Volume - 2014
Revista Atlántica de Economía – Volumen 1 - 2014
Abstract
Economic analysis of crime and criminal law addresses the question of individual
welfare (utility) maximization through optimal allocation of resources and time in accordance
to their relative returns. In this paper I first summarize the theoretical and empirical evidence
on the nexus between crime and socio economic indicators. After which I test the hypothesis
that people who are vulnerable to fall under the poverty line indulge in criminal activities as a
consumption smoothing strategy. I also empirically inspect the role economic growth,
unemployment, urbanization and quality of legal system play in inducing property related
crimes. India is chosen as the case study because it has to carefully channel its funds and
resources towards economic growth, poverty alleviation and crime deterrence concomitantly.
The results indicate a positive and statistically significant impact of poverty, inequitable
income growth and low quality of the legal system on incidence of total property-related
crimes. Moreover, the elasticity figures suggest that poverty has the highest impact on
robberies. Most convincing result comes from the figures of elasticity of education with crime
where a 10% increase in per capita expenditure on education in India leads to a decline
between 9.2-11.2% of overall property crime rates.
Resumen
El análisis económico del derecho penal y crimen aborda la cuestión de la
maximización del bienestar individual (utilidad) a través de una asignación óptima de
recursos y tiempo de acuerdo a su relative retorno. En este trabajo en primer lugar se
resumen las pruebas teóricas y empíricas sobre el nexo entre el delito y los indicadores
socio-económicos. Posteriormente se testea la hipótesis de que las personas que son
vulnerables a caer bajo la línea de pobreza se entregan a actividades delictivas como
estrategia de consumo. Igualmente se estudia empíricamente el papel que juega el
crecimiento de la economía, el desempleo, la urbanización y la calidad del sistema legal de
jugarán en delitos relacionados con la propiedad. India es elegida como objeto del estudio
porque tiene cuidadosamente canalizados sus fondos y recursos para el crecimiento
económico, la reducción de la pobreza y la disuasión del crimen. Los resultados indican una
repercusión positiva y estadísticamente significativa de la pobreza, crecimiento desigual del
ingreso y la baja calidad del sistema legal sobre la incidencia de delitos relacionados con la
propiedad totales. Por otra parte, las cifras de elasticidad indican que la pobreza tiene el
mayor impacto en robos. El resultado más convincente proviene de las figuras de la
elasticidad de la educación en rlación con el crimen: un aumento del 10% en el gasto per
Atlantic Review of Economics – 1st Volume - 2014
Revista Atlántica de Economía – Volumen 1 - 2014
cápita en educación en la India conduce a una disminución entre 9.2-11,2% de las tasas
totales de criminalidad en asuntos relacionados con la propiedad.
Keywords: Crime, Poverty, Economic Growth, Criminal Legal System, Education
JEL Classification: K10, I25, P46, D63

Atlantic Review of Economics – 1st Volume - 2014
Revista Atlántica de Economía – Volumen 1 - 2014
1. Introduction
Crime undoubtedly is prevalent everywhere in all countries in multifarious forms.
Suggesting that there exists a connection between poor and criminals is to draw sharp criticisms and
accusations on ethical and moral grounds. This could have connotations that poor people are innately
criminal. In this research work, I attempt to delve deeper in to this controversial topic1. Economic
analysis of crime and criminal law addresses the question of individual welfare (utility) maximization
through optimal allocation of resources and time in accordance to their relative returns. Becker (1968)
suggested various determinants of crime and a lot of theoretical and empirical investigation has gone
through this topic since then. However, there is a lacuna in the literature with respect to developing
countries. Numerous works focussed on the developed world, United States in particular. Like all
models in economics, the economic model of crime involves rational utility maximising agents. The
parties involved are the criminals, non criminals and the State. The first ones determine the supply
while the other two determine the demand of crime. The State is the only actor that can determine
both these mechanisms. The purpose of this study is not to delve into these mechanisms but to
inspect what role poverty plays in criminal activities. I will try to answer the question- To what extent is
poverty and social backwardness responsible for crime becoming a dominant fact of Indian urban life
and also a growing blight on its countryside?
On one hand, there are crime theories with roots in sociological studies and methodology.
In particular, strain, ecology and opportunity theories try to establish linkages between socio
economic factors of an individual/ society with criminal behaviour/ tendencies. On the other hand,
social control and learning theories link these factors to society’s failure to control criminal tendencies
and how individual get involved in (learns) criminal activities (Allen, 1996; Hughes and Carter, 1981;
Bernard, 1987; Brown, Esbensen and Geis, 1991). Such assortment of theoretical findings offers us
diverse (and at times confusing) relationships between socio economic conditions and crime. This
paper attempts to investigate the relative impact of poverty along with certain deterrence and socio-
economic variables on crime rates in Indian States.
According to relative-deprivation theory, individuals commit crimes to send a signal to the
State that the system they are forced to live in is inherently biased against them and their socio
economic standing in the society (Chester, 1976; Hughes and Carter, 1981; Stack, 1984). Thus, even
individuals with employment and legitimate income earning opportunity will be inclined towards
committing crime in light of deprivation of basic needs and general inequality in society.
However, not all research in this area conveys that socio economic factors (specifically
poverty, inequality and unemployment) and crime are positively related. Certain theories postulate a
1 I am thankful to xxx who devoted valuable time to give helpful comments and suggestions.

Atlantic Review of Economics – 1st Volume - 2014
Revista Atlántica de Economía – Volumen 1 - 2014
negative relationship between absolute or relative poverty and property crime with the under lying
explanation that crime subsides with widespread chronic poverty by lowering returns to crime
(Sjoquist, 1973; DeFronzo, 1983; Cullen, 1988; Brown, Esbensen and Geis, 1991; Deutsch, Spiegel
and Templeman, 1992). Cohen, Kluegel and Land (1981: 511) state that “income inequality results in
housing, employment and activity patterns by upper income individuals that lower criminal
opportunity”. Returns to crime and opportunity theories contend that, controlling for the general
income distribution, a reduction in absolute poverty is associated with a proportional growth in all
income groups including that of the potential victims and offender.
In his study, Noveck (2007) identified cost of crime (expected and opportunity) and gains
from crime as factors that should affect an individual’s crime decision. He states that “... wealthier
individuals will be less likely to commit crime, as those used to a higher standard of living have more
to lose if convicted of a crime and imprisoned”. Also, the available employment opportunities also play
a role in the cost borne by the criminal for the crime he commits. High unemployment levels and
joblessness might significantly reduce the opportunity cost of time he devotes to crime. Gains from
crimes, particularly property crimes, are usually driven by economic motives and expected gains from
crime are associated with wealth of the potential victim. Bjerk (2008) writes, “While the motivation for
basic property crimes is generally purely monetary, becoming involved in violent crime may have a
defensive motivation as well. In particular, individuals may choose to act violently toward others in
their neighbourhood in order to gain a reputation.”
High crime rate plagues several countries and has detrimental multi dimensional effects.
Most importantly, it tends to hamper standard of living and the overall quality of life. Also, there is a
potential vicious cycle between crime, unemployment and poverty. Prevalent criminal activities erode
employment opportunities and are exacerbated by high unemployment rates. This further leads to
increase in poverty rates through lack of accumulation of assets. On another dimension, crime can
increase the cost of doing business thereby affecting entrepreneurial activities and overall business
climate of a country. In worst circumstances, it might even ‘drive out foreign as well as domestic
investments and decrease availability of productive labour and skilled manpower’ (Dutta and Husain,
2009). Due to an absence of safety nets and lack of resources for poor in developing countries, crime
also has additional costs for these people. Consequently, the poor are unable to mitigate the resulting
loss of productivity which further affects their livelihood options (UN, 2005). World Bank (2006)
estimated that a 10 percent reduction in the homicide rate may raise per capita income of Brazil by
0.2 - 0.8 per cent over the next five years. Thus, crime might undermine development goals and
strategies of developing countries.
Therefore, from a macro perspective, crime has negative effects on the aggregate socio
economic fabric of a country and especially affects developing countries (such as India) whose
macroeconomic sectors (such as tourism) and the critical foreign outsourcing dependent business
activities that are highly sensitive to high crime rates. It is well understood that developing countries

Atlantic Review of Economics – 1st Volume - 2014
Revista Atlántica de Economía – Volumen 1 - 2014
are resource scarce and need to efficiently allocate them for their best utilization. A country like India,
which has to battle high crime and widespread poverty, has to carefully channel its funds and
resources towards poverty alleviation, crime deterrence among other issues. In this regard, any
intervention can be effective only if it is based on a good understanding of crime and its determinants.
Needless to mention, research that identifies these determinants and further explores crime-poverty
linkages (among other socio economic factors) has substantial policy relevance.
It is important at this juncture to throw some light on the endogeneity problem that arises
due to possibility of joint causality between poverty and crime. This has been addressed by
researchers in numerous studies mainly focussing on crime deterrence variables such as expenditure
on police force or number of police officers. Activities by poor people could be more likely criminalized
because they lack power to influence criminal law compared to the wealthy people who can lobby to
avoid their acts to be criminalized. In this scenario, inevitably there will be a high correlation between
poverty and crime. If the criminal justice system is subject to such manipulation (which could be a
result of rampant corruption and red-tape) then poor will more likely get convicted than the wealthy for
the same underlying act. In this study, however, this problem is not relevant because criminal law is
taken as exogenous in the model. Quality of legal system is taken into account to control for any
association between crime and poverty due to poor and inefficient criminal justice system. Moreover,
it was found that the pair-wise correlation coefficients between poverty, inequality and crime were
small and rather insignificant. To consider any association between crime and poverty arising due to
gap between rich and poor, income inequality is included in the model. Nevertheless, this relationship
might be more complex than anticipated and such issues which lie in the purview of the political
economy of criminal law (which could itself provide an explanation for this) are outside the domain of
this paper.
The paper is arranged as follows. Section 2 presents poverty and crime scenario in India.
This is followed by a literature review in Section 3 which is followed by providing theory and
presenting evidence of the nexus between crime and socio economic indicators in Section 4. Section
5 deals with data and related issues, variables, model used and the hypothesized relation of the
chosen variables with crime rates. Econometric results of pair-wise correlation; cross sectional
regression and estimated elasticities with their interpretation presented in Section 6. Section 7
discusses the results and Section 8 presents the conclusion
2. Understanding Poverty and Crime in India
In India, the Criminal Procedure Code divides crimes into two heads: cognizable and non-
cognizable. In the former, police is responsible to take quick action on basis of a complaint received
or on receipt of credible information. Some cognizable crimes fall under the category of Indian Penal
Atlantic Review of Economics – 1st Volume - 2014
Revista Atlántica de Economía – Volumen 1 - 2014
Code (IPC) while others come under the Special and Local Laws (SLL)2. Non-cognizable crimes, on
the other hand, are supposed to be handled, pursued and managed in the Court by the affected
parties. This study deals only with IPC crimes related to property. There are two reasons why SLL
crimes are not part of this study. First, the goal of this study is to undertake the inter linkages between
poverty and those crimes which are economic goal oriented. SLL crimes such as illegal possession of
arms or copyright violation are typically not associated with people who live under poverty line.
Second, SLL crimes and IPC crimes differ a lot in terms of motivation and enforcement mechanism
(Dutta and Husain, 2009).
India is a large country and many of the Indian states are virtual countries in their own
right—at least in terms of their absolute size. For instance, amongst the 15 major Indian states3, the
median state had a population of about 45 million in 1991, and the state of Uttar Pradesh alone has a
population roughly the size of Brazil, the most populous country in Latin America (India 1993a; World
Bank 1993). An analysis of the evolution of poverty and social progress across India's States should
usefully complement the analysis of different rates of progress in improving living standards across
developing countries (Dutt, 1998).
There are three reasons why Indian case was chosen to carry out this research. Firstly,
large scale poverty which, even more than 50 years after independence from almost two centuries of
British rule, remains the most shameful blot on the face of India. India, the world’s largest democracy,
accounts for almost a sixth of world’s population, out of which more than 450 million people are poor4-
almost one third of world’s poor and the largest in a single country. Almost, three fourth of the total
population resides in rural areas while close to 40 per cent are illiterates. To juxtapose more to these
statistics, more than 1.8 million total cognizable crimes were committed alone in the year 20065. It
might be the case, as I hypothesise in this work, is that some poor (not chronically poor), who are
vulnerable to fall under the poverty line, indulge in criminal activities as a consumption smoothing
strategy.
Second, aggregate crime rate has been increasing overtime in India. According to a UN
Study, India ranks 10th in the world in terms of total crimes committed6. In 2007, a total of 860,247
criminal cases were reported out of which the share of property-related crimes is the maximum at
376,262 cases in the same year. This is little more than 20 per cent of total IPC (Indian Penal Code)
2 SLL includes Act related to possessing Arms, Gambling, Indian Passport, Copyright etc. See page 27 of Crimes in India, 2002 for a complete list 3 These are the fifteen "composite" states of Andhra Pradesh, Assam, Bihar, Gujarat, Jammu and Kashmir, Karnataka, Kerala, Madhya Pradesh, Maharashtra, Orissa, Punjab (including Haryana), Rajasthan, Tamil Nadu, Uttar Pradesh, and West Bengal 4 Poor defined by World Bank as those who live below $1.25 a day poverty line set by 2005 International Comparison Programme, World Bank (2008) 5 Precisely 1, 878, 293 crimes under the Indian Penal code (IPC) covering only Murder, Kidnapping, Robbery, Burglary and Riots, National Crime Record Bureau (2006) 6 The Eighth United Nations Survey on Crime Trends and the Operations of Criminal Justice Systems (2002) (United Nations Office on Drugs and Crime, Centre for International Crime Prevention)

Atlantic Review of Economics – 1st Volume - 2014
Revista Atlántica de Economía – Volumen 1 - 2014
crimes and it reported an increase of 1.8-3.2 per cent over the last eight years. Apart from the
economic motivation related to property crimes, the fact that the rate of such crimes is more than 33
per cent while the conviction rate is merely 39.4 per cent is also the reason why property-related
crimes were chosen for this study. Violent crimes are generally driven by psychological and social
factors rather than driven by economic considerations. According to the National Crime Records
Bureau (NCRB) of India, a governmental agency responsible for collecting and analysing crime data,
in every 19 minutes in India one person is murdered while one woman is raped in every 29 minutes;
one kidnapping takes place in every 23 minutes and finally one property crime takes place every five
minutes.
Lastly, it is one of the fastest emerging economics and is, at the same time, battling with
the problem of widespread poverty, inequality and crime. It serves as one of the best examples of a
developing country opening itself to the globalized world while using its limited resources to fight
against these ill effects.
Table 1: Top 13 countries by different crime heads
Total Crimes Total Convicted Murders Burglaries
Ran
k Figures Country Figures
Countr
y Figures Country Figures Country
1 11,877,21
8 US 3,576,010 Egypt 37,170 India
2,151,87
5 US
2 6,523,706 UK 1,436,552 UK 28,904 Russia 1,055,81
2
German
y
3 6,507,394 German
y 1,183,630 Russia 26,539 Colombia 951,418 UK
4 3,771,850 France 1,069,550 France 21,553 South
Africa 436,865
Australi
a
5 2,952,370 Russia 972,124 Turkey 16,204 United
States 393,959
South
Africa
6 2,853,739 Japan 923,769 Japan 13,144 Mexico 370,993 France
7 2,683,849 South
Africa 667,061 Poland 8,022 Venezuela 304,625 Poland
8 2,516,918 Canada 604,547 India 6,553 Philippine
s 296,486 Japan
9 2,231,550 Italy 522,916 Germa
ny 5,140 Thailand 274,894 Canada
10 1,764,630 India 468,984 Thailan
d 4,418 Ukraine 169,430 Italy
11 1,543,220 Korea,
South 329,784
Canad
a 3,453 Argentina 139,679 Mexico

Atlantic Review of Economics – 1st Volume - 2014
Revista Atlántica de Economía – Volumen 1 - 2014
12 1,516,029 Mexico 288,500 Burma 2,204 Indonesia 120,735 Sweden
13 1,422,863 Netherla
nds 277,597 Spain 2,024
El
Salvador 111,296 India
Source: The 8th United Nations Survey on Crime Trends and the operations of Criminal Justice
Systems (2002), UN Office on Drugs & Crime, Centre for International Crime Prevention
Table 1 shows countries that have the highest number of crimes (including murders and
burglaries) and convictions. It is confirmed that India has one of the highest crime rates in the world.
The point to note here is that most of the countries in the table are rich and developed nations and
India is overburdened by not only high poverty rates but also excess crime. In my understanding, the
closest any research linking crime and poverty in India was done by Dreze and Khere in 2000. Their
study revealed that violent crimes (murder rates) in India have no relation with poverty or
urbanization. This is a study of determining how poverty affects property crime across individual
states in India.
3. Literature Review
Work by Belton M. Fleisher lead the way in 1960s by analysing effects of income and
unemployment on juvenile delinquency (Fleisher, 1963, 1966). According to him, crime rates are
positively associated with unemployment and low income levels. The argument that lower income
levels lead to higher crime rates was confirmed by a study conducted in 1973 by Isaac Ehrlich.
However, it was Gary Becker’s path breaking work that viewed criminals not as poverty stricken
oppressed groups but rational economic agents. Like any other person, the potential criminal weighs
costs/risks and benefits when deciding whether or not to commit a crime. He, however, wrote that,
“some individuals become criminals because of the financial and other rewards from crime compared
to legal work, taking account of the likelihood of apprehension and conviction, and the severity of
punishment” (Becker, 1968:176). Work by Ehrlich and Becker in late 1960s and in 1970s gave birth to
the theory of deterrence which argues that potential criminals weigh both the possibility of detection
(and conviction) and the resulting sanction, monetary and non-monetary (Becker, 1968, Ehrlich, 1973,
1975, 1996).
Certain studies support a positive relationship between poverty (absolute or relative) and
property crime (such as Braithwaite (1979); Danziger and Wheeler (1975); Danziger (1976); Gillespie
(1976); Jacobs (1981); Blau and Blau (1982); DeFronzo (1983); Howsen and Jarrell (1987) and Jarell
and Howsen (1990. However, empirical support for significant positive effects is not universal
(Gillespie, 1976). Carr-Hill and Stern (1973), Jacobs (1981), Blau and Blau (1982), Sjoquist (1973),
Danziger (1976), and Patterson (1991) report negative or statistically insignificant relationships for
absolute poverty while Cohen (1981), analyzing trends in reported property crimes for 1947 to 1972,
concludes that crime rates increase as relative poverty decreases.
Atlantic Review of Economics – 1st Volume - 2014
Revista Atlántica de Economía – Volumen 1 - 2014
The lacuna lies in the fact that a substantial body of evidence for possible determinants of
crime and the empirical literature has originated in developed countries while any focus on an under
developed country is a rarity. Fafchamps & Minten (2002) write, “At this stage in the law and
economics literature empirical studies seem to convey that poverty does not have a substantial effect
on crime.” This has been confirmed off late by Dreze and Reetika (2000); Krueger and Pischke
(1997); Doyle, Ahmed and Horn (1999); Morgan (2000) and Freeman (1996). As pointed above, these
evidences are largely based on data from rich countries, predominantly the U.S. There is an urgent
need to verify whether the theories of crime originating in developed countries are relevant in
developing countries. Fajnzylber, Lederman and Loayza (1998) have shown that crime rates in under
developed countries tend to be equal to or higher than that of developed countries.
Anderson (1990, 1999) and Massey (1995) discuss, on sociological grounds, the factors
that affect poor residents living in isolated areas who have to adapt themselves to such social
surroundings. This, according to these studies, is done by giving extra weight to reputational aspects
in their neighbourhood to reduce the risk of their own criminal victimization where this reputation is
maintained through use of force. Fajnzylber, Lederman and Loayza (2000) have conducted cross
country comparisons and found that across countries crime rate differentials are linked to growth and
poverty and, to some extent, by demographic factors. Separate studies on South Africa and
Madagascar, using cross sectional data, conclude that local inequality is significantly correlated with
both property and violent crimes and burglaries and crop theft are expected to increase with poverty
as people turn to crime to mitigate the effect of the shock on their lives (Demombynes and Ozler,
2002; Fafchamps and Minten, 2002). Lott (1990) postulates that the poor are more likely to engage in
criminal activity due to their relatively limited access to capital markets; therefore, property crime is the
poor person's method of borrowing against future human capital. Deutsch, Spiegel and Templeman
(1992), however, argue that the poor are more likely to commit a crime because cost of punishment is
less for them compared to the relatively high income individual who has more accumulated wealth to
lose.
In one of the very recent contributions to this field of law and economics, Spamann (2008)
shows, in a global cross-section of up to 213 countries that only level of economic development,
income inequality and legal origin are robustly correlated with crime and punishment. His econometric
results based on the broadest possible cross-section of countries suggest that countries with common
law (English legal origin) are associated with half a standard deviation more inmates per capita than
civil law origin and they also appear to have higher crime rates. He finds a positive association of
crime with per capita GDP and income inequality but a negative one with unemployment.

Atlantic Review of Economics – 1st Volume - 2014
Revista Atlántica de Economía – Volumen 1 - 2014
4. Crime and linkages with socio-economic indicators: Theory
& Evidence
It has been shown in various studies that certain deterrence variables such as probability of being
arrested and convicted tend to have negative signs in a crime function. Since these deterrents are
linked with the expected costs to the criminal of committing a crime, they have an inverse relationship
with crime rates (Becker, 1968, Ehrlich, 1973, 1975, 1996, Grogger, 1991). The hypothesis of this
study is that certain socio economic factors, poverty in particular, also determine crime. In other
words, crime depends on how widespread poverty is in a particular region and other associated socio
economic factors.
a) Crime and Poverty
The linkages between poverty and crime seem to be based on the argument that people
who have less (not by choice but due to lack of advantages, or simply capabilities, as Amartya Sen
calls it) will want to take from those who have more. Of course it will be unreasonable and unfair to
accuse or even associate poor people with crime than other people. This will, at best, be a pseudo-
syllogism. There is absolutely no gene that has been or perhaps will be identified linking these two
phenomena. According to Fesseha Gebremikael (2003), “crime rate is high in some low-income and
minority populated rural areas. Poverty is widespread in communities that due to low income are living
in public housing and where overpopulation is an issue”.
This matches perfectly with a lot of States of India. Certain crimes, such as stealing food
to feed himself or his dependent, can be considered as frantic or distressed response to poverty (or
hunger as poverty is sometimes called in its extreme form). These crimes are almost always likely to
rise with poverty. Thus, both poverty and income inequality are considered to be reasonable proxies
of resource deprivation. But, some other types of crimes are different in their relationship with poverty.
Fafchamps and Minten (2002) have argued that “(other) crimes are largely affected by the demand for
illegal commodities and services such as drugs, prostitution or organized crime. In this case, an
increase in poverty would increase the supply of criminals but at the same time reduce demand from
illegal products.” The combined effect is ambiguous depending on the relative strength of the two
effects. In the Indian context, this argument is not likely to have a strong ground. Drug menace and
prostitution are not high priority areas because they are not legal and are not as widespread and
rampant as witnessed in some other countries. Criminal activities by organized gangs or mafias are
unlikely to be affected by poverty simply because of the presence of barriers to entry for the very poor
people who lack resources required to be a part of the group. Fafchamps and Minten (2002) on a
study focussing on Madagascar state that “burglaries and crop theft are expected to increase with
poverty as people turn to crime to mitigate the effect of the shock on their lives”.

Atlantic Review of Economics – 1st Volume - 2014
Revista Atlántica de Economía – Volumen 1 - 2014
Figure 1: Percentage of people below poverty line for selected states during 2004-05
Source: Data from Indiastat
The regional disparities in poverty levels and other standards of living indicators in India
stand bare in the face of today’s development dilemma. For instance, States such as Orissa, Madhya
Pradesh, Bihar and Uttar Pradesh have more than a quarter of their population below poverty line
(BPL) while Punjab, Jammu & Kashmir and Himachal Pradesh are the best performers in this context.
Then there are some States that have wide gaps between rural and urban BPL populations. This
includes Andhra Pradesh, Arunachal Pradesh, Karnataka, Rajasthan and West Bengal. During 1990,
the proportion of the north eastern state of Bihar's rural population living in poverty was about 58%
and more than three times higher than the proportion (18%) in rural north western Punjab and
Haryana. Some of these differences have persisted historically; for example, Punjab-Haryana also
had the lowest incidence of rural poverty around 1960. However, looking back over time the more
striking-though often ignored-feature of the Indian experience has been the markedly different rates of
progress between states; indeed the ranking around 1990 looks very different to that 35 years ago
and what it is now. For example, the southern state of Kerala moved from having the second highest
incidence of rural poverty around 1960 to having the fifth lowest around 1990 (Dutt, 1998; Dutt and
Ravallion, 1996).
A number of factors are responsible for poverty in the rural areas of India. Rural
populations primarily depend on agriculture, which is highly dependent on rain patterns and the
monsoon season. Inadequate rain and improper irrigation facilities can obviously cause low, or in
some cases, no production of crops. Additionally, the Indian family unit is often very large, which can
amplify the effects of poverty. Also, the caste system still prevails in India, and this is also a major
reason for rural poverty – people from the lower castes are often deprived of a number of facilities and
opportunities. The government has planned and implemented poverty eradication programs, but the
benefits of all these programs have yet to reach the core of the country.

Atlantic Review of Economics – 1st Volume - 2014
Revista Atlántica de Economía – Volumen 1 - 2014
b) Crime and Inequality
Crime is bound to increase when difference between the have’s and have not’s
magnifies. Certain crimes are motivated by economic considerations. According to Kelley (2000), “In
the economic theory of crime, areas of high inequality place poor individuals who have low returns
from market activity next to high-income individuals who have goods worth taking, thereby increasing
the returns to time allocated to criminal activity” and such motivations may be created by a sense of
frustration, or an “envy effect”. Worsening income gaps can have adverse impact on genuine and
legal income generating opportunities and thereby carries with itself the possibility of rise in crime.
Such criminal activities are not only carried out by (and result in) potential criminals, but also potential
victims that have material goods worth seizing (Fleisher (1966), Ehrlich (1973), Chiu and Madden
(1998), Burdett et. al (1999), Imrohoroglu et al. (2000, 2001), Kelly (2000), Fajnzylber et al. (2002),
Burdett and Mortensen (1998), Juhn, Murphy and Pierce (1993), Pratt and Godsey (2003)). However,
there is a growing consensus that resource deprivation is generally an underlying cause of violent
crime (Land, McCall & Cohen, 1990; Mesner & Golden 1992). A review of studies with property crime
in the Indian context can be quite useful. The division of resources, as well as wealth, is very uneven
in India. This disparity creates different poverty ratios for different states. For instance, states such as
Delhi and Punjab have very low poverty ratios. On the other hand, almost half of the populations in
Bihar and Orissa live below the poverty line.
Figure 2: Rural and Urban Gini Coefficient (*100) for selected states during 1999-00
Source: National Human Development Report 2001, Planning Commission

Atlantic Review of Economics – 1st Volume - 2014
Revista Atlántica de Economía – Volumen 1 - 2014
Figure 2 above gives a good flavour of the variations in income levels between rural and
urban areas among States. Income inequality is strikingly high in States such as Tamil Nadu,
Maharashtra, West Bengal and Karnataka which have big metropolitan cities like Chennai (Madras),
Mumbai (Bombay), Kolkata (Calcutta) and Bangaluru (Bangalore). In the Indian scenario, inequality
can be segregated into two critical features:
i. There is a wide rural-urban divide in terms of wage differential, job opportunities,
availability of resources, basic infrastructure and social development in India. As shown by the Nobel
winning work by Arthur Lewis, this gap manifests into large scale migration from rural to urban
regions. This is exactly what is witnessed in India during the last so many decades. It is, however, yet
to be tested empirically whether higher crime rates in urban areas are also due to migration from rural
areas. This might sound unethical to some arguing that poor people in villages come to cities to
commit crimes. But, this is an incomplete picture. High cost of living, lack of appropriate jobs due to
relatively lower employability, material dissatisfaction and closeness to crime in informal sector can in
some cases force the poor migrant to commit a crime..
ii. Neither reawakening of ancient hatred nor consequence of religious fundamentalism is
usually responsible for Hindu-Muslim conflicts, particularly in secular India which has been home to
people and races from everywhere and treats all religions equally. It can be argued that such tension
occurs due to socio economic developments and, of course, strategies and tactics of India’s
politicians. Following are the excerpts from an interview of a Muslim lady. When asked why, in her
opinion, Muslims (in India) are more backward, she reveals that, “It is because they don't study much.
Schools are there but they don't send their children there. They are also very poor. They are tempted
to put their children into work for extra income. Since parents are not educated themselves, they do
not realize that a good education could change the lives of their children.”7 Although, the same might
hold true for all religions in India (including Hinduism), this brings into light the other three aspects of
crime and inequality- terrorism (in its extreme form but has plagued India since a long time), naxalism
(rampant in India) and education (explained below).
Fajnzylber, Lederman and Loayza (2002) show that “crime rates (homicide and robbery)
and inequality are positively correlated within countries and this correlation reflects causation from
inequality to crime rates, even after controlling for other crime determinant”. Social disorganization
theory (Shaw and McKay, 1942) highlights that a breakdown of social control machinery can lead to
higher crime rates. This collapse can be attributed to factors such as poverty, racial heterogeneity,
mobility, social instability. However, in most cases, inequality is associated with crime because it is
linked to poverty.
7 Mrs. Falak Khan is a young wife with two children and lives near Jamia Milia Islamia University- a Muslim populated locality of New Delhi. The interview was conducted and published by Mayank Austen Soofi, on his blog http://hindumuslimindia.blogspot.com/
Atlantic Review of Economics – 1st Volume - 2014
Revista Atlántica de Economía – Volumen 1 - 2014
In place of an individual’s own wealth, we substitute two variables. First, we use Gini
coefficient as a measure of income inequality. There is generally a positive relationship between high
income inequality and percentage of people with low income & instable employment opportunities.
The model tries to predict that it is these individuals that are most likely to commit a crime. Second,
unemployment rate is added in the model due to its negative association with available legitimate
work opportunities. The second point will be discussed shortly.
c) Crime and Economic Growth
Since the work of Quetelet (1842), irrespective of the criticisms it faced, it is quite an
established conventional perception of criminology that macro economic factors are significantly
associated with crime rates. Many studies (Fleisher 1963, 1966; Ehrlich, 1973) have used economic
growth rates as substitutes for level of economic prosperity. According to Bennett (1991), growth rates
are relevant with respect to creation and availability of opportunities. He also finds that significant non-
linear effects may be present. Figures on State Domestic Product at factor cost (constant at 2000
prices) have been used in this study as a measure of economic growth. However, the quality of
growth is more relevant and it is captured by levels of poverty, education, employment and other
socio economic factors. Going by intuition and popular perception, a negative relationship can be
expected between per capita city income and crime. As per capita income increases, in general, we
can expect wealth of everyone in the city to increase, thus the incentive committing crime based on it
is reduced. An alternative (and unconventional) argument is presented by Entorf and Spengler (2000)
in their study on criminality, social cohesion and economic performance. According to them, wealth
varies positively with crime for property related crimes. Wealth was measured by GDP per capita
which covered both legitimate income opportunities and illegal income opportunities (i.e. potential
targets). They estimated a range of 0.6-0.9 as mean elasticity for theft of motor vehicles and 0.7-1.0
for robbery with respect to real GDP per capita.
Table 2 provides ranking of selected Indian States in terms of education, life expectancy
(a measure of health) and income (measured by per capita NSDP) and human development index.
Some of the important observations are: a) Kerala which ranks one in education and life expectancy
ranks fifth in terms of income while Punjab which has the highest SDP ranks eight in education; b)
Bihar and Uttar Pradesh, one of the most populated States in India, fare poorly in all three aspects; c)
Haryana, a State with second highest agricultural output and one of the best contributor to service
sector in India, has one of the worst education ranking.

Atlantic Review of Economics – 1st Volume - 2014
Revista Atlántica de Economía – Volumen 1 - 2014
Table 2: Selected State-wise Human Development Index (HDI) in India during 2000
Education Life Expectancy Income States
Index Rank Index Rank Index Rank HDI Rank
Andhra
Pradesh 0.539 13 0.672 8 0.513 8 0.575 9
Assam 0.588 6 0.57 14 0.431 13 0.53 11
Arunachal
Pradesh 0.525 14 0.484 16 0.493 10 0.501 14
Bihar 0.413 16 0.626 11 0.308 16 0.449 16
Gujarat 0.612 4 0.661 9 0.544 5 0.606 7
Haryana 0.57 10 0.703 4 0.579 3 0.617 5
Karnataka 0.607 5 0.687 6 0.531 7 0.608 6
Kerala 0.751 1 0.867 1 0.544 5 0.721 1
Madhya
Pradesh 0.569 11 0.552 15 0.447 12 0.523 12
Maharashtra 0.678 2 0.728 3 0.581 2 0.662 2
Orissa 0.56 12 0.582 13 0.403 15 0.515 13
Punjab 0.58 8 0.766 2 0.589 1 0.645 3
Rajasthan 0.578 9 0.628 10 0.466 11 0.557 10
Tamil Nadu 0.662 3 0.702 5 0.549 4 0.638 4
Uttar Pradesh 0.456 15 0.587 12 0.423 14 0.489 15
West Bengal 0.588 7 0.679 7 0.511 9 0.593 8
India 0.57 0.63 0.53 0.577
Source: Indiastat
d) Crime and Unemployment
Availability of legitimate employment opportunities acts as an effective deterrent for
potential offenders from committing crimes. Unemployment, by generating poverty is hypothesized by
most authors to stimulate property crime activity (Sjoquist, 1973; Howsen and Jarrell, 1987; Phillips,
1991). An instinctive appeal of this perception is undermined by the lack of empirical research that
documents a strong effect of unemployment on crime. Raphael and Ebmer (2001) have found that
unemployment consistently increases property crimes but they also state that “studies of aggregate
crime rates generally find small and statistically weak unemployment effects, with stronger effects for
property crime than for violent crime. In fact, several studies find significant negative effects of
unemployment”. Theodor Chiricos in 1987 reviewed 68 studies and showed that fewer than half find
positive and significant effects of aggregate unemployment rates on crime rates. However, Cohen and
Felson (1979), Cohen, Felson and Land (1980), Cohen (1981), and Cohen, Kluegel and Land (1981),
argue that during high unemployment periods there are more individuals at home to serve as

Atlantic Review of Economics – 1st Volume - 2014
Revista Atlántica de Economía – Volumen 1 - 2014
guardians and unemployment reduces the wealth of crime targets. These studies confirm the
hypothesis that unemployment decreases criminal activity.
Gumus (2004) states that, ‘As people become unemployed they would, in the short run,
search for new jobs. In the long run, if they do not find jobs, they would tend to be criminal’. He adds
that there is no common agreed result of unemployment and crime relationship yet. Masih and Masih
(1996: 1094) have conducted a thorough examination of the existing literature on this relationship and
found that more than one third of studies find negative or no relationship between crime and
unemployment. Correlations between crime and unemployment offer less conclusive results and the
exact relationship between the variables remains to be clarified in further research.
Figure 3: Rural and urban unemployment rate in selected Indian states, 2004-05
Source: Indiastat
Regarding the situation in India, the labour force is growing at a rate of 2.5 per cent
annually, but employment at only 2.3 per cent. Thus, the country is faced with the challenge of not
only absorbing new entrants to the job market (estimated at seven million people every year), but also
clearing the backlog. Sixty per cent of India's workforce is self-employed, many of whom remain very
poor. Nearly 30 per cent are casual workers (i.e. they work only when they are able to get jobs and
remain unpaid for the rest of the days). Only about 10 per cent are regular employees, of which two-
fifths are employed by the public sector. More than 90 per cent of the labour force is employed in the
unorganised sector, i.e. sector which does not provide with the social security and other benefits of
employment in the organised sector. These employees are therefore more likely to be frustrated (due
to social and economic factors) and commit a crime.

Atlantic Review of Economics – 1st Volume - 2014
Revista Atlántica de Economía – Volumen 1 - 2014
e) Crime and Urbanization
With rapid globalization, industrialization is what follows in many poor countries. This
process involves a transformation from an agrarian rural economy to an urbanized economy with
superior infrastructure and growth. Crime, through various channels, is a side-effect of this process.
Migration of population from rural to urban areas and the attempts of elite groups to modernise may
stimulate an increase in criminal activities (Fisher, 1987). It also leads to several developmental
(social, cultural and economic) bottlenecks and a fall in standard of living. An up shot is generation of
social friction leading to eruptions of violence and crime particularly in communities characterized by
diversity (UN, 2005). Such unstable urbanization might also have adverse selection problem in the
sense that individuals working in legitimate jobs might end up into criminal activities. Percentage of
people living in urban cities and towns has been swelling rapidly in India due to various factors-
employment opportunities, infrastructure, better living standards, availability of public services and
governance. It is argued that, as urbanization increases, crime also rises (Galvin, 2002:130; Gaviria
and Pagés, 2002:190). According to Gumus (2004), the relationship between crime and urbanization
may be uncertain. “At low levels of urbanization, crime may be high because of sparsely located
residents; a further increase in urbanization may lead to decrease in crime because of closer
proximity of residents; and finally, with even further increase in urbanization, crime may rise because
individuals may not identify whether they are engaged in a legal or illegal activity” (Masih and Masih,
1996: 1093). Indeed, Gaviria and Pagés, (2002:193) found positive relationship between city size and
victimization. Thus, it can be presumed that the crime-urbanization relationship can swing either way
depending upon the urban setting. Only through an empirical examination it can be ascertained which
effect outweighs the other in the India.
f) Crime and Quality of Legal system (or Judiciary)
Kohling (2002: 11) states that “I define a weak judiciary as an institution that is inefficient
or even ineffective due to contradictory, unclear, or complicated mechanisms. These inefficient laws
prolong a trial and can be misused by litigants. This misuse of the laws might result in delays and the
prevention of the execution of summons, orders and judgements”. An aspect of public life that has a
significant economic impact and is evidently influenced by the quality of the judiciary is the crime rate.
A quick and predictable judiciary is supposed to contribute to a lower crime rate. This certainly holds
true in the case of the backlog in Indian Courts. The federal government of India resorted to setting up
fast track courts to reduce the backlog of millions of cases. As of 2006, a total of 18 million cases
were pending in India's courts, of which 16 million cases are criminal ones. Due to this, India's judicial
system is notoriously slow and the fast track courts will take up cases which have been pending for
three years or more. According to India’s Chief Justice, Y. K. Sabharwal, “there is no doubt that this

Atlantic Review of Economics – 1st Volume - 2014
Revista Atlántica de Economía – Volumen 1 - 2014
investment by the government will go a long way in the dispensation of real social, economic and
political justice to the common man.8”
Thus, speedy disposal of cases and easing overcrowding of prisons reflects a robust
judiciary to counter rising crimes9. India’s penal code has been amended to provide that inmates must
be released if they have served time on remand equal to half the maximum prison tariff for the offence
they are to be tried for. However, the measure does not apply to those charged with offences for
which the death sentence is a possible punishment10. Since this move is only applied to crimes which
attract a maximum sentence of seven years and does not cover more serious felonies such as murder
or crimes against women and children, it was considered in this study which is focussed on property
related crimes. While fast track courts serve as a good measure of the an efficient and speedy
judiciary, including trials with duration of more than ten years also serve as a good measure of quality
of the legal system, although in the opposite way. A higher number of cases with trials exceeding ten
years reflect a somewhat poor quality of legal system. The length of the trial determines the quality of
the judiciary where a lower value of trial duration indicated a better judiciary (Kohling, 2002: 26).
g) Crime and Education
Educational expenditure and attainment are singularly the most important facets of the
supply and demand of social development in a developing country. The effect of education on crime
can be explained by two effects. Higher levels of educational attainment increases opportunity cost of
criminal behaviour through higher skill level and the associated higher returns in the labour market
(Freeman, 1991, 1996; Grogger, 1995, 1998; Lochner and Moretti, 2001; Lochner 2004). Some
studies signal that learning, by improving moral stance and promoting the virtues of hard work and
honesty, might have a ‘civilization effect’ (Fajnzylber et al 2002, Usher, 1997). This is the direct effect
on crime rates.
The indirect effect works through employment and wages. There is abundance in the
literature of studies associating wages and unemployment rates to crime. High unemployment and
low wage rates leads to high crime rates (Raphael and Winter-Ebmer, 2001; Gould, et al., 2002;
Machin and Meghir, 2004). Higher attainment of education levels leads to better prospects of getting
employed and might eventually result in higher wage rates. It, thus, increases the opportunity costs of
crime and will tend to reduce criminal activity. Higher wages raise the opportunity costs of crime in two
distinct ways, time commitment and expected incarceration period (Lochner, 2007). According to
8 Quoted from BBC report on fast track courts in India published online on Saturday, 29 July 2006 on their weblink http://news.bbc.co.uk/1/hi/world/south_asia/5227038.stm. Last viewed on 25th June 2009 9 During July 2006, the government also introduced the concept of plea bargaining, under which an accused in a criminal case will be able to plead guilty in exchange for a reduced sentence. Although this move is expected to go a long way in reducing pressure on the courts but due to lack of data it could not be incorporated in the study.
Atlantic Review of Economics – 1st Volume - 2014
Revista Atlántica de Economía – Volumen 1 - 2014
Machin and Meghir (2004), “crime rates should be higher where wages at the bottom end
of the wage distribution are lower, reflecting poorer labour market opportunities where the probability
of being caught is lower, where crime rates are already higher, and where the potential returns to
crime are high.“
h) Crime and Economic Development
Welfare expenditures can arguably be thought of as reducing the pain from
unemployment and thus reducing the net return of crime. Alternatively, it can be interpreted as a
state’s propensity to help disadvantaged population segments. The measure of economic
development, EDEV is a multi faceted proxy variable used to control for vast differences among
States. State outlay for general economic services was used for this. This broad category of
development includes tourism, self employment schemes, computerization of government
administration, setting up statistical offices, providing infrastructure to public sector enterprises,
conducting surveys for effective policy making, strengthening planning machinery among others. It is
expected that this variable will be positive.
5. Data Issues, Sources, Definitions and Model
Ideally I would like to estimate the effect of changes in household income levels (or
consumption expenditure) on the crime decision at the individual level but this was not possible
because such detailed data is not available for a sufficiently large random sample of individuals for
Indian States. There are important data issues and problems regarding crime in India. Some of them
are highlighted below:
i. There is a severe lack of consistent and comprehensive data at State or city level over a
period of time.
ii. Using city/ district level data has problems of identification of origin of crime and that of
the criminal because an individual may live in one region but commit crime in another. This explains
the assumption of the model in this study that the amount of crime in a region is related to values
measured in that same region.
iii. There is a general problem of underreporting by victims of crime due to costs associated
with reporting crimes in terms of time, effort and litigation.
iv. Reporting by local or State law enforcement agencies has its own shortcomings.
In some cases only the most serious crimes are counted, neglecting the less serious
ones, while in some other cases there is serious undercounting in order to show that crime has fallen,
which could be a temptation around election times (DiIulio, 1996). Singh and Keniston (2009) write
that “the present system (of crime survey by Government) is unlikely to yield accurate data; rather it
Atlantic Review of Economics – 1st Volume - 2014
Revista Atlántica de Economía – Volumen 1 - 2014
rewards governments, policymakers and police for hiding the crime they are expected to prevent and
investigate”11.
Indian statistics on crime are published annually by the National Crime Records Bureau,
under the Ministry of Home Affairs. State-wise data is available on number of different crimes
committed, enforcement mechanism and judicial institutions in a standardized format. Data on people
living below poverty line (BPL) was compiled from the statistics released by Press Information
Bureau, Government of India and data on income inequality (Gini coefficient) was obtained from
National Human Development Report (2001), published by Planning Commission, Government of
India. Data on National Legal Service Authority (NALSA) and Fast Track Courts (FTCs) were
collected from Indiastat12. The origin of this are Parliament sessions, namely Lok Sabha (Lower
House) Unstarred Question No. 573, dated 03.12.2004, Unstarred Question No. 2112, dated on
30.11.2007 and Rajya Sabha (Upper House) Unstarred Question No. 1439, dated 06.03.2006,
Unstarred Question No. 548, dated 22.07.2002. Figures on duration of trials for all court types are
provided by Ministry of Home Affairs, Government of India and were taken from Indiastat. Data on
Health was taken from reports published by Ministry of Women and Child Development, Government
of India. Data on education was taken from National Sample Survey Organization (NSSO), 2001 and
from Ministry of Human Resource Development, Government of India through Indiastat.
Unemployment was again obtained from Census of India (2001) and Indiastat. Population
statistics were also taken from Census of India (2001). Data on developmental outlays by different
States was compiled from the statistics released by Handbook of Industrial Policy and Statistics
(2002), Ministry of Commerce and Industry, Government of India. State Domestic Product (SDP)
figures were obtained from reports published by Central Statistical Organisation (CSO). Finally, data
on State outlay for general economic services is published by Ministry of Commerce and Industry,
Govt. of India in their Handbook of Industrial Policy and Statistics (2002) made available online on
Indiastat.
Definitions of some of the property-related crimes used in this study are as follows13:
Robbery is the act of taking or attempting to take anything of value from the care, custody, or control
of a person or persons by force or threat of force or violence and/or putting the victim in fear. Burglary,
on the other hand, is considered as an unlawful entry of a structure to commit a felony or a theft
including attempted forcible entry. Finally, Theft is the unlawful taking, carrying, leading, or riding
away of property from the possession or constructive possession of another while Automobile Theft,
in particular, is the theft or attempted theft of a motor vehicle.
Variables for the analysis and the model used are explained below.
11 Indian Express, Feb 04, 2009. http://www.indianexpress.com/news/telling-it-like-it-is/418946/. Nina Singh is an IPS officer and Daniel Keniston is a researcher in Economics at the Massachusetts Institute of Technology 12 An online data bank whose subscription was taken to access data 13 Defined by United States Federal Bureau of Investigation in their Uniform Crime Reports (any year)
Atlantic Review of Economics – 1st Volume - 2014
Revista Atlántica de Economía – Volumen 1 - 2014
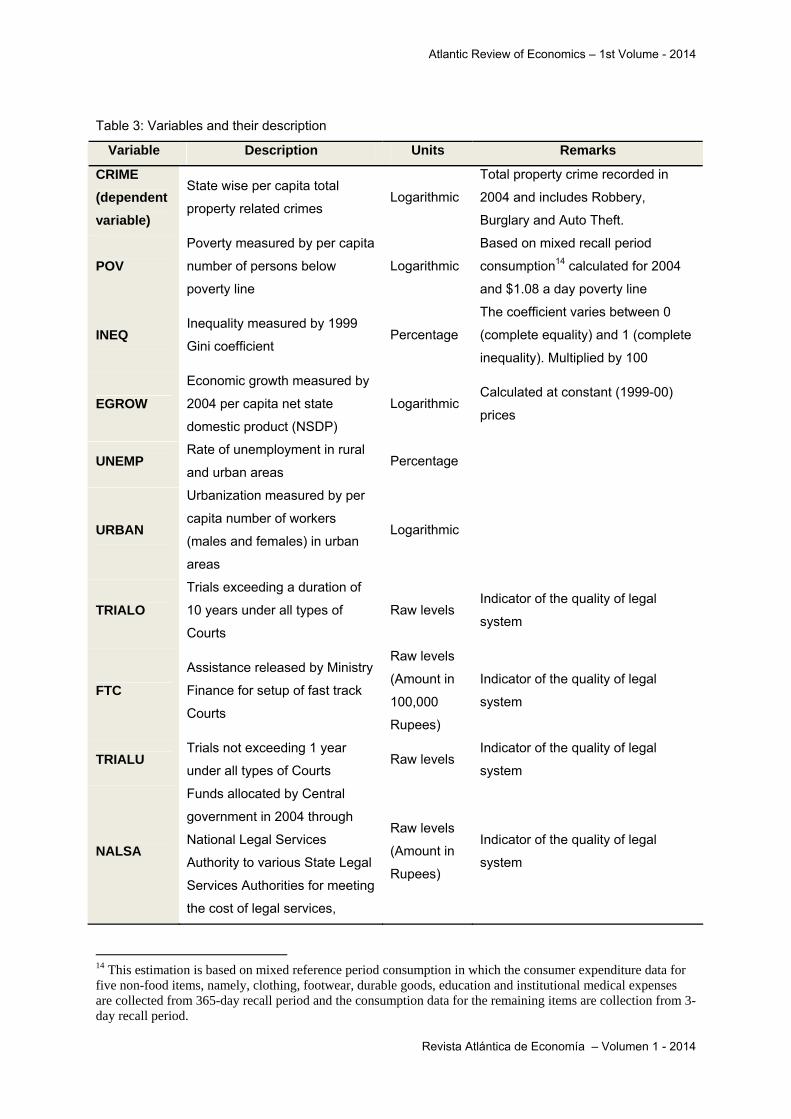
Table 3: Variables and their description
Variable Description Units Remarks
CRIME
(dependent
variable)
State wise per capita total
property related crimes Logarithmic
Total property crime recorded in
2004 and includes Robbery,
Burglary and Auto Theft.
POV
Poverty measured by per capita
number of persons below
poverty line
Logarithmic
Based on mixed recall period
consumption14 calculated for 2004
and $1.08 a day poverty line
INEQ Inequality measured by 1999
Gini coefficient Percentage
The coefficient varies between 0
(complete equality) and 1 (complete
inequality). Multiplied by 100
EGROW
Economic growth measured by
2004 per capita net state
domestic product (NSDP)
Logarithmic Calculated at constant (1999-00)
prices
UNEMP Rate of unemployment in rural
and urban areas Percentage
URBAN
Urbanization measured by per
capita number of workers
(males and females) in urban
areas
Logarithmic
TRIALO
Trials exceeding a duration of
10 years under all types of
Courts
Raw levels Indicator of the quality of legal
system
FTC
Assistance released by Ministry
Finance for setup of fast track
Courts
Raw levels
(Amount in
100,000
Rupees)
Indicator of the quality of legal
system
TRIALU Trials not exceeding 1 year
under all types of Courts Raw levels
Indicator of the quality of legal
system
NALSA
Funds allocated by Central
government in 2004 through
National Legal Services
Authority to various State Legal
Services Authorities for meeting
the cost of legal services,
Raw levels
(Amount in
Rupees)
Indicator of the quality of legal
system
14 This estimation is based on mixed reference period consumption in which the consumer expenditure data for five non-food items, namely, clothing, footwear, durable goods, education and institutional medical expenses are collected from 365-day recall period and the consumption data for the remaining items are collection from 3-day recall period.

Atlantic Review of Economics – 1st Volume - 2014
Revista Atlántica de Economía – Volumen 1 - 2014
particularly legal aid
EDU
Education measured by per
capita total expenditure on
education sector by State
Logarithmic
EDEV
Economic development
measured by per capita
expenditure on general
economic services by State
Logarithmic
The hypothesised form of the crime rate function used here therefore takes the form:
1 2 3 4 5 6i i i i i i iCRIME POV INEQ EGROW UNEMP URBAN TRIALO
7 8 9 10 11i i i i i iFTC TRIALU NALSA EDU EDEV
Where i States of India15 and ε stand for residual error in the model
For the variables that do not already correspond to percentages, they have been transformed using a
logarithmic transformation because doing so reduces the influence of outliers and allows a simple
elasticity interpretation16; for instance, when POV increases by one (or ten) percent, CRIME increases
by ‘some’ percent. Because larger states represent larger samples and provide more accurate
information, all regressions are weighted by state population. Table 4 below provides descriptive
statistics for the crime variables and all explanatory variables used in the model.
15 Out of a total 28 States and 7 Union Territories (UT’s), 3 States- Jharkhand, Chattisgarh, Uttarakhand were not included in the study. This is because sufficient data was not available for these States as they were formed in November 2000. All 7 UT’s- Dadra & Nagar Haveli, Lakshadweep, Daman & Diu, Andaman & Nicobar Islands, Chandigarh, Delhi and Pondicherry have also not been included in the sample. This is because of their relatively very small geographical area, population, economic activities etc. However, Delhi was an exception and an outlier which had to be dropped after conducting certain tests. 16 That is, one can explain the estimated coefficients, b1, b2, and so on, as the percentage change of Y that is associated with a 1 percent change of any particular explanatory variable
Variable Mean Std. Dev. Min Max
CRIME (Total Property
Crime)a
13861.12 15443.26 142 61469
ROB (Robberies) 667.04 846.77 3 2986
BURG (Burglaries) 3380.48 3894.50 64 14659
AUTO (Auto thefts) 2736.68 3180.96 0 11307
POV*b 0.17 0.09 0.04 0.42
INEQc 0.51 0.08 0.35 0.68
EGROW* 19994.16 7740.00 6724 45394
UNEMP 5.98 5.67 1.20 28

Atlantic Review of Economics – 1st Volume - 2014
Revista Atlántica de Economía – Volumen 1 - 2014
Table 4:
Summary
statistics for
different
crime
heads and
explanatory
variables
*variables represented in per capita terms; a) Crime= Robbery+ Burglary+ Auto Theft; b) Poverty Line
at $1.08 a day; c) Measured by Gini coefficient
6. Econometric Results: Correlation Matrix, OLS Regression
and Elasticities
Before presenting the results of multiple regression analysis, a correlation matrix is
presented below to highlight the association of independent variables among themselves and, more
importantly, with the dependent variable. The table displays all the pair-wise correlation coefficients
between variables. The advantage of doing this is that an observation is dropped only if there is a
missing value for the pair of variables being correlated. Each correlation is considered in isolation
from other variables, and no effort is made to control for the effects of other explanatory variables.
Table 5: Correlation matrix of Crime variable and explanatory variables
CRIME POV INEQ EGRO
W UNEMP
URBA
N TRIAL FTC EDU
EDE
V
CRIMEa 1
POVb -0.13
(0.52) 1
INEQc 0.17
(0.41)
0.32
(0.12) 1
EGROW 0.36***
(0.07)
-0.51*
(0.00)
0.15
(0.46
)
1
UNEMP -0.34***
(0.09)
0.08
(0.71)
-0.02
(0.92
)
0.04
(0.83) 1
URBAN 0.40**
(0.04)
-0.24
(0.24)
0.18
(0.39
)
0.58*
(0.00)
-0.23
(0.27) 1
URBAN* 0.09 0.05 0.03 0.24
TRIALO 971.44 1451.44 0 4874
FTC 94.25 277.31 0 1287.27
TRIALU 11120.40 17948.59 31 72694
NALSA 1100409 1217097 0 5584000
EDU* 1137.82 663.55 413.27 3046.92
EDEV 128.76 102.72 18.82 330.70

Atlantic Review of Economics – 1st Volume - 2014
Revista Atlántica de Economía – Volumen 1 - 2014
TRIALO 0.12
(0.55)
0.61*
(0.00)
0.40**
(0.04
)
-0.40**
(0.05)
-0.18
(0.38)
-0.05
(0.79) 1
FTC 0.36***
(0.07)
-0.06
(0.77)
0.15
(0.47
)
0.33
(0.11)
-0.03
(0.89)
0.13
(0.53)
0.17
0.39 1
EDU 0.09
(0.67)
-0.40**
(0.05)
-0.23
(0.28
)
0.48**
(0.02)
-0.09
(0.69)
0.21
(0.33)
-0.49**
(0.02)
-0.10
(0.64
)
1
EDEV 0.19
(0.36)
-0.44**
(0.02)
-
0.54*
(0.00
)
0.08
(0.68)
0.11
(0.59)
-0.04
(0.85)
-0.54*
(0.00)
-0.33
(0.11
)
0.71*
(0.00
)
1
a) Crime is Total Property Crime= Robbery+ Burglary+ Auto Theft; b) Poverty Line at $1.08 a day; c)
Measured by Gini coefficient (multiplied by 100); p values given in parenthesis where * represents
significant at 1%, ** significant at 5% and *** significant at 10%
Generally, the findings are that economic growth, urbanization, fast track courts are
positively correlated while unemployment is negatively correlated with total property crimes. These
are also significant at 5% or 10% since the p value is less than 0.05 or 0.10 respectively. Poverty,
inequality and education not being (statistically significantly) associated with crime seem to be an
anomalous result. Almost all the correlations among independent variables are consistent with
intuition. For instance, significant negative correlation between poverty with economic growth,
urbanization, education and economic development confirms the very basic tenet of development
economics. While the correlation analysis is suggestive, there are several reasons to view the
correlation analysis with scepticism. Although significance level of each correlation coefficient is
provided in the matrix, each correlation is treated in isolation without controlling for the effects of other
variables. Young (1993) finds non-significant Pearson correlation coefficients for theft rates and the
percentage of unemployed men and women for 20 nations. He states that there are cross-cultural
questions about the validity of strain theories that predict positive correlations, and competing theories
that predict negative correlations. In light of this argument, multiple regression results and estimated
elasticities are presented in the below.
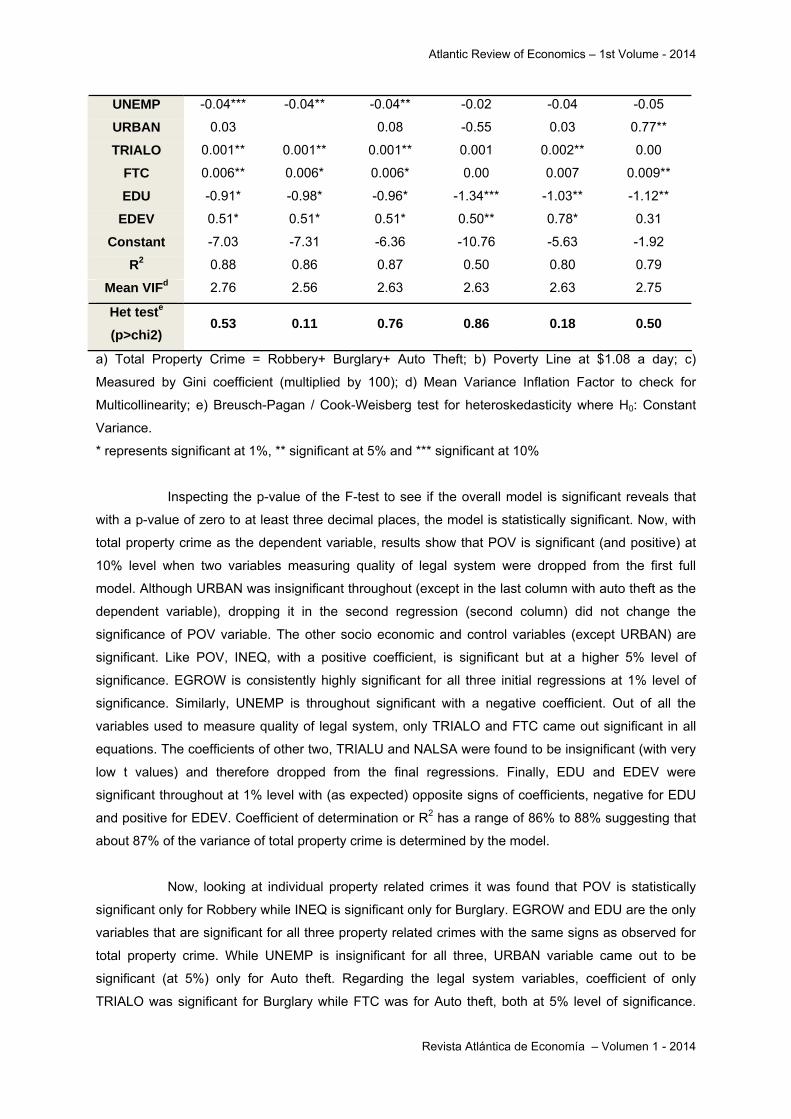
Table 6: OLS Regression Results
Dependent Variables Independent
Variables Total Property Crimea Robbery Burglary Auto Theft
Prob.>F 0.000 0.000 0.000 0.002 0.000 0.001
POVb 0.26 0.27*** 0.27*** 1.13** 0.78 0.19
INEQc 0.01 0.02** 0.02** -0.01 0.05** 0.01
EGROW 1.07* 1.12* 1.03* 1.66*** 1.08*** 0.54*
Atlantic Review of Economics – 1st Volume - 2014
Revista Atlántica de Economía – Volumen 1 - 2014
UNEMP -0.04*** -0.04** -0.04** -0.02 -0.04 -0.05
URBAN 0.03 0.08 -0.55 0.03 0.77**
TRIALO 0.001** 0.001** 0.001** 0.001 0.002** 0.00
FTC 0.006** 0.006* 0.006* 0.00 0.007 0.009**
EDU -0.91* -0.98* -0.96* -1.34*** -1.03** -1.12**
EDEV 0.51* 0.51* 0.51* 0.50** 0.78* 0.31
Constant -7.03 -7.31 -6.36 -10.76 -5.63 -1.92
R2 0.88 0.86 0.87 0.50 0.80 0.79
Mean VIFd 2.76 2.56 2.63 2.63 2.63 2.75
Het teste
(p>chi2) 0.53 0.11 0.76 0.86 0.18 0.50
a) Total Property Crime = Robbery+ Burglary+ Auto Theft; b) Poverty Line at $1.08 a day; c)
Measured by Gini coefficient (multiplied by 100); d) Mean Variance Inflation Factor to check for
Multicollinearity; e) Breusch-Pagan / Cook-Weisberg test for heteroskedasticity where H0: Constant
Variance.
* represents significant at 1%, ** significant at 5% and *** significant at 10%
Inspecting the p-value of the F-test to see if the overall model is significant reveals that
with a p-value of zero to at least three decimal places, the model is statistically significant. Now, with
total property crime as the dependent variable, results show that POV is significant (and positive) at
10% level when two variables measuring quality of legal system were dropped from the first full
model. Although URBAN was insignificant throughout (except in the last column with auto theft as the
dependent variable), dropping it in the second regression (second column) did not change the
significance of POV variable. The other socio economic and control variables (except URBAN) are
significant. Like POV, INEQ, with a positive coefficient, is significant but at a higher 5% level of
significance. EGROW is consistently highly significant for all three initial regressions at 1% level of
significance. Similarly, UNEMP is throughout significant with a negative coefficient. Out of all the
variables used to measure quality of legal system, only TRIALO and FTC came out significant in all
equations. The coefficients of other two, TRIALU and NALSA were found to be insignificant (with very
low t values) and therefore dropped from the final regressions. Finally, EDU and EDEV were
significant throughout at 1% level with (as expected) opposite signs of coefficients, negative for EDU
and positive for EDEV. Coefficient of determination or R2 has a range of 86% to 88% suggesting that
about 87% of the variance of total property crime is determined by the model.
Now, looking at individual property related crimes it was found that POV is statistically
significant only for Robbery while INEQ is significant only for Burglary. EGROW and EDU are the only
variables that are significant for all three property related crimes with the same signs as observed for
total property crime. While UNEMP is insignificant for all three, URBAN variable came out to be
significant (at 5%) only for Auto theft. Regarding the legal system variables, coefficient of only
TRIALO was significant for Burglary while FTC was for Auto theft, both at 5% level of significance.

Atlantic Review of Economics – 1st Volume - 2014
Revista Atlántica de Economía – Volumen 1 - 2014
However, these coefficients are too small to predict any substantial impact on the crime variables.
Lastly, coefficient of EDEV was found significant for Robbery and Burglary but not for Auto thefts.
While R2 was 79% and 80% for Auto theft and Burglary respectively, it was found to be at a lower
50% for Robbery.
The analysis of the normality plots indicates that the normality assumption is appropriate
for hypothesis testing. Cook-Weisberg test for heteroscedasticity using fitted values of crime variables
was conducted with constant variance as the null hypothesis. High p values for this chi-square test
indicate homogenous errors and do not pose any problem. Multicollinearity does not appear to be a
potential problem. This is depicted by the VIF (variance inflation factor) values given in the second
last row of the table. None of the values exceed 2.76 implying that the variable is not a linear
combination of other independent variables. This clears the way to predict the correct elasticities
(given in the table below) from the above model.
Table 7: Estimated Elasticities
Elasticity Total Property
Crime Robbery Burglary Auto Theft
0.27 1.13 10% increase in
incidence of
poverty (number
of people below
poverty line)
2.7% increase in
total property
crimes
11.3% increase in
robberies
0.02 0.05 10% increase in
inequality (Gini
Coefficient)
0.2% increase in
total property
crimes
0.5% increase in
burglaries
1.03-1.12 1.66 1.08 0.54
10% increase in
State Income
(SDP)
On average,
10.75% increase
in total property
crimes
16.6% increase in
robberies
10.8% increase in
burglaries
5.4% increase in
auto thefts
-0.04 10% increase in
unemployment
0.4% decline in
total property
crimes
0.77 10% increase in
urbanization
(urban workers)
7.7% increase in
auto thefts
10% increase in -0.91 to -0.98 -1.34 -1.03 -1.12

Atlantic Review of Economics – 1st Volume - 2014
Revista Atlántica de Economía – Volumen 1 - 2014
expenditure on
education
On average,
9.35% decline in
total property
crimes
13.4% decline in
robberies
10.3% decline in
burglaries
11.2% decline in
auto thefts
0.51 0.50 0.78 10% increase in
outlay on
economic
activities/
services
5.1% increase in
total property
crimes
5% increase in
robberies
7.8% increase in
burglaries
These elasticity figures suggest that poverty has the highest impact on robberies. This
1.13 elasticity has a more than proportionate impact of being poor on committing a robbery.
Inequality, on the other hand, has a relatively less magnitude of elasticity with crime. An unequal
distribution of income among the population or a big divide between the rich and poor does not show
a big impact on property crimes in total or burglary in particular. It can be reasonably inferred that high
inequality, per se, is more likely to give rise to violent crimes like murder and kidnapping. This
conform to the Indian scenario of inequality combined with rampant cases of inter caste, inter regional
and inter religion friction culminating in violent tendencies. A much more concrete finding is the
elasticities of economic growth (State incomes) and education with respect to property crimes, both
aggregated and individually. A 10% increase in per capita state domestic product gives rise to more
than proportionate rise in total property crimes, robbery and burglary with the impact on robbery being
the maximum at 16.6%. This can be explained by the fact that economic growth and rise in personal
income levels in States with high inequality and poverty (such as Uttar Pradesh, Bihar, Madhya
Pradesh and Rajasthan) result in the rich getting richer while poor not benefiting much. In other
words, benefits of growth do not trickle down to all sections of the society. This, in the indirect way,
results in a rise of property crimes, robberies in particular.
Most convincing result comes from the figures of elasticity of education with crime where
a 10% increase in per capita expenditure education leads to a decline between 9.2-11.2% of crime
rates. Also, urbanization tends to trigger only auto thefts by a 0.77% rise in response to 1% increase
in urban workers. This can be explained by the fact that urbanization of rural towns and villages and
further growth of cities tend to have a ‘demonstration effect’ on the rising Indian middle class which
prefers to spend their wages and salaries on durable/ semi-durable goods such as automobiles,
house hold electronics, real estate among other commodities. This further gives rise to incidents of
auto thefts. However, it is difficult to explain the insignificant impact of urbanization on robbery,
burglary and aggregated property crimes. Unemployment tends to impact only total property crimes
and not any individual crime. This anomalous phenomenon will be discussed below.

Atlantic Review of Economics – 1st Volume - 2014
Revista Atlántica de Economía – Volumen 1 - 2014
7. Discussion
The positive coefficient of poverty variable confirms the economic theory of crime that
poverty leads to more criminal activities. This result is also in line with Fafchamps and Minten’s (2002)
econometric result that poverty is associated with rise in property related crime. They took into
account the number of people below poverty line in Madagascar rather than the more challenging
relation with chronic poverty, i.e., extremely poor people suffering from hunger. Property crime, in line
with their findings, is a consumption smoothing strategy that helps such poor people (not the
extremely poor) to avoid their already low standards of living falling further down. This is also referred
to as the ‘vulnerability’ of the poor.
The significant positive relationship between poverty and crime (total property crimes and
robbery) rejects both opportunity and returns-to-crime theories while confirms the relative deprivation
theory of crime. An explanation for this in the Indian context could be the possible failure of poverty
reduction programmes. However, this does not imply that such schemes implemented by
governments are totally redundant but it means that could rather be misdirected. Rather than shifting
the relative positions of those in the lower class who are most prone to commit crimes (such as the
young, unemployed, unskilled and uneducated males), certain other groups have been targeted,
principally distressed women with children, handicapped, malnourished children and the elderly. Such
a failure to identify the real target group by State sponsored social and economic schemes has been
suggested before by DeFronzo (1983) and Plotnick and Smeeding (1979)17. Allen (1996) puts forth
the argument that “a change in relative positions resulting from social forces perceived to be
unjustified may result in increased criminal behaviour by the disadvantaged groups.”
What was expected was a positive association between income inequality and crime
(positive INEQ variable) simply because as the number of poor people increase relative to the rich,
their opportunity cost to commit crime comes down. In other words, they have relatively more to gain
than few others who lose from crime. The regression results fit into this line of reasoning but are in
conflict with the findings of Hsieh and Pugh (1993), Kelly (2000) and Brush (2007). The only exception
to this was the negative coefficient with robbery but it was statistically insignificant. EGROW
representing economic growth (per capita income of the States) convincingly remains a positive
determinant of property related crime in India. This result is in perfect accordance with that of Entorf
and Spengler (2000). There are two possible explanations for this relationship. First, wealth measured
by per capita income incorporates both legal and illegal income opportunities reveals the growth of
black market also since income figures do not exclude gains to criminals from selling stolen goods or
17 Empirical evidence of a direct link between anti-poverty programmes and crime, however, is inconclusive (DeFronzo, 1983; Howsen and Jarrell, 1987; Devine, Sheley and Smith, 1988).

Atlantic Review of Economics – 1st Volume - 2014
Revista Atlántica de Economía – Volumen 1 - 2014
cars. Second, rising incomes in light of high inequality and poverty can result in rise in property
crimes, robberies in particular.
Chiricos (1987) suggested that unemployment-crime relationship, if it in fact exists, is
apparently more complex than is commonly assumed. This fits well in light of the results obtained in
this study since effect of unemployment is significant only for total property crimes and not for any
individual property crime. Nonetheless the coefficient is negative in all regressions. The empirical
results obtained here do not support the view that increase in relative return to crime due to
unemployment dominates the effect of having newly unemployed family members at home to protect
property. However, in line with Cohen, Felson and Land (1980), Cohen (1981) and Cantor and Land
(1985) , the negative relation between total property crimes and poverty indicates that effect of
reduced criminal opportunities resulting from increased guardianship dominates. In the Indian context,
any increase in unemployment rate, in most cases, culminates from recessionary pressures exerted
by deceleration of production and consumption in the economy. In such phases, it could decrease the
opportunity for property crime by increasing the capacity and ability to protect one’s own possessions
and belongings by devoting more time at home.
The urbanization variable, URBAN, was insignificant in all regression except for Auto theft
where its coefficient was 0.77 and significant at 5% level. The only possible explanation for this could
be the link between urbanization (in the form of increasing jobs and concomitant rise in incomes
resulting in greater number of automobiles being purchased by individuals) and crime in light of high
poverty and inequality. The demonstration effect mentioned above juxtaposed with an unjust society
(high Gini coefficient in cities) might be leading to rise in auto thefts. It also supports the finding of
Glaeser and Sacerdote (1996). As they mention in their article, when cities are getting larger, this
make the return on stolen goods higher, the probability of getting caught is adversely related with city
size and finally, availability of resale market of stolen goods are also increases with city size. .
Only two variables for quality of legal system and judiciary, trials taking more than ten
years and fast track courts, have been significant in all regressions for total property crimes but not
individually. Results show that longer the duration of trial of criminals (depicting inefficiencies and
imperfections of criminal justice system), higher is the crime rate. This confirms the theories of Becker
and Ehrlich of 1960s and 1970s that for the first time gave evidence to the hypothesis that higher
chance of getting apprehended and punished lowers the expected relative returns to crime (Becker,
1968; Ehrlich, 1973). However, subsequent theoretical analysis indicates that these criminal justice
system factors do not unambiguously deter crime (Block and Heineke, 1975; Heineke, 1978; Cook,
1977; Nagin, 1978; Brier and Fienberg, 1980). TRIALO having a significant and positive coefficient is
in line with the arguments extended by Kohling (2000) that it indicated a weak and inefficient form of
legal system and judiciary. This acts as an anti-deterrent for potential criminals and thus increases
crimes. However, FTC having a positive and significant coefficient might, in the Indian context,
indicate that benefits of such measures (setting up fast track courts for speedy trials) are either getting

Atlantic Review of Economics – 1st Volume - 2014
Revista Atlántica de Economía – Volumen 1 - 2014
diluted or not reaching the masses. A possible reason for this could be rampant corruption in the
police and judicial system.
EDU was negative and significant in all types of property related crimes. This implies that
State spending on education has a favourable impact on wages of individuals which might be raising
the opportunity cost of committing crimes. Also, by altering preferences for risk taking or patience and
improving social networks, education reduces crime. This result is in line with almost all empirical
studies in this area with the exception of Gumus (2000) who finds a positive and significant
relationship between education and property crimes.
8. Conclusion and way ahead
In direct contrast to some views that fighting poverty, inequality and social disorganization
is not helpful for reducing crime, the findings indicate that property crime increases with incidence of
absolute poverty and that income distribution and social structure apparently have impact on property
crime activity when controlled for other socioeconomic factors. In addition, the alternative (political)
view of fighting crime with effective poverty alleviation programmes along with strong criminal justice
actions is consistently supported. These findings also indicate that macroeconomic stability
(especially high growth and employment) policies, per se, cannot reduce property crimes. These
policies only if combined with pulling poor people above poverty line, raising their standard of living
and social progress can abate crime. From a policy perspective these results imply that enhancing
human capital accumulation can reduce crime. This can be carried out through strengthening
education system and making education institutions robust and efficient can upgrade labour market
productivity and expected incomes of individuals. This combined with suitable deterrence measures
and good quality reliable judiciary are likely to be most critical ingredients in reducing crime.
Different measures of poverty that capture the depth and severity and not only incidence
of poverty can be used. While the first one is measured by the poverty gap index, the squared poverty
gap index measures the second. Since these are sensitive to distribution of inequality amongst the
poor they can serve as better indicators of poverty. This study took into account only absolute poverty
measure which focuses poor but impact of relative poverty with focus on vulnerable chronically poor
deserves more research. Regarding inequality, Gini coefficient might not reflect the true picture
because it ignores the crucial facet of wealth distribution that is critical for aggregate crime rates
especially in the Indian context. Efforts should be made to use inequality variable that measures
effective egalitarianism. “The relationship between crime and resource distribution is dominated by
the extremes” (Noveck, 2007: 19). Since Gini considers the entire income distribution, further
research on this can take into account other measures of inequality which corresponds more to the
top and bottom quintiles of income distribution.

Atlantic Review of Economics – 1st Volume - 2014
Revista Atlántica de Economía – Volumen 1 - 2014
It is clear from the literature that crime-unemployment relationship is ambiguous. In light of this,
wages can act as a better determinant than unemployment. If ample and time consistent data is
available then using unemployment rates lagged by one or two years might provide different results.
Also, some authors have mentioned that by stressing unemployment, crime theory generally ignores
the effect of inflation on criminal activity. Useful insights can be drawn if future work in this area can
include price and wage adjustments in the economy to adjust real incomes. Finally, considering a
random sample of countries/ states/ regions could be used and research using a time series may be
more informative. However data may be difficult to get especially for developing or emerging
economies.

Atlantic Review of Economics – 1st Volume - 2014
Revista Atlántica de Economía – Volumen 1 - 2014
Bibliography
Allen, R. C. (1996) “Socioeconomic Conditions & Property Crime: A Comprehensive Review and
Test of Professional Literature”, American Journal of Economics % Sociology, 55, 293-308
Anderson, E. (1990) “Streetwise: Race, Class and Change in and Urban Community”, Chicago:
University of Chicago Press
Anderson, E. (1999) “Code of the Street: Decency, Violence and the Moral Life of the
Inner City”, New York: W.W. Norton and Company
Becker, G. (1968) “Crime and Punishment: An Economic Approach”, Journal of Political
Economy, 169-217
Bennet, R. R. (1991) “Development and crime: A cross-national, time-series analysis of
competing models”, The Sociological Quarterly, 32(3), 343-363
Bernard, T. J. (1987) “Testing Structural Strain Theories”, Journal of Research in Crime and
Delinquency, 24(4), 262-80
Blau, J. R. and P. M. Blau (1982) “Cost of Inequality: Metropolitan Structure and Violent Crime,”
American Sociological Review, 47(1), 114-129
Block, M. K. And J. M. Heineke (1975) “A Labor Theoretic Analysis of the Criminal Choice”,
American Economic Review, 65(3), 314-25
Braithwaite, J. (1979) “Inequality, Crime and Public Policy”, London: Routledge
Brier, S. S. and S. E. Fienberg (1980) “Recent Econometric Modeling of Crime and Punishment:
Support for the Deterrence Hypothesis”, Evaluation Review, 4(2), 147- 91
Brown, S. E., F. Esbensen and G. Geis (1991) “Criminology: Explaining Crime and its Context”,
Cincinnati: Anderson Publishing Company
Brush, J. (2007) “Does Income Inequality lead to more crime? A comparison of cross sectional
and time series analysis of United States Counties”, Economic Letters, 98, 262-68
Atlantic Review of Economics – 1st Volume - 2014
Revista Atlántica de Economía – Volumen 1 - 2014
Burdett, K. and D. T. Mortensen (1998) “Wage Differential, Employer Size, and Unemployment”,
International Economic Review, 39(2), 257–273
Cantor, D. and K. C. Land (1985) “Unemployment and Crime Rates in the Post-World War II U.S.:
A Theoretical and Empirical Analysis”, American Sociological Review, 50, 317-32
Carr-Hill, R.A. and N. H. Stern (1973) “An Econometric Model of the Supply and Control of
Recorded Offenses in England and Wales”, Journal of Public Economics, 2(4), 289-318
Chester, C. R., (1976) “Perceived Relative Deprivation as a Cause of Property Crime”, Crime and
Delinquency, 22 (1), 17-30
Ching-Chi H. and M. D. Pugh (1993) “Aggregate Data Studies Poverty, Income Inequality, and
Violent Crime: A Meta-Analysis of Recent Aggregate Data Studies”, Criminal Justice Review, 18,
182. Online version of this article can be found at:
http://cjr.sagepub.com/cgi/content/abstract/18/2/182
Chiricos, T. G. (1987) “Rates of Crime and Unemployment: An Analysis of Aggregate Research
Evidence”, Social Problems, 34(2), 187-211
Chiu, W. H. and P. Madden (1998) “Burglary and Income Inequality”, Journal of Public
Economics, 69, 123-141
Cohen, L. E. (1981) “Modeling Crime Trends: A Criminal Opportunity Perspective” Journal of
Research in Crime and Delinquency, 18, 138-64
Cohen, L. E. and M. Felson (1979) “Social Change and Crime Rate Trends: A Routine Activity
Approach”, American Sociological Review, 44, 588-607
Cohen, L. E., M. Felson and K. C. Land (1980) “Property Crime Rates in the United States: A
Macro dynamic Analysis 1947-1977 with Ex Ante Forecasts for the Mid-1980s”, American Journal
of Sociology, 86(1), 90-118
Cohen, L. E., J. R. Kluegel & K. C. Land (1981) “Social Inequality & Predatory Criminal
Victimization: Exposition and Test of a Formal Theory”, American Sociological Rv., 46, 505-24
Cook, P. J. (1977) “Punishment and Crime: A Critique of Current Findings Concerning the
Preventive Effects of Punishment”, Law and Contemporary Problems, 41(1), 164-204

Atlantic Review of Economics – 1st Volume - 2014
Revista Atlántica de Economía – Volumen 1 - 2014
Cullen, F. T. (1988) “Were Coward and Ohlin Strain Theorists? Delinquency and Opportunity
Revisited”, Journal of Research in Crime and Delinquency, 25(3), 214-41
Danziger, S. and D. Wheeler (1975) “The Economics of Crime: Punishment or Income Re-
distribution”, Review of Social Economy, 33(2), 113-31
Danziger, S. (1976) “Explaining Urban Crime Rates”, Criminology, 14(2), 291-96
Datt, G. (1998) “Poverty in India and Indian States: An Update”, Food Consumption and Nutrition
Division Discussion Paper No. 47, International Food Policy Research Institute, Washington, D.C.
Datt, G. and M. Ravallion (1996) “Macroeconomic crises and poverty monitoring: A case study for
India” Food Consumption and Nutrition Division Discussion Paper No. 20, International Food
Policy Research Institute, Washington, D.C.
David, B. (2008) “Thieves, Thugs, and Neighborhood Poverty”, Electronic copy available at:
http://ssrn.com/abstract=1288896
DeFronzo, J. (1983) “Economic Assistance to Impoverished Americans”, Criminology, 21(1), 119-
36
Demombynes, G. and B. Ozler (2002) “Crime and Local Inequality in South Africa” (mimeograph)
Deutsch, J., U. Spiegel and J. Templeman (1992) “Crime and Economic Inequality: An Economic
Approach”, Atlantic Economic Journal, 20(4), 46-54
Devine, J. A., J. F. Sheley and M. D. Smith (1988) “Macroeconomic and Social-Control Policy
Influences on Crime Rate Changes, 1948-1985”, American Sociological Review, 53, 407-20
DiIulio, J. J, Jr. (1996) “Help Wanted: Economists, Crime and Public Policy”, Journal of Economic
Perspectives, 10 (1), 3:24
Doyle, J., E. Ahmed and R. Horn (1999) “The Effects of Labour Market and Income Inequality on
Crime: Evidence from Panel Data”, Southern Economic Journal, 65(4), 717-38
Dreze, J. and R. Khere (2000) “Crime, Gender and Society in India: Insights from Homicide Data”,
Population and Development Review, 26(2), 335-52

Atlantic Review of Economics – 1st Volume - 2014
Revista Atlántica de Economía – Volumen 1 - 2014
Dutta, M. and Z. Husain (2009) “Determinants of crime rates: Crime Deterrence and Growth in
post-liberalized India”, MPRA Paper No. 14478, Available Online at http://mpra.ub.uni-
muenchen.de/14478/
Ehrlich, I. (1973) “Participation in Illegitimate Activities: A Theoretical and Empirical Investigation”,
Journal of Political Economy, 81(3), 521-565
Ehrlich, I. (1975) “On the Relation between Education and Crime’, in F. T. Juster (ed.) Education,
Income and Human Behavior, McGraw-Hill, New York, 313-337
Ehrlich, I. (1996) “Crime, Punishment, and the Market for Offenses”, Journal of Economic
Perspectives, 10(1), 43-67
Entorf, H. and H. Spengler (2000) “Socioeconomic and Demographic Factors of Crime in
Germany: Evidence from Panel Data of the German States” International Review of Law and
Economics, 20, 75-106
Entorf, H. and H. Spengler (2000) “Criminality, social cohesion and economic performance”,
Würzburg Economic Papers No. 22
Fafchamps, M. and B. Minten (2002) “Crime and Poverty: Evidence from a Natural Experiment”,
CSAE Working Paper Series 23
Fajnzylber, P., D. Lederman and N. Loayza (2000) “Crime and Victimization: An Economic
Perspective”, Economia1, 219-302
Fajnzylber, P., D. Lederman and N. Loayza (2002) “What Causes Violent Crime?” European
Economic Review, 46 (2), 1323-1357
Fisher, S. (1987) “Economic Development and Crime: The two may be associated as an
adaptation to industrialism in Social Revolution”, American Journal of Economics and Sociology,
46(1), 17-34
Fleisher, B. M. (1963) “The Effect of Unemployment on Juvenile Delinquency”, Journal of Political
Economy, 71(6), 543-555
Fleisher, B. M. (1966) “The Effect of Income on Delinquency”, American Economic Review, 56(1),
118-37
Atlantic Review of Economics – 1st Volume - 2014
Revista Atlántica de Economía – Volumen 1 - 2014
Freeman, R.B. (1991) “Crime and the Employment of Disadvantaged Youths”, NBER Working
Paper 3875
Freeman, R. B. (1996) “Why Do So Many Young American Men Commit Crimes and What Might
We Do About It?” Journal of Economic Perspectives, 25-42
Galvin, E. B. (2002) “Crime and Violence in an Urbanizing World”, Journal of International Affairs,
56, 123-145
Gaviria, A. and C. PAGÉS (2002) “Patterns of Crime Victimization in Latin American Cities”,
Journal of Development Economics, 67, 181-203
Gillespie, R. W. (1979) “Economic Factors in Crime and Delinquency: A Critical Review of the
Empirical Evidence”, Report to the National Institute of Law Enforcement and Criminal Justice,
Department of Justice, 601-26
Glaeser, E., B. Sacerdote and J. Scheinkman (1996) “Crime and Social Interactions”, Quarterly
Journal of Economics, 111, 507-548
Gould, E., D. Mustard and B. Weinberg (2002) “Crime rates and local labor market opportunities
in the U. S.: 1977-1997”, Review of Economics and Statistics, 84, 45-61
Grogger, J. (1991) “Certainty vs. Severity of Punishment”, Economic Inquiry, 29, 297-309
Grogger, J. (1995) “The Effect of Arrest on the Employment and Earnings of Young Men”,
Quarterly Journal of Economics, 110(1), 51-72
Grogger, J. (1998) “Market Wages and Youth Crime”, Journal of Labor Economics, 16, 756-91
Gumus, E. (2004) “Crime in Urban Areas: An Empirical Investigation”, Akdeniz I.I.B.F. Dergisi,
4(7), 98-109. Available at SSRN: http://ssrn.com/abstract=563226
Hashimoto M. (1982) “Minimum Wage Effects on Training on the Job”, AER, 72, 1070
Heineke, J. M. (1978) “Economic Models of Criminal Behavior”, N. Y.: North Holland Press
Howsen, R. M. and S. B. Jarrell (1987) “Some Determinants of Property Crime: Economic Factors
Influence Criminal Behavior but Cannot Completely Explain the Syndrome”, American Journal of
Economics and Sociology, 46, 445-57
Atlantic Review of Economics – 1st Volume - 2014
Revista Atlántica de Economía – Volumen 1 - 2014
Hughes, M. and T. Carter (1981) “A Declining Economy and Sociological Theories of Crime:
Predictions and Explications” In K. N. Wright, ed. Crime and Criminal Justice in a Declining
Economy, Cambridge: Oelgeschlager, Gunn & Hain, 5-25
Imrohoroglu, A., A. Merlo and P. Rupert (2000) “On the Political Economy of Income
Redistribution and Crime”, International Economic Review, 41, 1-25
Imrohoroglu, A., A. Merlo and P. Rupert (2001) “What Accounts for the Decline in Crime?”,
Federal Reserve Bank of Cleveland, WP 0008
India (1993a) Final population totals: Brief analysis of primary census abstract, Census of India
1991, series 1, paper 2 of 1992, New Delhi: Registrar General and the Census Commissioner of
India
Jacobs, D. (1981) “Inequality & Economic Crime”, Sociology and Social Research, 66(1), 12-28
Jarell, S. and R. Howsen (1990) “Transient Crowding and Crime”, American Journal of Economics
and Sociology, 49, 483-93
Juhn, C., K. Murphy and B. Pierce (1993) “Wage Inequality and the Rise in Returns to
Skill”, Journal of Political Economy
Kelly, M. (2000) “Inequality and Crime”, Review of Economics and Statistics, 82, 530-39
Kenneth, B., R. Lagos and R. Wright (2003) “Crime, Inequality, and Unemployment”, American
Economic Review, 93(5), 1764-1777
Köhling, W. K. C. (2000) “The Economic Consequences of A Weak Judiciary: Insights from India”,
Centre for Development Research (ZEF), University of Bonn
Krueger, A. and J. Pischke (1997) “A Statistical Analysis of Crime against Foreigners in Unified
Germany”, Journal of Human Resources, 32(2), 182-209
Land, K. C., P. L. McCall and L. E. Cohen (1990) “Structural Covariates of Homicide Rates: Are
There Any Invariance’s Across Time and Space?” The American Journal of Sociology, 922-963
Lochner, L. and E. Moretti (2001) “The effect of education on crime: evidence from prison
inmates, arrests, and self-reports”, NBER Working Paper No. 8605

Atlantic Review of Economics – 1st Volume - 2014
Revista Atlántica de Economía – Volumen 1 - 2014
Lochner, L. (2004) “Education, work, and crime: A human capital approach”, International
Economic Review, 45, 811-43
Lochner, L. (2007) “Education and Crime” in Int. Encyclopaedia of Education, 3rd Edn. (2008)
Lott, J. R. (1990) “A Transaction-Cost Explanation for Why the Poor Are More Likely to Commit
Crime”, Journal of Legal Studies, 19, 243-45
Machin, S. and C. Meghir (2004) “Crime and economic incentives”, The Journal of Human
Resources, 39, 958-79
Masih, A. M. M. and R. Masih (1996) “Temporal causality and the dynamics of different categories
of crime and their socioeconomic determinants: Evidence from Australia”, Applied Economics, 28,
1093-1104
Massey, D. S. (1995) “Getting Away with Murder: Segregation and Violent Crime in Urban
America”, University of Pennsylvania Law Review, 143(5), 1203-1232
Meyer R. H and D. A. Wise (1983) “The Effects of the Minimum Wage on the Employment and
Earnings of Youth”, Journal of Labour Economics, 66(1)
Morgan, K. (2000) “Inequality and Crime”, Review of Economics and Statistics, 82(4), 530-39
Nagin, D. (1987) “General Deterrence: A Review of Empirical Evidence” In A. Blumstein, J.
Cohen, and D. Nagin, eds. Deterrence and Incapacitation: Estimating the Effects of Criminal
Sanctions on Crime Rates, Washington: National Academy of Science, 95-139
National Crime Records Bureau (2006) “Crime in India”, Government of India, New Delhi
Patterson, E. B. (1991) “Poverty, Income Inequality and Community Crime Rates”, Criminology,
29, 755-76
Phillips, M. B. (1991) “A Hedgehog Proposal”, Crime and Delinquency, 37(4), 555- 74
Plotnick, R.and T. Smeeding (1979) “Poverty and Income Transfers: Past Trends and Future
Prospects” Public Policy, 27(3), 255-72
Pratt, T. C. and T. W. Godsey (2003) “Social support, inequality, and homicide: A cross-national
test of an integrated theoretical model”, Criminology, 41, 611–643

Atlantic Review of Economics – 1st Volume - 2014
Revista Atlántica de Economía – Volumen 1 - 2014
Quetelet, A. (1842), “A Treatise on Man”, Edinburgh, Scotland: Chambers
Scott M. N. (2007) “Testing the Theory of Rational Crime with United States Data: 1994–2002”,
ICPSR Bulletin, Special Edition, Vol. XXVII, No. 3
Shaw, C. R. and McKay, H. D. (1942) “Juvenile Delinquency and Urban Areas”, University of
Chicago Press
Sjoquist,D . L., "PropertyC rimea nd Economic Behavior:S ome EmpiricalR esults."A merican
EconomicR evieuw1 973, 63:3, 439-46.
Spamann, Holger (2008) ‘“Legal Origins’ of Crime and Punishment”, Draft available at
http://isites.harvard.edu/fs/docs/icb.topic441456.files/Paper08_Spamann_04-13.pdf
Stack, S. (1984) “Income Inequality and Property Crime”, Criminology, 22(2), 229-57
Steven, R. and R. Winter-Ebmer (2001), “Identifying the Effect of Unemployment on Crime”,
Journal of Law and Economics, 44(1), 259-283
Thomas J. Y. (1993) “Unemployment and Property Crime: Not a Simple Relationship”, American
Journal of Economics and Sociology, 52(4), 413-415
United Nations (2002) “The 8th UN Survey on Crime Trends and the operations of Criminal Justice
Systems”, UN Office on Drugs & Crime, Centre for International Crime Prevention
United Nations (2005) “Crime and Development in Africa” Mimeo, U. N., New York
Usher, D. (1997) “Education as Deterrent to Crime”, Canadian Journal of Economics, 30(2), 367-
84
World Bank (1993) “World development report: Investing in health”, New York: Oxford University
Press
World Bank (2007) “Crime, Violence and Economic Development in Brazil: Elements for Effective
Public Policy”, Report No. 36525, World Bank, Washington