Embed Size (px)
Citation preview

Horizontal or Backward? FDI Spillovers, Input-Output Tables
and Industry Aggregation
Karolien Lenaerts and Bruno Merlevede

Outline
2
Overview of the Literature
Research Topic in the Paper
Empirical Approach & Data
Estimation Results
Conclusions

Overview of the Literature
Foreign Direct Investment
4
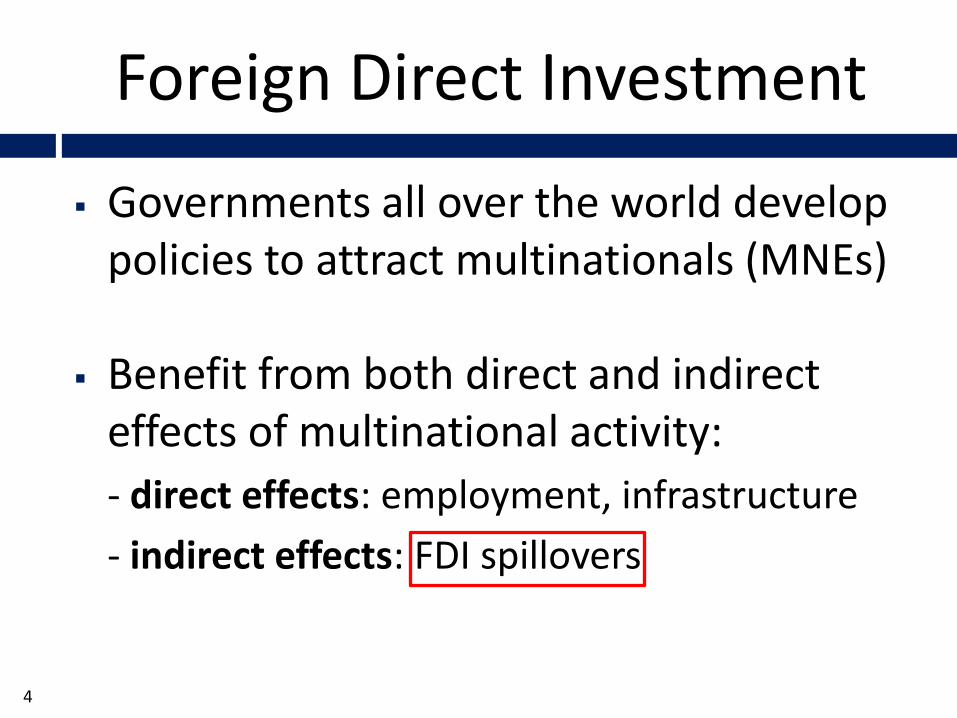
Governments all over the world develop policies to attract multinationals (MNEs)
Benefit from both direct and indirect effects of multinational activity:
- direct effects: employment, infrastructure
- indirect effects: FDI spillovers
FDI Spillovers
5
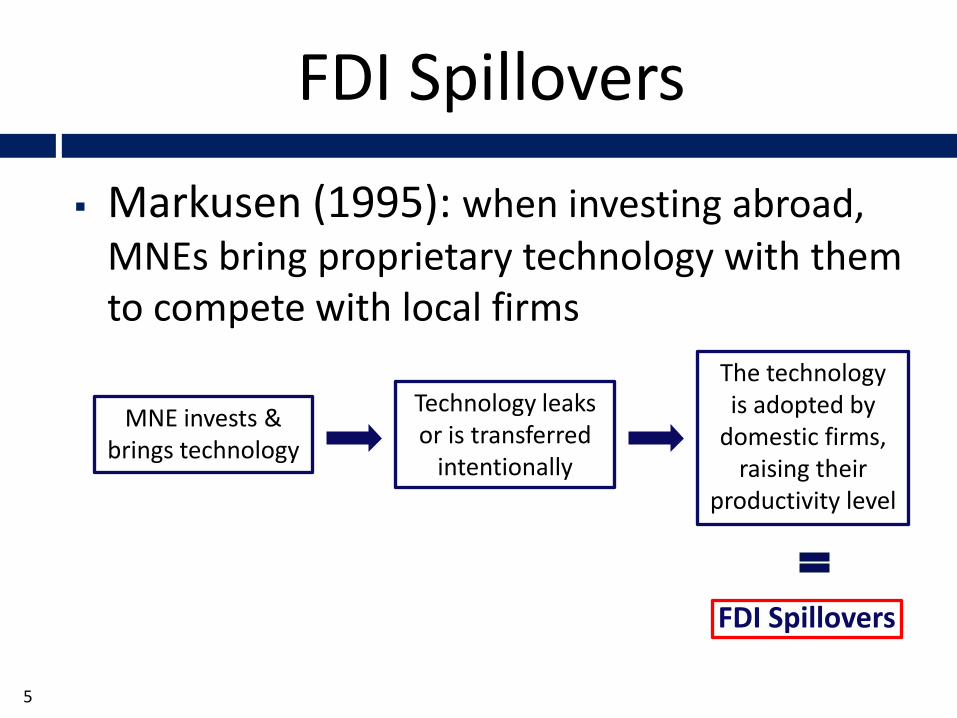
Markusen (1995): when investing abroad, MNEs bring proprietary technology with them to compete with local firms
MNE invests & brings technology
Technology leaks or is transferred
intentionally
The technology is adopted by
domestic firms, raising their
productivity level
FDI Spillovers
FDI Spillovers
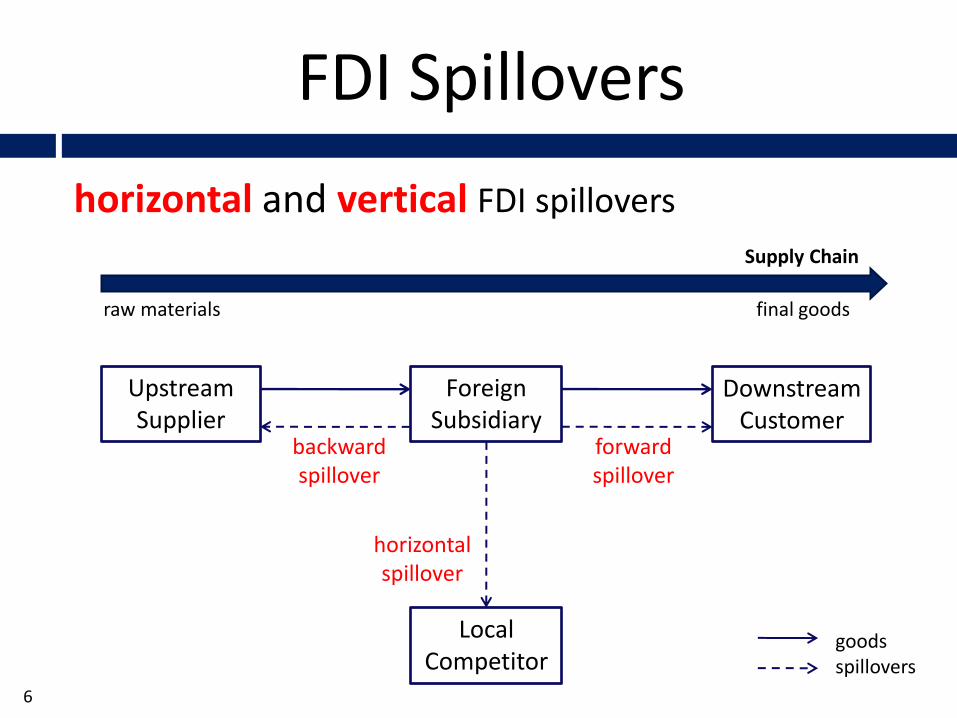
horizontal and vertical FDI spillovers
raw materials final goods
goodsspillovers
Upstream Supplier
Foreign Subsidiary
Downstream Customer
Local Competitor
backward spillover
forward spillover
horizontal spillover
6
Supply Chain

Research Topic in the Paper
Research topic in the paper
8
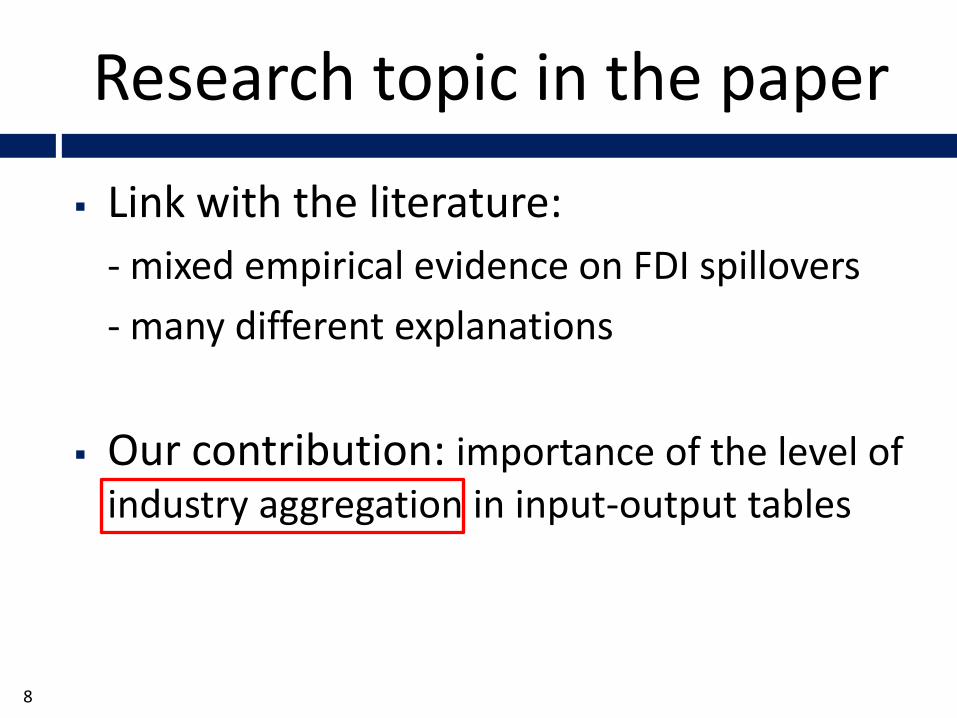
Link with the literature:
- mixed empirical evidence on FDI spillovers
- many different explanations
Our contribution: importance of the level of industry aggregation in input-output tables
Research topic in the paper
9
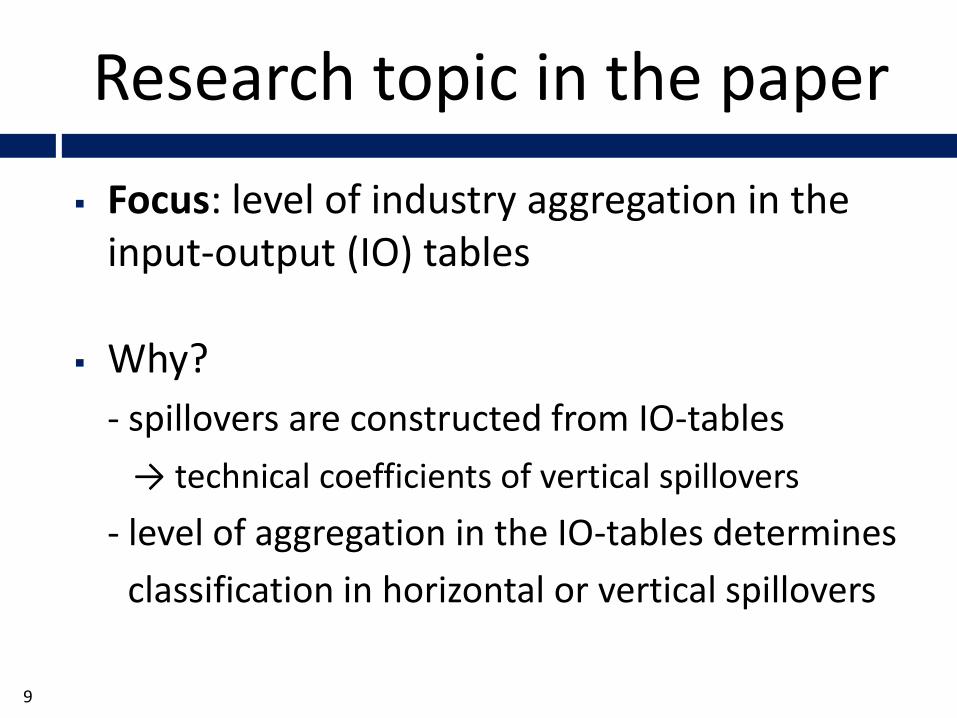
Focus: level of industry aggregation in the input-output (IO) tables
Why?
- spillovers are constructed from IO-tables
→ technical coefficients of vertical spillovers
- level of aggregation in the IO-tables determines
classification in horizontal or vertical spillovers
FDI Spillovers
10
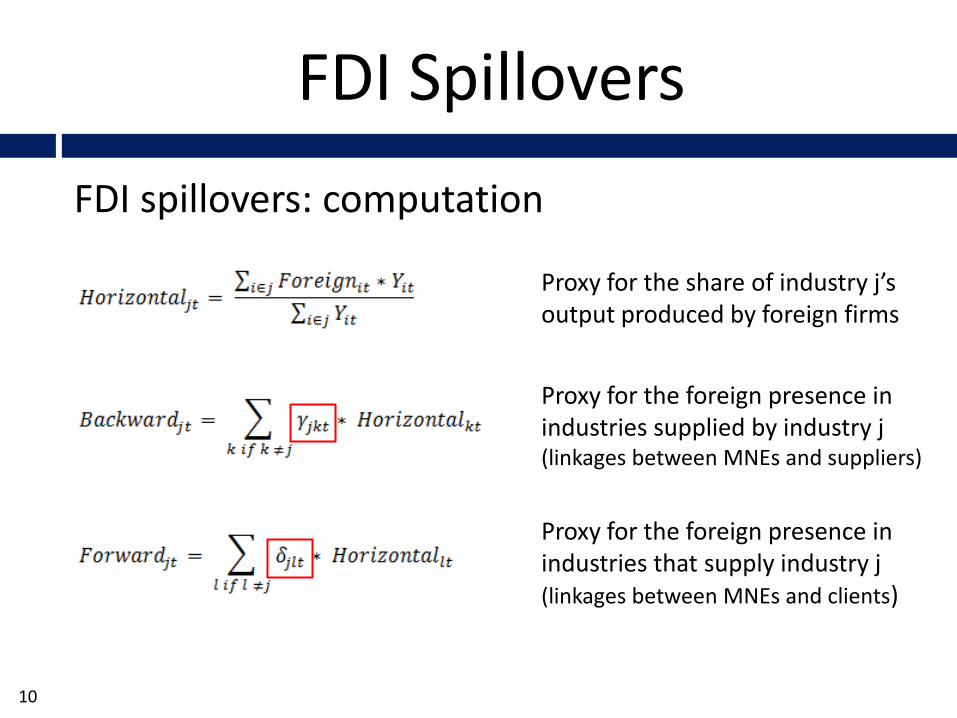
FDI spillovers: computation
Proxy for the share of industry j’s output produced by foreign firms
Proxy for the foreign presence in industries supplied by industry j(linkages between MNEs and suppliers)
Proxy for the foreign presence in industries that supply industry j(linkages between MNEs and clients)
Horizontal or vertical?
11
a b a b a b
a
b
a
b
a
b
a b a b a b
a
b
a
b
a
b3
1 2 3
3
Intermediate Consumption
Industry
Intermediate Consumption
1
2
1
2
3
Industry1 2
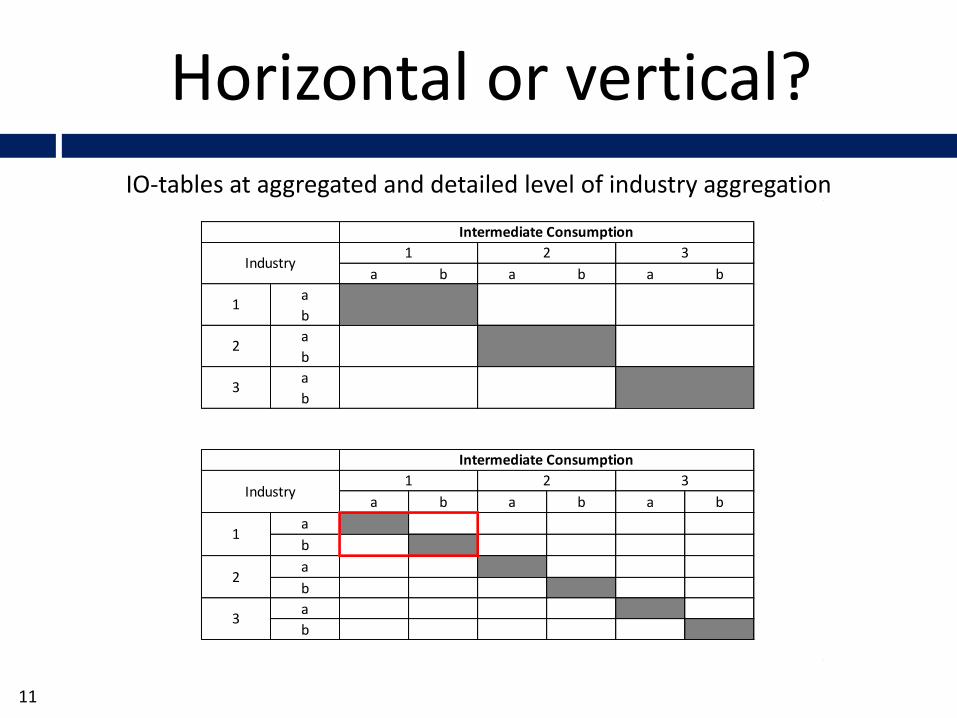
IO-tables at aggregated and detailed level of industry aggregation
Importance of the diagonal
12
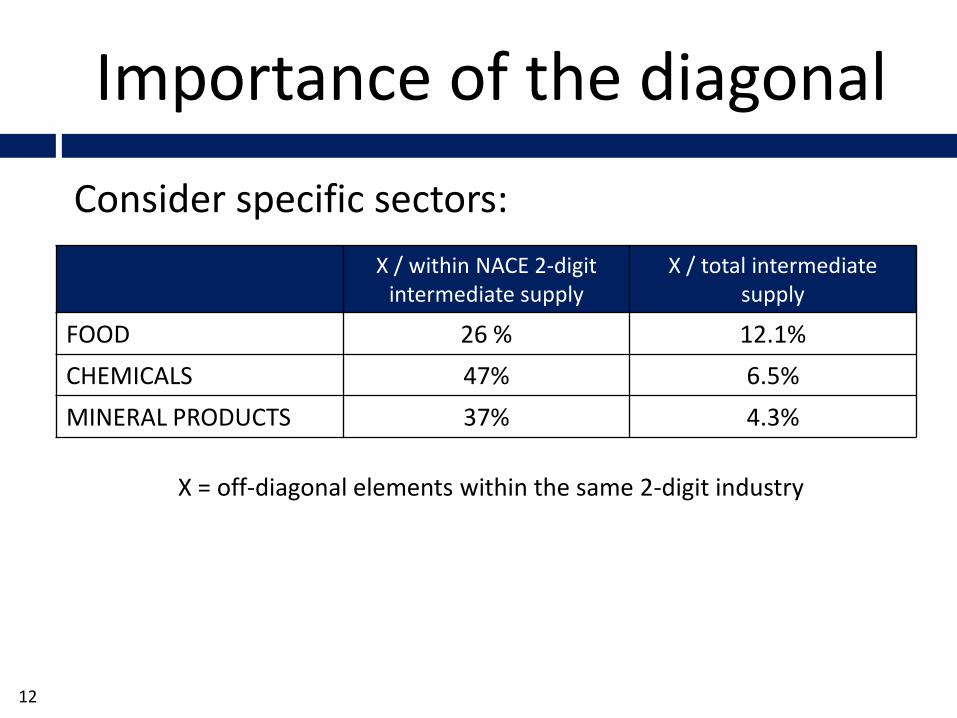
Consider specific sectors:
X = off-diagonal elements within the same 2-digit industry
X / within NACE 2-digit intermediate supply
X / total intermediate supply
FOOD 26 % 12.1%
CHEMICALS 47% 6.5%
MINERAL PRODUCTS 37% 4.3%
Research topic in the paper
13
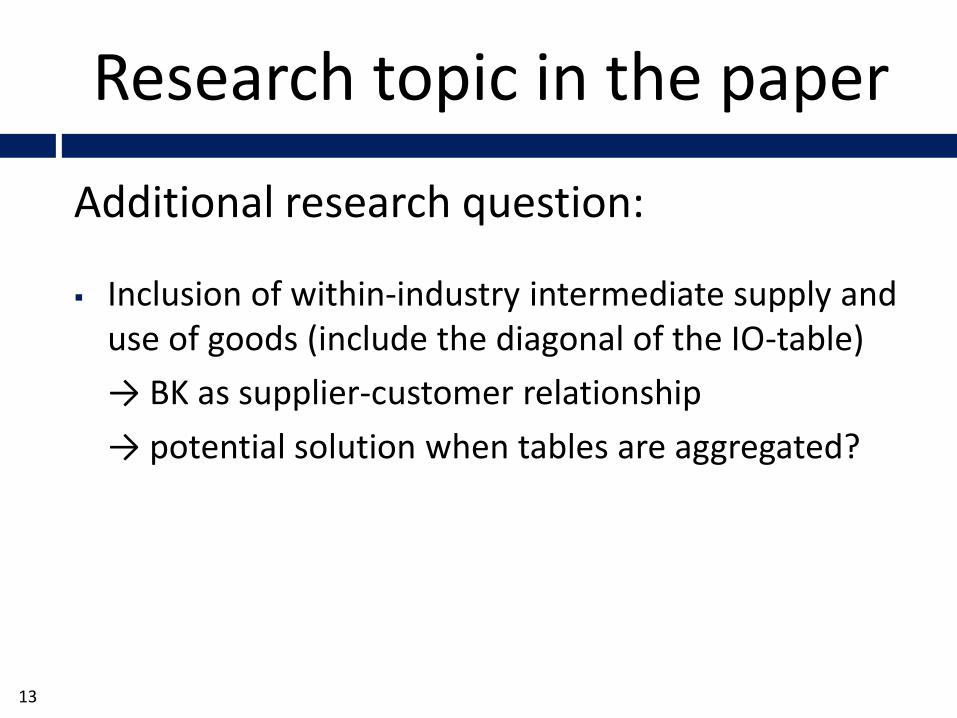
Additional research question:
Inclusion of within-industry intermediate supply and use of goods (include the diagonal of the IO-table)
→ BK as supplier-customer relationship
→ potential solution when tables are aggregated?

Empirical Strategy & Data
Empirical Strategy
15
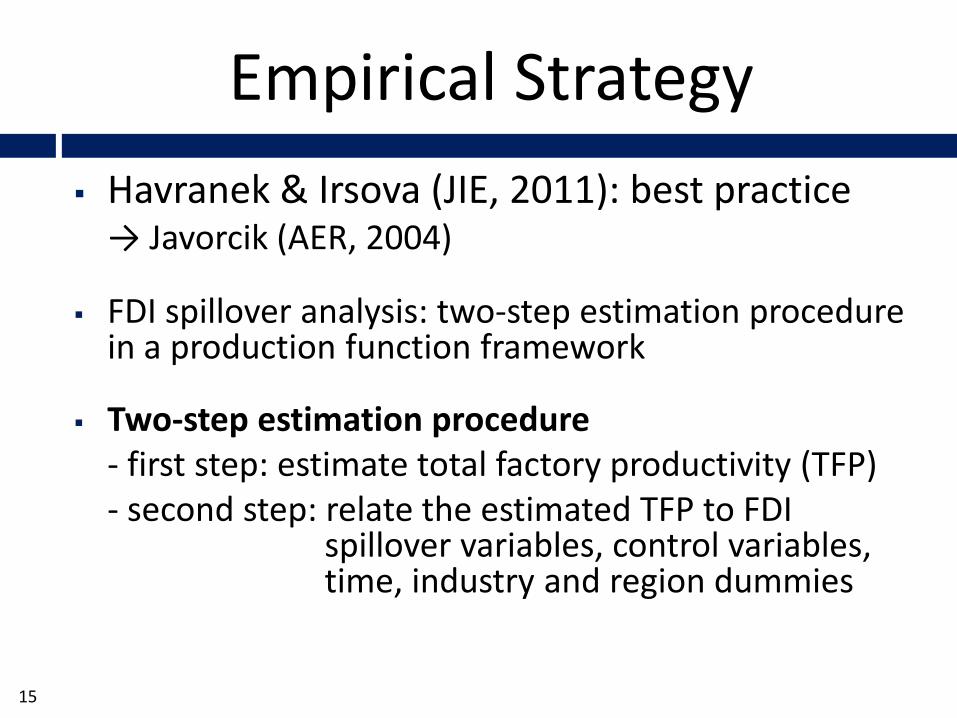
Havranek & Irsova (JIE, 2011): best practice→ Javorcik (AER, 2004)
FDI spillover analysis: two-step estimation procedure in a production function framework
Two-step estimation procedure- first step: estimate total factory productivity (TFP)- second step: relate the estimated TFP to FDI
spillover variables, control variables,time, industry and region dummies

Empirical Strategy
First step: estimate total factor productivity
Issue: (potential) endogeneity between input
choices and productivity
OLS estimates will be biased
Alternative methods: OP, LP, ACF, DPD
Alternative specification: translog
16
Empirical Strategy
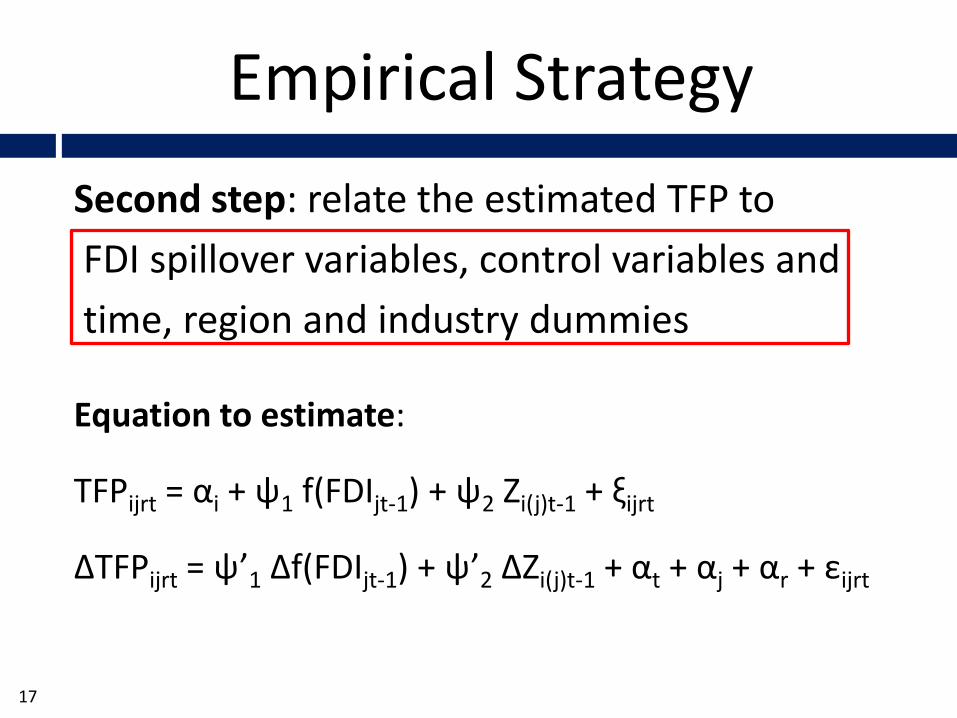
Second step: relate the estimated TFP to
FDI spillover variables, control variables and
time, region and industry dummies
Equation to estimate:
TFPijrt = αi + ψ1 f(FDIjt-1) + ψ2 Zi(j)t-1 + ξijrt
∆TFPijrt = ψ’1 ∆f(FDIjt-1) + ψ’2 ∆Zi(j)t-1 + αt + αj + αr + εijrt
17
Data
18
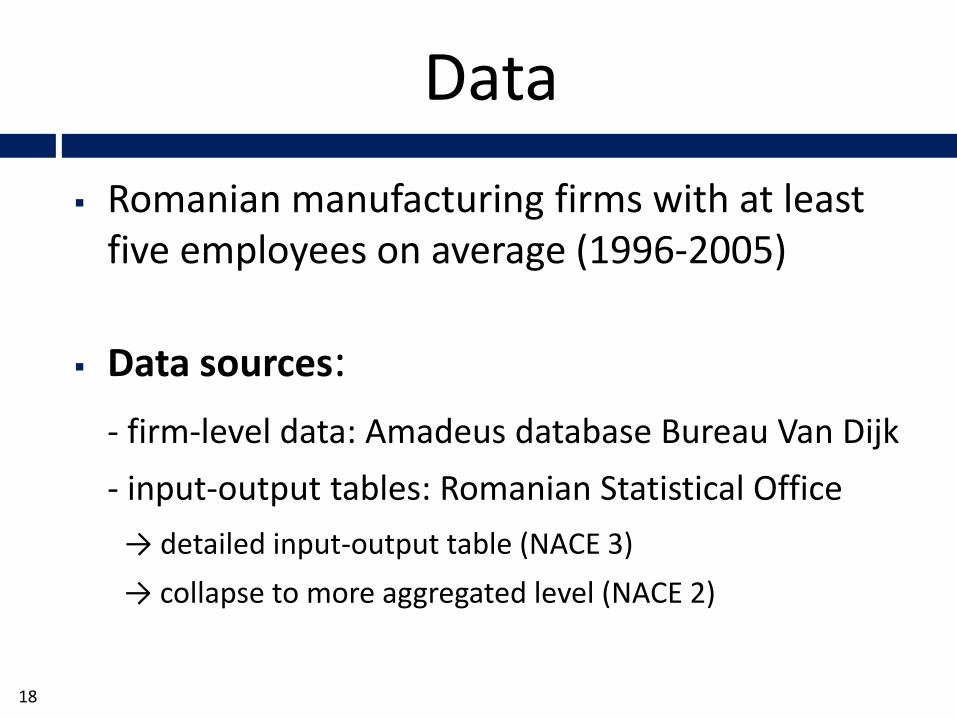
Romanian manufacturing firms with at least five employees on average (1996-2005)
Data sources:
- firm-level data: Amadeus database Bureau Van Dijk
- input-output tables: Romanian Statistical Office
→ detailed input-output table (NACE 3)
→ collapse to more aggregated level (NACE 2)
Data
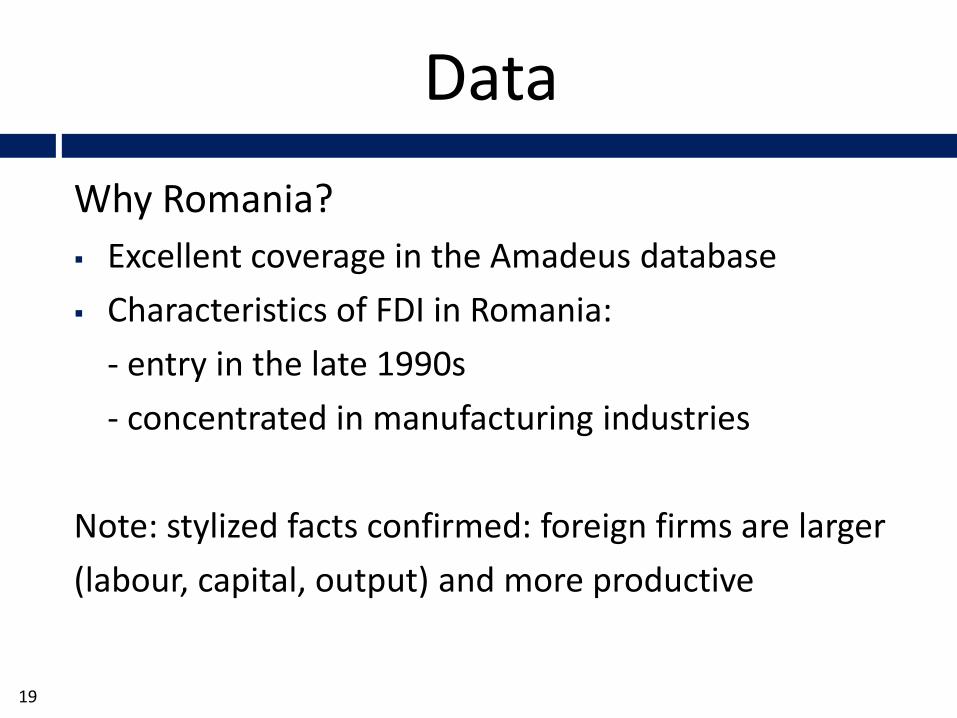
Why Romania?
Excellent coverage in the Amadeus database
Characteristics of FDI in Romania:
- entry in the late 1990s
- concentrated in manufacturing industries
Note: stylized facts confirmed: foreign firms are larger
(labour, capital, output) and more productive
19

Estimation Results
Estimation results
21
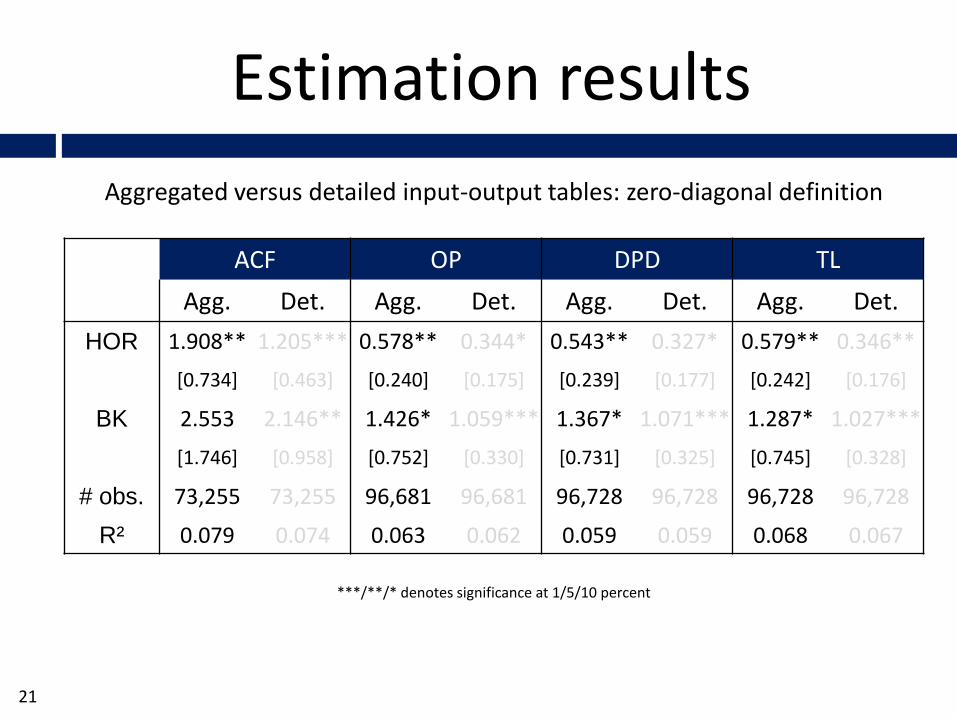
ACF OP DPD TL
Agg. Det. Agg. Det. Agg. Det. Agg. Det.
HOR 1.908** 1.205*** 0.578** 0.344* 0.543** 0.327* 0.579** 0.346**
[0.734] [0.463] [0.240] [0.175] [0.239] [0.177] [0.242] [0.176]
BK 2.553 2.146** 1.426* 1.059*** 1.367* 1.071*** 1.287* 1.027***
[1.746] [0.958] [0.752] [0.330] [0.731] [0.325] [0.745] [0.328]
# obs. 73,255 73,255 96,681 96,681 96,728 96,728 96,728 96,728
R² 0.079 0.074 0.063 0.062 0.059 0.059 0.068 0.067
***/**/* denotes significance at 1/5/10 percent
Aggregated versus detailed input-output tables: zero-diagonal definition
Estimation results
22
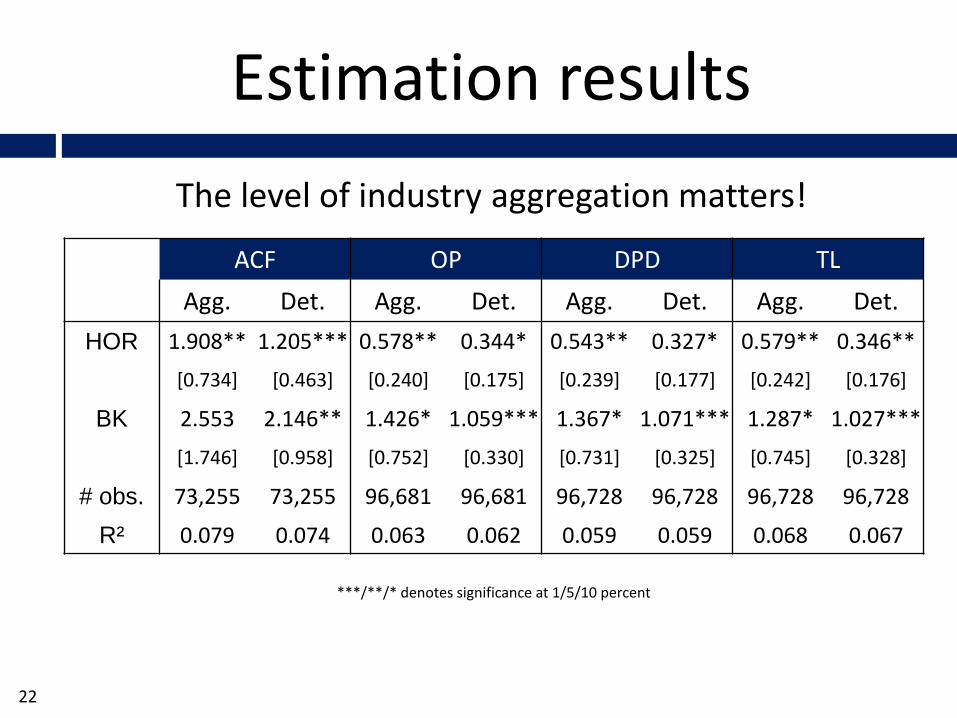
The level of industry aggregation matters!
ACF OP DPD TL
Agg. Det. Agg. Det. Agg. Det. Agg. Det.
HOR 1.908** 1.205*** 0.578** 0.344* 0.543** 0.327* 0.579** 0.346**
[0.734] [0.463] [0.240] [0.175] [0.239] [0.177] [0.242] [0.176]
BK 2.553 2.146** 1.426* 1.059*** 1.367* 1.071*** 1.287* 1.027***
[1.746] [0.958] [0.752] [0.330] [0.731] [0.325] [0.745] [0.328]
# obs. 73,255 73,255 96,681 96,681 96,728 96,728 96,728 96,728
R² 0.079 0.074 0.063 0.062 0.059 0.059 0.068 0.067
***/**/* denotes significance at 1/5/10 percent
Estimation results
23
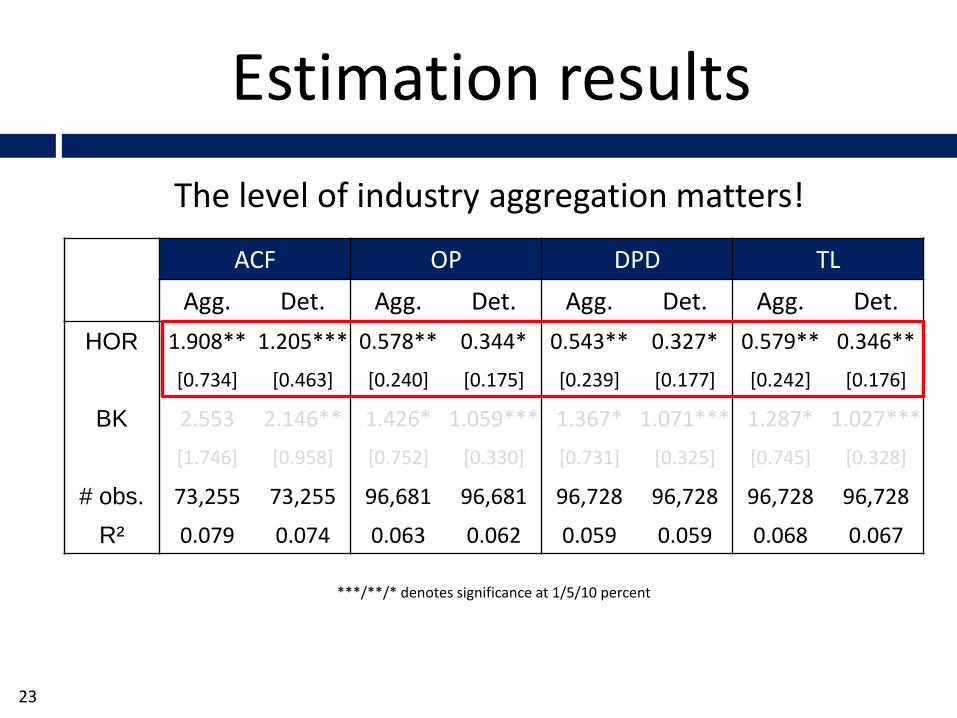
The level of industry aggregation matters!
ACF OP DPD TL
Agg. Det. Agg. Det. Agg. Det. Agg. Det.
HOR 1.908** 1.205*** 0.578** 0.344* 0.543** 0.327* 0.579** 0.346**
[0.734] [0.463] [0.240] [0.175] [0.239] [0.177] [0.242] [0.176]
BK 2.553 2.146** 1.426* 1.059*** 1.367* 1.071*** 1.287* 1.027***
[1.746] [0.958] [0.752] [0.330] [0.731] [0.325] [0.745] [0.328]
# obs. 73,255 73,255 96,681 96,681 96,728 96,728 96,728 96,728
R² 0.079 0.074 0.063 0.062 0.059 0.059 0.068 0.067
***/**/* denotes significance at 1/5/10 percent
Estimation results
24
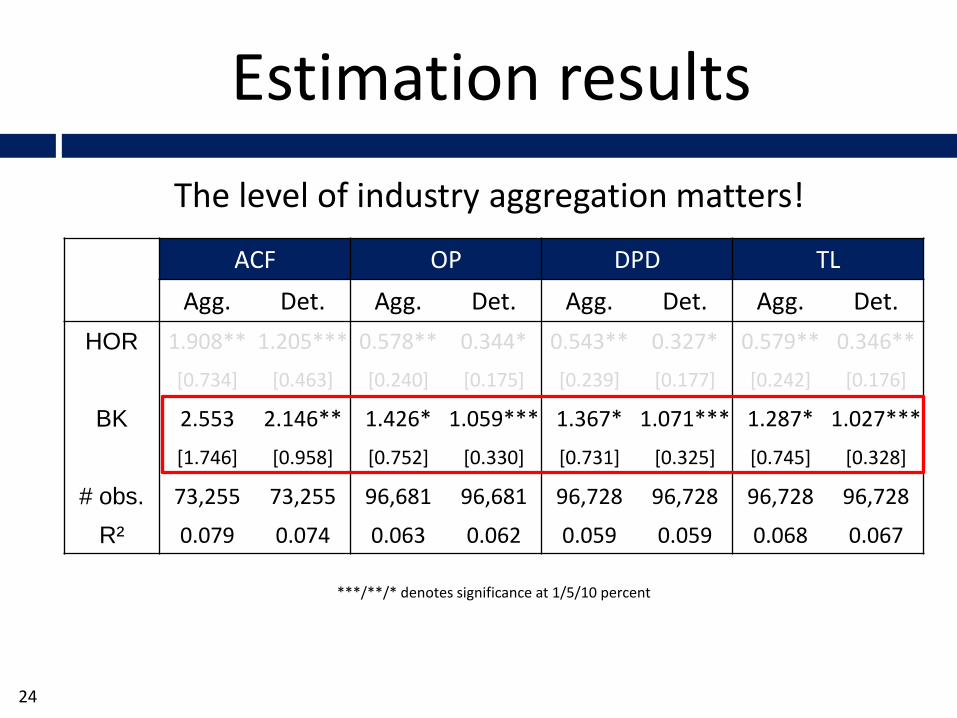
The level of industry aggregation matters!
ACF OP DPD TL
Agg. Det. Agg. Det. Agg. Det. Agg. Det.
HOR 1.908** 1.205*** 0.578** 0.344* 0.543** 0.327* 0.579** 0.346**
[0.734] [0.463] [0.240] [0.175] [0.239] [0.177] [0.242] [0.176]
BK 2.553 2.146** 1.426* 1.059*** 1.367* 1.071*** 1.287* 1.027***
[1.746] [0.958] [0.752] [0.330] [0.731] [0.325] [0.745] [0.328]
# obs. 73,255 73,255 96,681 96,681 96,728 96,728 96,728 96,728
R² 0.079 0.074 0.063 0.062 0.059 0.059 0.068 0.067
***/**/* denotes significance at 1/5/10 percent
Estimation results
25
The level of industry aggregation matters!
Aggregated table: horizontal
↔ Detailed table: horizontal and backward
Upward bias of horizontal spillover coefficient
Bias against finding significant backward spillovers
Results hold for FE and LP
Estimation results
26
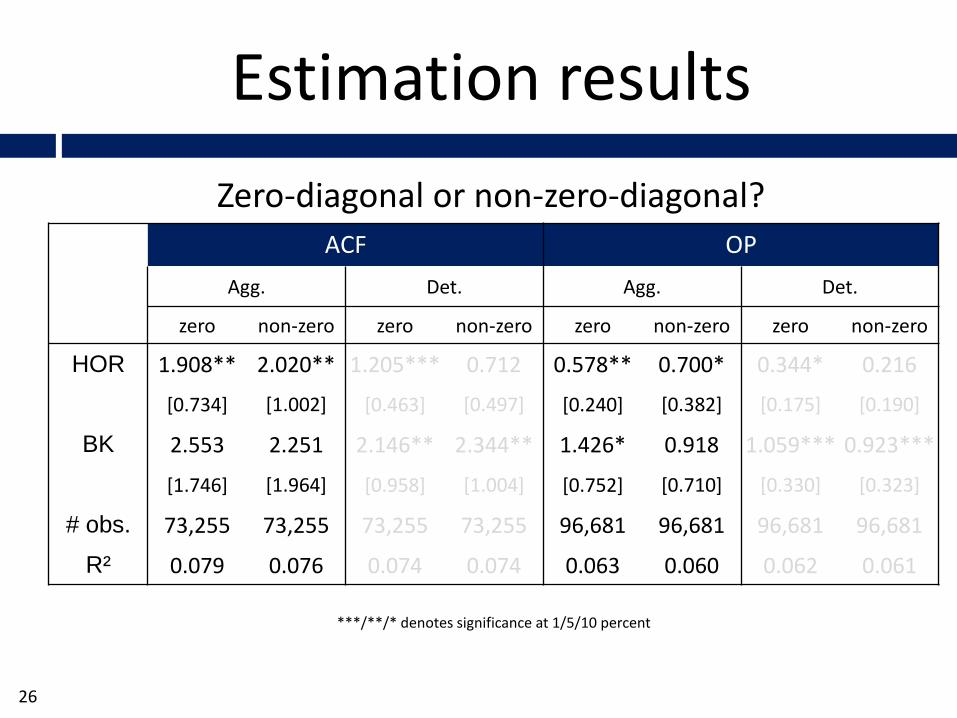
Zero-diagonal or non-zero-diagonal?
***/**/* denotes significance at 1/5/10 percent
ACF OP
Agg. Det. Agg. Det.
zero non-zero zero non-zero zero non-zero zero non-zero
HOR 1.908** 2.020** 1.205*** 0.712 0.578** 0.700* 0.344* 0.216
[0.734] [1.002] [0.463] [0.497] [0.240] [0.382] [0.175] [0.190]
BK 2.553 2.251 2.146** 2.344** 1.426* 0.918 1.059*** 0.923***
[1.746] [1.964] [0.958] [1.004] [0.752] [0.710] [0.330] [0.323]
# obs. 73,255 73,255 73,255 73,255 96,681 96,681 96,681 96,681
R² 0.079 0.076 0.074 0.074 0.063 0.060 0.062 0.061
Estimation results
27
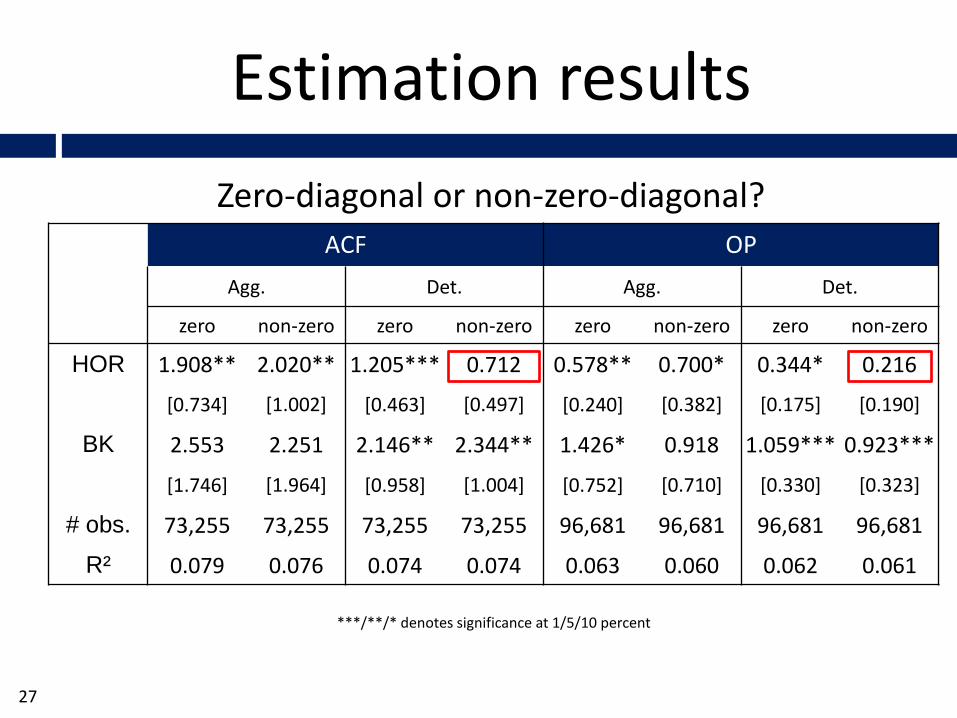
Zero-diagonal or non-zero-diagonal?ACF OP
Agg. Det. Agg. Det.
zero non-zero zero non-zero zero non-zero zero non-zero
HOR 1.908** 2.020** 1.205*** 0.712 0.578** 0.700* 0.344* 0.216
[0.734] [1.002] [0.463] [0.497] [0.240] [0.382] [0.175] [0.190]
BK 2.553 2.251 2.146** 2.344** 1.426* 0.918 1.059*** 0.923***
[1.746] [1.964] [0.958] [1.004] [0.752] [0.710] [0.330] [0.323]
# obs. 73,255 73,255 73,255 73,255 96,681 96,681 96,681 96,681
R² 0.079 0.076 0.074 0.074 0.063 0.060 0.062 0.061
***/**/* denotes significance at 1/5/10 percent
Estimation results
28
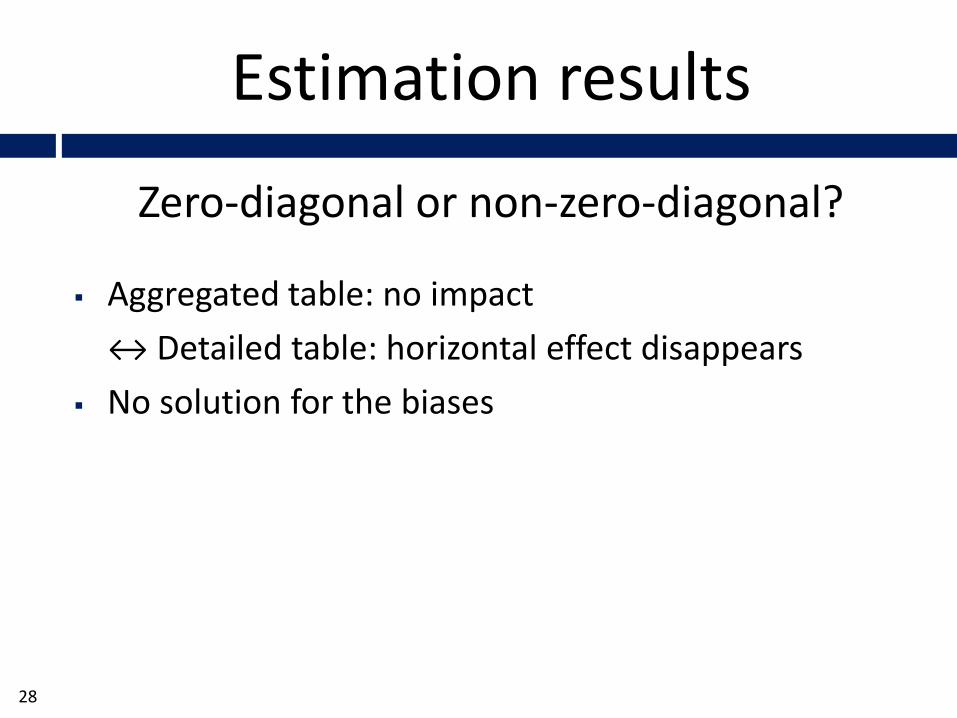
Zero-diagonal or non-zero-diagonal?
Aggregated table: no impact
↔ Detailed table: horizontal effect disappears
No solution for the biases
Estimation results
29
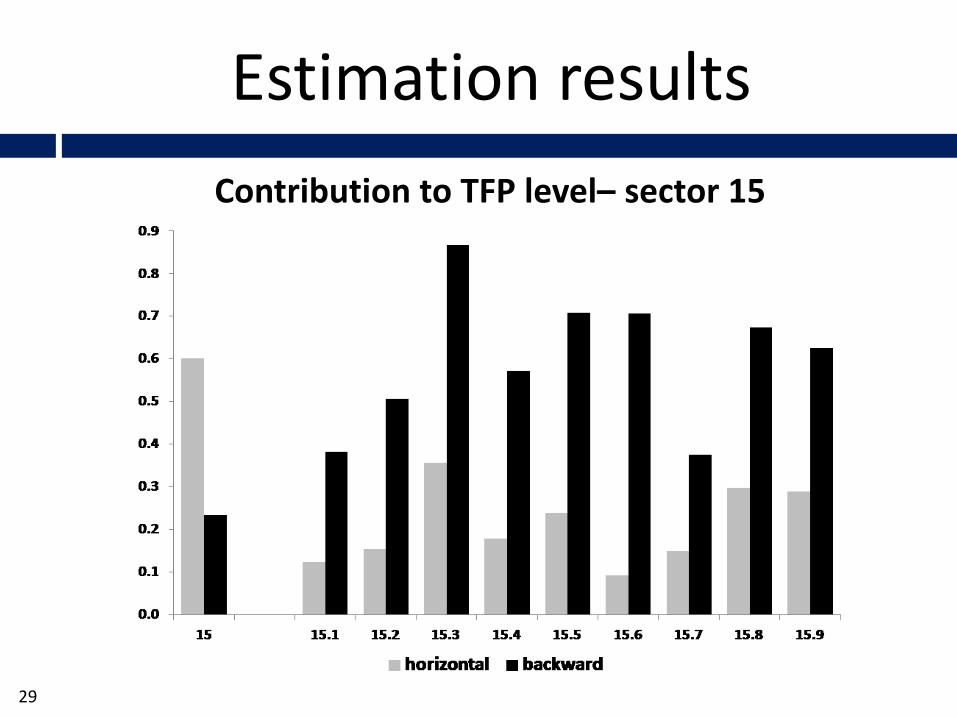
Contribution to TFP level– sector 15
Estimation results
30
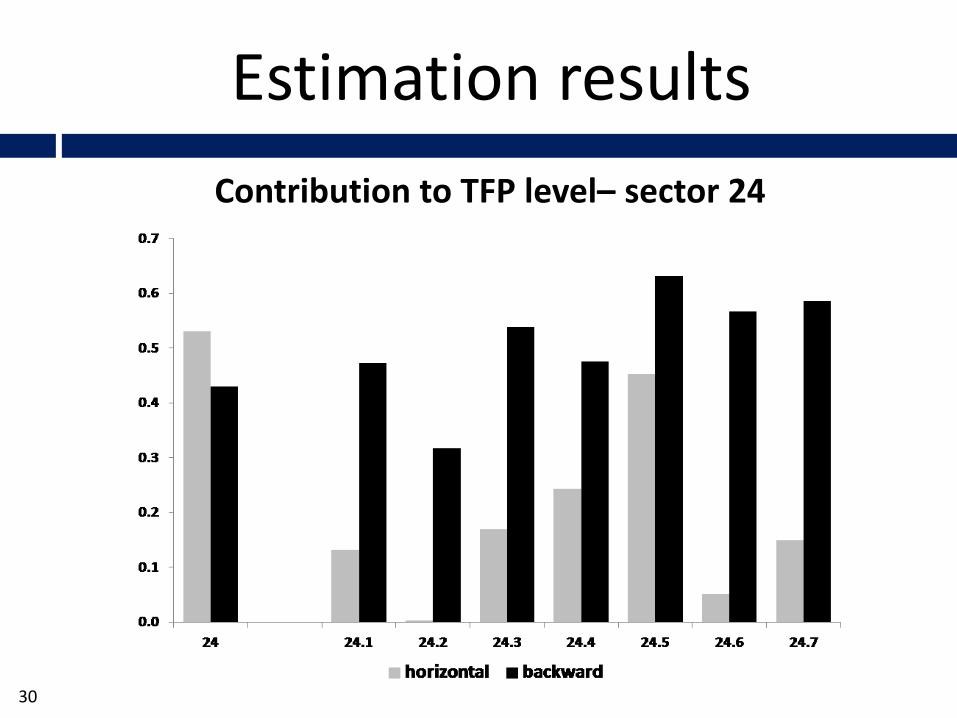
Contribution to TFP level– sector 24

Conclusions
Conclusions
32
Literature: mixed evidence of FDI spillovers
→ channels, determinants, measurement
In this paper:
- level of industry aggregation in IO-tables matters
- zero-diagonal versus non-zero-diagonal definition
In the analysis of FDI spillover effects, use IO-tables with a sufficiently detailed industry classification!