Embed Size (px)
Citation preview
This article was downloaded by: [Pennsylvania State University]On: 14 May 2013, At: 13:41Publisher: RoutledgeInforma Ltd Registered in England and Wales Registered Number: 1072954Registered office: Mortimer House, 37-41 Mortimer Street, London W1T 3JH,UK
DevelopmentalNeuropsychologyPublication details, including instructions forauthors and subscription information:http://www.tandfonline.com/loi/hdvn20
Is it a Fact? Timed ArithmeticPerformance of ChildrenWith Mathematical LearningDisabilities (MLD) Varies as aFunction of How MLD is DefinedMichèle M. M. Mazzocco a b , Kathleen T. Devlin b &Sarah J. McKenney ca Department of Psychiatry and Behavioral Sciences,Johns Hopkins University School of Medicineb Math Skills Development Project, Kennedy KriegerInstitute, Baltimore, Marylandc Department of Behavioral Biology, Johns HopkinsUniversityPublished online: 12 May 2008.
To cite this article: Michèle M. M. Mazzocco , Kathleen T. Devlin & Sarah J. McKenney(2008): Is it a Fact? Timed Arithmetic Performance of Children With MathematicalLearning Disabilities (MLD) Varies as a Function of How MLD is Defined, DevelopmentalNeuropsychology, 33:3, 318-344
To link to this article: http://dx.doi.org/10.1080/87565640801982403
PLEASE SCROLL DOWN FOR ARTICLE
Full terms and conditions of use: http://www.tandfonline.com/page/terms-and-conditions
This article may be used for research, teaching, and private study purposes.Any substantial or systematic reproduction, redistribution, reselling, loan,

sub-licensing, systematic supply, or distribution in any form to anyone isexpressly forbidden.
The publisher does not give any warranty express or implied or make anyrepresentation that the contents will be complete or accurate or up todate. The accuracy of any instructions, formulae, and drug doses should beindependently verified with primary sources. The publisher shall not be liablefor any loss, actions, claims, proceedings, demand, or costs or damageswhatsoever or howsoever caused arising directly or indirectly in connectionwith or arising out of the use of this material.
Dow
nloa
ded
by [
Penn
sylv
ania
Sta
te U
nive
rsity
] at
13:
41 1
4 M
ay 2
013
Is it a Fact? Timed ArithmeticPerformance of Children
With Mathematical Learning Disabilities(MLD) Varies as a Function
of How MLD is Defined
Michèle M. M. MazzoccoDepartment of Psychiatry and Behavioral Sciences
Johns Hopkins University School of MedicineMath Skills Development Project
Kennedy Krieger Institute, Baltimore, Maryland
Kathleen T. DevlinMath Skills Development Project
Kennedy Krieger Institute, Baltimore, Maryland
Sarah J. McKenneyDepartment of Behavioral Biology
Johns Hopkins University
Poor fact retrieval is a frequently reported characteristic of children with mathemati-cal learning disability (MLD). To better understand the nature and specificity of poorfact retrieval in MLD, in the present study, we examined eighth graders’ accuracy ontimed addition and multiplication problems of varying levels of difficulty. We com-pared the performance of 16 children with deficient math achievement (MLD), 19children with below average (but not deficient) math achievement (LA), and 100 typ-ically achieving (TA) children. Children in all three groups made errors. Errors made
DEVELOPMENTAL NEUROPSYCHOLOGY, 33(3), 318–344Copyright © 2008 Taylor & Francis Group, LLCISSN: 8756-5641 print / 1532-6942 onlineDOI: 10.1080/87565640801982403
Correspondence should be addressed to Michèle M. M. Mazzocco, Math Skills Development Pro-ject, Kennedy Krieger Institute, 3825 Greenspring Avenue, Painter Building, Top Floor, Baltimore, MD21211. E-mail: [email protected]
Dow
nloa
ded
by [
Penn
sylv
ania
Sta
te U
nive
rsity
] at
13:
41 1
4 M
ay 2
013
by children in the LA group were more numerous, but comparable in type, to thoseobserved for typically developing children. Errors made by children with MLD weremore numerous still, and included errors that differ qualitatively from those in the LAand TA groups. Thus the way in which performance linked to “math difficulties” dif-fers from that of typically achieving children varies as a function of how we definemath disabilities (MLD vs. LA). Moreover, the frequency and types of errors madeby individuals varied within the MLD group, highlighting group heterogeneity evenwhen using strict criteria to define this group of children. Finally, the types of errorsmade by children with MLD reflect reliance on processes other than retrieval to solvethese alleged “math facts.”
Inefficient arithmetic computations, particularly poor fact retrieval, are among themost frequently reported characteristics of children with mathematical learningdisability (MLD; Geary & Brown, 1991). (Although researchers use differentterms such as “math disability” or “math difficulties” to describe children whostruggle with mathematics, herein we use only the term “MLD” for all referencesto these groups of children.) More than twenty years ago, Russell and Ginsburg(1984) described school age children with MLD as having “unusually severe diffi-culty in recalling common addition math facts” (p. 217). If we are to characterizechildren with MLD as having poor fact retrieval skills, it is necessary to identifywhether such performance is characteristic of most or only some children withMLD, and to what extent poor retrieval implicates MLD versus other difficulties inmathematics. Toward this goal, in the present study we considered two potentialoutcomes: that the errors made by children with MLD, during timed math compu-tations, are more frequent and yet comparable in quality to errors made by theirpeers; or that unique types of errors made by children with MLD implicate numeri-cal computational difficulties beyond mere fact retrieval inefficiency.
A secondary aim of this study relates to the construct of MLD—specifically,how performance on timed computational difficulties varies as a function of howstrictly MLD is defined. In the absence of a consensus definition of MLD, werelied on the two classifications of MLD established earlier in our research(Mazzocco & Myers, 2003; Murphy, Mazzocco, Hanich, & Early, 2007). Our strictclassification of MLD reflects consistent below average performance on a stan-dardized test of mathematics achievement. Our more lenient classification reflectslow achievement (LA) scores that exceed the deficient range.
These two mutually exclusive groups of children are often combined as one“MLD” group in research, but we (and others) have demonstrated important differ-ences between these two groups. Most published comparisons of MLD and LAgroups have, to date, focused on primary school-age children. In our earlier work,we found that from kindergarten through grade 3, children with MLD (vs. LA) notonly have lower math achievement scores (by definition), but also show divergingrates of growth in mathematics achievement during late primary school, and less
TIMED ARITHMETIC PERFORMANCE OF CHILDREN WITH MLD 319
Dow
nloa
ded
by [
Penn
sylv
ania
Sta
te U
nive
rsity
] at
13:
41 1
4 M
ay 2
013
efficient performance on working memory tasks (Murphy et al., 2007). Geary andcolleagues expanded on these findings; they demonstrated that working memorydeficits appear to contribute to the mathematical impairments of kindergartnerswith MLD, and that math difficulties of kindergartners with low achievement canbe explained by numeric processing deficits, including difficulty with fact retrieval(Geary, Hoard, Byrd-Craven, Nugent, & Numtee, 2007). [Additional comparisonsof MLD vs. LA groups appear elsewhere in this special issue (Geary, Hoard, Nu-gent, & Byrd-Craven, 2008/this issue; Chong & Siegel, 2008/this issue)]. In thepresent study, we focus exclusively on timed math performance during tasks de-signed to elicit fact retrieval strategies, and we focus on middle-school children.
Solving “Math Fact” Problems
Before evaluating math fact performance among children with MLD or LA, wemust consider the evidence that fact retrieval difficulties are not unique to MLD.Retrieval errors occur among even mathematically competent adults (as reviewedby Domahs & Delazer, 2005). Moreover, Jordan and colleagues reported that notall primary school age children with poor math fact retrieval necessarily haveMLD (Jordan, Hanich, & Kaplan, 2003). It is more likely that the nature of mathfact errors, rather than their mere presence, differentiates children with MLD fromtheir mathematically successful peers. The extent to which this alternative is sup-ported may depend on whether poor math “retrieval” performance is slow (not re-trieved) but accurate, quickly retrieved but error-prone, or effortful and inaccurate.The third of these alternatives may reflect conceptual rather than retrieval difficul-ties, such as when inaccurate responses are conceptually impossible (e.g., for 7 × 7= 271). Such out of range errors may also reflect the nature of stored “facts” if in-deed such errors are consistently and quickly produced (i.e., retrieved).
These alternatives implicate varying routes to solving “math fact” problems. In-deed, the once-held assumption that math facts are solved only by retrieval pro-cesses has been countered by evidence that multiple strategies may be used in addi-tion to retrieval (e.g., LeFevre et al., 1996), as seen in performance by typicallydeveloping children (e.g., Siegler, 1988) and educated adults (Geary & Wiley,1991). Performance accuracy, response types, and types of errors made during sin-gle-digit addition and multiplication may shed light on the overt and covert cogni-tive strategies used to solve math fact items. For instance, Geary has demonstratedthat children with MLD rely on finger counting strategies throughout elementaryschool, even at fifth grade, when typically developing children are more likely torely on fact retrieval strategies (Geary, Hoard, Byrd-Craven, & DeSoto, 2004). Al-though it is not our objective to identify a single model that best explains math factperformance in children with MLD, we do aim to address performance differenceson timed arithmetic problems across middle school age children with MLD, lowachievement, or typical achievement in mathematics.
320 MAZZOCCO, DEVLIN, McKENNEY
Dow
nloa
ded
by [
Penn
sylv
ania
Sta
te U
nive
rsity
] at
13:
41 1
4 M
ay 2
013
The Present Study
To better understand how “poor fact retrieval” characterizes MLD, in the presentstudy we examined children’s accuracy on timed arithmetic tests that includedproblems of varying levels of difficulty. Math fact instruction typically begins bylate primary school; to avoid examining math fact performance at an age when re-trieval skills are just emerging, we instead focused on the end of the middle schoolyears, eighth grade, when it was reasonable to expect that math facts should bewell established. Addition and multiplication problems were presented in sets ofeasy or hard problems. Easy problems were designed to elicit use of retrievalskills, and included problems identified in the literature as associated with higheraccuracy and shorter latencies (as reviewed by Zbrodoff, Logan, & Campbell,2005). Although there is some debate regarding the nature and influences on theproblem size effect in general, easy problems were those with smaller operands,the operand “5,” or duplicate operands (5 + 5, 3 × 3). Sets of hard problems weredesigned to elicit mental computation (along with or instead of retrieval), and in-cluded larger single digit operands and operands up to 13. We measured the re-sponse times needed to complete pages of easy versus hard arithmetic tasks and thenumber of items completed within the fixed time allotted per page, as indicators ofcalculation automaticity. We recorded any observable finger counting used to gen-erate responses, as an indicator of not relying exclusively on retrieval processes.Finally, we evaluated the types of errors made, to categorize performance patterns.
We predicted that children at all levels of mathematical ability would makesome errors on timed arithmetic, but that the types of errors made would differacross groups. Based on the frequency of operand errors in the general popula-tion (Campbell, 1997), we predicted that operand errors (e.g., 4 × 6 = 18; 4 × 6 =28) would be the most common error made across all groups. However, whereastypical operand errors in adults involve solutions close to the correct response(Domahs, Delazer, & Nuerk, 2006), we also predicted that errors distant from thecorrect solution would occur primarily among children with MLD relative to theirpeers, suggestive of atypical numerical processing and conceptual weakness ver-sus simply slower processing. Likewise, we predicted that children with MLDwould make more “decade-inconsistent” errors than their peers, based on the re-cent work of Domahs and Delazer (2005). Domahs and Delazer reported that mostof adults’ operand errors are decade-consistent, such that the decade of the incor-rect solution matches the decade of the correct solution (e.g., 5 × 4 = 24). Finally,we predicted that performance profiles of children with low math achievementwould show slower, but not atypical, responses relative to typically developingchildren, suggestive of quantitative versus qualitative differences in their develop-ment of math skills.
Aside from the variables summarized earlier, this study was not designed tocontribute to ongoing debates on what constitutes a “math fact.” Instead of contrib-
TIMED ARITHMETIC PERFORMANCE OF CHILDREN WITH MLD 321
Dow
nloa
ded
by [
Penn
sylv
ania
Sta
te U
nive
rsity
] at
13:
41 1
4 M
ay 2
013
uting to this rich and somewhat controversial literature (as reviewed by Zamarian,López-Rolón, & Delazer, 2007), our focus is on performance levels of childrenwhose mathematical difficulties are observable by classroom teachers and othereducators.
METHOD
Participants
Participants were students from a larger, ongoing longitudinal study of mathemati-cal ability and disability from kindergarten through high school, as described else-where in detail (Mazzocco & Myers, 2002). During the first year of the study,seven schools from one large suburban school district agreed to participate in thestudy. These schools represent a diverse range of socioeconomic areas, excludingextremes at the lower and upper ends. All kindergartners attending one of theseschools were invited to enroll; of these, 57% (N = 249) enrolled. Participants in thepresent study were limited to the 161 students still enrolled in the study at eighthgrade.
Materials
Although the present study is focused primarily on data collection during the ninthyear of the longitudinal study, select data from the fourth to seventh years werealso included for the purpose of establishing MLD status, or to obtain an estimateof IQ. A description of these measures follows the overview of the primary mea-sure of interest, the Fast Math Task (FMT).
The Fast Math Task. We developed the FMT for administration during theninth year of the study. It is a timed, individually administered, paper-and-pencilarithmetic task, preceded by a standardized set of instructions. There are 8 testpages in the FMT, presented in a fixed order. On each page, 18 math problems ap-pear in 3 columns of 6. All 18 problems on a given page involve the same operation(addition or multiplication). Each set of 18 problems appears twice (on separatepages), in a different order. Each test page is preceded by an introductory page onwhich only one easy problem appears, as an explicit signal of the operation of theupcoming problem set.
During the FMT, children are instructed to answer each math problem imme-diately, without calculating. Participants are permitted one minute per page, butthey are informed only that they have “a short amount of time” to complete eachpage and that they will be told when to stop. Children are asked to mark itemsthat they are deliberately skipping with an “S,” if they have “no idea” what the
322 MAZZOCCO, DEVLIN, McKENNEY
Dow
nloa
ded
by [
Penn
sylv
ania
Sta
te U
nive
rsity
] at
13:
41 1
4 M
ay 2
013
answer is. As such, retrieval is requested, although rapid mental calculations arealso likely to occur. Once the instructions are presented, children are asked to re-call the instructions, and are also given three prompts to insure that they have un-derstood the task expectations (e.g., “Are you allowed to change your answer?”).During presentation of an introductory page, the examiner announces the opera-tion that will follow (i.e., “The next set of problems are addition/multiplica-tion”). The examiner records response time (up to one minute) with a handheldstopwatch, held in view of the child to emphasize the timed nature of the task;any observable use of finger counting (including subtle tapping) is recorded onthe examiner’s scoring sheet.
Problems on the FMT are manipulated for three within-group variables: opera-tion (addition, multiplication); difficulty level (easy math facts with operands < 6,operands of 10, duplicate operands, or multiples of 5 or 10); versus hard problemswith operands > 6, including 2 digit operands but excluding duplicate operands ormultiples of 10; and presentation format, with problems either grouped into 3 setsof 6 problems (e.g., multiples of 5, followed by multiples of 10, then followed bymultiples of 3), or presented within a mixed set of these same 18 problems. Thus,there are four sets of 18 problems (easy addition, easy multiplication, hard addi-tion, and hard multiplication) each of which appears twice (once in grouped andonce in mixed formats). The order of the test pages is fixed. The first page (easy,grouped, addition problems) is repeated as the ninth page, in order to establishtest-retest reliability (Pearson r = .83), but responses on this ninth page are omittedfrom primary analyses so as to maintain a fixed number of problems presented pertest variable.
Correlations for each pair of pages in which the same problems appear in mixedversus grouped format are high: Pearson r =.71 (addition) and .79 (multiplication)for easy problems; r =.68 (addition) and .62 (multiplication) for hard problems, allps < .001.
The outcome variables obtained from the FMT were per-page totals for thenumber of items attempted, deliberately skipped, and answered correctly; percentaccuracy; response time; the number of pages on which finger counting strategieswere observed; and both the frequency and types of errors made. (Codes for errortypes are described in the procedures section that follows.)
Woodcock Johnson Revised (WJ–R) Math Calculation Subtest. TheWJ–R (Woodcock & Johnson, 1989) is a widely used standardized test of aca-demic achievement. The Math Calculation subtest of the WJ–R was administeredannually during grades 3 through 6. This untimed, paper-and-pencil task involvesall four arithmetic operations, and includes only direct calculations (e.g., no wordproblems or other applied problems are included). To complete this subtest, thechild is presented with a test booklet containing a range of problems, presented inorder of increasing difficulty. The child is encouraged to solve as many problems
TIMED ARITHMETIC PERFORMANCE OF CHILDREN WITH MLD 323
Dow
nloa
ded
by [
Penn
sylv
ania
Sta
te U
nive
rsity
] at
13:
41 1
4 M
ay 2
013
as possible, and is provided with scratch paper. Testing is stopped once the childfails six consecutive problems. The number of correct responses is converted to anage-referenced standard score based on a mean of 100 (SD = 15).
Note that although a newer version of the WJ–R, the WJ–III, became availableduring the course of the longitudinal study, we maintained use of the WJ–Rthroughout the study for consistency. Thus, WJ–R scores were clinically unreli-able as a population standard score, prompting our use of sample-based percentilesto establish MLD criteria (discussed subsequently).
Wechsler Abbreviated Scale of Intelligence (WASI). The WASI (Wechs-ler, 1999) is a widely used standardized test of general intelligence, normed for usewith individuals ages 6 to 89 years. It includes 2 verbal and 2 nonverbal subtests,which combined yield an age-referenced standard score based on a mean of 100(SD = 15). We administered the WASI one time, during the fourth year of the longi-tudinal study (at third grade). The WASI was not repeated in subsequent years, inview of good stability of Wechsler scores over time (Canivez & Watkins, 1998).We included WASI scores in the present study as a covariate, in view of reportedassociations between IQ scores and math achievement (e.g., Neisser et al., 1996).
Procedure
Each child was tested individually, by one female examiner, during each year ofthe longitudinal study. Testing was carried out at the child’s school, the laboratoryof the first author, or at a location in the child’s community (e.g., a reserved room ata public library). In each case, all testing was carried out confidentially in a privateroom. The tests described earlier were administered as part of a larger test batterythat varied over the years of the study. Within each year, the order of test presenta-tion was fixed, although this order was violated in cases out of the examiner’s con-trol (e.g., fire drill, child becoming ill).
Establishing MLD Status
Classification of MLD status was contingent on WJ–R Math Calculation scorescollected annually from third to sixth grades. A given classification was assigned iftwo or more of the four scores fell within the designated ranges described below,provided that any scores falling outside these ranges were within the 95% confi-dence interval for that range. A classification of MLD was assigned if the child’sWJ–R Math Calculation scores fell below approximately the 10th percentile ofscores based on the study sample. LA status was assigned if two or more of theWJ–R scores fell within approximately the 11th to 25th percentile. Children wereclassified as having typical mathematics achievement if their 3rd to 6th gradeWJ–R standard scores exceeded 100 during at least 2 years and never fell within
324 MAZZOCCO, DEVLIN, McKENNEY
Dow
nloa
ded
by [
Penn
sylv
ania
Sta
te U
nive
rsity
] at
13:
41 1
4 M
ay 2
013
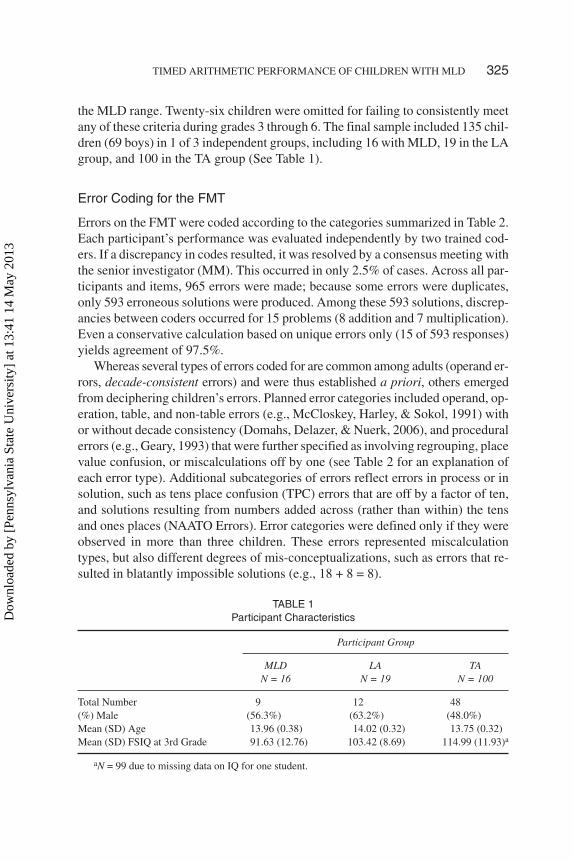
the MLD range. Twenty-six children were omitted for failing to consistently meetany of these criteria during grades 3 through 6. The final sample included 135 chil-dren (69 boys) in 1 of 3 independent groups, including 16 with MLD, 19 in the LAgroup, and 100 in the TA group (See Table 1).
Error Coding for the FMT
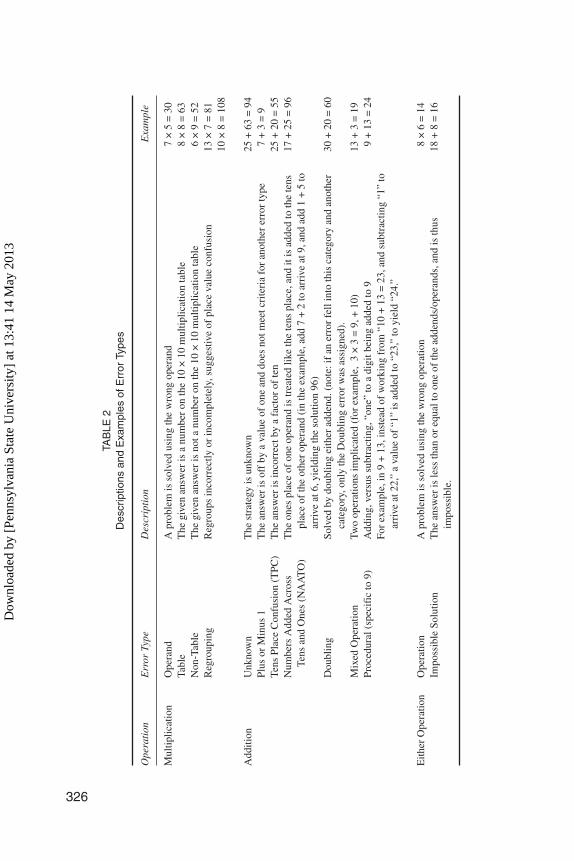
Errors on the FMT were coded according to the categories summarized in Table 2.Each participant’s performance was evaluated independently by two trained cod-ers. If a discrepancy in codes resulted, it was resolved by a consensus meeting withthe senior investigator (MM). This occurred in only 2.5% of cases. Across all par-ticipants and items, 965 errors were made; because some errors were duplicates,only 593 erroneous solutions were produced. Among these 593 solutions, discrep-ancies between coders occurred for 15 problems (8 addition and 7 multiplication).Even a conservative calculation based on unique errors only (15 of 593 responses)yields agreement of 97.5%.
Whereas several types of errors coded for are common among adults (operand er-rors, decade-consistent errors) and were thus established a priori, others emergedfrom deciphering children’s errors. Planned error categories included operand, op-eration, table, and non-table errors (e.g., McCloskey, Harley, & Sokol, 1991) withor without decade consistency (Domahs, Delazer, & Nuerk, 2006), and proceduralerrors (e.g., Geary, 1993) that were further specified as involving regrouping, placevalue confusion, or miscalculations off by one (see Table 2 for an explanation ofeach error type). Additional subcategories of errors reflect errors in process or insolution, such as tens place confusion (TPC) errors that are off by a factor of ten,and solutions resulting from numbers added across (rather than within) the tensand ones places (NAATO Errors). Error categories were defined only if they wereobserved in more than three children. These errors represented miscalculationtypes, but also different degrees of mis-conceptualizations, such as errors that re-sulted in blatantly impossible solutions (e.g., 18 + 8 = 8).
TIMED ARITHMETIC PERFORMANCE OF CHILDREN WITH MLD 325
TABLE 1Participant Characteristics
Participant Group
MLDN = 16
LAN = 19
TAN = 100
Total Number(%) Male
9(56.3%)
12(63.2%)
48(48.0%)
Mean (SD) Age 13.96 (0.38) 14.02 (0.32) 13.75 (0.32)Mean (SD) FSIQ at 3rd Grade 91.63 (12.76) 103.42 (8.69) 114.99 (11.93)a
aN = 99 due to missing data on IQ for one student.
Dow
nloa
ded
by [
Penn
sylv
ania
Sta
te U
nive
rsity
] at
13:
41 1
4 M
ay 2
013
326
TAB
LE2
Des
crip
tions
and
Exa
mpl
esof
Err
orTy
pes
Ope
rati
onE
rror
Type
Des
crip
tion
Exa
mpl
e
Mul
tiplic
atio
nO
pera
ndA
prob
lem
isso
lved
usin
gth
ew
rong
oper
and
7×
5=
30Ta
ble
The
give
nan
swer
isa
num
ber
onth
e10
×10
mul
tiplic
atio
nta
ble
8×
8=
63N
on-T
able
The
give
nan
swer
isno
tanu
mbe
ron
the
10×
10m
ultip
licat
ion
tabl
e6
×9
=52
Reg
roup
ing
Reg
roup
sin
corr
ectly
orin
com
plet
ely,
sugg
estiv
eof
plac
eva
lue
conf
usio
n13
×7
=81
10×
8=
108
Add
ition
Unk
now
nT
hest
rate
gyis
unkn
own
25+
63=
94Pl
usor
Min
us1
The
answ
eris
off
bya
valu
eof
one
and
does
notm
eetc
rite
ria
for
anot
her
erro
rty
pe7
+3
=9
Tens
Plac
eC
onfu
sion
(TPC
)T
hean
swer
isin
corr
ectb
ya
fact
orof
ten
25+
20=
55N
umbe
rsA
dded
Acr
oss
Tens
and
One
s(N
AA
TO
)T
heon
espl
ace
ofon
eop
eran
dis
trea
ted
like
the
tens
plac
e,an
dit
isad
ded
toth
ete
nspl
ace
ofth
eot
her
oper
and
(in
the
exam
ple,
add
7+
2to
arri
veat
9,an
dad
d1
+5
toar
rive
at6,
yiel
ding
the
solu
tion
96)
17+
25=
96
Dou
blin
gSo
lved
bydo
ublin
gei
ther
adde
nd.(
note
:if
aner
ror
fell
into
this
cate
gory
and
anot
her
cate
gory
,onl
yth
eD
oubl
ing
erro
rw
asas
sign
ed).
30+
20=
60
Mix
edO
pera
tion
Two
oper
atio
nsim
plic
ated
(for
exam
ple,
3×
3=
9,+
10)
13+
3=
19Pr
oced
ural
(spe
cifi
cto
9)A
ddin
g,ve
rsus
subt
ract
ing,
“one
”to
adi
gitb
eing
adde
dto
9Fo
rex
ampl
e,in
9+
13,i
nste
adof
wor
king
from
“10
+13
=23
,and
subt
ract
ing
“1”
toar
rive
at22
,”a
valu
eof
“1”
isad
ded
to“2
3,”
toyi
eld
“24.
”
9+
13=
24
Eith
erO
pera
tion
Ope
ratio
nA
prob
lem
isso
lved
usin
gth
ew
rong
oper
atio
n8
×6
=14
Impo
ssib
leSo
lutio
nT
hean
swer
isle
ssth
anor
equa
lto
one
ofth
ead
dend
s/op
eran
ds,a
ndis
thus
impo
ssib
le.
18+
8=
16
Dow
nloa
ded
by [
Penn
sylv
ania
Sta
te U
nive
rsity
] at
13:
41 1
4 M
ay 2
013
All data were entered twice in separate Excel datasets that were subsequentlysubtracted from each other until all discrepancies in data entry were resolvedagainst hard copies of the data.
Analyses
Analyses of variance were planned for each outcome variable, with FSIQ as acovariate to assess possible main effects and interactions with MLD status. Foreach ANCOVA, we used a 3 (MLD Status: MLD, LA, and TA) × 2 (Operation: Ad-dition vs. Multiplication) × 2 (Difficulty: Easy vs. Difficult) × 2 (Format: Groupedvs. Mixed) model, with repeated measures on all but the first variable. Posthoccomparisons were carried out with Fishers LSD. The statistics reported from thesemodels reflect effects remaining when FSIQ is included as a covariate. However,means and standard deviations reported in the Results section and tables are actual,not weighted, values.
The relative frequency of error types was assessed with chi squares, or withFisher’s Exact statistics in cases where expected cell values were <5.
RESULTS
Preliminary Analyses
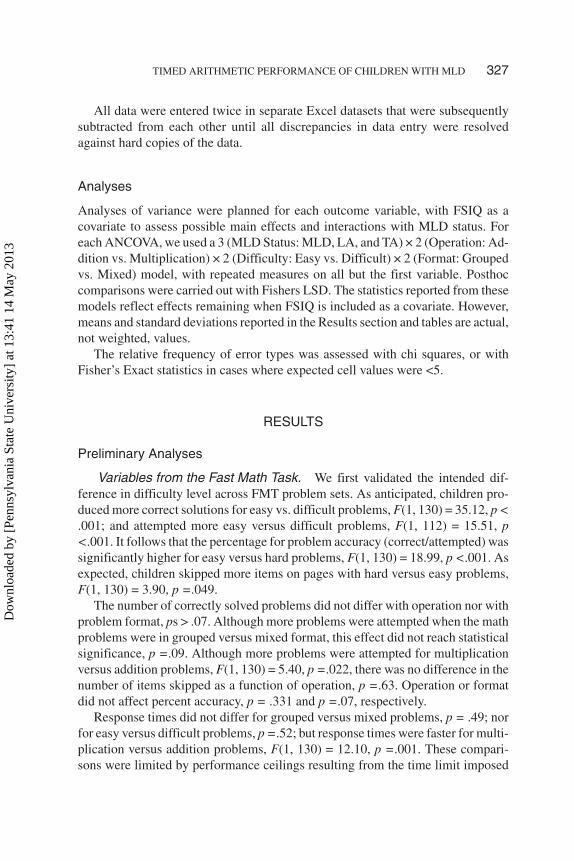
Variables from the Fast Math Task. We first validated the intended dif-ference in difficulty level across FMT problem sets. As anticipated, children pro-duced more correct solutions for easy vs. difficult problems, F(1, 130) = 35.12, p <.001; and attempted more easy versus difficult problems, F(1, 112) = 15.51, p<.001. It follows that the percentage for problem accuracy (correct/attempted) wassignificantly higher for easy versus hard problems, F(1, 130) = 18.99, p <.001. Asexpected, children skipped more items on pages with hard versus easy problems,F(1, 130) = 3.90, p =.049.
The number of correctly solved problems did not differ with operation nor withproblem format, ps > .07. Although more problems were attempted when the mathproblems were in grouped versus mixed format, this effect did not reach statisticalsignificance, p =.09. Although more problems were attempted for multiplicationversus addition problems, F(1, 130) = 5.40, p =.022, there was no difference in thenumber of items skipped as a function of operation, p =.63. Operation or formatdid not affect percent accuracy, p = .331 and p =.07, respectively.
Response times did not differ for grouped versus mixed problems, p = .49; norfor easy versus difficult problems, p =.52; but response times were faster for multi-plication versus addition problems, F(1, 130) = 12.10, p =.001. These compari-sons were limited by performance ceilings resulting from the time limit imposed
TIMED ARITHMETIC PERFORMANCE OF CHILDREN WITH MLD 327
Dow
nloa
ded
by [
Penn
sylv
ania
Sta
te U
nive
rsity
] at
13:
41 1
4 M
ay 2
013
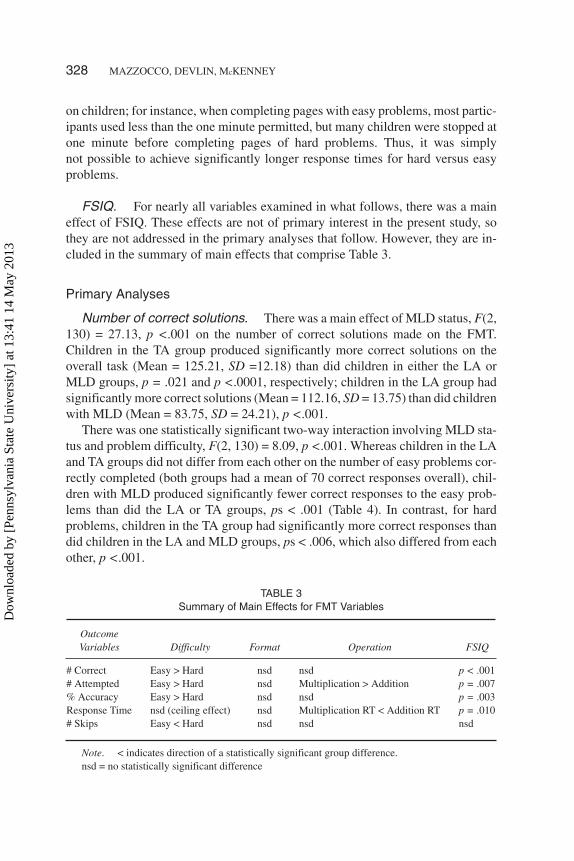
on children; for instance, when completing pages with easy problems, most partic-ipants used less than the one minute permitted, but many children were stopped atone minute before completing pages of hard problems. Thus, it was simplynot possible to achieve significantly longer response times for hard versus easyproblems.
FSIQ. For nearly all variables examined in what follows, there was a maineffect of FSIQ. These effects are not of primary interest in the present study, sothey are not addressed in the primary analyses that follow. However, they are in-cluded in the summary of main effects that comprise Table 3.
Primary Analyses
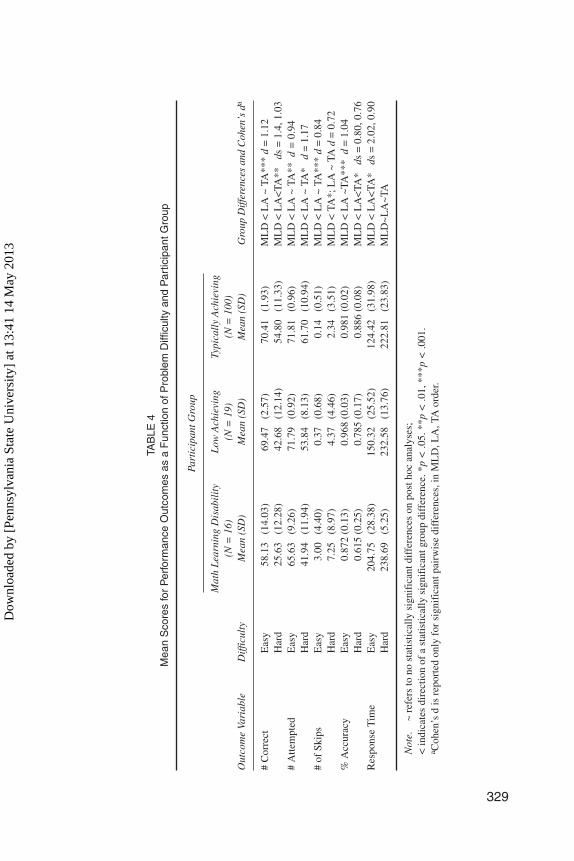
Number of correct solutions. There was a main effect of MLD status, F(2,130) = 27.13, p <.001 on the number of correct solutions made on the FMT.Children in the TA group produced significantly more correct solutions on theoverall task (Mean = 125.21, SD =12.18) than did children in either the LA orMLD groups, p = .021 and p <.0001, respectively; children in the LA group hadsignificantly more correct solutions (Mean = 112.16, SD = 13.75) than did childrenwith MLD (Mean = 83.75, SD = 24.21), p <.001.
There was one statistically significant two-way interaction involving MLD sta-tus and problem difficulty, F(2, 130) = 8.09, p <.001. Whereas children in the LAand TA groups did not differ from each other on the number of easy problems cor-rectly completed (both groups had a mean of 70 correct responses overall), chil-dren with MLD produced significantly fewer correct responses to the easy prob-lems than did the LA or TA groups, ps < .001 (Table 4). In contrast, for hardproblems, children in the TA group had significantly more correct responses thandid children in the LA and MLD groups, ps < .006, which also differed from eachother, p <.001.
328 MAZZOCCO, DEVLIN, McKENNEY
TABLE 3Summary of Main Effects for FMT Variables
OutcomeVariables Difficulty Format Operation FSIQ
# Correct Easy > Hard nsd nsd p < .001# Attempted Easy > Hard nsd Multiplication > Addition p = .007% Accuracy Easy > Hard nsd nsd p = .003Response Time nsd (ceiling effect) nsd Multiplication RT < Addition RT p = .010# Skips Easy < Hard nsd nsd nsd
Note. < indicates direction of a statistically significant group difference.nsd = no statistically significant difference
Dow
nloa
ded
by [
Penn
sylv
ania
Sta
te U
nive
rsity
] at
13:
41 1
4 M
ay 2
013
329
TAB
LE4
Mea
nS
core
sfo
rP
erfo
rman
ceO
utco
mes
asa
Fun
ctio
nof
Pro
blem
Diff
icul
tyan
dP
artic
ipan
tGro
up
Part
icip
antG
roup
Out
com
eVa
riab
leD
iffic
ulty
Mat
hL
earn
ing
Dis
abil
ity
(N=
16)
Mea
n(S
D)
Low
Ach
ievi
ng(N
=19
)M
ean
(SD
)
Typi
call
yA
chie
ving
(N=
100)
Mea
n(S
D)
Gro
upD
iffer
ence
san
dC
ohen
’sda
#C
orre
ctE
asy
58.1
3(1
4.03
)69
.47
(2.5
7)70
.41
(1.9
3)M
LD
<L
A~
TA**
*d
=1.
12H
ard
25.6
3(1
2.28
)42
.68
(12.
14)
54.8
0(1
1.33
)M
LD
<L
A<
TA**
ds=
1.4,
1.03
#A
ttem
pted
Eas
y65
.63
(9.2
6)71
.79
(0.9
2)71
.81
(0.9
6)M
LD
<L
A~
TA**
d=
0.94
Har
d41
.94
(11.
94)
53.8
4(8
.13)
61.7
0(1
0.94
)M
LD
<L
A~
TA*
d=
1.17
#of
Skip
sE
asy
3.00
(4.4
0)0.
37(0
.68)
0.14
(0.5
1)M
LD
<L
A~
TA**
*d
=0.
84H
ard
7.25
(8.9
7)4.
37(4
.46)
2.34
(3.5
1)M
LD
<TA
*;L
A~
TAd
=0.
72%
Acc
urac
yE
asy
0.87
2(0
.13)
0.96
8(0
.03)
0.98
1(0
.02)
ML
D<
LA
~TA
***
d=
1.04
Har
d0.
615
(0.2
5)0.
785
(0.1
7)0.
886
(0.0
8)M
LD
<L
A<
TA*
ds=
0.80
,0.7
6R
espo
nse
Tim
eE
asy
204.
75(2
8.38
)15
0.32
(25.
52)
124.
42(3
1.98
)M
LD
<L
A<
TA*
ds=
2.02
,0.9
0H
ard
238.
69(5
.25)
232.
58(1
3.76
)22
2.81
(23.
83)
ML
D~L
A~T
A
Not
e.~
refe
rsto
nost
atis
tical
lysi
gnif
ican
tdif
fere
nces
onpo
stho
can
alys
es;
<in
dica
tes
dire
ctio
nof
ast
atis
tical
lysi
gnif
ican
tgro
updi
ffer
ence
.*p
<.0
5.**
p<
.01,
***p
<.0
01.
a Coh
en’s
dis
repo
rted
only
for
sign
ific
antp
airw
ise
diff
eren
ces,
inM
LD
,LA
,TA
orde
r.
Dow
nloa
ded
by [
Penn
sylv
ania
Sta
te U
nive
rsity
] at
13:
41 1
4 M
ay 2
013
Number of items attempted. It was necessary to determine whether groupdifferences in the number of correct solutions simply reflected group differences inthe number of items attempted. The results from these analyses were similar, butnot identical, to those for the analyses described above. There was a main effect ofMLD status on the number of items attempted, F(2, 130) = 14.15, p <.001.Children in the TA and LA groups did not differ from each other; but both groupsattempted significantly more problems (Mean = 133.51, SD = 11.31; and Mean =125.63, SD = 8.47, respectively) than did children with MLD, ps < .001 (Mean=107.56, SD = 18.77).
There was an interaction between MLD status and Difficulty, F(2, 130) = 5.12, p<.01, which was an interaction of magnitude. Whereas children in the LA and TAgroups did not differ from each other on the number of easy problems attempted(both groups had a mean of 72 problems attempted overall), children with MLD at-tempted significantly fewer easy problems than did the LA or TA groups, ps<.001.Likewise, for hard problems, children in the LA and TA groups did not differ fromeach other, but both groups attempted more problems than did children with MLD, p=.02, p <.001, respectively. There was a three-way interaction with MLD status, dif-ficulty, and operation, which revealed the different performance patterns for childrenwith versus without MLD. Although children in all three groups attempted compara-ble numbers of multiplication and addition easy problems, the patterns differed forhard problems; the TA and LA groups attempted slightly more multiplication (Mean= 31.07, SD = 6.51; Mean = 28.68, SD = 5.77, respectively) than addition hard prob-lems (Mean =30.63, SD = 5.66; Mean = 25.16, SD = 4.65, respectively), whereaschildren with MLD attempted fewer multiplication (Mean = 20.44, SD = 7.49) thanaddition hard problems (Mean = 21.50, SD = 5.05).
The number of items attempted may have been reduced simply by a highernumber of deliberately skipped items. Indeed, there was a main effect of MLD sta-tus, F(2, 130) = 5.44, p =.005, such that children with MLD skipped more prob-lems (Mean = 10.25, SD = 12.60) than did the LA (Mean = 4.74, SD = 4.87) and TAgroups (Mean = 2.48, SD = 3.60), p =.02 and p =.001 respectively, which did notdiffer from each other, p =.377. There were no interactions with MLD status.
Percent accuracy (correct/attempted). The number of correct responsesproduced on the FMT varied across groups, but this variability was not accountedfor solely by the number of problems attempted or skipped. Yet when consideringonly items attempted, children with MLD correctly solved an average of 26 of the42 hard problems they attempted (62%), whereas children in the TA group cor-rectly solved 55 of the 62 hard problems they attempted (89%). This pattern offindings necessitated the assessment of performance accuracy as a percentage ofproblems attempted.
There was a main effect of MLD status, F(2, 130) = 21.15, p <.001, such thatthe percentage of problems attempted being solved correctly was lower for chil-
330 MAZZOCCO, DEVLIN, McKENNEY
Dow
nloa
ded
by [
Penn
sylv
ania
Sta
te U
nive
rsity
] at
13:
41 1
4 M
ay 2
013
dren with MLD (62%) than for children in both the LA and TA groups, ps < .001;the LA and TA groups did not differ from each other, (79 vs. 89%), p =.066.
However, there were several significant interactions between MLD, indicatingthat the relative differences in performance accuracy varied across conditions.There was a significant interaction between MLD status and both format, F(1, 130)= 3.52, p =.03 and problem difficulty, F(2, 130) = 18.99, p <.001, but not with op-eration, p =.09. Although the MLD group was less accurate than the LA and TAgroups on both the grouped and mixed problems, ps < .001, children in the LAgroup were less accurate than children in the TA group on mixed, p =.042, but notgrouped, problems, p =.459. Similarly, although children with MLD were less ac-curate than children in the LA and TA groups on both the easy and hard problems,ps < .002, children in the LA group were less accurate than children in the TAgroup on hard problems only, p =.027, not the easy problems, p =.81. There was nosignificant interaction with operation, difficulty, and MLD status.
There was an interaction between format, operation, and MLD status, F(2, 130)= 5.36, p =.006, such that percent accuracy did not differ between formats, for ei-ther operation, among children from the TA and LA groups, yet for children withMLD, percent accuracy dropped by an average of 6% from grouped to mixed pre-sentations (Means = 76% to 70%) for multiplication problems only.
Response times. There was a main effect of MLD status, F(2, 130) = 13.61,p <.001, on response time. Children in the TA group were significantly faster thanwere children in either the LA or MLD groups, p = .038 and p <.001, respectively;and children in the LA group were faster than children with MLD, p <.003. More-over, children in the TA group took only about half as much time to complete easyversus hard problems (Table 4), whereas children with MLD took 86% of the timeneeded to complete the hard items when solving the easy problems.
Because ceiling effects prevented the full range of response times needed tocomplete the hard problems from being achieved, children in all three groups hadcomparable total response times on the hard problems. These response times ap-proached the maximum possible time of 240 seconds (Table 4). Whereas at leastsome (38%) of the 100 children in the TA group reached the last problem on mostof the “hard” pages, none of the children in the LA or MLD did so, Fisher’s Exact <.001 and =.001, respectively.
With the exception of the interaction between MLD status and problem diffi-culty (which is confounded by the response time ceiling), there were no additionalinteractions involving MLD status, ps > .12.
Finger counting as an indicator of difficulty. Most of the “easy” problemson the FMT were typical fact retrieval problems (e.g., 4 × 4 = , 4 + 4 = , 5 × 8 =),which presumably would not prompt 8th graders to use finger counting. For thenumber of pages on which observable finger counting was used, a main effect
TIMED ARITHMETIC PERFORMANCE OF CHILDREN WITH MLD 331
Dow
nloa
ded
by [
Penn
sylv
ania
Sta
te U
nive
rsity
] at
13:
41 1
4 M
ay 2
013
emerged for MLD status, F(2, 130) = 10.82, p <.001. Children with MLD used fin-ger counting on more pages (Mean = 1.88 pages, SD = 2.75) than did children inthe LA or TA groups, p = .03, p < .002, respectively; but the difference between theLA and TA groups (0.74 and 0.13, respectively) was not significant, p = .226.
It is possible that only a few children are counting fingers on many pages, suchthat group averages are not meaningful. Thus, we examined the frequency of chil-dren per group who ever used finger counting, and found that 37.5% of childrenwith MLD and 26.3% of children in the LA group used this strategy. These ratesdid not differ from each other, Fisher’s exact = .716, but both exceeded the fre-quency observed for the TA group (7%), Fisher’s exact ps = .003 and .023, for theMLD and LA groups, respectively. These results held when analyses were limitedto pages with hard problems, multiplication, or addition. When we limit the com-parison to pages with easy problems, only 11 of the 135 study participants everused this strategy, including only 1 child (1%) in the TA group, 4 (21.1%) childrenin the LA group, and 6 (37.5%) with MLD. Rates did not differ between the LAand MLD group, Fisher’s exact = .45, but did differ for each of these groups rela-tive to the TA group, Fisher’s exact ps < .003.
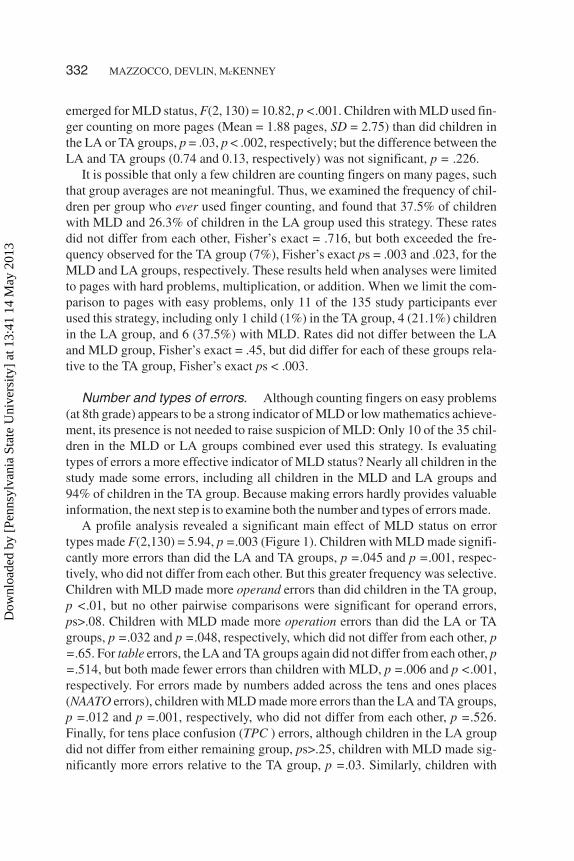
Number and types of errors. Although counting fingers on easy problems(at 8th grade) appears to be a strong indicator of MLD or low mathematics achieve-ment, its presence is not needed to raise suspicion of MLD: Only 10 of the 35 chil-dren in the MLD or LA groups combined ever used this strategy. Is evaluatingtypes of errors a more effective indicator of MLD status? Nearly all children in thestudy made some errors, including all children in the MLD and LA groups and94% of children in the TA group. Because making errors hardly provides valuableinformation, the next step is to examine both the number and types of errors made.
A profile analysis revealed a significant main effect of MLD status on errortypes made F(2,130) = 5.94, p =.003 (Figure 1). Children with MLD made signifi-cantly more errors than did the LA and TA groups, p =.045 and p =.001, respec-tively, who did not differ from each other. But this greater frequency was selective.Children with MLD made more operand errors than did children in the TA group,p <.01, but no other pairwise comparisons were significant for operand errors,ps>.08. Children with MLD made more operation errors than did the LA or TAgroups, p =.032 and p =.048, respectively, which did not differ from each other, p=.65. For table errors, the LA and TA groups again did not differ from each other, p=.514, but both made fewer errors than children with MLD, p =.006 and p <.001,respectively. For errors made by numbers added across the tens and ones places(NAATO errors), children with MLD made more errors than the LA and TA groups,p =.012 and p =.001, respectively, who did not differ from each other, p =.526.Finally, for tens place confusion (TPC ) errors, although children in the LA groupdid not differ from either remaining group, ps>.25, children with MLD made sig-nificantly more errors relative to the TA group, p =.03. Similarly, children with
332 MAZZOCCO, DEVLIN, McKENNEY
Dow
nloa
ded
by [
Penn
sylv
ania
Sta
te U
nive
rsity
] at
13:
41 1
4 M
ay 2
013
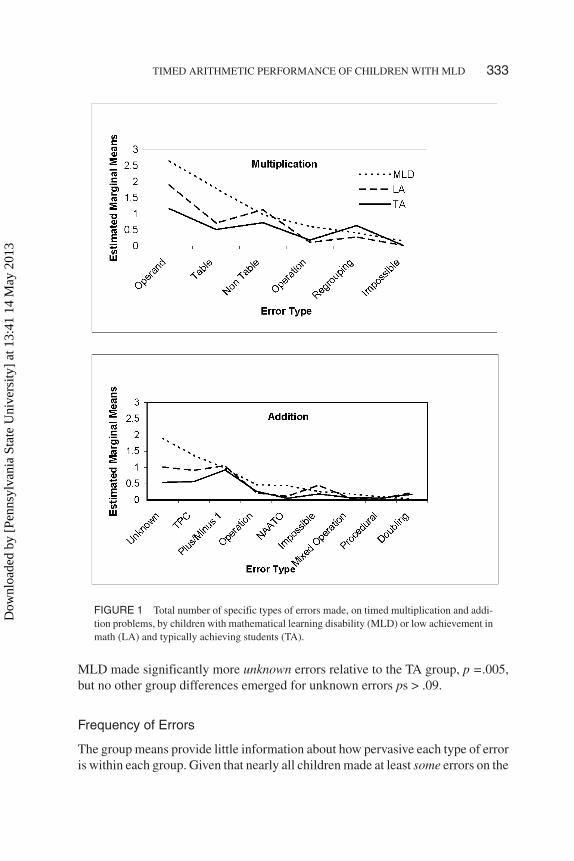
MLD made significantly more unknown errors relative to the TA group, p =.005,but no other group differences emerged for unknown errors ps > .09.
Frequency of Errors
The group means provide little information about how pervasive each type of erroris within each group. Given that nearly all children made at least some errors on the
TIMED ARITHMETIC PERFORMANCE OF CHILDREN WITH MLD 333
FIGURE 1 Total number of specific types of errors made, on timed multiplication and addi-tion problems, by children with mathematical learning disability (MLD) or low achievement inmath (LA) and typically achieving students (TA).
Dow
nloa
ded
by [
Penn
sylv
ania
Sta
te U
nive
rsity
] at
13:
41 1
4 M
ay 2
013
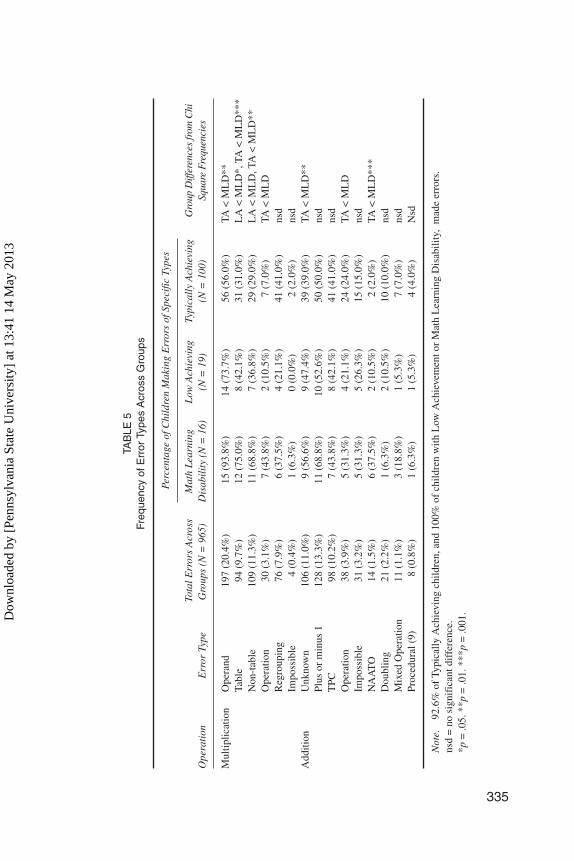
math task, it was possible that no such group differences would emerge for specificerror types. Using Chi square tests, we examined whether the percentage of chil-dren making specific types of errors varied across groups. Fisher exact tests wereused for 2 × 2 post hoc comparisons. The results, which are summarized in Table 5,reflect more errors made by children with versus without MLD, for some, but notall, error types. Differences were greatest for errors that commonly occur in thegeneral population (such as operand and operation errors) and errors potentiallyreflecting conceptual weakness (such as the NAATO errors described in Table 2).
Decade-Consistent and Decade-Inconsistent Errors
The most common error to occur in all three groups was the operand error made onmultiplication. Although operand errors occur relatively often, Domahs et al.(2006) have recently demonstrated that most (~66%) of adults’ operand errors aredecade-consistent, such that the decade of the incorrect solution matches the de-cade of the correct solution (e.g., 5 × 4 = 24). When we examined the ratio of de-cade-consistent errors among participants in our study, relative to the number ofoperand errors they made overall (and limited to problems for which a decade-con-sistent operand error was possible, such as 5 × 4), we found the mean proportion ofoperand errors that were decade-consistent was lower for children with MLD(29%) than for children in the LA (60%) and TA groups (46%). The overall occur-rence of decade-consistent operand errors was roughly comparable to these indi-vidual ratios (23%, 49%, and 56%, respectively). Although all pairwise compari-sons failed to reach statistical significance (Chi square ps> .08), the rates observedin the LA and TA groups approximate those reported by Domahs and colleagues,whereas the rate for the MLD group did not. Also, the differences between theMLD and LA or TA groups were in the predicted direction.
We calculated the probability of replication of the direction of these findings,using the prep statistic as developed and reported by Killeen (2005a, 2005b, 2005c).Children with MLD produced fewer decade-consistent errors relative to childrenin the LA or TA group. For operand errors, prep values were .78 and .89, for MLDversus TA or LA groups, respectively; therefore, with high probability, the direc-tion of our findings is likely to replicate with participant groups of comparablesize.
Likewise, although table errors on multiplication problems were made by chil-dren in all three groups, the relative frequency of decade-consistent table errorsdiffered across groups. There were far fewer table errors made than operand errors,so it was more meaningful to evaluate the ratio of decade-consistent errors maderelative to the overall number of table errors made per group. Fewer (30%) of the30 table errors made by children with MLD were decade-consistent, relative tochildren in the TA group for whom 33 of 50 (66%) table errors were decade-con-sistent; and relative to children in the LA group, for whom 10 of 14 (71%) table er-
334 MAZZOCCO, DEVLIN, McKENNEY
Dow
nloa
ded
by [
Penn
sylv
ania
Sta
te U
nive
rsity
] at
13:
41 1
4 M
ay 2
013
335
TAB
LE5
Freq
uenc
yof
Err
orTy
pes
Acr
oss
Gro
ups
Perc
enta
geof
Chi
ldre
nM
akin
gE
rror
sof
Spec
ific
Type
s
Ope
rati
onE
rror
Type
Tota
lErr
ors
Acr
oss
Gro
ups
(N=
965)
Mat
hL
earn
ing
Dis
abil
ity
(N=
16)
Low
Ach
ievi
ng(N
=19
)Ty
pica
lly
Ach
ievi
ng(N
=10
0)G
roup
Diff
eren
ces
from
Chi
Squa
reFr
eque
ncie
s
Mul
tiplic
atio
nO
pera
nd19
7(2
0.4%
)15
(93.
8%)
14(7
3.7%
)56
(56.
0%)
TA<
ML
D**
Tabl
e94
(9.7
%)
12(7
5.0%
)8
(42.
1%)
31(3
1.0%
)L
A<
ML
D*,
TA<
ML
D**
*N
on-t
able
109
(11.
3%)
11(6
8.8%
)7
(36.
8%)
29(2
9.0%
)L
A<
ML
D,T
A<
ML
D**
Ope
ratio
n30
(3.1
%)
7(4
3.8%
)2
(10.
5%)
7(7
.0%
)TA
<M
LD
Reg
roup
ing
76(7
.9%
)6
(37.
5%)
4(2
1.1%
)41
(41.
0%)
nsd
Impo
ssib
le4
(0.4
%)
1(6
.3%
)0
(0.0
%)
2(2
.0%
)ns
dA
dditi
onU
nkno
wn
106
(11.
0%)
9(5
6.6%
)9
(47.
4%)
39(3
9.0%
)TA
<M
LD
**Pl
usor
min
us1
128
(13.
3%)
11(6
8.8%
)10
(52.
6%)
50(5
0.0%
)ns
dT
PC98
(10.
2%)
7(4
3.8%
)8
(42.
1%)
41(4
1.0%
)ns
dO
pera
tion
38(3
.9%
)5
(31.
3%)
4(2
1.1%
)24
(24.
0%)
TA<
ML
DIm
poss
ible
31(3
.2%
)5
(31.
3%)
5(2
6.3%
)15
(15.
0%)
nsd
NA
AT
O14
(1.5
%)
6(3
7.5%
)2
(10.
5%)
2(2
.0%
)TA
<M
LD
***
Dou
blin
g21
(2.2
%)
1(6
.3%
)2
(10.
5%)
10(1
0.0%
)ns
dM
ixed
Ope
ratio
n11
(1.1
%)
3(1
8.8%
)1
(5.3
%)
7(7
.0%
)ns
dPr
oced
ural
(9)
8(0
.8%
)1
(6.3
%)
1(5
.3%
)4
(4.0
%)
Nsd
Not
e.92
.6%
ofTy
pica
llyA
chie
ving
child
ren,
and
100%
ofch
ildre
nw
ithL
owA
chie
vem
ento
rM
ath
Lea
rnin
gD
isab
ility
,m
ade
erro
rs.
nsd
=no
sign
ific
antd
iffe
renc
e.*p
=.0
5.**
p=
.01.
***p
=.0
01.Dow
nloa
ded
by [
Penn
sylv
ania
Sta
te U
nive
rsity
] at
13:
41 1
4 M
ay 2
013
rors were decade-consistent. Thus, decade-inconsistent errors (e.g., 7 × 8 = 20)were more common in the MLD group, but these group differences were not statis-tically significant.
DISCUSSION
Is it a fact that children with MLD make an inordinate number of errors on mathfact items? A thorough answer to this question sheds more light on the nature ofMLD than does the simple answer, “yes.” Children with MLD do make more er-rors on mental calculation problems than their peers—including problems consid-ered to elicit fact retrieval processes—but some of their errors differ in nature fromthose of their peers and from each other’s.
Children with low math achievement (LA) make more of the same kinds of er-rors on timed arithmetic tests as do their typically developing peers, who in turnmake plenty of errors— even at eighth grade. In principle, the latter finding is notsurprising in light of the fact that well-educated adults also make math fact errors(e.g., Campbell, 1997; Domahs et al., 2006). How do we know when math fact er-rors implicate MLD?
Performance Profiles Across Groups
Evidence from main effects. Performance on the easy problems differenti-ated children with MLD from children in the LA or TA groups. This pattern heldfor the number of problems attempted, skipped, solved correctly, overall percent-age accuracy, and even response times, suggesting that the “easy” problems are notnecessarily so easy for children . These findings are consistent with earlier reportsof persistent difficulty with math fact items for third graders (Jordan et al., 2003)and fourth graders (Russell & Ginsburg, 1984) with MLD, and supports the claimsthat math fact difficulties persist well beyond the elementary school years for chil-dren with MLD.
Only the hard problems differentiated the LA group from the TA group; the for-mer had less accurate performance than the TA group not attributable to feweritems attempted or more items skipped. Considered together, these findings sug-gest that the three groups examined in this study represent moderately deficient,mildly deficient, and typically developing groups of children whose performanceprofiles differ primarily in severity of poor performance.
Perhaps this three-level distinction is an artifact of how we defined MLD andLA, and that children who perform most poorly on the WJ–R Math Calculationssubtest will also do most poorly on the FMT. But there are important differencesbetween Math Calculations subtest and FMT that challenge this assumption. TheFMT is timed, and Math Calculations is untimed. During the FMT, the child is
336 MAZZOCCO, DEVLIN, McKENNEY
Dow
nloa
ded
by [
Penn
sylv
ania
Sta
te U
nive
rsity
] at
13:
41 1
4 M
ay 2
013
asked to solve problems without calculating, whereas during Math Calculationsthe child is permitted time to solve equations with the use of scratch paper. Finally,the difficulty level of the items appearing in the FMT is well below grade-level ex-pectations for 8th graders (at or below 5th grade level), whereas Math Calculationsitems are presented until a performance ceiling is reached. Therefore, even chil-dren who score well below average on the WJ–R Math calculation subtest at 8thgrade are likely to have sufficient computation skills to complete the problems onthe FMT (but not necessarily under timed conditions).
Interactions: Evidence for qualitative differences between MLD andnon-MLD peers. Lack of retrieval skills does not appear to account for all of thegroup differences, because children in all three groups used retrieval to solve atleast some of the items on the Fast Math Task. For instance, multiplication prob-lems were generally completed more quickly than addition problems, for allgroups of participants. But group differences occurred in other areas.
That children with MLD are faster and more accurate on easy versus hard prob-lems suggests some fact retrieval ability in this group. Moreover, among childrenwith MLD, problem format facilitated performance accuracy (but for multiplica-tion problems only), such that performance accuracy rose when problems weregrouped (76%) versus mixed (70%). This suggests a priming effect indicative ofmental representation of solutions to multiplication problems— an advantage notobserved in the LA or TA groups. However, the lack of difference between presen-tation formats likely resulted from the relatively high performance accuracy re-gardless of format, which was 88% versus 90% for the LA group, and 94% for bothformats for the TA group, for mixed versus grouped formats, respectively.
Children with MLD were faster at completing easy multiplication versus easyaddition problems; but they did not show improved accuracy in multiplicationversus addition problems as was observed in the LA and TA groups. Instead, chil-dren with MLD showed the opposite pattern; unlike their peers who attemptedmore hard multiplication than hard addition problems, children with MLD at-tempted more hard addition than hard multiplication problems. Perhaps childrenin the LA and TA groups relied on rapid retrieval of math facts when decompos-ing some of the difficult problems, whereas children with MLD did not—consis-tent with accounts of weak decomposition skills in children with MLD (Geary etal., 2007).
To summarize from the interactions observed, children in the LA group haveprofiles parallel with those of children in the TA group, albeit with poorer levels ofperformance; and children with MLD have both quantitatively and qualitativelydifferent performance profiles. Nevertheless, children with MLD do appear to relyon retrieval processes even if less often (reflected by more frequent finger countingand longer response times), or less effectively, than their peers.
TIMED ARITHMETIC PERFORMANCE OF CHILDREN WITH MLD 337
Dow
nloa
ded
by [
Penn
sylv
ania
Sta
te U
nive
rsity
] at
13:
41 1
4 M
ay 2
013
Error analyses differentiate children with MLD from their peers. Thedistinction between all three groups is most evident from the error analyses, de-spite that fact that most (96%) participants made common types of errors (such asoperand and operation errors, and decade-consistent errors). Although operand er-rors occurred relatively often in all three groups, decade-consistent errors occurredless frequently among children with MLD, relative to children in the LA and TAgroups and relative to decade-inconsistent errors. The rate of decade-consistent er-rors for the LA and TA groups approximated rates reported for educated adults(Domahs et al., 2006) and accounted for close to or over half of all operand errorsfor which such responses were possible. In contrast, among operand errors madeby children with MLD, a minority of these errors were decade-consistent. De-cade-consistent errors predominated table errors in the LA and TA groups (66%),but accounted for only 30% of table errors made by children with MLD. Onceagain, performance by children with LA—as measured by types of errors made—is more similar to that observed for typically developing children, whereas someerrors made by children with MLD differ qualitatively.
The decade-inconsistent errors made by children with MLD may reflect eitherconceptually misguided procedures or erroneous encoding; regardless, they dem-onstrate a lack of immediately recognizing the improbability of a response given.Children with MLD also produced more of these conceptually flawed solutions,such as NAATO, tens place confusion, and mixed operation errors (for addition);and operation errors on multiplication. These errors often yielded solutions thatwere distant from the correct response. Even errors for which no process could bedetermined (unknowns) were more common among children with MLD. In con-trast, errors reflecting automatic processing or calculations were less frequentamong children with MLD relative to LA and TA groups. These included additionerrors of “doubling” (e.g., 3 + 6 = 12), miscalculations leading to a response off byone (e.g., 12 vs. 11), and multiplication regrouping errors. Although not identical,there were more similarities between the performance profiles of the LA and TAgroups than for either of these groups and the MLD group.
Key Differences Between Children with MLD Versus LowAchievement (LA)
We conclude that a high rate of errors on timed calculations is not a sensitive indexof MLD, although it implicates math difficulty associated with either MLD or lowachievement. These two groups are further differentiated by error types. Childrenwith MLD demonstrate less reliance on automatic processes during mental calcu-lation (more finger counting, fewer errors suggestive of relying on retrieval pro-cesses), and a lack of conceptual mastery (e.g., place value confusion) relative totheir peers. Thus their errors on “retrieval problems” may not always reflect poorretrieval skills per se. Other math deficiencies reported for children with MLD may
338 MAZZOCCO, DEVLIN, McKENNEY
Dow
nloa
ded
by [
Penn
sylv
ania
Sta
te U
nive
rsity
] at
13:
41 1
4 M
ay 2
013
interfere with fact acquisition, such as shorter memory spans for both numbers andletters (Koontz & Berch, 1996), working memory (Geary et al., 2007), phonologi-cal awareness (Hecht, Torgeson, Wagner, & Rashotte, 2001), reading, or other lan-guage skills (Jordan et al., 2003). Jordan demonstrated that fact retrieval deficien-cies in children with MLD are not accounted for by IQ. Likewise, all results in thepresent study emerged when FSIQ was included as a covariate. Future studies mayshed light on the potential cognitive influences on the specific types of errors re-ported in the present study, which may delineate the cognitive mechanisms under-lying MLD and other math difficulties.
The Heterogeneity of MLD
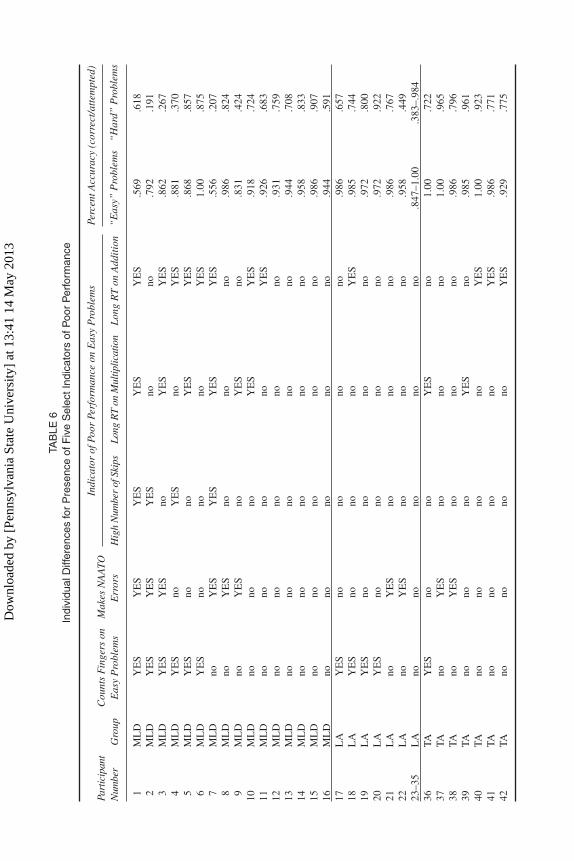
As a group, children with MLD appear to struggle on even easy arithmetic prob-lems, even at eighth grade—suggesting that persistent difficulty with timed arith-metic does not disappear by entry to high school. Performance measures indicatethat children with MLD have as much difficulty on “easy” problems as typicallyachieving students have on more difficult problems, a pattern evident for all fivevariables presented in Table 4. Yet differences among children in our restrictiveMLD group also reflect much heterogeneity (Table 6). First, among the relativelyfew (N = 11) children in the study who ever relied on finger counting to solve easyproblems, most (N = 6) were in the MLD group, yet others were in the LA (N = 4)or TA (N = 1) group; also, not all children in our MLD group used finger counting.Our investigator-defined groups are proxies for what we do not understand wellenough to identify with greater accuracy; perhaps finger-counters in the LA andTA group actually have MLD, despite failing to meet our MLD criteria. Likewise,of the 10 children who made NAATO errors (leading to some of the most concep-tually inappropriate responses to the arithmetic test), 6 were in the MLD group (butthese were not the same 6 children who used finger counting; Table 6).
Additional indices of remarkable difficulty on the FMT were the statistical out-liers (children whose performance exceeded the grand mean by >2 SDs) for thenumber of skipped items and response times on both easy and hard problems (ex-amined separately). None of these indices accurately predicted presence of the oth-ers; none was evident in all 16 children with MLD; not all children with MLDmanifested these difficulties; and only one child (who had MLD) presented withall of the indices. Even the range of performance accuracy per page among chil-dren with MLD was large—from .19 to 1.00. This wider range of accuracy was akey difference between many children with MLD and children in the LA or TAgroup who manifested one or more of these indices of difficulty.
Implications for the Classroom
The variation between children with MLD versus low achievement has implica-tions for remediation and intervention, such as the appropriateness (or inappro-
TIMED ARITHMETIC PERFORMANCE OF CHILDREN WITH MLD 339
Dow
nloa
ded
by [
Penn
sylv
ania
Sta
te U
nive
rsity
] at
13:
41 1
4 M
ay 2
013
TAB
LE6
Indi
vidu
alD
iffer
ence
sfo
rP
rese
nce
ofF
ive
Sel
ectI
ndic
ator
sof
Poo
rP
erfo
rman
ce
Part
icip
ant
Num
ber
Gro
upC
ount
sF
inge
rson
Eas
yP
robl
ems
Mak
esN
AA
TOE
rror
s
Indi
cato
rof
Poor
Perf
orm
ance
onE
asy
Pro
blem
sPe
rcen
tAcc
urac
y(c
orre
ct/a
ttem
pted
)
Hig
hN
umbe
rof
Skip
sLo
ngR
Ton
Mul
tiplic
atio
nL
ong
RT
onA
ddit
ion
“E
asy”
Pro
blem
s“
Har
d”P
robl
ems
1M
LD
YE
SY
ES
YE
SY
ES
YE
S.5
69.6
182
ML
DY
ES
YE
SY
ES
nono
.792
.191
3M
LD
YE
SY
ES
noY
ES
YE
S.8
62.2
674
ML
DY
ES
noY
ES
noY
ES
.881
.370
5M
LD
YE
Sno
noY
ES
YE
S.8
68.8
576
ML
DY
ES
nono
noY
ES
1.00
.875
7M
LD
noY
ES
YE
SY
ES
YE
S.5
56.2
078
ML
Dno
YE
Sno
nono
.986
.824
9M
LD
noY
ES
noY
ES
no.8
31.4
2410
ML
Dno
nono
YE
SY
ES
.918
.724
11M
LD
nono
nono
YE
S.9
26.6
8312
ML
Dno
nono
nono
.931
.759
13M
LD
nono
nono
no.9
44.7
0814
ML
Dno
nono
nono
.958
.833
15M
LD
nono
nono
no.9
86.9
0716
ML
Dno
nono
nono
.944
.591
17L
AY
ES
nono
nono
.986
.657
18L
AY
ES
nono
noY
ES
.985
.744
19L
AY
ES
nono
nono
.972
.800
20L
AY
ES
nono
nono
.972
.922
21L
Ano
YE
Sno
nono
.986
.767
22L
Ano
YE
Sno
nono
.958
.449
23–3
5L
Ano
nono
nono
.847
–1.0
0.3
83–.
984
36TA
YE
Sno
noY
ES
no1.
00.7
2237
TAno
YE
Sno
nono
1.00
.965
38TA
noY
ES
nono
no.9
86.7
9639
TAno
nono
YE
Sno
.985
.961
40TA
nono
nono
YE
S1.
00.9
2341
TAno
nono
noY
ES
.986
.771
42TA
nono
nono
YE
S.9
29.7
75
Dow
nloa
ded
by [
Penn
sylv
ania
Sta
te U
nive
rsity
] at
13:
41 1
4 M
ay 2
013
priateness) of math fact drills for struggling students. In the present study, it wasevident that some children who struggle with mathematics (children with lowachievement) are inefficient, but fairly accurate, on relatively simple arithmeticcalculations. These children generally make more of the same kinds of errors thatwe all may commit at some point in time. Math fact drills may enhance au-tomaticity of accurate retrieval or other procedural skills; but such drills may havedifferent consequences for children with MLD, whose solutions are often off-tar-get or suggestive of procedures that violate simple mathematical problem solvingalgorithms. Possible consequences range from over-learning incorrect “facts,” toaccurate rote performance without conceptual mastery.
Although the conceptually based errors made by children with MLD should notbe ignored, it is insufficient to focus on this observation alone. There was evidenceof some retrieval skills used by children in all three groups, but we cannot inferwhether conceptual difficulties interfere with efficient storage, or retrieval, of ad-dition and multiplication facts; whether inefficient storage and/or retrieval inter-fere with conceptual mastery; or whether these two features of MLD are unrelatedto each other or related by a common underlying deficit. More information aboutthe mechanisms underlying the sources of, or influences (such as working mem-ory) on these weaknesses is necessary for developing optimal interventions. In themeantime, recognition of the variability across children who struggle with math(including children with MLD or LA), as well as within the former group, includesattending to the nature of errors made during simple timed arithmetic.
LIMITATIONS AND CONCLUSIONS
This study contributes to ongoing discussions of the multiple processes or strate-gies on which even older students rely to carry out simple arithmetic, and it demon-strates important differences in the groups of children with mathematical learningdifficulties. It poses implications for the classroom teacher, and cautions research-ers against combining groups of children to represent the construct of MLD. Ourfindings demonstrate some remarkable difficulties by eighth graders in regularclassroom settings.
Several variables that were not addressed also influence performance on timedmath tasks. For instance, instructional variables were not examined in this study,although such variables have a demonstrated influence on achievement and perfor-mance (e.g., Jitendra et al., 2007; Pianta, Belsky, Houts, Morrison, et al., 2007). Inthis study, all three participant groups were drawn from the full range of participat-ing schools, thus a particularly strong or weak school could not have accounted forthe differences we observed. However, it is likely that some of the participants inthe MLD or LA group are receiving special education services, the effects ofwhich are not addressed in this research. Another question not resolved in the pres-
TIMED ARITHMETIC PERFORMANCE OF CHILDREN WITH MLD 341
Dow
nloa
ded
by [
Penn
sylv
ania
Sta
te U
nive
rsity
] at
13:
41 1
4 M
ay 2
013
ent study concerns the extent to which children with MLD have an immature ver-sus deviant performance profile with respect to timed arithmetic performance. Fu-ture studies comparing performance of 8th graders with MLD to performance oftypically achieving 5th or 6th graders may shed additional light on this issue.Finally, although this study relied heavily on the concept of “math facts,” it was de-signed to focus on performance levels of children with mathematical difficultiesobservable by classroom teachers, not on current debates concerning what con-stitutes a “math fact”; nor does it contribute to discussions of the associations anddisassociations observed between addition and multiplication calculations (seeZamarian, López-Rolón, & Delazer, 2007, for a review of these discussions).
Although explicit guidelines for intervention and instruction cannot be directlyinferred from our findings, what is clear is that educators’ attention to the types oferrors made by their students may be more informative of the presence of MLDthan establishing the presence or quantity of errors made. It is also evident just howchallenging simple arithmetic can be for children with MLD. The relative simplic-ity of the problems used in the present study suggests that conceptual mastery wasan appropriate expectation for the eighth graders who participated, but this mas-tery was not demonstrated by children with MLD. Educators’ responses to the er-ror profiles observed in this study no doubt vary with outcome goals. Whereas re-peated practice (drills) may lead to better outcomes for schools’ high-stakestesting, the stakes may be the highest for the child reciting “facts” with little under-lying understanding of their “knowledge” or of when to apply it.
ACKNOWLEDGMENTS
This work was supported by award R01 HD 34061-09 from NICHD awarded toDr. Mazzocco. The authors thank the students who participated, their families andteachers, and the Baltimore County Public School District, for their steadfast sup-port of this research.
REFERENCES
Campbell, J. I. D. (1997). On the relation between skilled performance of simple division and multipli-cation. Journal of Experimental Psychology: Learning, Memory, and Cognition, 23, 1140–1159.
Canivez, G. L., & Watkins, M. W. (1998). Long-term stability of the Wechsler Intelligence Scale forChildren—Third Edition. Psychological Assessment, 10, 285–291.
Chong, S. K., & Siegel, L. S. (2008/this issue). Stability of computational deficits in math learning dis-ability from second through fifth grades. Developmental Neuropsychology, 33, 300–317.
Domahs, F., & Delazer, M. (2005). Some assumptions and facts about arithmetic facts. Psychology Sci-ence, 47, 96–111.
Domahs, F., Delazer, M., & Nuerk, H. C. (2006). What makes multiplication facts difficult. Problemsize or neighborhood consistency? Experimental Psychology, 53, 275–282.
342 MAZZOCCO, DEVLIN, McKENNEY
Dow
nloa
ded
by [
Penn
sylv
ania
Sta
te U
nive
rsity
] at
13:
41 1
4 M
ay 2
013
Geary, D. C. (1993). Mathematical disabilities: Cognitive, neuropsychological, and genetic compo-nents. Psychological Bulletin, 114, 345–362.
Geary, D. C., & Brown, S. C. (1991). Cognitive addition: Strategy choice and speed-of-processing differ-ences in gifted, normal, and mathematically disabled children. Developmental Psychology, 27, 398–406.
Geary, D. C., Hoard, M. K., Byrd-Craven, J., & DeSoto, M. C. (2004). Strategy choices in simple andcomplex addition: Contributions of working memory and counting knowledge for children withmathematical disability. Journal of Experimental Child Psychology, 88, 121–151.
Geary, D. C., Hoard, M. K., Byrd-Craven, J., Nugent, L., & Numtee, C. (2007). Cognitive mechanismsunderlying achievement deficits in children with mathematical learning disability. Child Develop-ment, 78, 1343–1359.
Geary, D. C., Hoard, M. K., Nugent, L., Byrd-Craven, J. (2008/this issue). Development of number linerepresentations in children with mathematical learning disability. Developmental Neuropsychology,33, 277–299.
Geary, D. C., & Wiley, J. G. (1991). Cognitive addition: Strategy choice and speed-of-processing dif-ferences in young and elderly adults. Psychology and Aging, 6, 474–483.
Hecht, S. A., Torgesen, J. K., Wagner, R. K., & Rashotte, C. A. (2001). The relations between phono-logical processing abilities and emerging individual differences in mathematical computationalskills: A longitudinal study from second to fifth grades. Journal of Experimental Child Psychology,79, 192–227.
Jitendra, A. K., Griffin, C. C., Haria, P., Leh, J., Adams, A., & Kaduvettoor, A. (2007). A comparison ofsingle and multiple strategy instruction on third-grade students’ mathematical problem solving.Journal of Educational Psychology, 99, 115–127.
Jordan, N. C., Hanich, L. B., & Kaplan, D. (2003). Arithmetic fact mastery in young children: A longi-tudinal investigation. Journal of Experimental Child Psychology, 85, 103–119.
Killeen, P. R. (2005a). An alternative to null hypothesis significance tests. Psychological Science, 16,345–353.
Killeen, P. R. (2005b). Replicability, confidence, and priors. Psychological Science, 16, 1009–1012.Killeen, P. R. (2005c). Tea-tests. The General Psychologist, 40(2), 16–19.Koontz, K. L., & Berch, D. B. (1996). Identifying simple numerical stimuli: Processing inefficiencies
exhibited by arithmetic learning disabled children. Mathematical Cognition, 2, 1–23.LeFevre, J.-A., Bisanz, J., Daley, K. E., Buffone, L., Greenham, S. L., & Sadesky, G. S. (1996). Multi-
ple routes to solution of single-digit multiplication problems. Journal of Experimental Psychology:General, 125, 284–306.
Mazzocco, M. M. M., & Myers, G. F. (2002). Maximizing efficiency of enrollment for school-basededucational research. Journal of Applied Social Psychology, 32, 1577–1587.
Mazzocco, M. M. M., & Myers, G. F. (2003). Complexities in identifying and defining mathematicslearning disability in the primary school-age years. Annals of Dyslexia, 53, 218–253.
McCloskey, M., Harley, W., & Sokol, S. M. (1991). Models of arithmetic fact retrieval: An evaluation inlight of findings from normal and brain damaged subjects. Journal of Experimental Psychology:Learning, Memory, and Cognition, 17, 377–397.
Murphy, M. M., Mazzocco, M. M. M., Hanich, L., & Early, M. (2007). Cognitive characteristics of chil-dren with mathematics learning disability (MLD) varies as a function of criterion used to defineMLD. Journal of Learning Disabilities, 40, 458–478.
Neisser, U., Boodoo, G., Bouchard, T. J., Boykin, A. W., Brody, N., Ceci, S., et al. (1996). Intelligence:Knowns and unknowns. American Psychologist, 51, 77–101.
Pianta, R. C., Belsky, J., Houts, R., Morrison, F., & The National Institute of Child Health and HumanDevelopment (NICHD) Early Child Care Research Network. (2007). Teaching: Opportunities tolearn in America’s elementary classrooms. Science, 315, 1795– 1796.
Russell, R. L., & Ginsburg, H. P. (1984). Cognitive analysis of children’s mathematics difficulties. Cog-nition and Instruction, 1, 217–244.
TIMED ARITHMETIC PERFORMANCE OF CHILDREN WITH MLD 343
Dow
nloa
ded
by [
Penn
sylv
ania
Sta
te U
nive
rsity
] at
13:
41 1
4 M
ay 2
013
Siegler, R. S. (1988). Strategy choice procedures and the development of multiplication skill. Journalof Experimental Psychology: General, 117, 258–275.
Wechsler, D. (1999). Wechsler Abbreviated Scale of Intelligence (WASI). San Antonio, TX: The Psy-chological Corporation.
Woodcock–Johnson Psycho-Educational Battery—Revised. Allen, TX: DLM Teaching Resources.Zamarian, L., Lopez-Rolon, A., Delazer, M. (2007). Neuropsychological case studies of arithmetic
processing. In D. Berch & M. Mazzocco (eds.), Why is math so hard for some children? The natureand origins of mathematical kearning difficulties and disabilities (pp. 245–263). Baltimore, MD:Brookes Publishing.
Zbrodoff, N. J., Logan, G. D., & Campbell, J. I. D. (2005). What everyone finds: The problem-size ef-fect. In J. Campbell (ed.), The handbook of mathematical cognition (pp. 331–345). New York: Psy-chology Press.
344 MAZZOCCO, DEVLIN, McKENNEY
Dow
nloa
ded
by [
Penn
sylv
ania
Sta
te U
nive
rsity
] at
13:
41 1
4 M
ay 2
013


![ASIAN DEVELOPMENT BANK PPA: MLD 24009 DEVELOPMENT BANK PPA: MLD 24009 PROJECT PERFORMANCE AUDIT REPORT ON THE SECOND POWER SYSTEM DEVELOPMENT PROJECT (Loan 1121-MLD[SF]) IN THE MALDIVES](https://img.pdfslide.us/doc/110x75/5d32753688c9939a158db4f1/asian-development-bank-ppa-mld-24009-development-bank-ppa-mld-24009-project-performance.jpg)