Embed Size (px)
Citation preview
IRT in Lertap 5
Larry R Nelson
Curtin University & Burapha University
Document date: 16 January 2018
website: www.lertap.com
Update:
Work on adding IRT support to Lertap 5 has continued since this paper was
originally published in October 2016.
The omega1 macro has become an IRT driver of sorts. Its original intent was to
provide support for those interested in computing omega-based estimates of
reliability and test/scale dimensionality. This paper shows how it works.
The macro’s utility has now been enhanced with the addition of a facility for
downloading Rmd modules (R markdown) to use with the TAM IRT package. One
of the modules works well for users interested in Rasch analyses. Read more by
having a look at this webpage.
Another special-purpose macro has been added to Lertap 5 which simplifies quan-
tile plots of cognitive item performance. Read more here.
I continue to use the Lertap 5 EIRT add-on with classes. It’s fully discussed be-
low. EIRT has power, is easy to use and can be an effective teaching tool. How-
ever, as far as my classes go, it has some particular limitations, as mentioned in
another paper.
The content below was originally dated 6 October 2016.
Lertap 5 has had support for item response theory, IRT, for many years, all the
way back to 2004.
For the most part, Lertap 5 is a “go-between” of sorts. That is to say, it doesn’t
have true IRT routines in it – oh yes, its “experimental features” option will pro-
duce estimates of the location and slope parameters for the “2PL” model, and,
yes, these can be quite useful at times, even fairly accurate (at times).
But they’re approximations. See them, read about them, at this webpage.
Lertap 5 can be used to set up files for subsequent use by two of the leading IRT
programs: Bilog-MG and Xcalibre. Its support for Xcalibre is especially strong as
for some years Lertap 5 and Xcalibre were distributed and supported by the same
software house, Assessment Systems Corporation, ASC.
In 2015, I knuckled down and enhanced the IRT support in Lertap 5 in prepara-
tion for another round of postgraduate classes. For years my classes have
introduced students to IRT, but it’s been rather difficult to provide real hands-on
experiences for them as there hasn’t been an easy-to-use, free IRT program of
any substance, at least not to my knowledge.
But now there is. Last year SAS.com made their “University Edition” free to non-
commercial users, and early this year, 2015, SAS’ IRT routines were exhibiting
some real depth and power. Now Lertap 5 has an interface to SAS IRT. It works
pretty well, and it even writes a bit of SAS code. Read about it with a little click
IRT in Lertap 5, page 2.
here.
But wait, there’s more. I was thinking about having students use the IRT support
found in R libraries, and while I was tinkering aRound I came across a library
called “RIRT”. And lo and behold, the authors of RIRT have also packaged their
code so that it’ll work as an Excel “Add-in”. Very neat. It is not likely to impress
users at first as it is weakly documented, and, at that, the English-language doc-
umentation, as well as the dialog boxes in Excel, has been put together by an
author whose native tongue is not English.
But for sure it has promise. No doubt. And it is free. And it fits in very well with
Lertap 5 – it’ll write its output into Excel worksheets, just as Lertap 5 does, and
that’s useful to be sure. Very.
What’s it called? “EIRT”.
Notice that I haven’t made EIRT into a hyperlink? That’s because the folks
who’ve put it together don’t have a dedicated website. I’m pretty sure you could
get into R and look at RIRT documents there, but doing that has but faint resem-
blance, in my opinion, to looking at a special-purpose, nicely tailored and
illustrated website.
Downloading EIRT
Where can it be downloaded from?
The original source, and the best place to get it, is Source Forge.
Source Forge is the best site as they’re always going to have the latest version.
Is EIRT often updated? Turns out that it is – dig around in EIRT documentation
and you’ll find that there’s been an update just about every year since 2006.
Most years have had more than one update. The updates are set out in a text file
called “ChangeLog.txt”. Later on I’ll tell you how to find it.
EIRT is open source. I’m free to give you a copy, and I’ve put up the version cur-
rent at July 2015, “eirt-1.3.0.exe”, on a Lertap 5 website. I’ve done this as it
might be easier to download from there, and also because I just don’t know about
free software; I worry that it might be free today and disappeared tomorrow.
Here is a link to eirt-1.3.0.exe on one of our sites: download EIRT installer.
Installing EIRT
It’s easy to install. Just double-click on the downloaded file, eirt-1.3.0.exe,
and it’ll set itself up (on a Windows computer, not Mac) as an Excel “Add-in”. An
advantage of Excel add-ins is that they’re treated as system software. You don’t
choose where to install it, it just gets done.
Now, for the record, on my Windows 8.1 computer, the main EIRT files went
here: C:\Program Files (x86)\eirt
If you’re reading along and doing at the same time, see if your copy went into the
same folder, and then look for that ChangeLog.txt file I mentioned above. Open
it and read it. It’ll give an idea of the work that’s gone into the software.
IRT in Lertap 5, page 3.
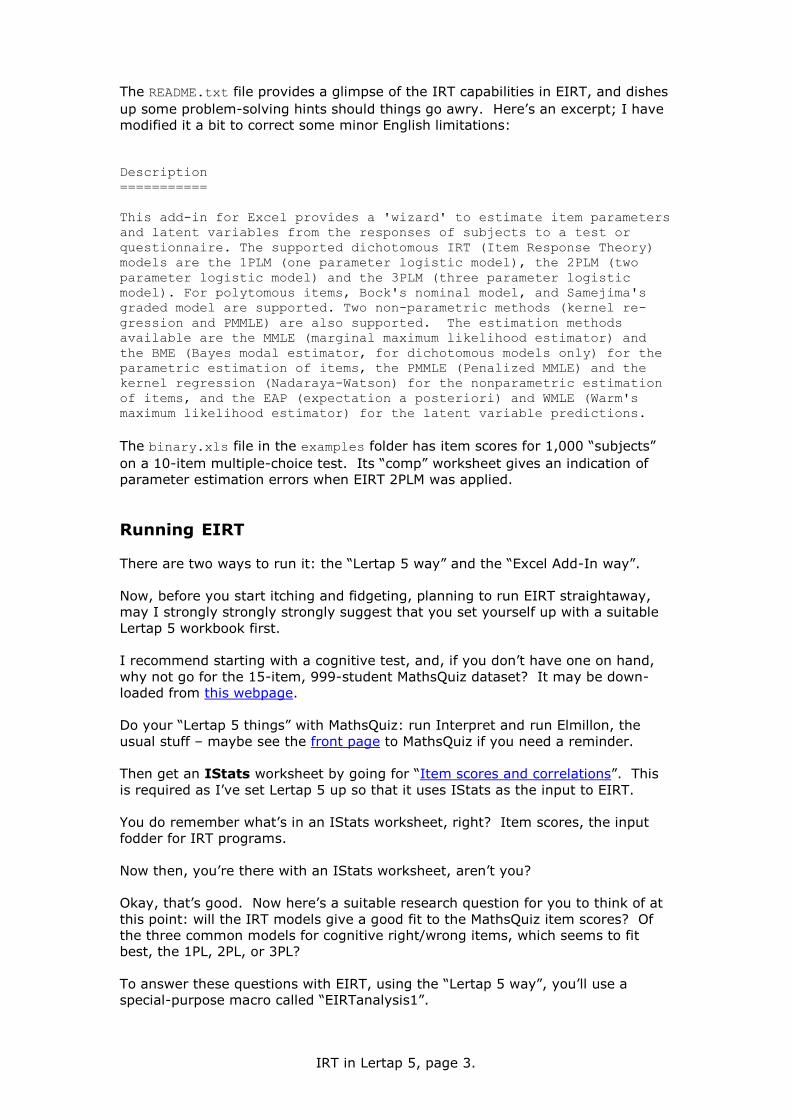
The README.txt file provides a glimpse of the IRT capabilities in EIRT, and dishes
up some problem-solving hints should things go awry. Here’s an excerpt; I have
modified it a bit to correct some minor English limitations:
Description
===========
This add-in for Excel provides a 'wizard' to estimate item parameters
and latent variables from the responses of subjects to a test or
questionnaire. The supported dichotomous IRT (Item Response Theory)
models are the 1PLM (one parameter logistic model), the 2PLM (two
parameter logistic model) and the 3PLM (three parameter logistic
model). For polytomous items, Bock's nominal model, and Samejima's
graded model are supported. Two non-parametric methods (kernel re-
gression and PMMLE) are also supported. The estimation methods
available are the MMLE (marginal maximum likelihood estimator) and
the BME (Bayes modal estimator, for dichotomous models only) for the
parametric estimation of items, the PMMLE (Penalized MMLE) and the
kernel regression (Nadaraya-Watson) for the nonparametric estimation
of items, and the EAP (expectation a posteriori) and WMLE (Warm's
maximum likelihood estimator) for the latent variable predictions.
The binary.xls file in the examples folder has item scores for 1,000 “subjects”
on a 10-item multiple-choice test. Its “comp” worksheet gives an indication of
parameter estimation errors when EIRT 2PLM was applied.
Running EIRT
There are two ways to run it: the “Lertap 5 way” and the “Excel Add-In way”.
Now, before you start itching and fidgeting, planning to run EIRT straightaway,
may I strongly strongly strongly suggest that you set yourself up with a suitable
Lertap 5 workbook first.
I recommend starting with a cognitive test, and, if you don’t have one on hand,
why not go for the 15-item, 999-student MathsQuiz dataset? It may be down-
loaded from this webpage.
Do your “Lertap 5 things” with MathsQuiz: run Interpret and run Elmillon, the
usual stuff – maybe see the front page to MathsQuiz if you need a reminder.
Then get an IStats worksheet by going for “Item scores and correlations”. This
is required as I’ve set Lertap 5 up so that it uses IStats as the input to EIRT.
You do remember what’s in an IStats worksheet, right? Item scores, the input
fodder for IRT programs.
Now then, you’re there with an IStats worksheet, aren’t you?
Okay, that’s good. Now here’s a suitable research question for you to think of at
this point: will the IRT models give a good fit to the MathsQuiz item scores? Of
the three common models for cognitive right/wrong items, which seems to fit
best, the 1PL, 2PL, or 3PL?
To answer these questions with EIRT, using the “Lertap 5 way”, you’ll use a
special-purpose macro called “EIRTanalysis1”.
IRT in Lertap 5, page 4.
EIRT the Lertap way
This is one of two ways to get EIRT running. It’s based on using a special
Lertap 5 macro called “EIRTanalysis1”. If you haven’t heard of these things
called “special macros” in Lertap 5, then you might want to have a gander at this
webpage.
Now, before continuing, let me tell you that I have heeded my own advice – I’ve
downloaded a copy of the 15-item MathsQuiz workbook, and I have used the
“Interpret” and “Elmillon” options.
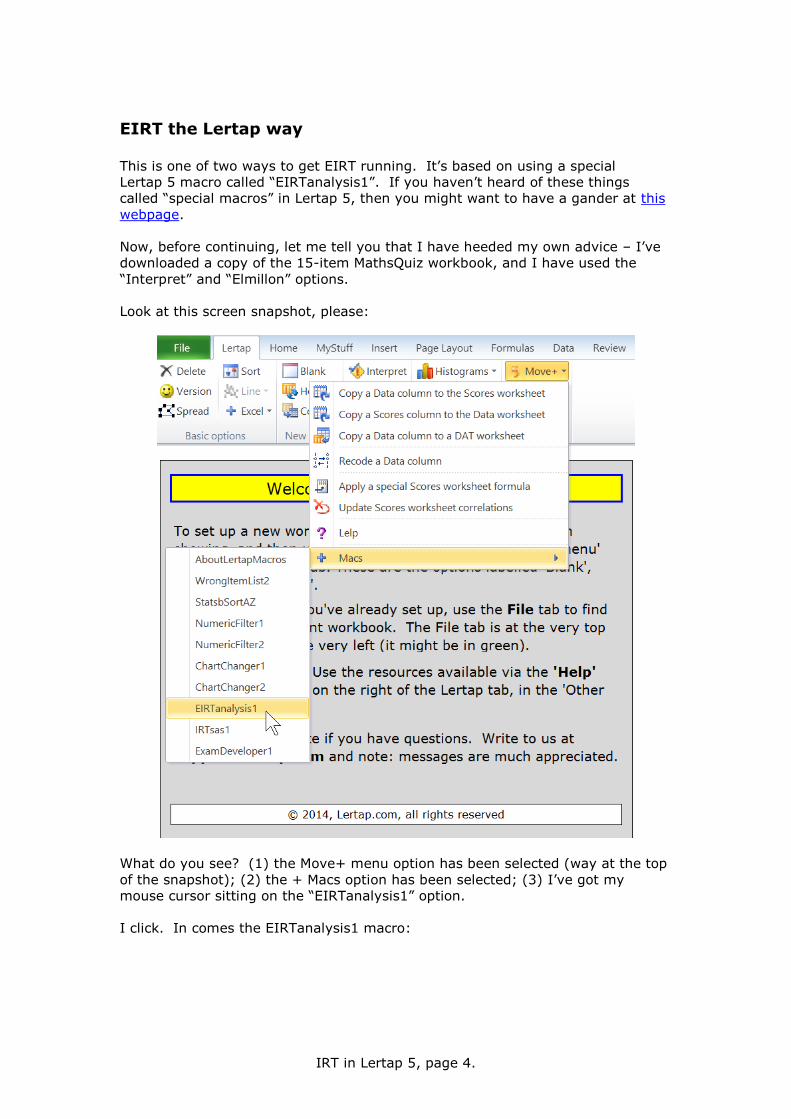
Look at this screen snapshot, please:
What do you see? (1) the Move+ menu option has been selected (way at the top
of the snapshot); (2) the + Macs option has been selected; (3) I’ve got my
mouse cursor sitting on the “EIRTanalysis1” option.
I click. In comes the EIRTanalysis1 macro:
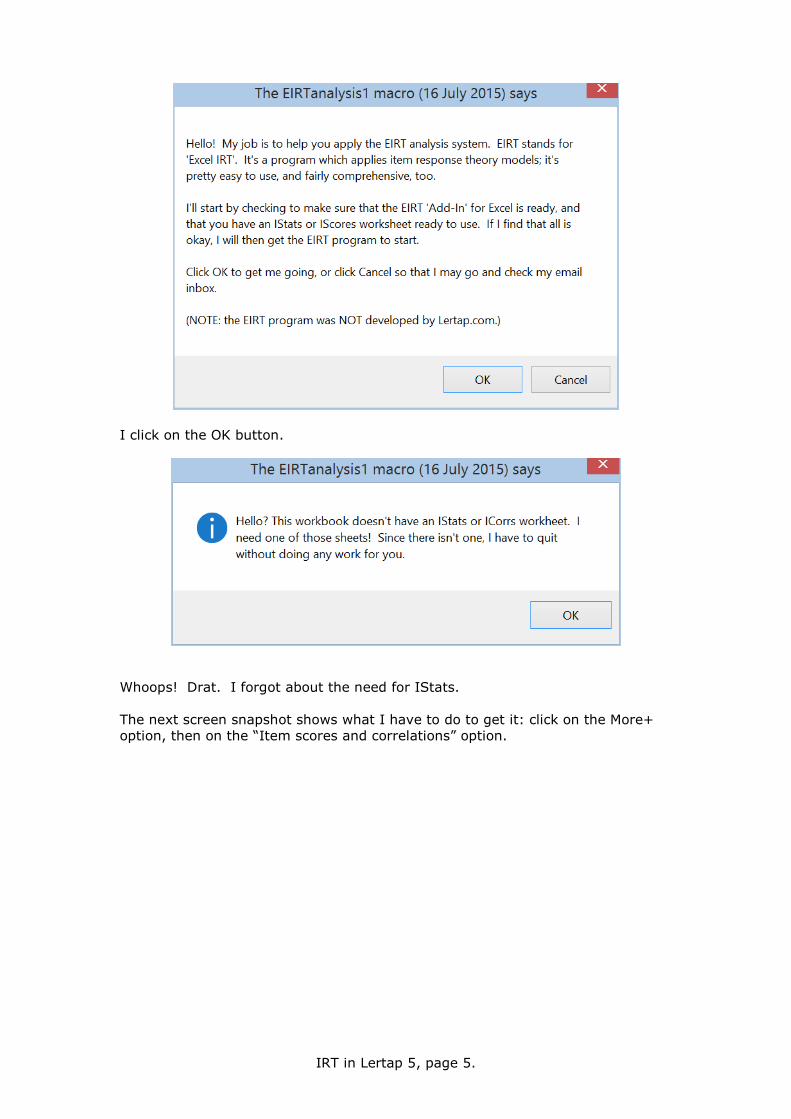
IRT in Lertap 5, page 5.
I click on the OK button.
Whoops! Drat. I forgot about the need for IStats.
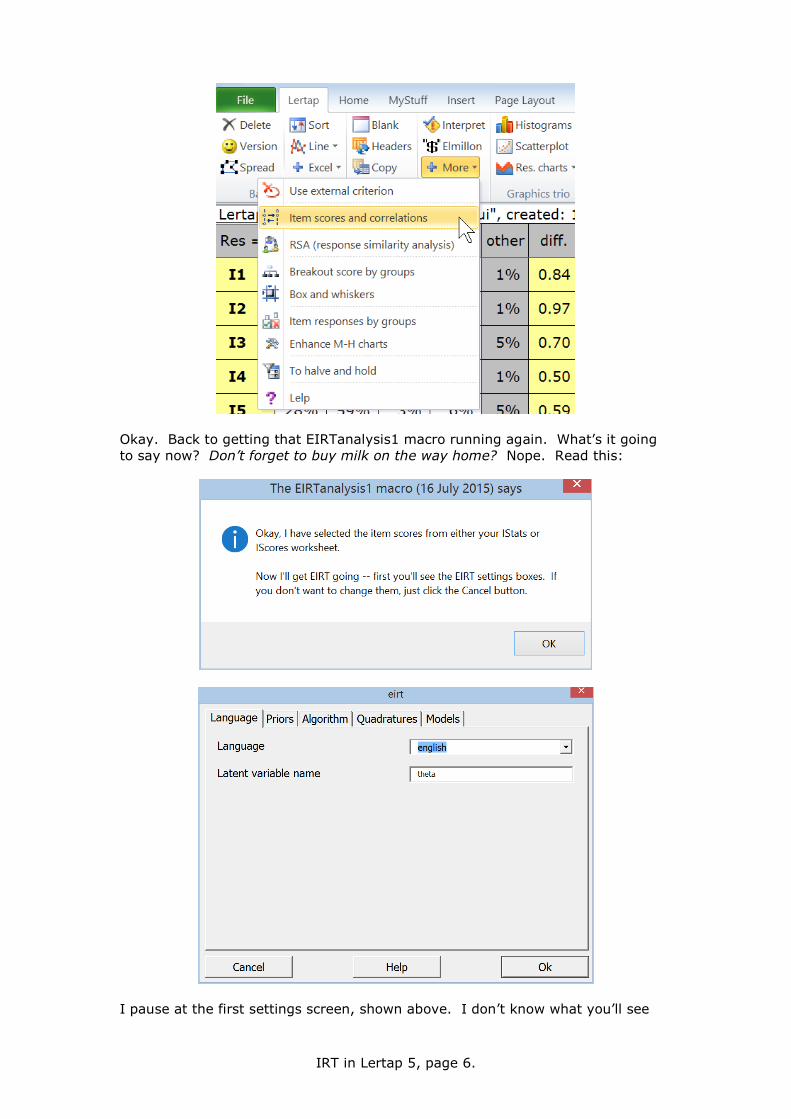
The next screen snapshot shows what I have to do to get it: click on the More+
option, then on the “Item scores and correlations” option.
IRT in Lertap 5, page 6.
Okay. Back to getting that EIRTanalysis1 macro running again. What’s it going
to say now? Don’t forget to buy milk on the way home? Nope. Read this:
I pause at the first settings screen, shown above. I don’t know what you’ll see
IRT in Lertap 5, page 7.
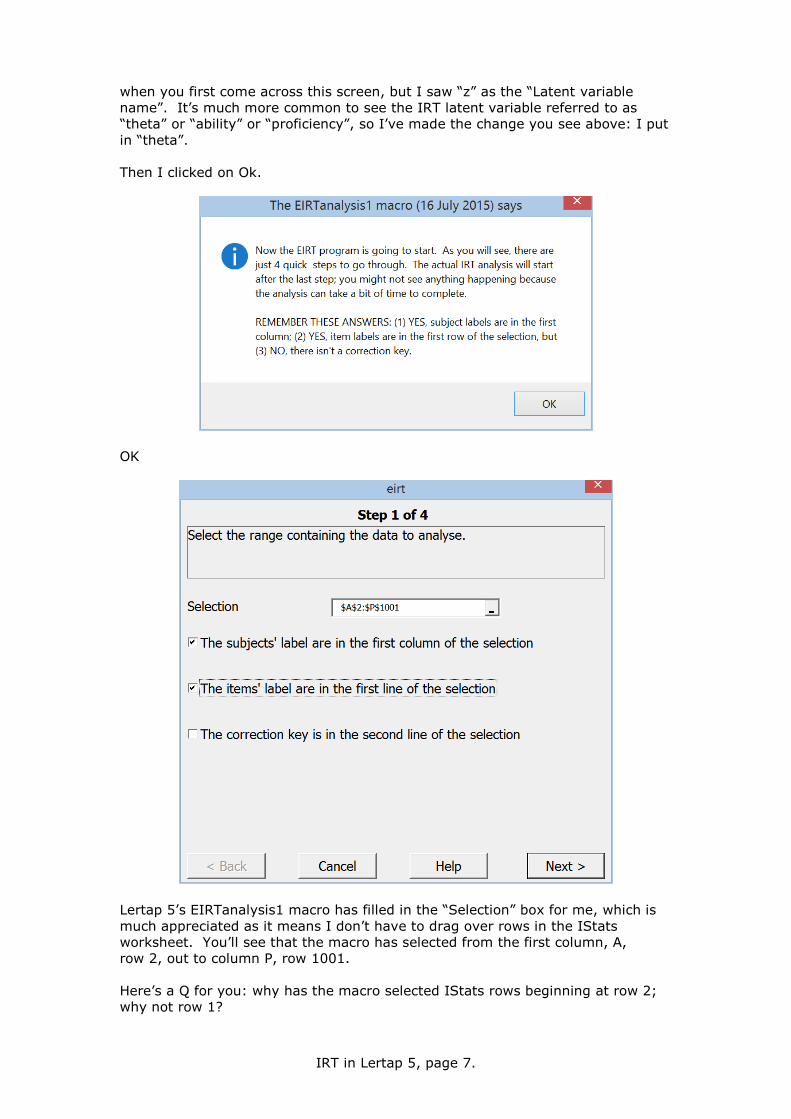
when you first come across this screen, but I saw “z” as the “Latent variable
name”. It’s much more common to see the IRT latent variable referred to as
“theta” or “ability” or “proficiency”, so I’ve made the change you see above: I put
in “theta”.
Then I clicked on Ok.
OK
Lertap 5’s EIRTanalysis1 macro has filled in the “Selection” box for me, which is
much appreciated as it means I don’t have to drag over rows in the IStats
worksheet. You’ll see that the macro has selected from the first column, A,
row 2, out to column P, row 1001.
Here’s a Q for you: why has the macro selected IStats rows beginning at row 2;
why not row 1?
IRT in Lertap 5, page 8.
Because Lertap 5 includes an extra header row at the top of many of its “reports”,
IStats included. EIRT, along with other programs such as SPSS and SAS, doesn’t
want to see that row – these programs want to see variable titles in the first row
to be used (such as ID, I1, I2, and so on).
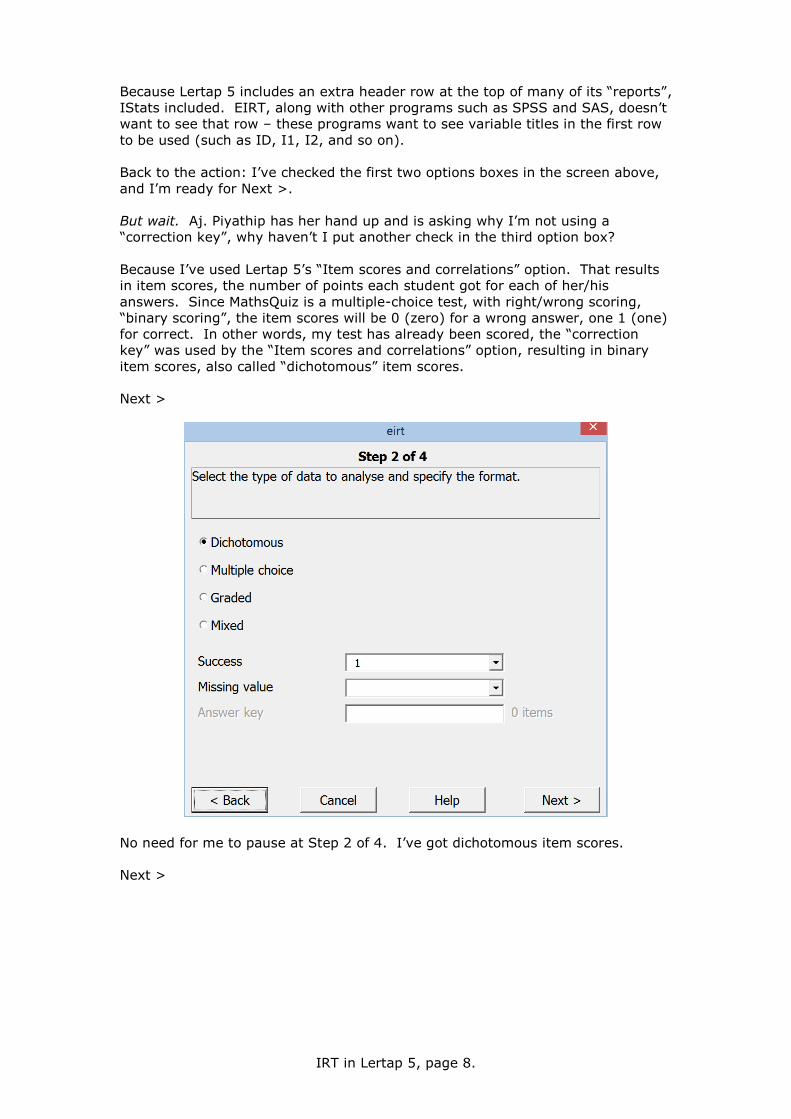
Back to the action: I’ve checked the first two options boxes in the screen above,
and I’m ready for Next >.
But wait. Aj. Piyathip has her hand up and is asking why I’m not using a
“correction key”, why haven’t I put another check in the third option box?
Because I’ve used Lertap 5’s “Item scores and correlations” option. That results
in item scores, the number of points each student got for each of her/his
answers. Since MathsQuiz is a multiple-choice test, with right/wrong scoring,
“binary scoring”, the item scores will be 0 (zero) for a wrong answer, one 1 (one)
for correct. In other words, my test has already been scored, the “correction
key” was used by the “Item scores and correlations” option, resulting in binary
item scores, also called “dichotomous” item scores.
Next >
No need for me to pause at Step 2 of 4. I’ve got dichotomous item scores.
Next >
IRT in Lertap 5, page 9.
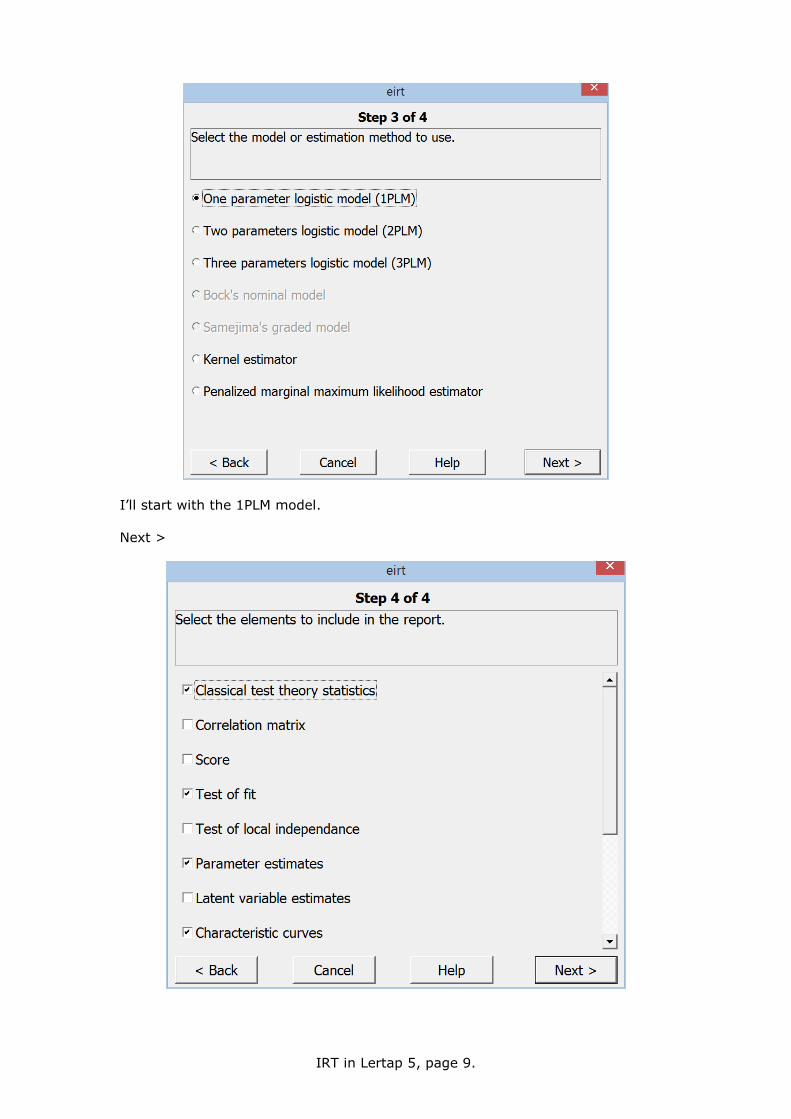
I’ll start with the 1PLM model.
Next >
IRT in Lertap 5, page 10.
I have ticked “Classical theory statistics” above. EIRT will compute item diffi-
culties and correlations, and coefficient alpha, and I can compare with Lertap 5’s
Stats1b report to make sure EIRT and Lertap 5 agree.
I have selected a “Test of fit” as, in my opinion, we never want to be without this
test when it comes to IRT.
Naturally I want the “Parameter” estimates, thank you, and yes, okay, I’ll also
have a look at “Characteristic curves”, thank you.
Next >
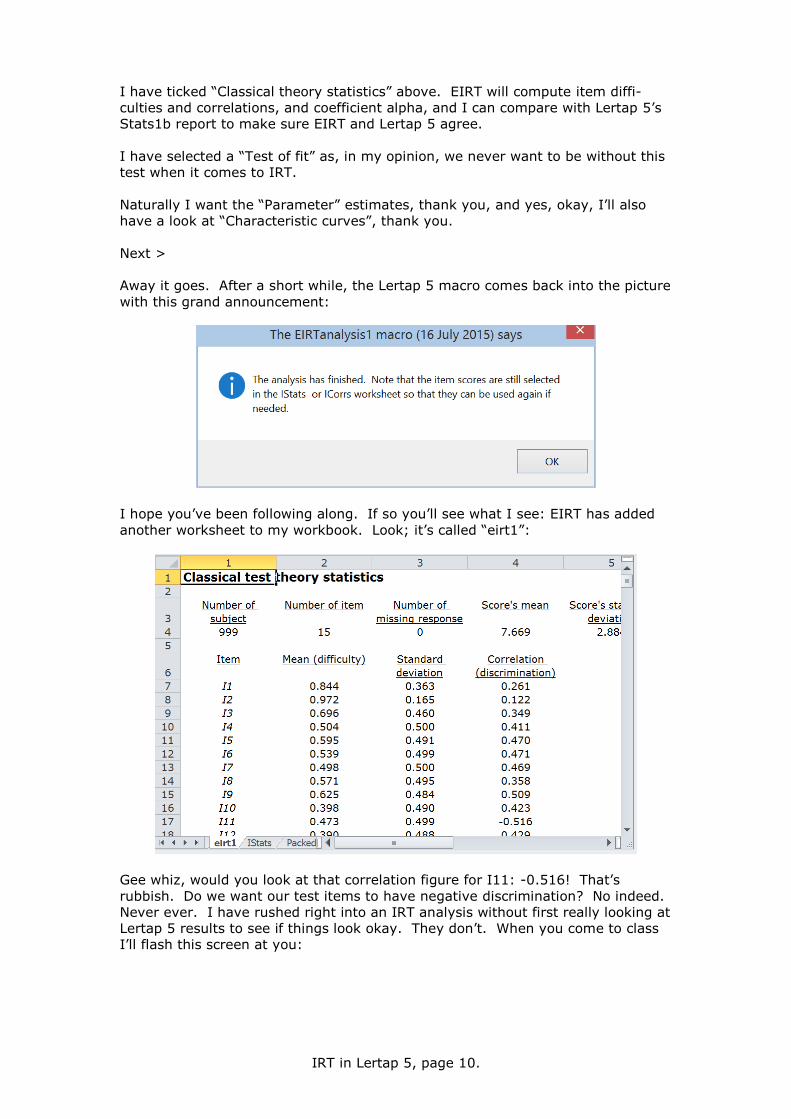
Away it goes. After a short while, the Lertap 5 macro comes back into the picture
with this grand announcement:
I hope you’ve been following along. If so you’ll see what I see: EIRT has added
another worksheet to my workbook. Look; it’s called “eirt1”:
Gee whiz, would you look at that correlation figure for I11: -0.516! That’s
rubbish. Do we want our test items to have negative discrimination? No indeed.
Never ever. I have rushed right into an IRT analysis without first really looking at
Lertap 5 results to see if things look okay. They don’t. When you come to class
I’ll flash this screen at you:
IRT in Lertap 5, page 11.
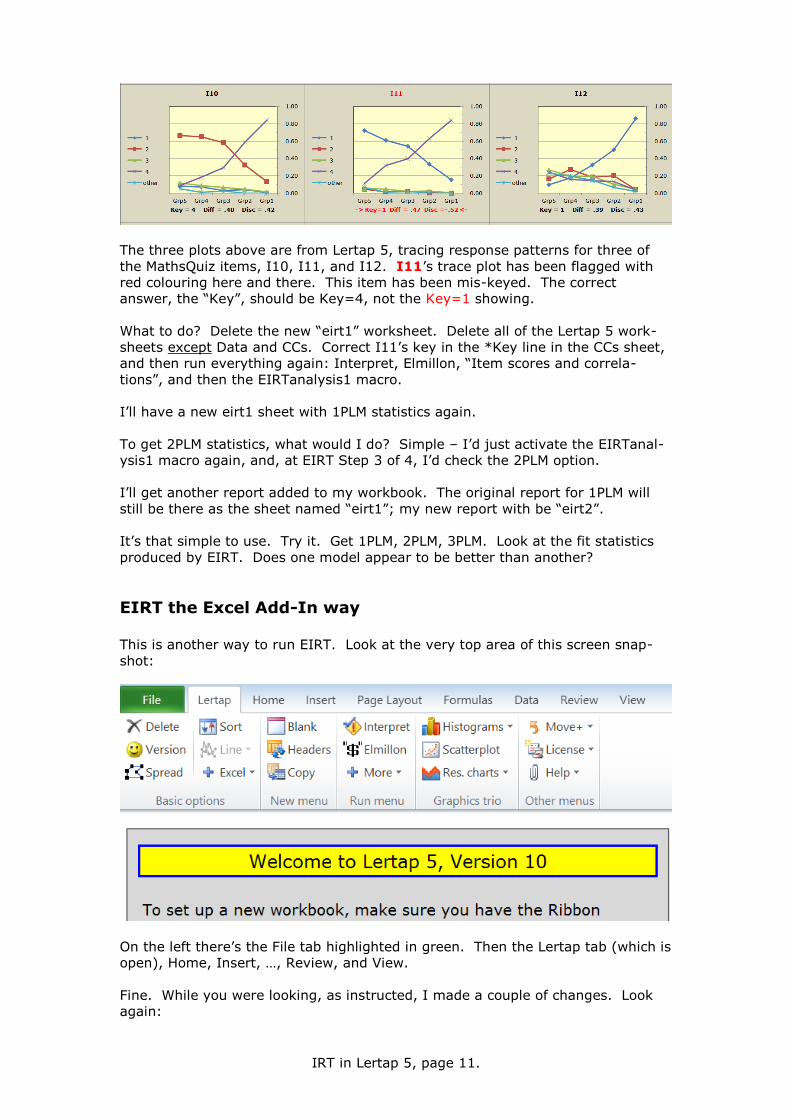
The three plots above are from Lertap 5, tracing response patterns for three of
the MathsQuiz items, I10, I11, and I12. I11’s trace plot has been flagged with
red colouring here and there. This item has been mis-keyed. The correct
answer, the “Key”, should be Key=4, not the Key=1 showing.
What to do? Delete the new “eirt1” worksheet. Delete all of the Lertap 5 work-
sheets except Data and CCs. Correct I11’s key in the *Key line in the CCs sheet,
and then run everything again: Interpret, Elmillon, “Item scores and correla-
tions”, and then the EIRTanalysis1 macro.
I’ll have a new eirt1 sheet with 1PLM statistics again.
To get 2PLM statistics, what would I do? Simple – I’d just activate the EIRTanal-
ysis1 macro again, and, at EIRT Step 3 of 4, I’d check the 2PLM option.
I’ll get another report added to my workbook. The original report for 1PLM will
still be there as the sheet named “eirt1”; my new report with be “eirt2”.
It’s that simple to use. Try it. Get 1PLM, 2PLM, 3PLM. Look at the fit statistics
produced by EIRT. Does one model appear to be better than another?
EIRT the Excel Add-In way This is another way to run EIRT. Look at the very top area of this screen snap-
shot:
On the left there’s the File tab highlighted in green. Then the Lertap tab (which is
open), Home, Insert, …, Review, and View.
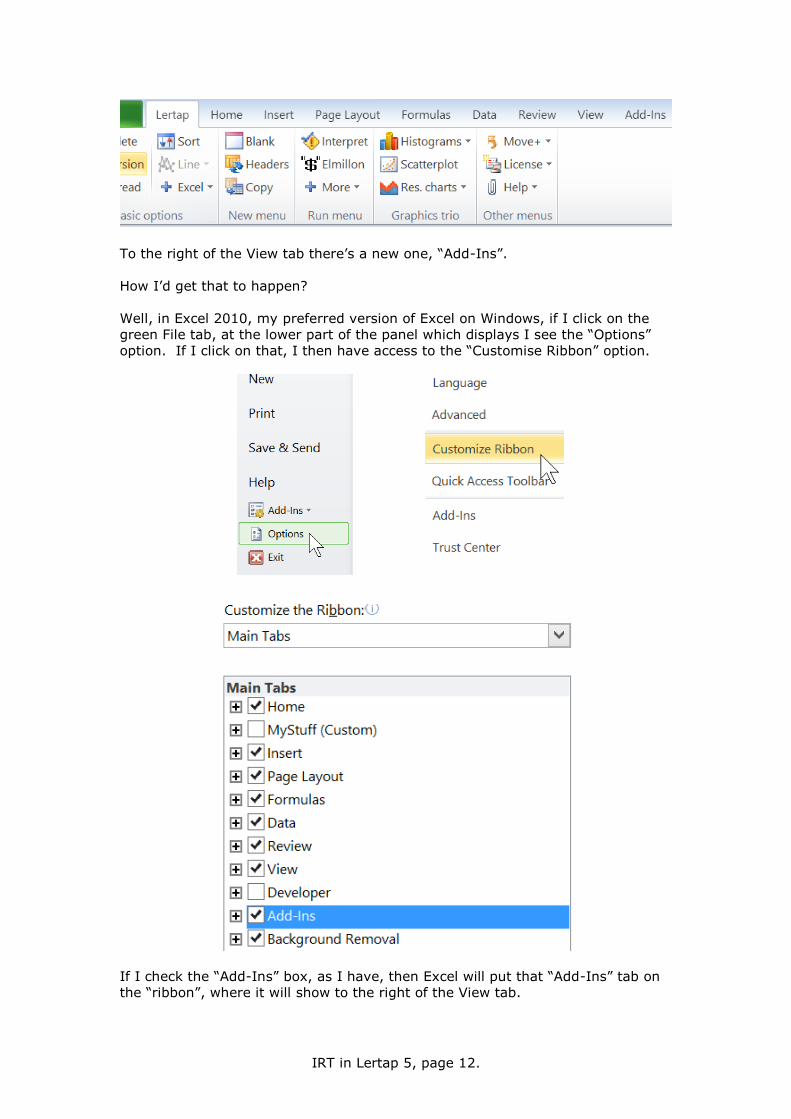
Fine. While you were looking, as instructed, I made a couple of changes. Look
again:
IRT in Lertap 5, page 12.
To the right of the View tab there’s a new one, “Add-Ins”.
How I’d get that to happen?
Well, in Excel 2010, my preferred version of Excel on Windows, if I click on the
green File tab, at the lower part of the panel which displays I see the “Options”
option. If I click on that, I then have access to the “Customise Ribbon” option.
If I check the “Add-Ins” box, as I have, then Excel will put that “Add-Ins” tab on
the “ribbon”, where it will show to the right of the View tab.
IRT in Lertap 5, page 13.
The same steps are followed in Excel 2013 – the tab names in Excel 2013 are a
bit different, but not all that much, you’ll have basically the same steps to go
through (fortunately).
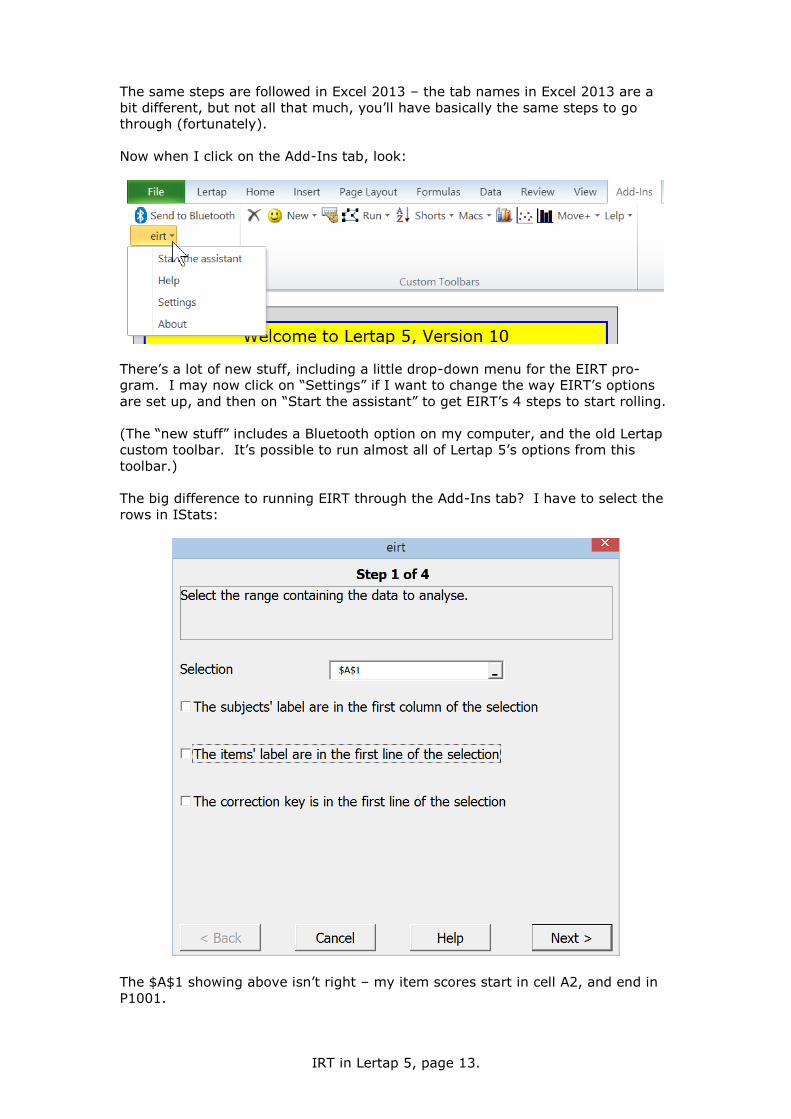
Now when I click on the Add-Ins tab, look:
There’s a lot of new stuff, including a little drop-down menu for the EIRT pro-
gram. I may now click on “Settings” if I want to change the way EIRT’s options
are set up, and then on “Start the assistant” to get EIRT’s 4 steps to start rolling.
(The “new stuff” includes a Bluetooth option on my computer, and the old Lertap
custom toolbar. It’s possible to run almost all of Lertap 5’s options from this
toolbar.)
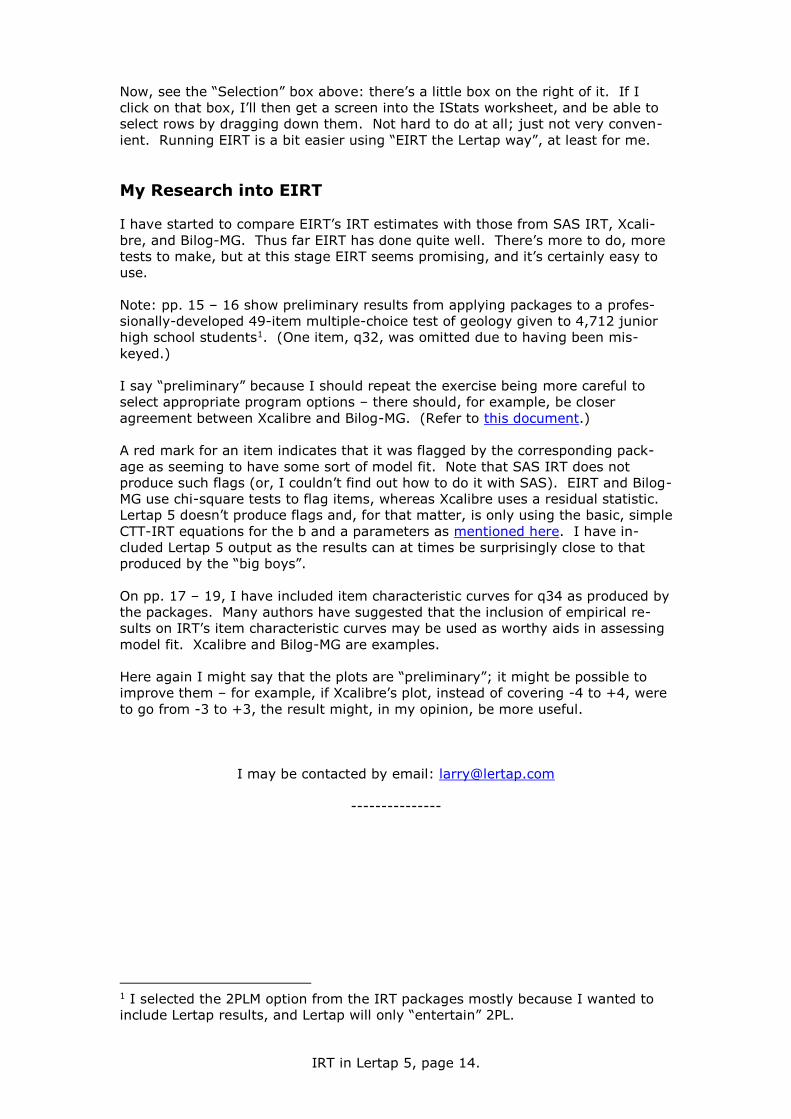
The big difference to running EIRT through the Add-Ins tab? I have to select the
rows in IStats:
The $A$1 showing above isn’t right – my item scores start in cell A2, and end in
P1001.
IRT in Lertap 5, page 14.
Now, see the “Selection” box above: there’s a little box on the right of it. If I
click on that box, I’ll then get a screen into the IStats worksheet, and be able to
select rows by dragging down them. Not hard to do at all; just not very conven-
ient. Running EIRT is a bit easier using “EIRT the Lertap way”, at least for me.
My Research into EIRT
I have started to compare EIRT’s IRT estimates with those from SAS IRT, Xcali-
bre, and Bilog-MG. Thus far EIRT has done quite well. There’s more to do, more
tests to make, but at this stage EIRT seems promising, and it’s certainly easy to
use.
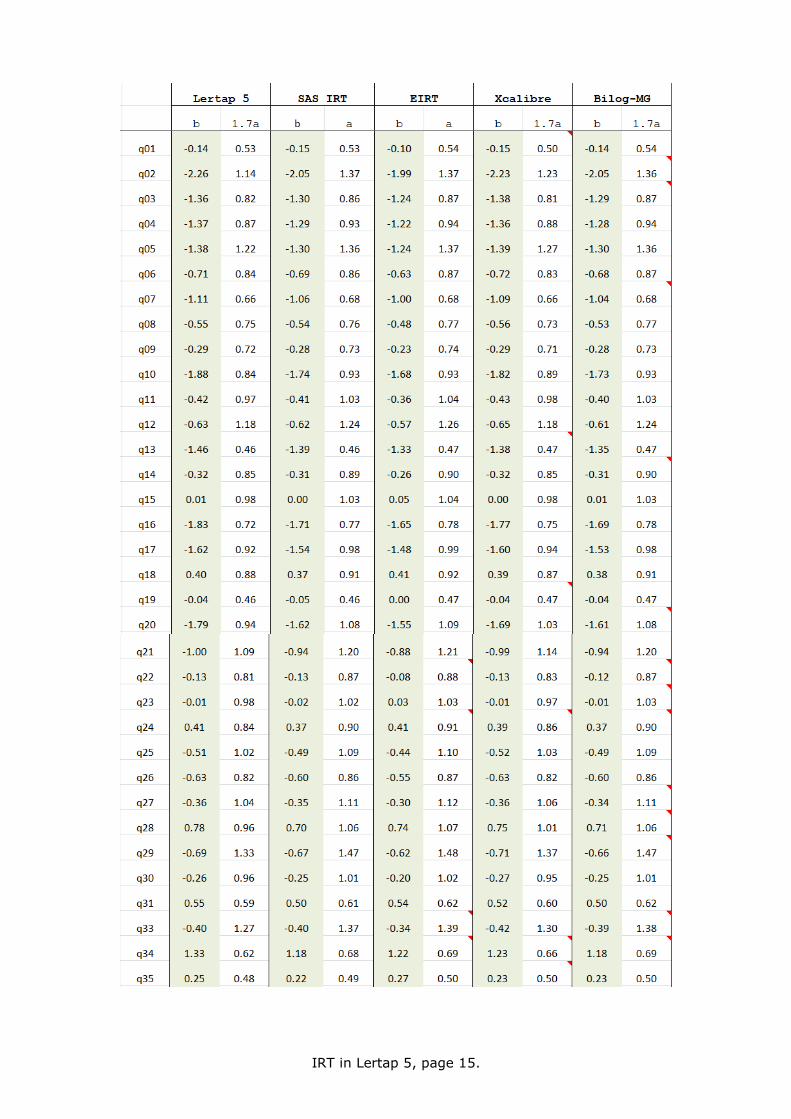
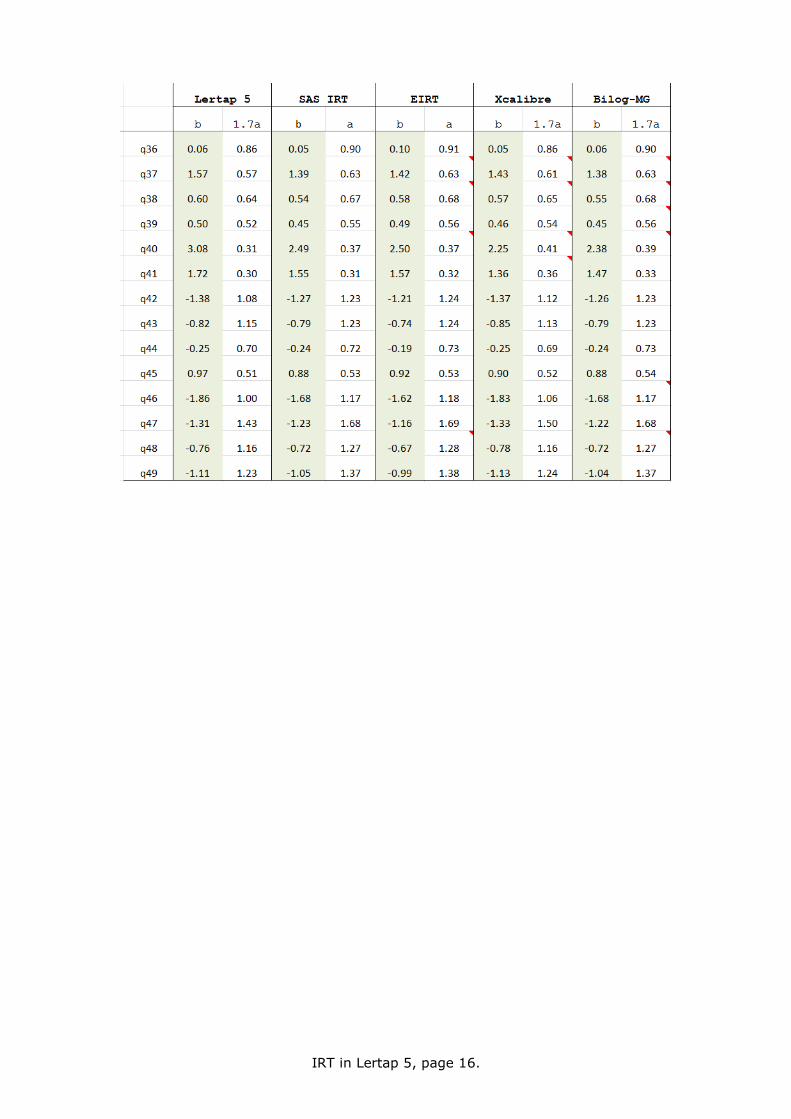
Note: pp. 15 – 16 show preliminary results from applying packages to a profes-
sionally-developed 49-item multiple-choice test of geology given to 4,712 junior
high school students1. (One item, q32, was omitted due to having been mis-
keyed.)
I say “preliminary” because I should repeat the exercise being more careful to
select appropriate program options – there should, for example, be closer
agreement between Xcalibre and Bilog-MG. (Refer to this document.)
A red mark for an item indicates that it was flagged by the corresponding pack-
age as seeming to have some sort of model fit. Note that SAS IRT does not
produce such flags (or, I couldn’t find out how to do it with SAS). EIRT and Bilog-
MG use chi-square tests to flag items, whereas Xcalibre uses a residual statistic.
Lertap 5 doesn’t produce flags and, for that matter, is only using the basic, simple
CTT-IRT equations for the b and a parameters as mentioned here. I have in-
cluded Lertap 5 output as the results can at times be surprisingly close to that
produced by the “big boys”.
On pp. 17 – 19, I have included item characteristic curves for q34 as produced by
the packages. Many authors have suggested that the inclusion of empirical re-
sults on IRT’s item characteristic curves may be used as worthy aids in assessing
model fit. Xcalibre and Bilog-MG are examples.
Here again I might say that the plots are “preliminary”; it might be possible to
improve them – for example, if Xcalibre’s plot, instead of covering -4 to +4, were
to go from -3 to +3, the result might, in my opinion, be more useful.
I may be contacted by email: [email protected]
---------------
1 I selected the 2PLM option from the IRT packages mostly because I wanted to
include Lertap results, and Lertap will only “entertain” 2PL.
IRT in Lertap 5, page 15.
IRT in Lertap 5, page 16.
IRT in Lertap 5, page 17.
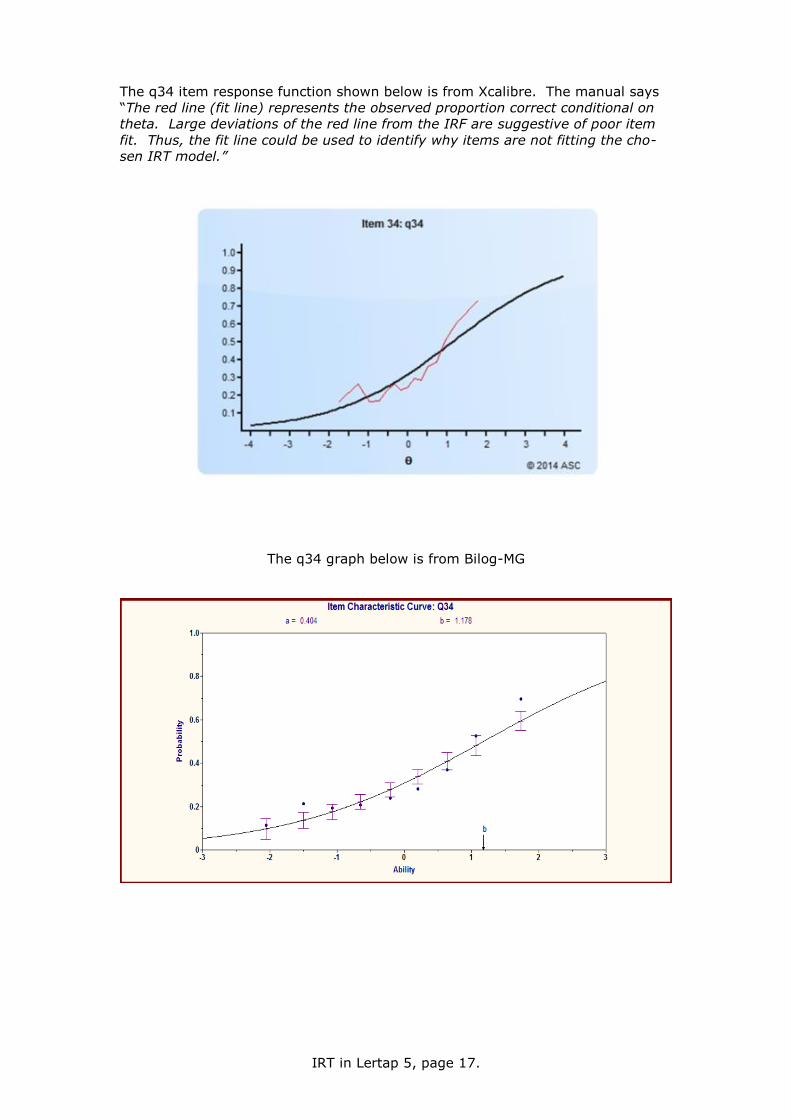
The q34 item response function shown below is from Xcalibre. The manual says
“The red line (fit line) represents the observed proportion correct conditional on
theta. Large deviations of the red line from the IRF are suggestive of poor item
fit. Thus, the fit line could be used to identify why items are not fitting the cho-
sen IRT model.”
The q34 graph below is from Bilog-MG
IRT in Lertap 5, page 18.
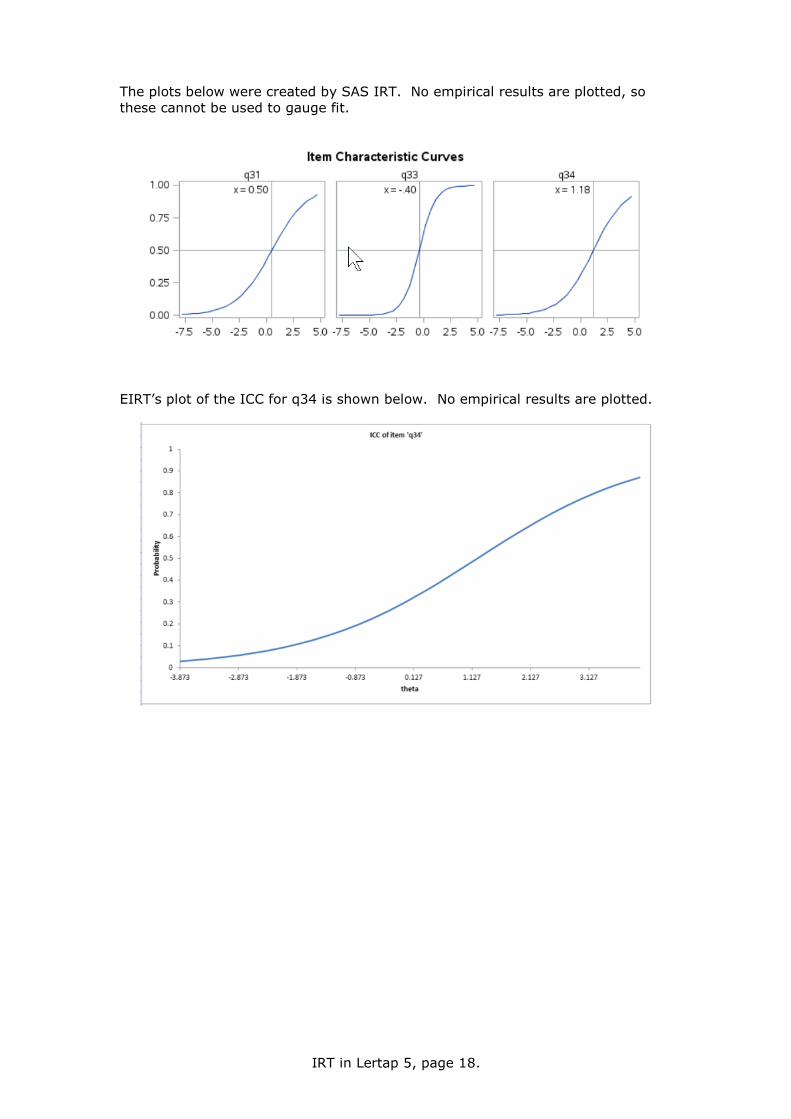
The plots below were created by SAS IRT. No empirical results are plotted, so
these cannot be used to gauge fit.
EIRT’s plot of the ICC for q34 is shown below. No empirical results are plotted.
IRT in Lertap 5, page 19.
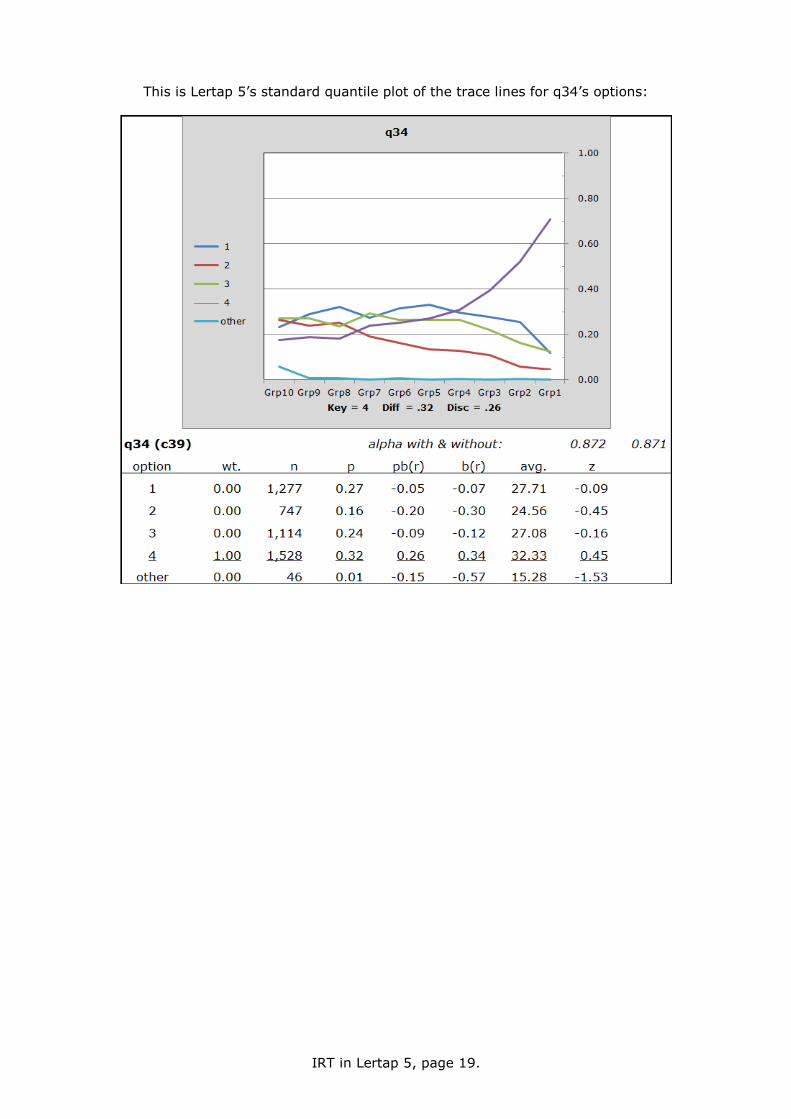
This is Lertap 5’s standard quantile plot of the trace lines for q34’s options:


![[IRT] Item Response Theory · 2019. 3. 1. · Title irt — Introduction to IRT models DescriptionRemarks and examplesReferencesAlso see Description Item response theory (IRT) is](https://img.pdfslide.us/doc/110x75/60f87abb593d3015bc4d5fae/irt-item-response-theory-2019-3-1-title-irt-a-introduction-to-irt-models.jpg)