Embed Size (px)
Citation preview
Analyst Meeting
2011 Performance
23 February 2012
IRPC Public Company Limited
2
2011 Highlights
Operation Performance
Financial Performance
Industry Outlooks
Project Progress & Future
Appendix
AGENDA
2011 Highlights
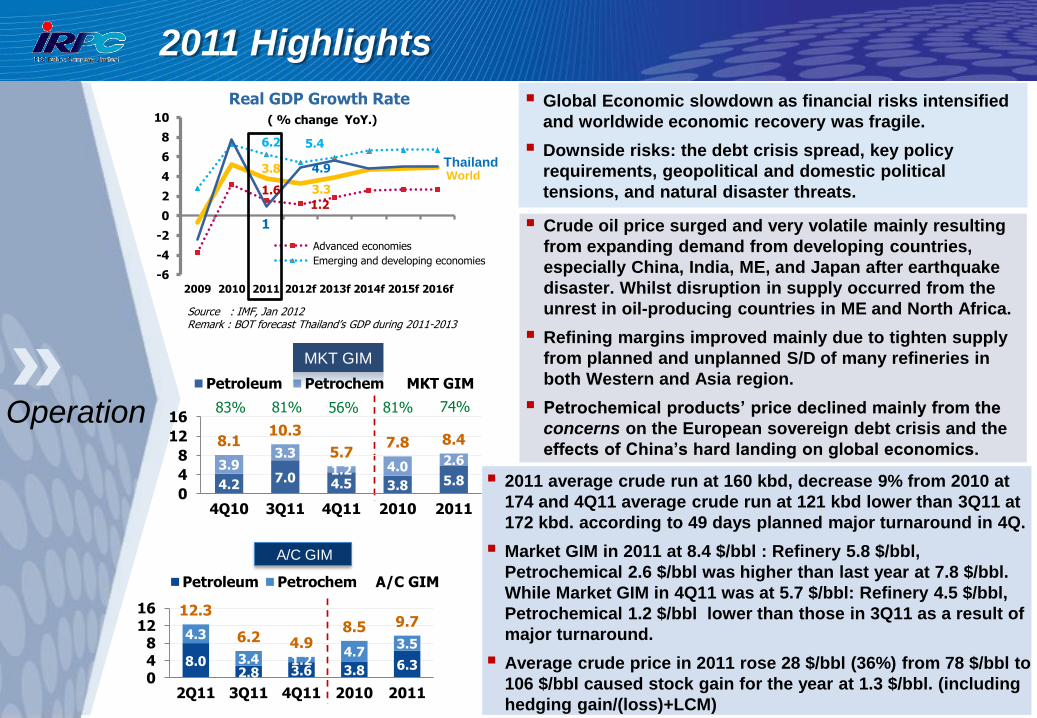
Global Economic slowdown as financial risks intensified
and worldwide economic recovery was fragile.
Downside risks: the debt crisis spread, key policy
requirements, geopolitical and domestic political
tensions, and natural disaster threats.
Crude oil price surged and very volatile mainly resulting
from expanding demand from developing countries,
especially China, India, ME, and Japan after earthquake
disaster. Whilst disruption in supply occurred from the
unrest in oil-producing countries in ME and North Africa.
Refining margins improved mainly due to tighten supply
from planned and unplanned S/D of many refineries in
both Western and Asia region.
Petrochemical products’ price declined mainly from the
concerns on the European sovereign debt crisis and the
effects of China’s hard landing on global economics.
3.8
3.3 1.6
1.2
6.2 5.4
1
4.9
-6
-4
-2
0
2
4
6
8
10
2009 2010 2011 2012f 2013f 2014f 2015f 2016f
Advanced economies
Emerging and developing economies
Real GDP Growth Rate
( % change YoY.)
World Thailand
Source : IMF, Jan 2012 Remark : BOT forecast Thailand’s GDP during 2011-2013
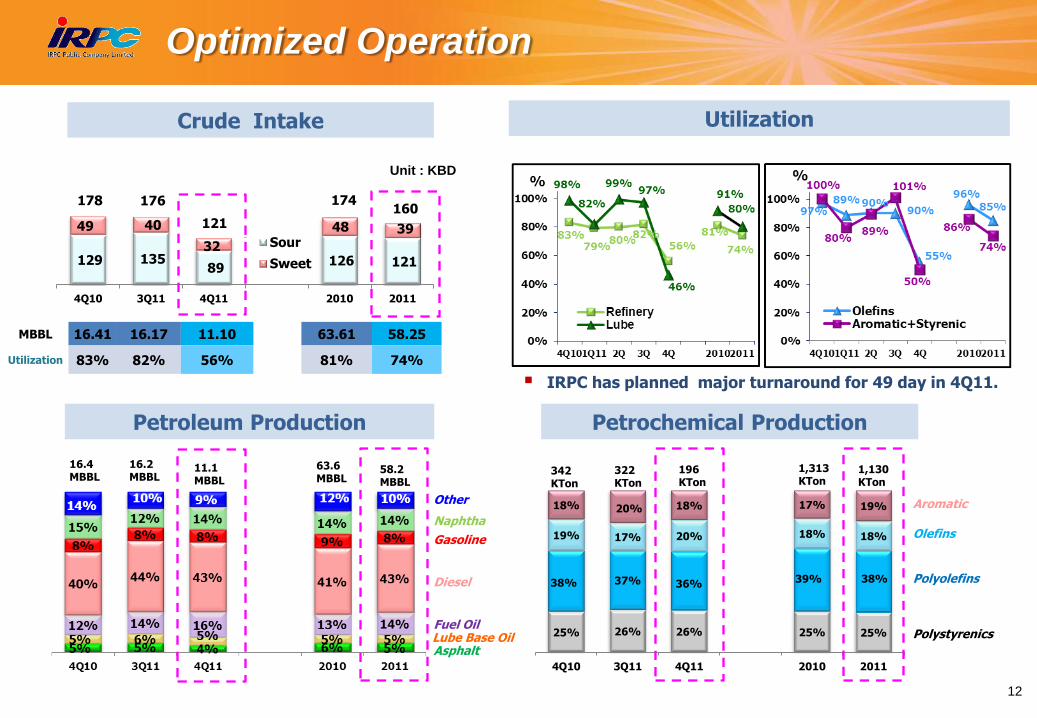
2011 average crude run at 160 kbd, decrease 9% from 2010 at
174 and 4Q11 average crude run at 121 kbd lower than 3Q11 at
172 kbd. according to 49 days planned major turnaround in 4Q.
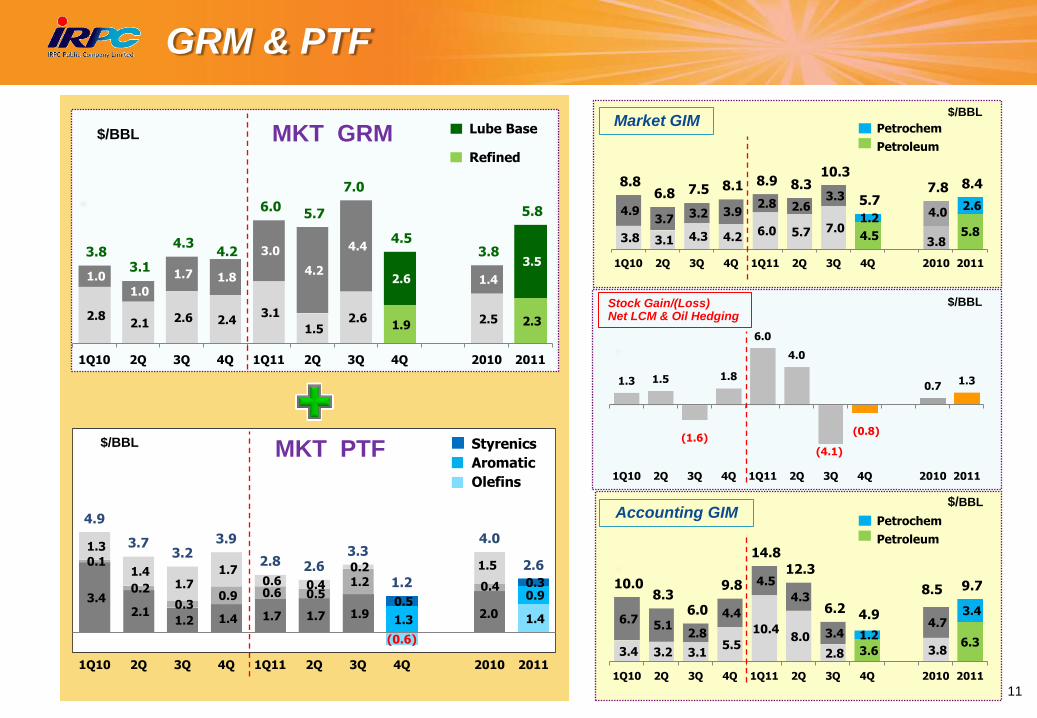
Market GIM in 2011 at 8.4 $/bbl : Refinery 5.8 $/bbl,
Petrochemical 2.6 $/bbl was higher than last year at 7.8 $/bbl.
While Market GIM in 4Q11 was at 5.7 $/bbl: Refinery 4.5 $/bbl,
Petrochemical 1.2 $/bbl lower than those in 3Q11 as a result of
major turnaround.
Average crude price in 2011 rose 28 $/bbl (36%) from 78 $/bbl to
106 $/bbl caused stock gain for the year at 1.3 $/bbl. (including
hedging gain/(loss)+LCM)
8.0 2.8 3.6 3.8 6.3
4.3
3.4 1.2 4.7
3.5
12.3
6.2 4.9 8.5 9.7
048
1216
2Q11 3Q11 4Q11 2010 2011
Petroleum Petrochem A/C GIM
A/C GIM
Operation
4.2 7.0 4.5 3.8 5.8
3.9 3.3
1.2 4.0 2.6
8.1 10.3
5.7 7.8 8.4
0
4
8
12
16
4Q10 3Q11 4Q11 2010 2011
Petroleum Petrochem MKT GIM
83% 81% 56%
MKT GIM
81% 74%
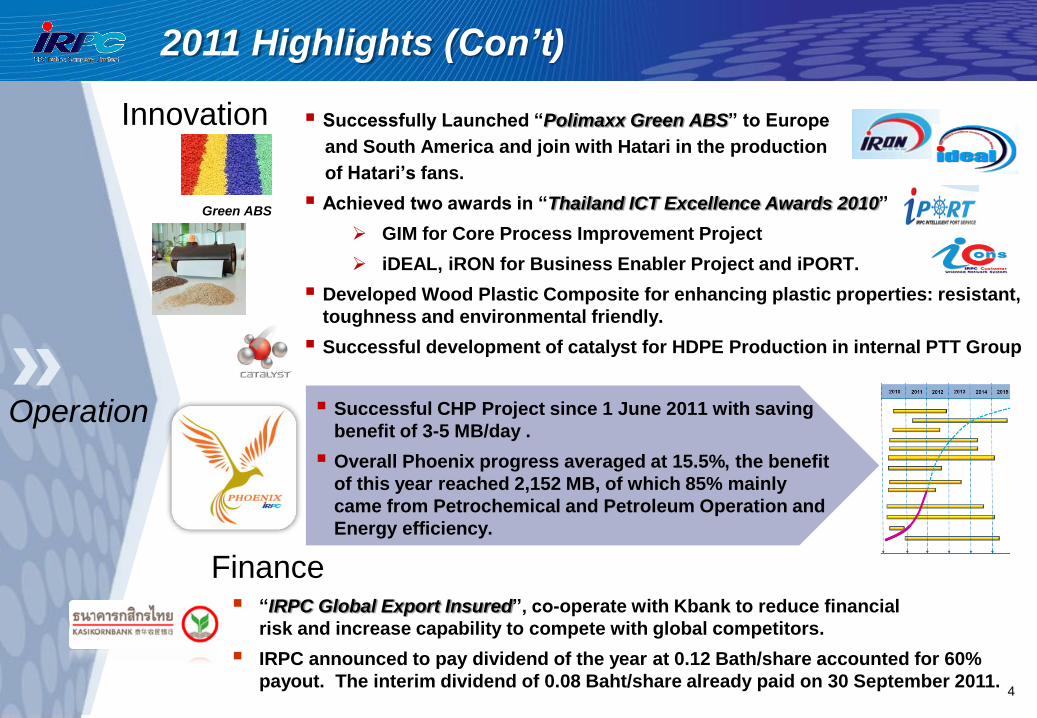
Successfully Launched “Polimaxx Green ABS” to Europe
and South America and join with Hatari in the production
of Hatari’s fans.
Achieved two awards in “Thailand ICT Excellence Awards 2010”
GIM for Core Process Improvement Project
iDEAL, iRON for Business Enabler Project and iPORT.
Developed Wood Plastic Composite for enhancing plastic properties: resistant,
toughness and environmental friendly.
Successful development of catalyst for HDPE Production in internal PTT Group
2011 Highlights (Con’t)
4
Operation
Innovation
Finance “IRPC Global Export Insured”, co-operate with Kbank to reduce financial
risk and increase capability to compete with global competitors.
IRPC announced to pay dividend of the year at 0.12 Bath/share accounted for 60%
payout. The interim dividend of 0.08 Baht/share already paid on 30 September 2011.
Successful CHP Project since 1 June 2011 with saving
benefit of 3-5 MB/day .
Overall Phoenix progress averaged at 15.5%, the benefit
of this year reached 2,152 MB, of which 85% mainly
came from Petrochemical and Petroleum Operation and
Energy efficiency.
TDAE
HDPE Pipe grade
Anti-dripping
ABS powder
(Impact Modifier)
Green ABS

5
Operation Performance
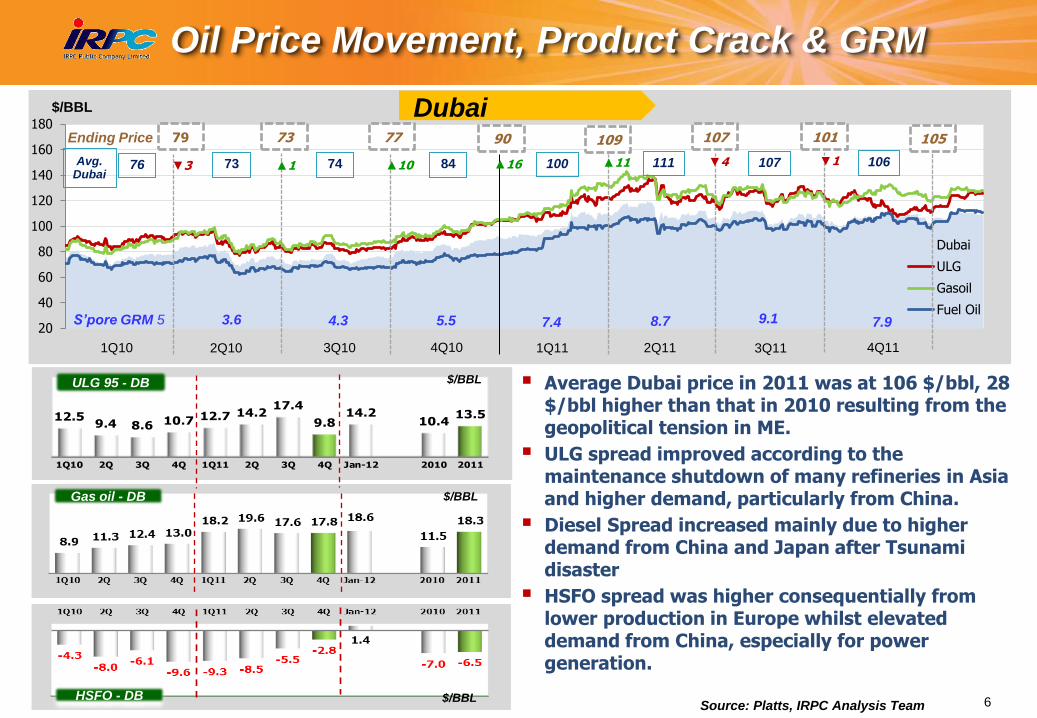
6 Source: Platts, IRPC Analysis Team
20
40
60
80
100
120
140
160
180
Dubai
ULG
Gasoil
Fuel Oil
79 73 77 90 109 107 101 Ending Price
100 111 107 76 73 74 84 Avg. Dubai
Dubai $/BBL
S’pore GRM 5 3.6 4.3 5.5 7.4 8.7 7.9
▲1 ▼3 ▲16 ▲10 ▲11 ▼4
Oil Price Movement, Product Crack & GRM
9.1
▼1
105
106
4Q10 1Q11 2Q11 3Q10 2Q10 1Q10 4Q11 3Q11
$/BBL Gas oil - DB
1Q10 2Q 3Q 4Q 1Q11 2Q 3Q 4Q Jan-12 2010 2011
12.59.4 8.6 10.7 12.7 14.2
17.4
9.814.2
10.413.5
$/BBL ULG 95 - DB
$/BBL HSFO - DB
Average Dubai price in 2011 was at 106 $/bbl, 28 $/bbl higher than that in 2010 resulting from the geopolitical tension in ME.
ULG spread improved according to the maintenance shutdown of many refineries in Asia and higher demand, particularly from China.
Diesel Spread increased mainly due to higher demand from China and Japan after Tsunami disaster
HSFO spread was higher consequentially from lower production in Europe whilst elevated demand from China, especially for power generation.
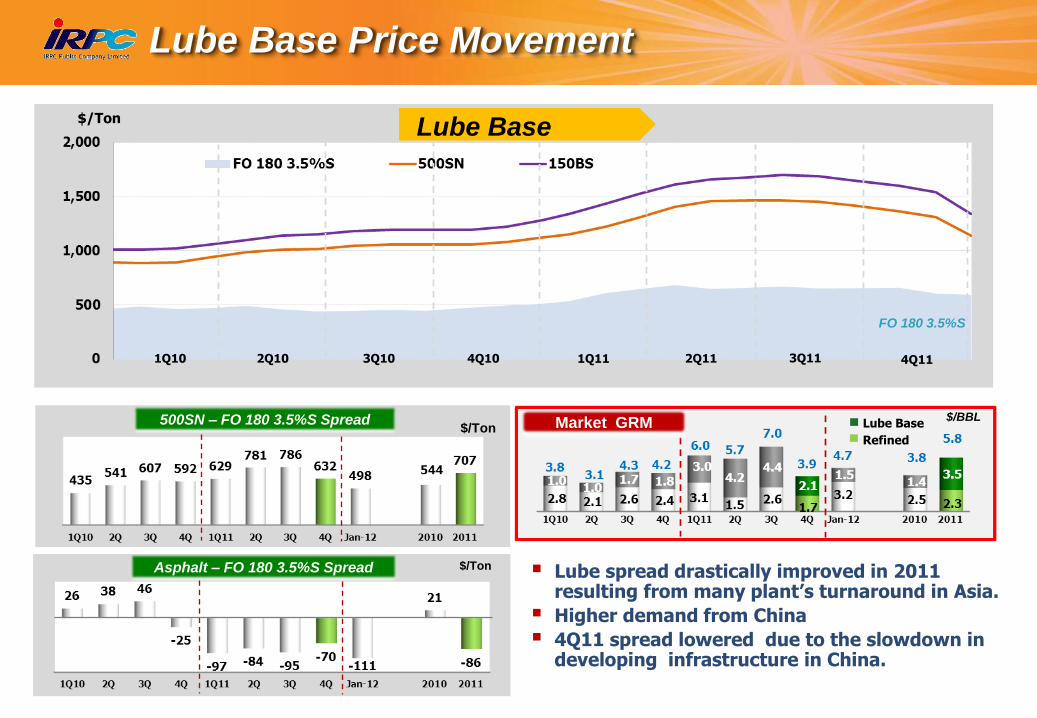
500SN – FO 180 3.5%S Spread
1Q10 3Q10 2Q10 4Q10
$/Ton
1Q11 2Q11 3Q11
Lube Base Price Movement
Lube Base
Asphalt – FO 180 3.5%S Spread
$/Ton
$/Ton
FO 180 3.5%S
4Q11
Lube Base
Refined
Market GRM $/BBL
Lube spread drastically improved in 2011 resulting from many plant’s turnaround in Asia.
Higher demand from China
4Q11 spread lowered due to the slowdown in developing infrastructure in China.
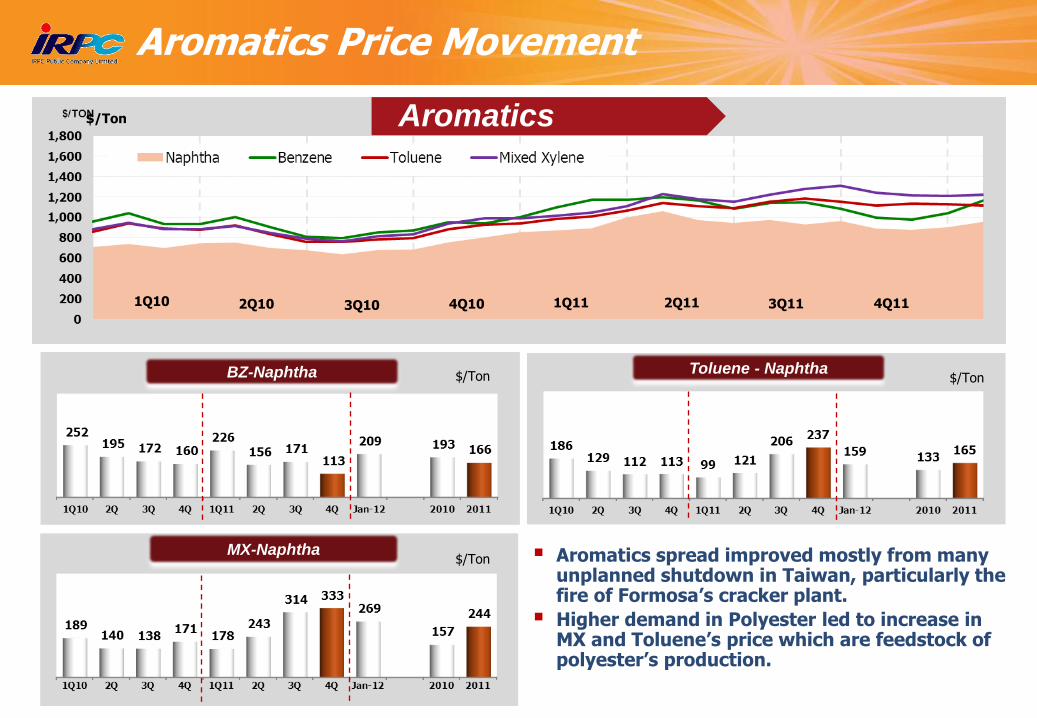
$/Ton
MX-Naphtha
BZ-Naphtha Toluene - Naphtha
Aromatics Price Movement
Aromatics
$/Ton $/Ton
$/Ton Aromatics spread improved mostly from many unplanned shutdown in Taiwan, particularly the fire of Formosa’s cracker plant.
Higher demand in Polyester led to increase in MX and Toluene’s price which are feedstock of polyester’s production.
1Q10 3Q10 2Q10 4Q10 1Q11 3Q11 4Q11 2Q11
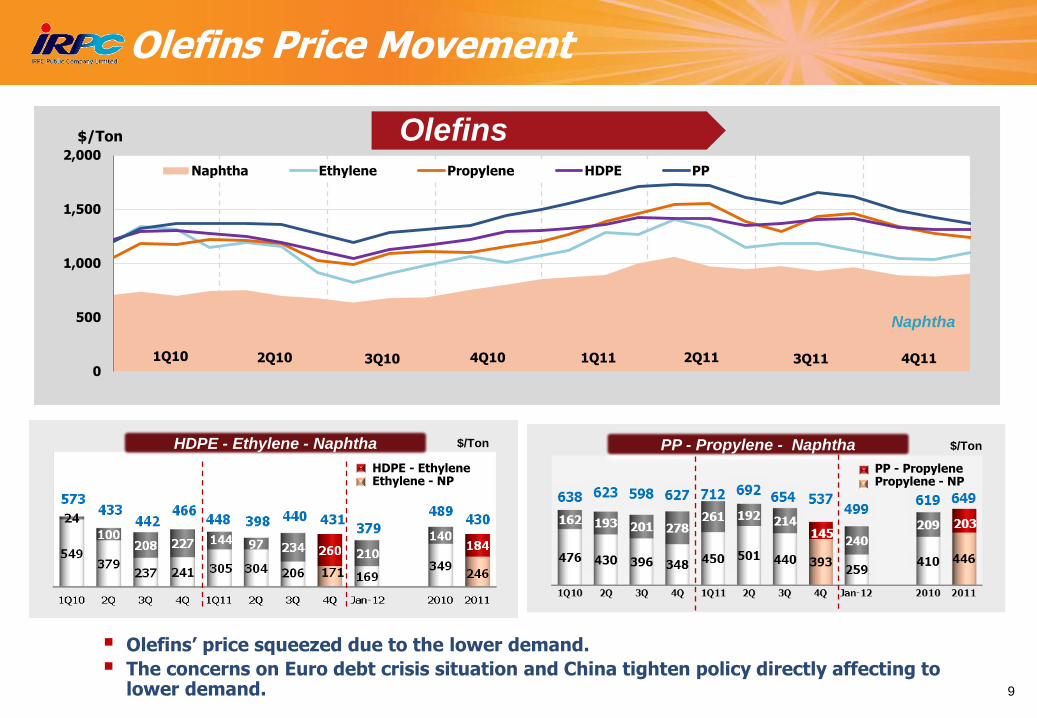
0
500
1,000
1,500
2,000Naphtha Ethylene Propylene HDPE PP
$/Ton
Olefins Price Movement
HDPE - Ethylene - Naphtha $/Ton $/Ton PP - Propylene - Naphtha
Olefins
Naphtha
HDPE - Ethylene Ethylene - NP
PP - Propylene Propylene - NP
Olefins’ price squeezed due to the lower demand.
The concerns on Euro debt crisis situation and China tighten policy directly affecting to lower demand.
431
9
1Q10 3Q10 2Q10 4Q10 1Q11 3Q11 4Q11 2Q11
$/Ton
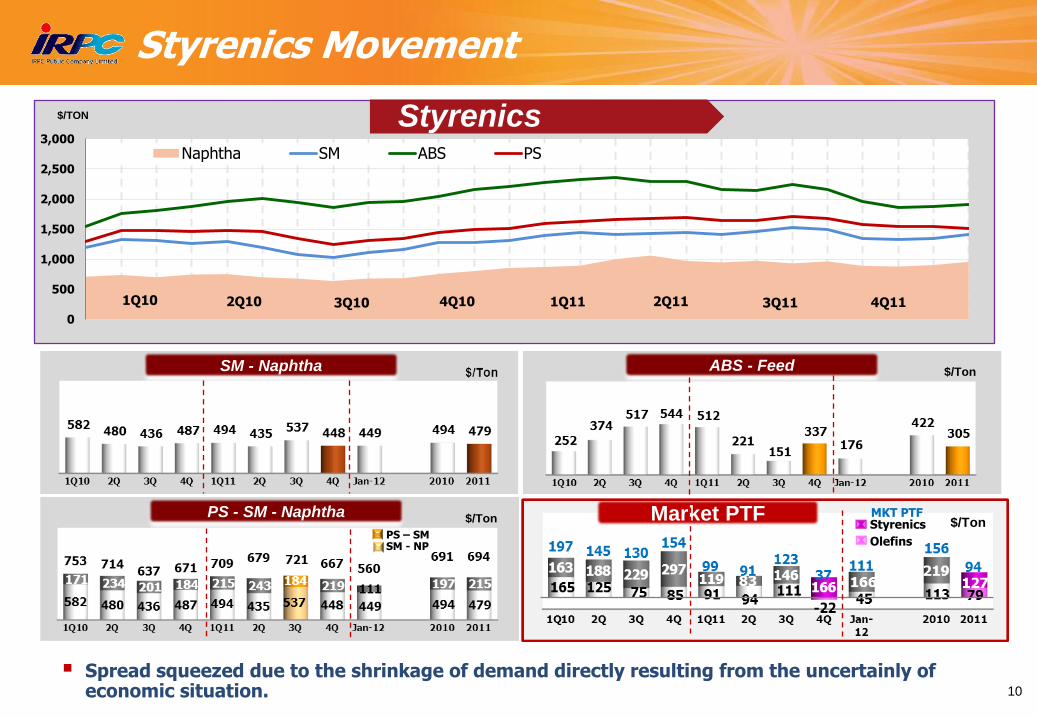
Styrenics Movement
1Q10 3Q10 2Q10 4Q10 1Q11 2Q11 3Q11
10
$/Ton
$/Ton PS - SM - Naphtha
ABS - Feed
PS – SM SM - NP
Styrene
$/Ton Market PTF Styrenics
Olefins
MKT PTF
SM - Naphtha
Spread squeezed due to the shrinkage of demand directly resulting from the uncertainly of economic situation.
0
500
1,000
1,500
2,000
2,500
3,000
$/TON
Naphtha SM ABS PS
Styrenics
1Q10 3Q10 2Q10 4Q10 1Q11 3Q11 4Q11 2Q11
GRM & PTF
11
2.8 2.1 2.6 2.4
3.1
1.5 2.6
1.9 2.5 2.3
1.0
1.0
1.7 1.8
3.0
4.2
4.4
2.6 1.4
3.5 3.8
3.1
4.3 4.2
6.0 5.7
7.0
4.5 3.8
5.8
1Q10 2Q 3Q 4Q 1Q11 2Q 3Q 4Q 2010 2011
3.4 2.1
1.2 1.4 1.7 1.7 1.9
(0.6)
2.0 1.4
0.1
0.2
0.3 0.9 0.6 0.5
1.2
1.3
0.4 0.9
1.3
1.4 1.7
1.7 0.6 0.4
0.2
0.5
1.5
0.3
4.9
3.7 3.2
3.9
2.8 2.6 3.3
1.2
4.0
2.6
1Q10 2Q 3Q 4Q 1Q11 2Q 3Q 4Q 2010 2011
Lube Base
Refined
$/BBL
3.8 3.1 4.3 4.2 6.0 5.7 7.0
4.5 3.8
5.8
4.9 3.7 3.2 3.9
2.8 2.6 3.3
1.2 4.0 2.6
8.8 6.8 7.5 8.1 8.9 8.3
10.3
5.7 7.8 8.4
1Q10 2Q 3Q 4Q 1Q11 2Q 3Q 4Q 2010 2011
Market GIM $/BBL
3.4 3.2 3.1 5.5
10.4 8.0
2.8 3.6 3.8 6.3
6.7 5.1
2.8
4.4
4.5
4.3
3.4 1.2 4.7
3.4
10.0 8.3
6.0
9.8
14.8
12.3
6.2 4.9
8.5 9.7
1Q10 2Q 3Q 4Q 1Q11 2Q 3Q 4Q 2010 2011
Accounting GIM $/BBL
MKT GRM
MKT PTF
Petrochem
Petroleum
1.3 1.5
(1.6)
1.8
6.0
4.0
(4.1)
(0.8)
0.7 1.3
1Q10 2Q 3Q 4Q 1Q11 2Q 3Q 4Q 2010 2011
Styrenics
Aromatic
Olefins
Petrochem
Petroleum
Stock Gain/(Loss) Net LCM & Oil Hedging
$/BBL
$/BBL
Optimized Operation
129 135 89
126 121
49 40
32
48 39
178 176
121
174 160
4Q10 3Q11 4Q11 2010 2011
Sour
Sweet
Crude Intake
Petroleum Production Petrochemical Production
MBBL 16.41 16.17 11.10 63.61 58.25
Utilization 83% 82% 56% 81% 74%
16.4 MBBL
16.2 MBBL
11.1 MBBL
Other
Naphtha
Gasoline
Diesel
Fuel Oil Lube Base Oil
Asphalt
Unit : KBD
63.6 MBBL
58.2 MBBL
Utilization
IRPC has planned major turnaround for 49 day in 4Q11.
12
25% 26% 26% 25% 25%
38% 37% 36% 39% 38%
19% 17% 20% 18% 18%
18% 20% 18% 17% 19%
4Q10 3Q11 4Q11 2010 2011
Aromatic
Olefins
Polystyrenics
342 KTon
322 KTon
196 KTon
1,313 KTon
1,130 KTon
Polyolefins
13
Revenue Structure
Sale Volume (MBBL) 2011 2010
1. Gasoline 4.72 5.45
2. Gas Oil 24.79 26.11
3. Fuel Oil 8.41 7.55
4. Lube Base Oil & Asphalt 6.11 6.38
5. Others 5.34 4.85
Petroleum 49.37 50.34
1. Aromatics 1.86 2.05
2. Olefins 5.07 5.24
3. Styrenics 1.64 2.52
4. Polyol 0.11 0.12
Petrochem 8.69 9.92
Total 58.06 60.26
Refinery 62%
Lube 10%
Olefins 3%
Polyolefins
12%
Polyol
0.5%
Aromatics
4%
Polystyrenics
7%
Power & UT 1.2% Port & Tank
0.2%
Land & Others 0.4%
2010 200,744 MB
Refinery 66%
Lube 10%
Olefins 3%
Polyolefins 10%
Polyol 0.5%
Aromatics 4%
Polystyrenics 5%
Power & UT 1.3%
Port & Tank 0.2%
Land & Others 0.3%
2011 237,757
MB
76% of revenue came from refineries’ product.
Average 35% of both businesses were exported.
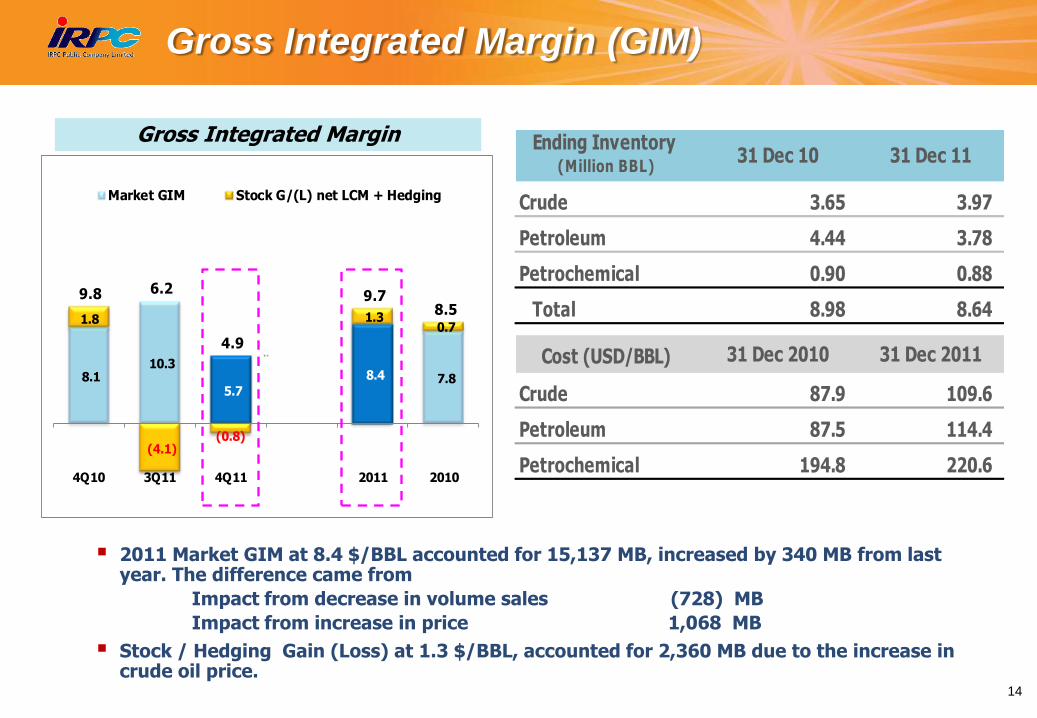
Gross Integrated Margin (GIM)
8.1 10.3
5.7
8.4 7.8
1.8
(4.1)(0.8)
1.3 0.7
9.8 6.2
4.9
9.7 8.5
4Q10 3Q11 4Q11 2011 2010
Market GIM Stock G/(L) net LCM + Hedging
Ending Inventory (Million BBL)
31 Dec 10 31 Dec 11
Crude 3.65 3.97
Petroleum 4.44 3.78
Petrochemical 0.90 0.88
Total 8.98 8.64
Cost (USD/BBL) 31 Dec 2010 31 Dec 2011
Crude 87.9 109.6
Petroleum 87.5 114.4
Petrochemical 194.8 220.6
2011 Market GIM at 8.4 $/BBL accounted for 15,137 MB, increased by 340 MB from last year. The difference came from
Impact from decrease in volume sales (728) MB
Impact from increase in price 1,068 MB
Stock / Hedging Gain (Loss) at 1.3 $/BBL, accounted for 2,360 MB due to the increase in crude oil price.
14
Gross Integrated Margin

15
Financial Performance
16
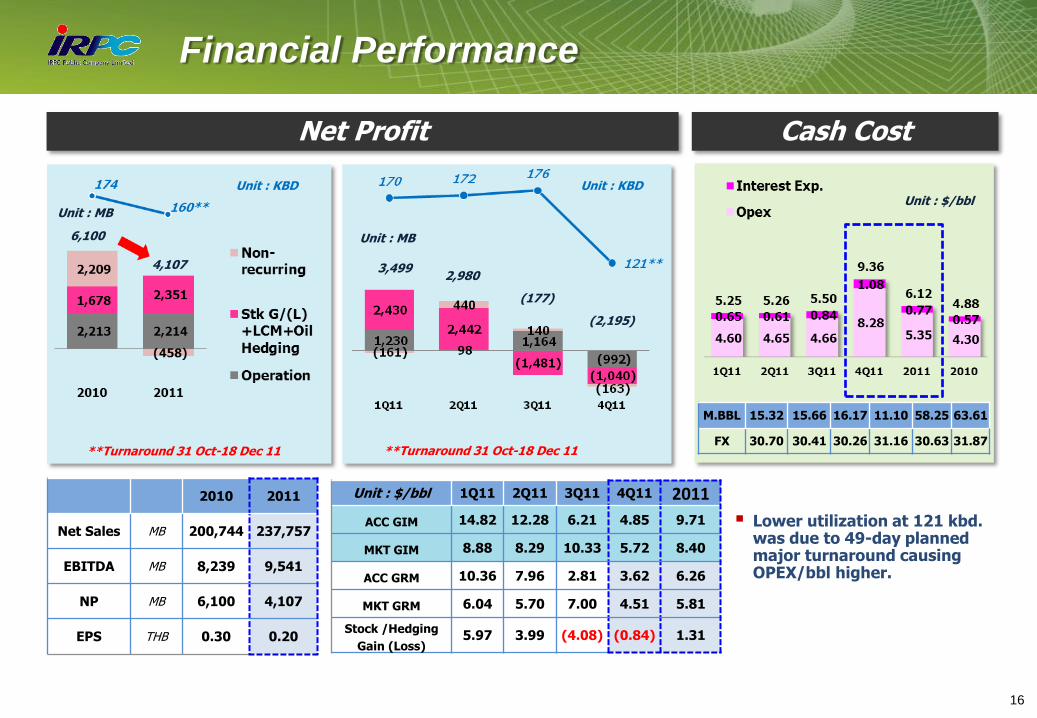
Financial Performance
Unit : $/bbl 1Q11 2Q11 3Q11 4Q11 2011
ACC GIM 14.82 12.28 6.21 4.85 9.71
MKT GIM 8.88 8.29 10.33 5.72 8.40
ACC GRM 10.36 7.96 2.81 3.62 6.26
MKT GRM 6.04 5.70 7.00 4.51 5.81
Stock /Hedging
Gain (Loss) 5.97 3.99 (4.08) (0.84) 1.31
Net Profit
2010 2011
Net Sales MB 200,744 237,757
EBITDA MB 8,239 9,541
NP MB 6,100 4,107
EPS THB 0.30 0.20
**Turnaround 31 Oct-18 Dec 11
Cash Cost
Unit : MB
Unit : MB
Unit : KBD Unit : KBD Unit : $/bbl
**Turnaround 31 Oct-18 Dec 11
M.BBL 15.32 15.66 16.17 11.10 58.25 63.61
FX 30.70 30.41 30.26 31.16 30.63 31.87
6,100
4,107 3,499 2,980
(177)
(2,195)
Lower utilization at 121 kbd. was due to 49-day planned major turnaround causing OPEX/bbl higher.
17
NP Variance Analysis Y2011 vs Y2010
2,213 2,214
728 1,068
815 1,154
1,678
672
2,351
2,209
570
(458)
956
1,415
274
(4,000)
(2,000)
-
2,000
4,000
6,000
8,000
10,000
Y2010 Volume Mkt Price CHP OtherRev./(Exp.)
Stk G/(L)+LCM+Oil
Hedge
Asset W/O MTMsecurities
FX FinCost&Others
Y2011
6,100 4,107 -1,994 MB
Asset Write-Off MTM Securities
FX MTM Fin Contract & Others
Crude run 14 KBD
GIM 0.6 $/BBL
- T/A - Boiler
1 MB
Operation
Non-recurring
Stock Gain/(Loss)+ LCM + Oil Hedging
= Asset W/O + MTM Securities + FX + MTM Fin Contract & Others
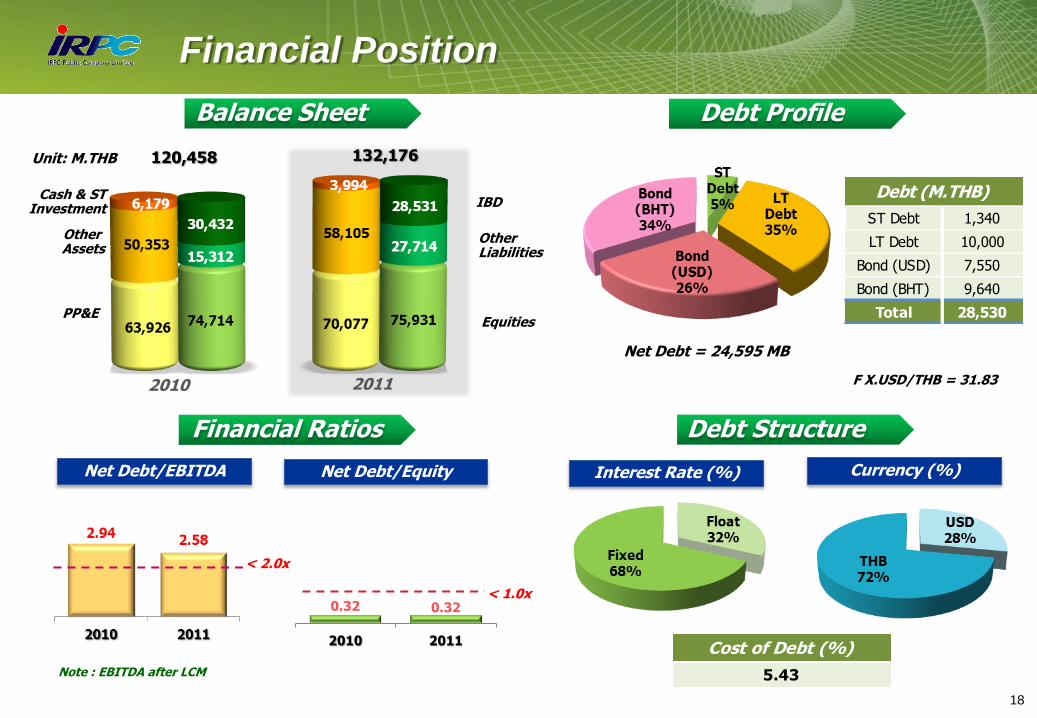
0.32 0.32
2010 2011
< 1.0x
Note : EBITDA after LCM
Cost of Debt (%)
5.43
18
Net Debt/EBITDA Net Debt/Equity
Financial Ratios
Balance Sheet
Debt Structure
Debt Profile
Interest Rate (%) Currency (%)
Cash & ST Investment
PP&E
IBD
Other Liabilities
Equities
2010 2011
120,458 132,176
Other Assets
Unit: M.THB
ST Debt 1,340
LT Debt 10,000
Bond (USD) 7,550
Bond (BHT) 9,640
Total 28,530
Debt (M.THB)
Net Debt = 24,595 MB
Fixed
Float USD
THB
Financial Position
< 2.0x
F X.USD/THB = 31.83
19
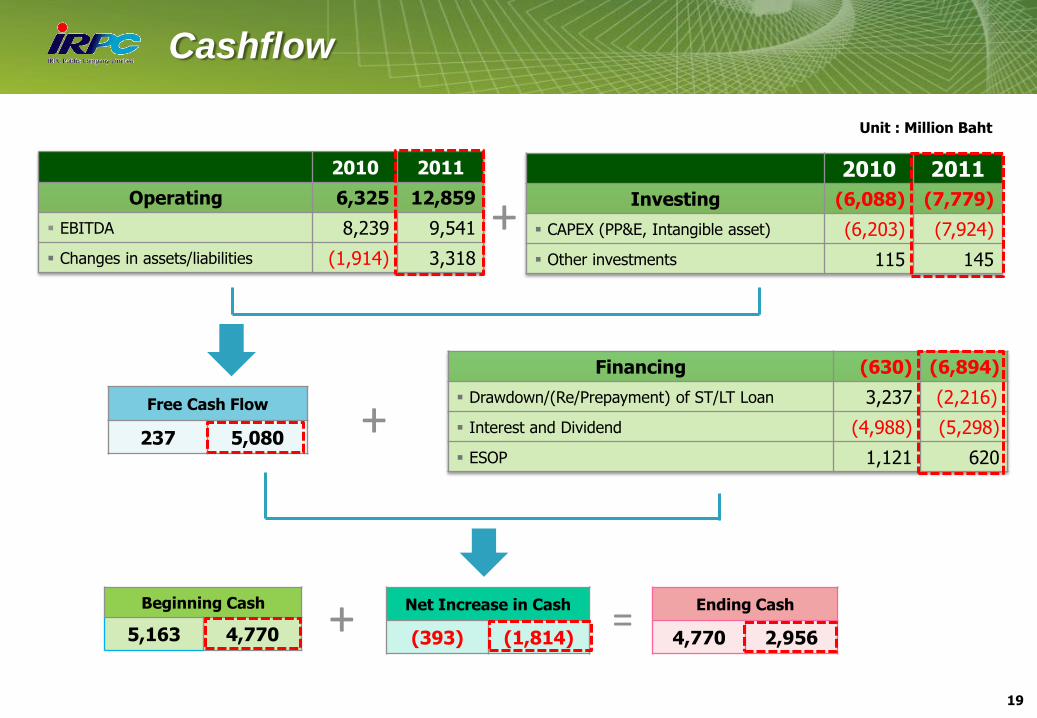
Cashflow
Unit : Million Baht
2010 2011
Operating 6,325 12,859
EBITDA 8,239 9,541
Changes in assets/liabilities (1,914) 3,318
+
+ =
Financing (630) (6,894)
Drawdown/(Re/Prepayment) of ST/LT Loan 3,237 (2,216)
Interest and Dividend (4,988) (5,298)
ESOP 1,121 620
Free Cash Flow
237 5,080
2010 2011
Investing (6,088) (7,779)
CAPEX (PP&E, Intangible asset) (6,203) (7,924)
Other investments 115 145
Ending Cash
4,770 2,956
Net Increase in Cash
(393) (1,814)
Beginning Cash
5,163 4,770
+
20
Outlook Industry
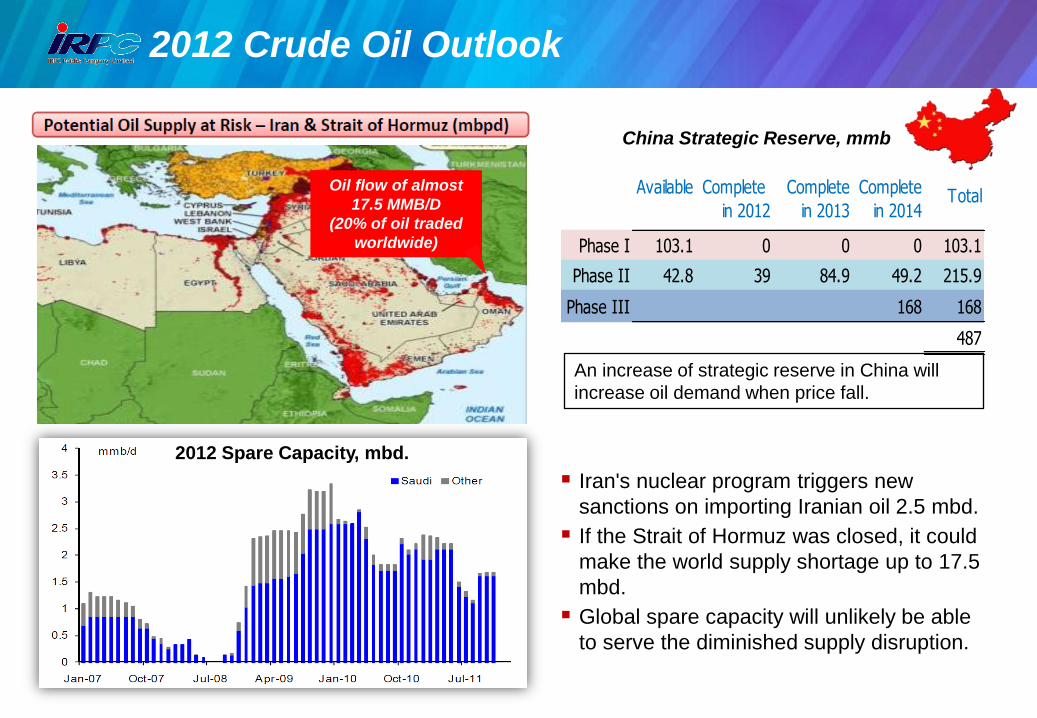
2012 Crude Oil Outlook
Available Complete
in 2012
Complete
in 2013
Complete
in 2014Total
Phase I 103.1 0 0 0 103.1
Phase II 42.8 39 84.9 49.2 215.9
Phase III 168 168
487
China Strategic Reserve, mmb
An increase of strategic reserve in China will
increase oil demand when price fall.
China Strategic Reserve, m.bbl. Available Complete
in 2012
Complete
in 2013
Complete
in 2014Total
Phase I 103.1 0 0 0 103.1
Phase II 42.8 39 84.9 49.2 215.9
Phase III 168 168
487
2012 Spare Capacity, mbd.
Iran's nuclear program triggers new
sanctions on importing Iranian oil 2.5 mbd.
If the Strait of Hormuz was closed, it could
make the world supply shortage up to 17.5
mbd.
Global spare capacity will unlikely be able
to serve the diminished supply disruption.
Oil flow of almost
17.5 MMB/D
(20% of oil traded
worldwide)
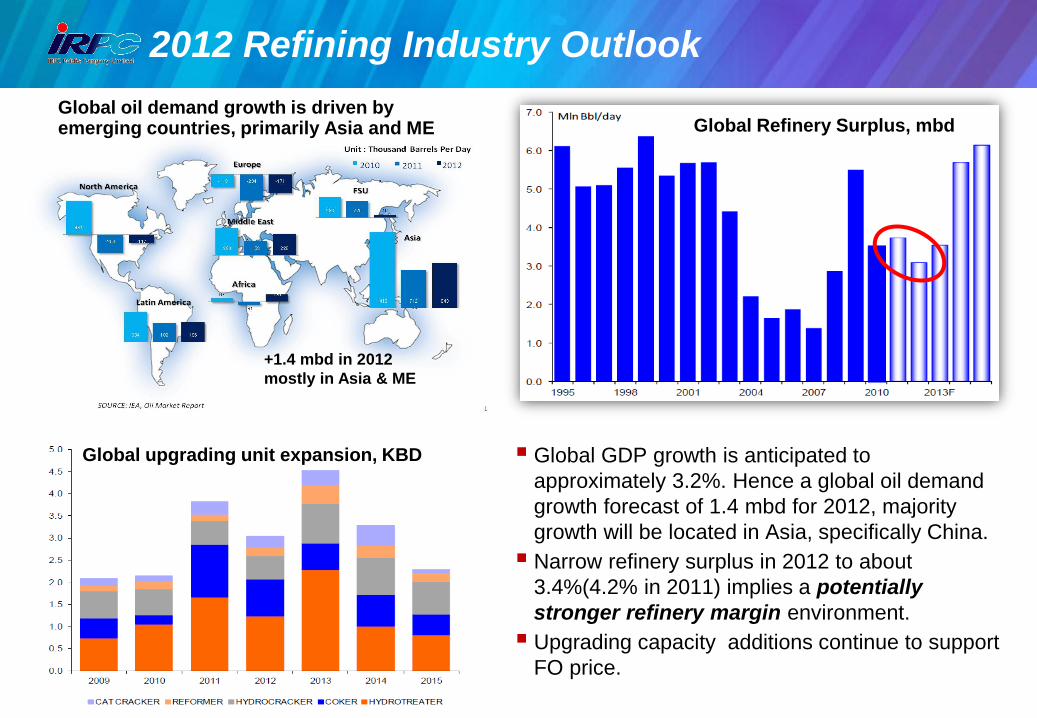
2012 Refining Industry Outlook
Global Refinery Surplus, mbd
Global upgrading unit expansion, KBD Global GDP growth is anticipated to
approximately 3.2%. Hence a global oil demand
growth forecast of 1.4 mbd for 2012, majority
growth will be located in Asia, specifically China.
Narrow refinery surplus in 2012 to about
3.4%(4.2% in 2011) implies a potentially
stronger refinery margin environment.
Upgrading capacity additions continue to support
FO price.
Global oil demand growth is driven by emerging countries, primarily Asia and ME
+1.4 mbd in 2012
mostly in Asia & ME
23
50%
60%
70%
80%
90%
100%
0.0
1.0
2.0
3.0
4.0
5.0
2006 2007 2008 2009 2010 2011 2012 2013 2014 2015 2016
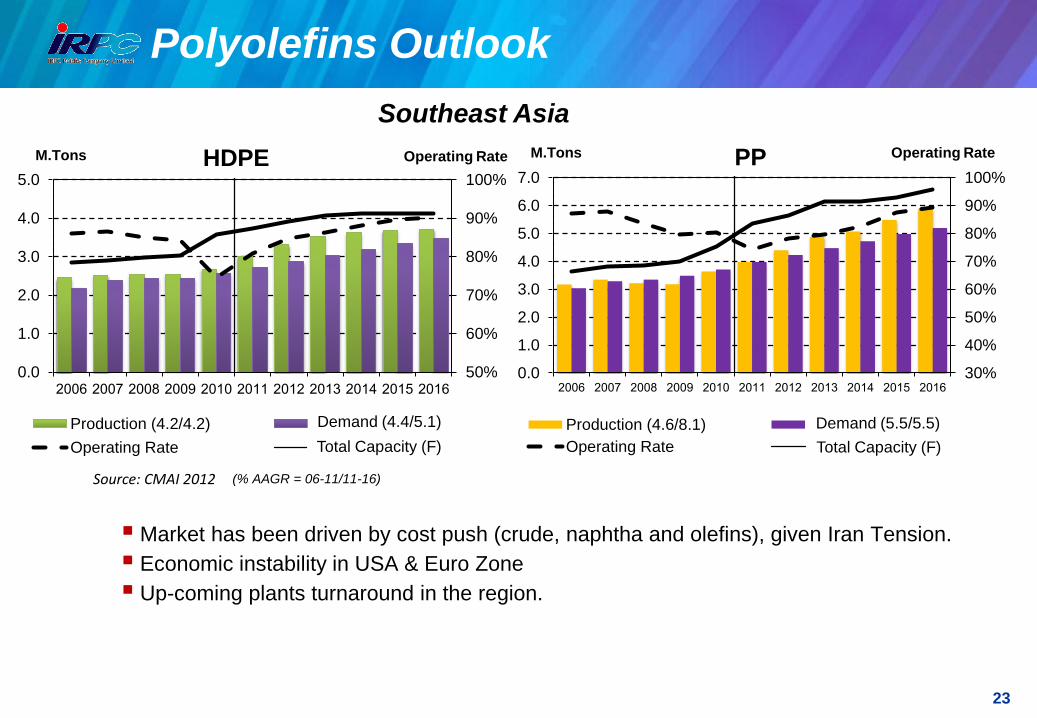
Production (4.2/4.2) Domestic Demand (4.4/5.1)
Operating Rate Forecast
Polyolefins Outlook
Source: CMAI 2012 (% AAGR = 06-11/11-16)
30%
40%
50%
60%
70%
80%
90%
100%
0.0
1.0
2.0
3.0
4.0
5.0
6.0
7.0
2006 2007 2008 2009 2010 2011 2012 2013 2014 2015 2016
Production (4.6/8.1) Domestic Demand (5.5/5.5)
Operating Rate Forecast
Southeast Asia
Market has been driven by cost push (crude, naphtha and olefins), given Iran Tension.
Economic instability in USA & Euro Zone
Up-coming plants turnaround in the region.
M.Tons HDPE PP Operating Rate Operating Rate
Demand (4.4/5.1) Demand (5.5/5.5)
M.Tons
Total Capacity (F) Total Capacity (F)
24
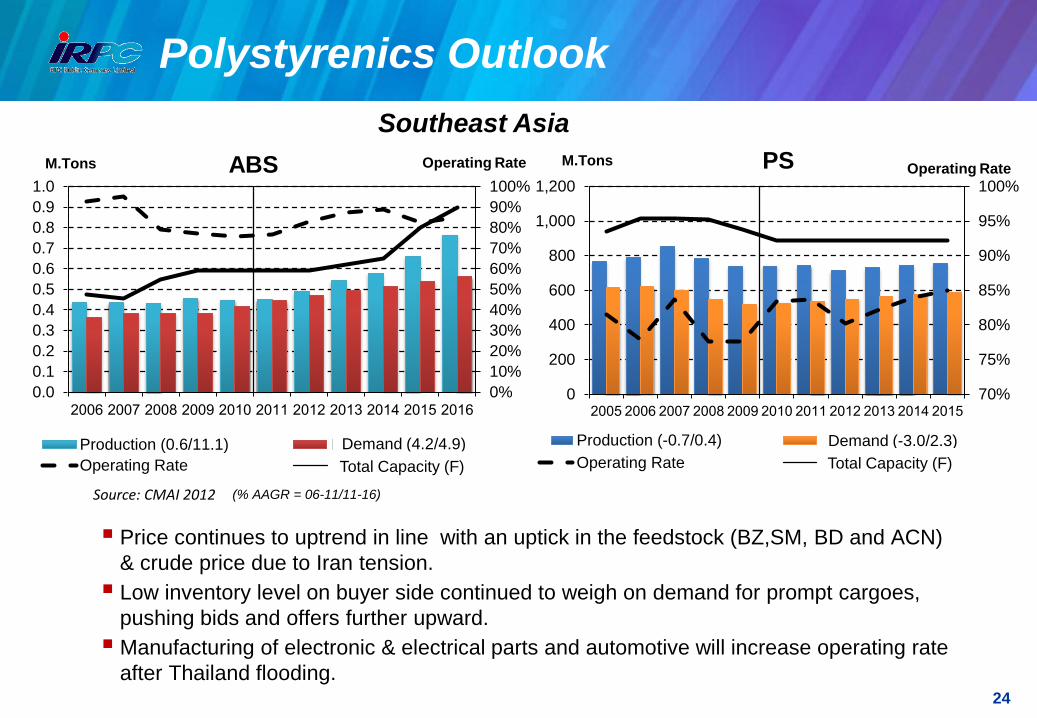
Polystyrenics Outlook
0%
10%
20%
30%
40%
50%
60%
70%
80%
90%
100%
0.0
0.1
0.2
0.3
0.4
0.5
0.6
0.7
0.8
0.9
1.0
2006 2007 2008 2009 2010 2011 2012 2013 2014 2015 2016
Production (0.6/11.1) Domestic Demand (4.2/4.9)
Operating Rate Forecast
70%
75%
80%
85%
90%
95%
100%
0
200
400
600
800
1,000
1,200
2005 2006 2007 2008 2009 2010 2011 2012 2013 2014 2015
Production (-0.7/0.4) Domestic Demand (-3.0/2.3)
Operating Rate Forecast
Price continues to uptrend in line with an uptick in the feedstock (BZ,SM, BD and ACN)
& crude price due to Iran tension.
Low inventory level on buyer side continued to weigh on demand for prompt cargoes,
pushing bids and offers further upward.
Manufacturing of electronic & electrical parts and automotive will increase operating rate
after Thailand flooding.
Southeast Asia
M.Tons ABS PS M.Tons Operating Rate Operating Rate
Demand (-3.0/2.3)
Source: CMAI 2012 (% AAGR = 06-11/11-16)
Demand (4.2/4.9)
Total Capacity (F) Total Capacity (F)

25
Project Progress
TIME
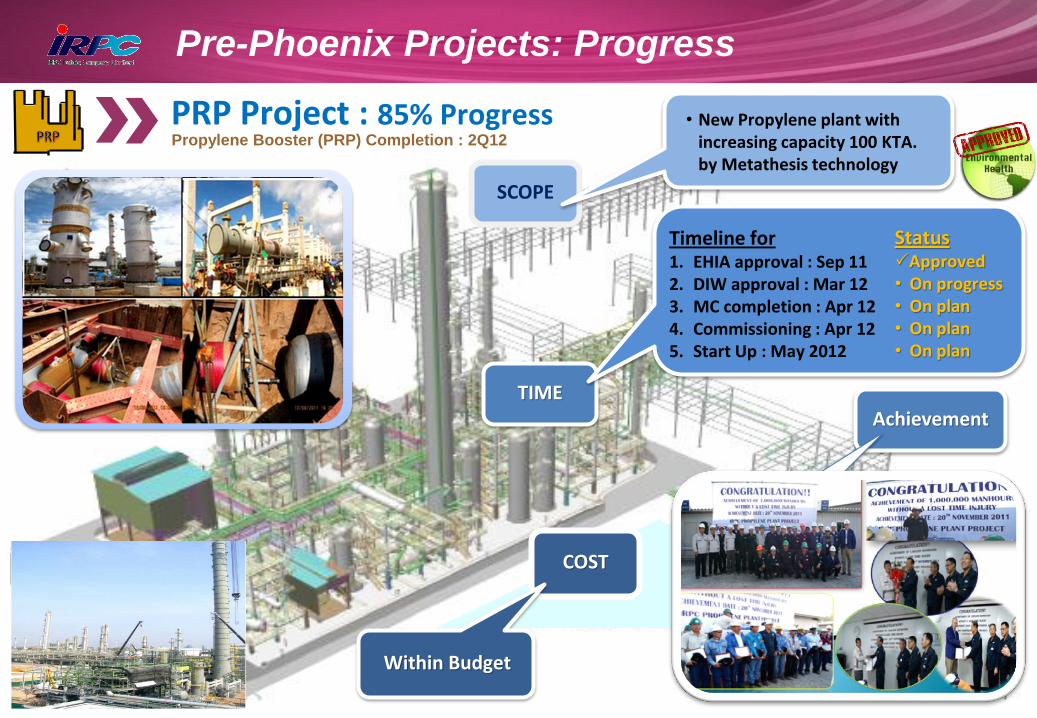
Pre-Phoenix Projects: Progress
PRP Project : 85% Progress
COST
Propylene Booster (PRP) Completion : 2Q12
Timeline for 1. EHIA approval : Sep 11 2. DIW approval : Mar 12 3. MC completion : Apr 12 4. Commissioning : Apr 12 5. Start Up : May 2012
Status Approved • On progress • On plan • On plan • On plan
Within Budget
Achievement
SCOPE
• New Propylene plant with increasing capacity 100 KTA. by Metathesis technology
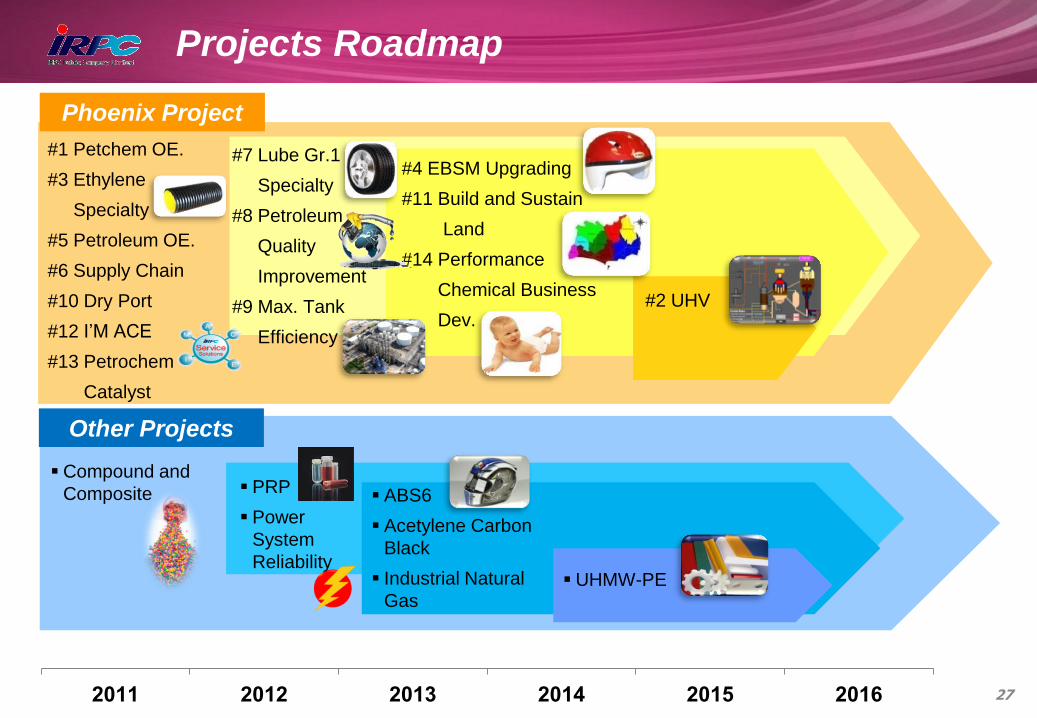
Projects Roadmap
2011 2012 2013 2014 2015 2016
#1 Petchem OE.
#3 Ethylene
Specialty
#5 Petroleum OE.
#6 Supply Chain
#10 Dry Port
#12 I’M ACE
#13 Petrochem
Catalyst
#7 Lube Gr.1
Specialty
#8 Petroleum
Quality
Improvement
#9 Max. Tank
Efficiency
#4 EBSM Upgrading
#11 Build and Sustain
Land
#14 Performance
Chemical Business
Dev. #2 UHV
Phoenix Project
ABS6
Acetylene Carbon
Black
Industrial Natural
Gas
PRP
Power
System
Reliability
Other Projects
UHMW-PE
Compound and
Composite
27
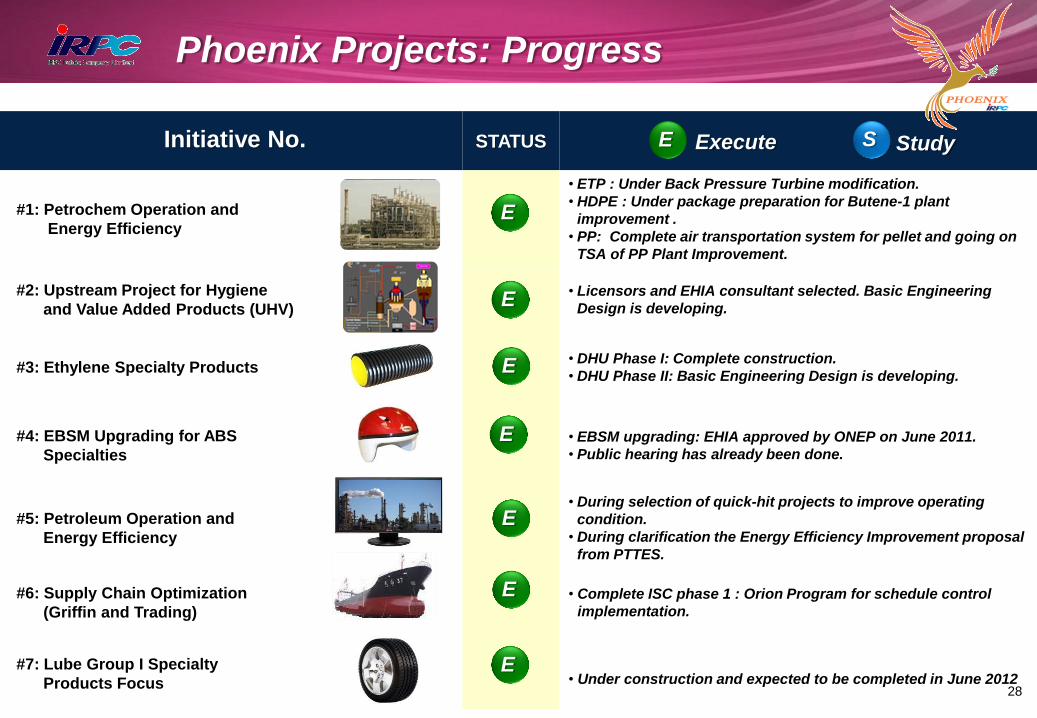
Initiative No. STATUS
#1: Petrochem Operation and
Energy Efficiency
• ETP : Under Back Pressure Turbine modification.
• HDPE : Under package preparation for Butene-1 plant
improvement .
• PP: Complete air transportation system for pellet and going on
TSA of PP Plant Improvement.
#2: Upstream Project for Hygiene
and Value Added Products (UHV)
• Licensors and EHIA consultant selected. Basic Engineering
Design is developing.
#3: Ethylene Specialty Products • DHU Phase I: Complete construction.
• DHU Phase II: Basic Engineering Design is developing.
#4: EBSM Upgrading for ABS
Specialties
• EBSM upgrading: EHIA approved by ONEP on June 2011.
• Public hearing has already been done.
#5: Petroleum Operation and
Energy Efficiency
• During selection of quick-hit projects to improve operating
condition.
• During clarification the Energy Efficiency Improvement proposal
from PTTES.
#6: Supply Chain Optimization
(Griffin and Trading)
• Complete ISC phase 1 : Orion Program for schedule control
implementation.
#7: Lube Group I Specialty
Products Focus • Under construction and expected to be completed in June 2012
Execute Study
Phoenix Projects: Progress
E
E
E
E
E
E
E
E
S
28
25%
50%
75%
100%
0%
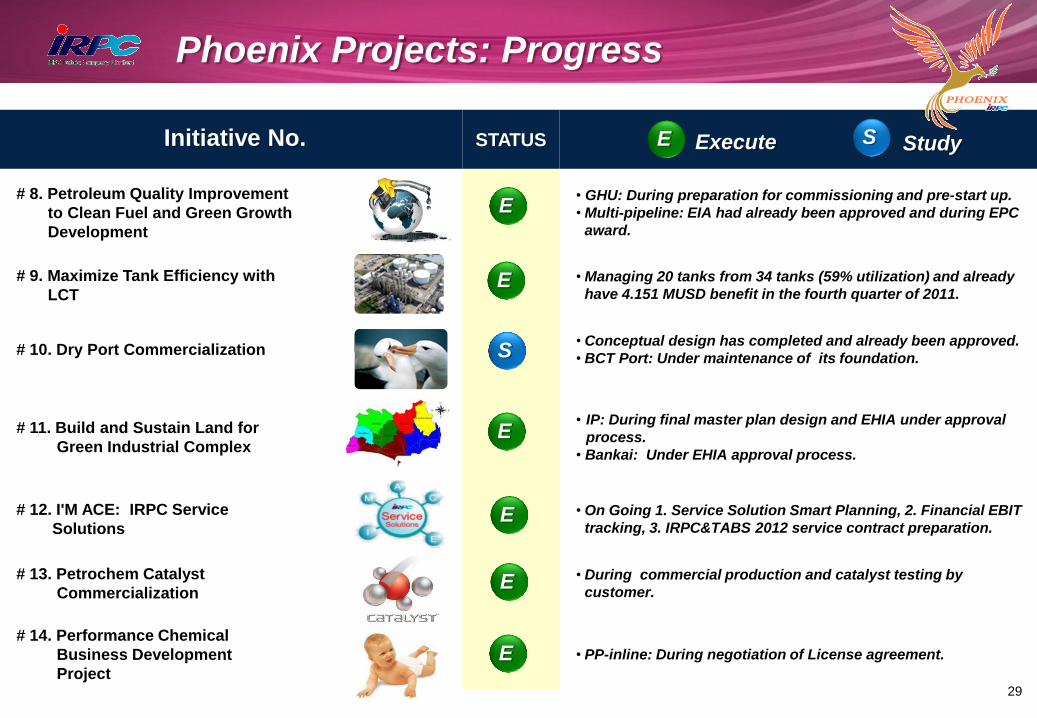
Initiative No. STATUS
# 8. Petroleum Quality Improvement
to Clean Fuel and Green Growth
Development
• GHU: During preparation for commissioning and pre-start up.
• Multi-pipeline: EIA had already been approved and during EPC
award.
# 9. Maximize Tank Efficiency with
LCT
• Managing 20 tanks from 34 tanks (59% utilization) and already
have 4.151 MUSD benefit in the fourth quarter of 2011.
# 10. Dry Port Commercialization • Conceptual design has completed and already been approved.
• BCT Port: Under maintenance of its foundation.
# 11. Build and Sustain Land for
Green Industrial Complex
• IP: During final master plan design and EHIA under approval
process.
• Bankai: Under EHIA approval process.
# 12. I'M ACE: IRPC Service
Solutions
• On Going 1. Service Solution Smart Planning, 2. Financial EBIT
tracking, 3. IRPC&TABS 2012 service contract preparation.
# 13. Petrochem Catalyst
Commercialization
• During commercial production and catalyst testing by
customer.
# 14. Performance Chemical
Business Development
Project
• PP-inline: During negotiation of License agreement.
Execute Study
Phoenix Projects: Progress
S
E
E
E
E
E
E
E S
29
25%
50%
75%
100%
0%
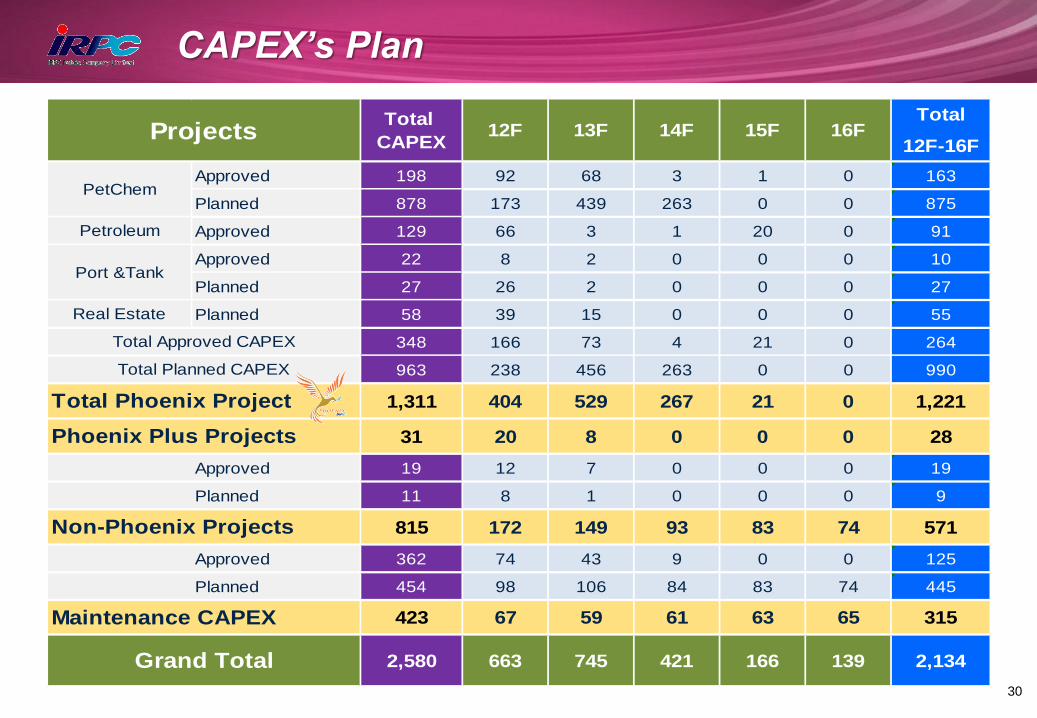
CAPEX’s Plan
30
25%
50%
75%
100%
0%
Total
12F-16F
Approved 198 92 68 3 1 0 163
Planned 878 173 439 263 0 0 875
Approved 129 66 3 1 20 0 91
Approved 22 8 2 0 0 0 10
Planned 27 26 2 0 0 0 27
Planned 58 39 15 0 0 0 55
348 166 73 4 21 0 264
963 238 456 263 0 0 990
1,311 404 529 267 21 0 1,221
31 20 8 0 0 0 28
Approved 19 12 7 0 0 0 19
Planned 11 8 1 0 0 0 9
815 172 149 93 83 74 571
Approved 362 74 43 9 0 0 125
Planned 454 98 106 84 83 74 445
423 67 59 61 63 65 315
2,580 663 745 421 166 139 2,134
15FProjectsTotal
CAPEX
Total Phoenix Project
Total Planned CAPEX
12F 13F
Petroleum
Total Approved CAPEX
Port &Tank
16F
Maintenance CAPEX
Phoenix Plus Projects
Non-Phoenix Projects
Grand Total
Real Estate
PetChem
14F
Refinery 23%
Lube 43%
Olefins 9%
Polyolefins -3%
Polyol 0.9%
Aromatics 3%
Polystyrenics 4% Power & UT
10% Port & Tank
1.9%
Land & Others 1.7%
2011
Refinery 21%
Lube 26% Olefins
32%
Polyolefins 5%
Polyol 1%
Aromatics 2%
Polystyrenics 2%
Power & UT 2%
Port & Tank 2%
Land & Others
7%
2016
Refinery 66%
Lube 10%
Olefins 3%
Polyolefins 10%
Polyol 0.5%
Aromatics 4%
Polystyrenics 5%
Power & UT 1.3%
Port & Tank 0.2%
Land & Others 0.3%
2011
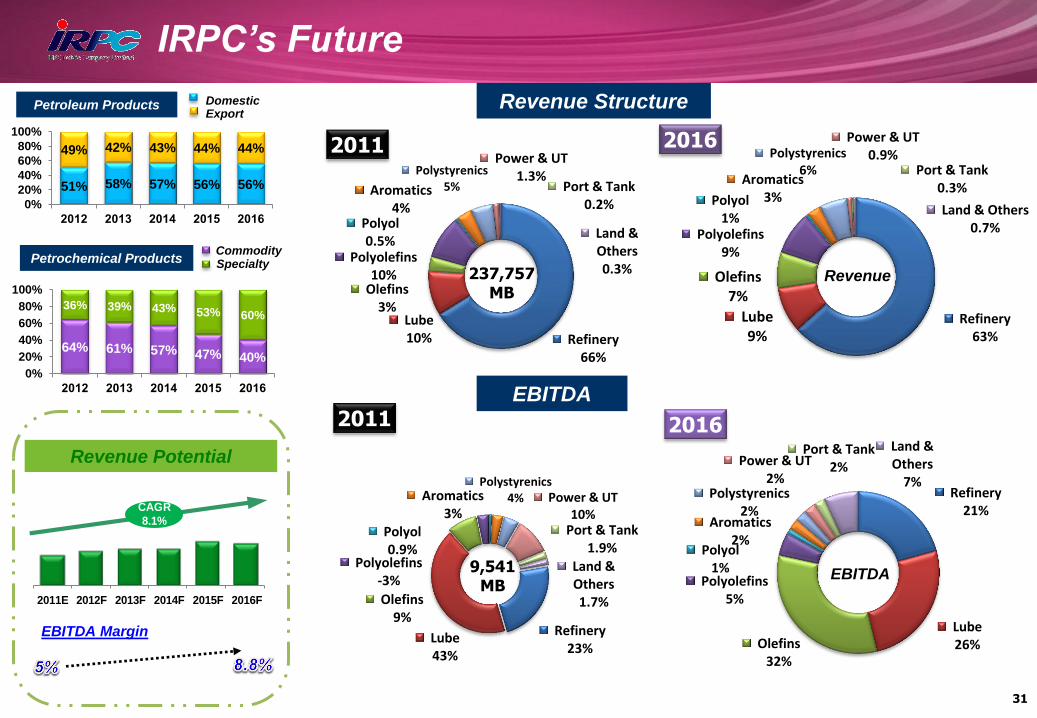
IRPC’s Future
Revenue Structure
Refinery 63%
Lube 9%
Olefins 7%
Polyolefins 9%
Polyol 1%
Aromatics 3%
Polystyrenics 6%
Power & UT 0.9%
Port & Tank 0.3%
Land & Others 0.7%
2016
EBITDA
237,757 MB
9,541 MB
31
2011E 2012F 2013F 2014F 2015F 2016F
CAGR
8.1%
Revenue Potential
EBITDA Margin
Petroleum Products
51% 58% 57% 56% 56%
49% 42% 43% 44% 44%
0%
20%
40%
60%
80%
100%
2012 2013 2014 2015 2016
Domestic Export
Petrochemical Products
64% 61% 57% 47% 40%
36% 39% 43% 53% 60%
0%
20%
40%
60%
80%
100%
2012 2013 2014 2015 2016
Commodity Specialty
Revenue
EBITDA

32
This presentation material has been prepared solely for informational purposes only. IRPC is furnishing it solely for use by prospective investors / analysts in
the proposed event. IRPC makes no representations or warranties as to the accuracy or completeness of such information. By accepting this material each
recipient agrees that IRPC shall not have any liability for any representations (express or implied) contained in, or for any omissions from this presentation.
The information contained herein does not purport to be all-inclusive or to contain all of the Information that may be material to the recipient’s decision. Each
recipient of the information and data contained herein should perform its own independent investigation and analysis of the transaction and the creditworthiness of IRPC . Reference in this Disclaimer to this shall include references to the Appendices (if any) hereto.
Investor Relations Contact : [email protected] Tel. 02-649-7384-8, Fax. 02-649-7379
presentation is available at
www.irpc.co.th Click “Presentations”
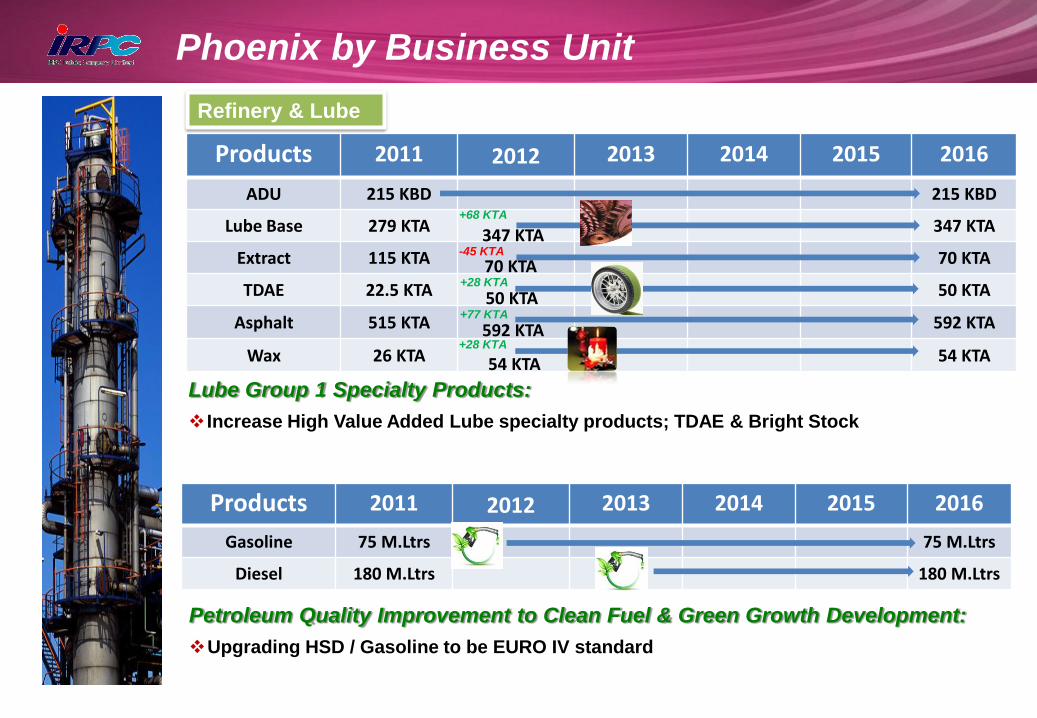
Phoenix by Business Unit
Refinery & Lube
ADU
Lube Base
Asphalt
Products 2011 2012 2013 2014 2015 2016
ADU 215 KBD 215 KBD
Lube Base 279 KTA 347 KTA
Extract 115 KTA 70 KTA
TDAE 22.5 KTA 50 KTA
Asphalt 515 KTA 592 KTA
Wax 26 KTA 54 KTA
Lube Group 1 Specialty Products:
Increase High Value Added Lube specialty products; TDAE & Bright Stock
+28 KTA
+68 KTA
Petroleum Quality Improvement to Clean Fuel & Green Growth Development:
Upgrading HSD / Gasoline to be EURO IV standard
Products 2011 2012 2013 2014 2015 2016
Gasoline 75 M.Ltrs 75 M.Ltrs
Diesel 180 M.Ltrs 180 M.Ltrs
-45 KTA
+77 KTA
347 KTA
70 KTA
50 KTA
592 KTA
54 KTA +28 KTA
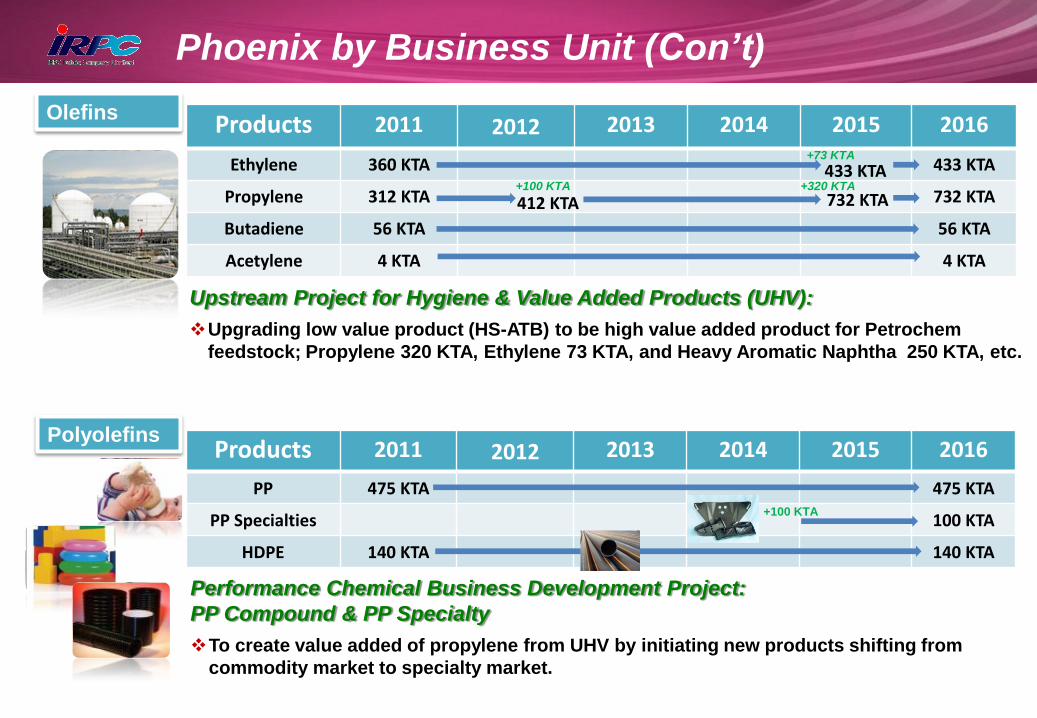
Phoenix by Business Unit (Con’t)
Olefins Products 2011 2012 2013 2014 2015 2016
Ethylene 360 KTA 433 KTA
Propylene 312 KTA 732 KTA
Butadiene 56 KTA 56 KTA
Acetylene 4 KTA 4 KTA
Upstream Project for Hygiene & Value Added Products (UHV):
Upgrading low value product (HS-ATB) to be high value added product for Petrochem
feedstock; Propylene 320 KTA, Ethylene 73 KTA, and Heavy Aromatic Naphtha 250 KTA, etc.
+320 KTA +100 KTA
+73 KTA
412 KTA 732 KTA
433 KTA
Polyolefins Products 2011 2012 2013 2014 2015 2016
PP 475 KTA 475 KTA
PP Specialties 100 KTA
HDPE 140 KTA 140 KTA
+100 KTA
Performance Chemical Business Development Project:
PP Compound & PP Specialty
To create value added of propylene from UHV by initiating new products shifting from
commodity market to specialty market.
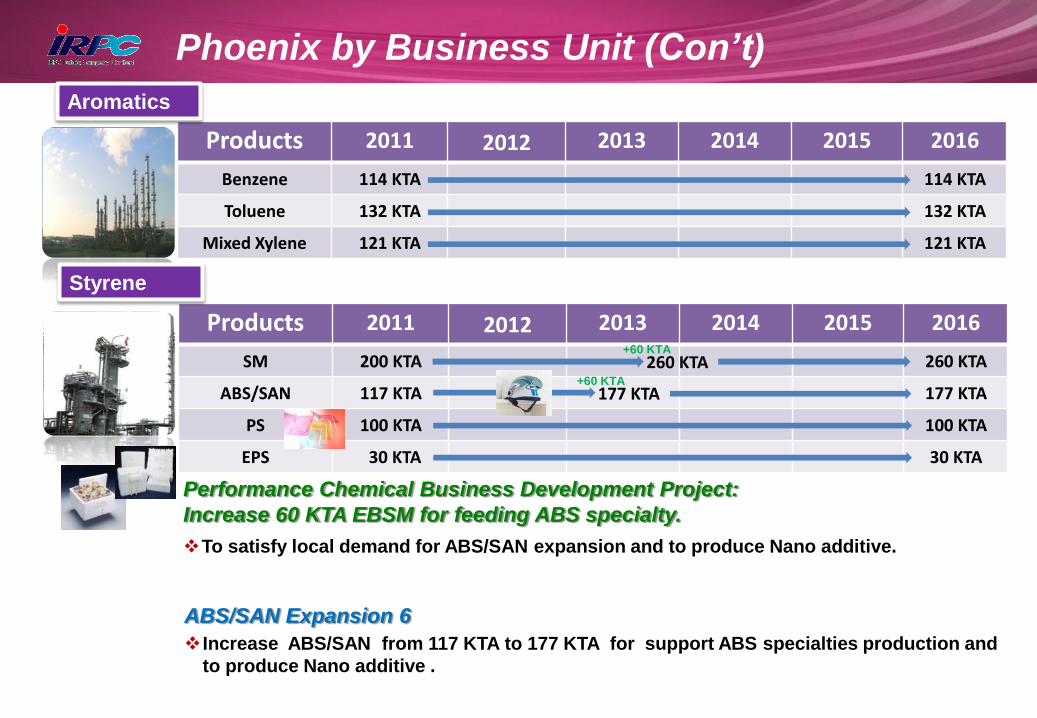
Products 2011 2012 2013 2014 2015 2016
Benzene 114 KTA 114 KTA
Toluene 132 KTA 132 KTA
Mixed Xylene 121 KTA 121 KTA
Products 2011 2012 2013 2014 2015 2016
SM 200 KTA 260 KTA
ABS/SAN 117 KTA 177 KTA
PS 100 KTA 100 KTA
EPS 30 KTA 30 KTA
+60 KTA
Performance Chemical Business Development Project:
Increase 60 KTA EBSM for feeding ABS specialty.
To satisfy local demand for ABS/SAN expansion and to produce Nano additive.
260 KTA
Styrene
Aromatics
Phoenix by Business Unit (Con’t)
+60 KTA 177 KTA
ABS/SAN Expansion 6
Increase ABS/SAN from 117 KTA to 177 KTA for support ABS specialties production and
to produce Nano additive .
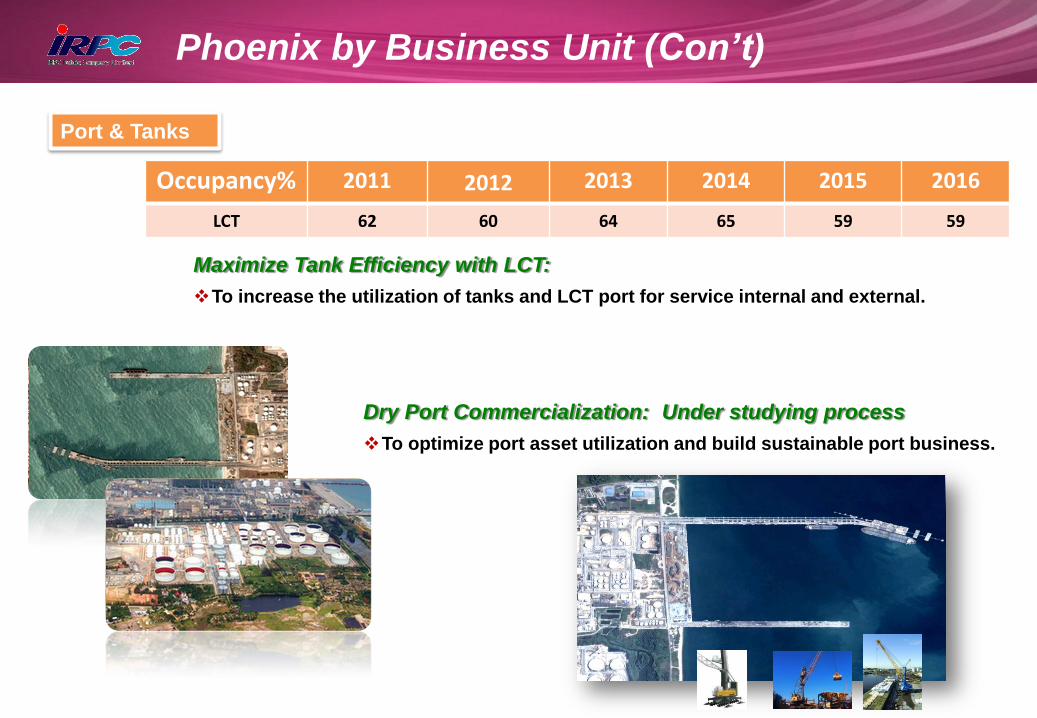
Port & Tanks
Occupancy% 2011 2012 2013 2014 2015 2016
LCT 62 60 64 65 59 59
Maximize Tank Efficiency with LCT:
To increase the utilization of tanks and LCT port for service internal and external.
Phoenix by Business Unit (Con’t)
Dry Port Commercialization: Under studying process
To optimize port asset utilization and build sustainable port business.
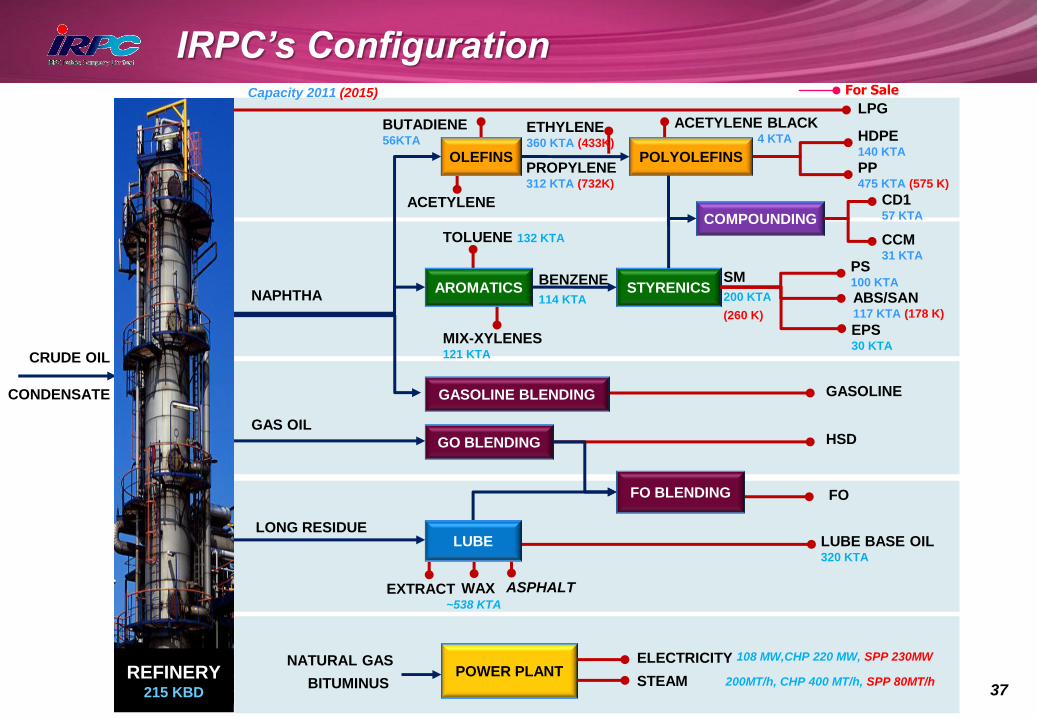
IRPC’s Configuration
37
25%
50%
75%
100%
0%
POWER PLANT NATURAL GAS ELECTRICITY
STEAM
LUBE BASE OIL 320 KTA
EXTRACT WAX
BITUMINUS
LUBE
STYRENICS
TOLUENE 132 KTA
BENZENE
114 KTA
MIX-XYLENES
121 KTA
AROMATICS
PS 100 KTA
ABS/SAN 117 KTA (178 K)
EPS 30 KTA
SM
200 KTA
(260 K)
HDPE 140 KTA
PP 475 KTA (575 K)
BUTADIENE 56KTA
ACETYLENE
ACETYLENE BLACK 4 KTA
OLEFINS PROPYLENE 312 KTA (732K)
ETHYLENE 360 KTA (433K)
POLYOLEFINS
COMPOUNDING
CD1 57 KTA
CCM 31 KTA
CRUDE OIL
CONDENSATE
NAPHTHA
LONG RESIDUE
GAS OIL
GO BLENDING HSD
GASOLINE BLENDING GASOLINE
REFINERY 215 KBD
FO BLENDING FO
LPG
ASPHALT ~538 KTA
108 MW,CHP 220 MW, SPP 230MW
200MT/h, CHP 400 MT/h, SPP 80MT/h
Capacity 2011 (2015) For Sale


![Discrete Mathematics Lecture Notes - National Taiwan …lyuu/dm/2012/20120223.pdf · · 2012-02-25Discrete Mathematics Lecture Notes ... [Harvard] college, there was not a single](https://img.pdfslide.us/doc/110x75/5ab6422e7f8b9a7c5b8d7dac/discrete-mathematics-lecture-notes-national-taiwan-lyuudm2012-mathematics.jpg)